1. Introduction
In order to relieve the global energy crisis and to achieve the sustainable development of agricultural ecological environments, plenty of agricultural biomass residues are widely used as feedstock, forages, fertilizer, and fuel. Knowledge of friction properties is essential in the design and modification of equipment used for harvesting, handling, conveying, feeding, storing and other processes involving agricultural biomass residue [
1], as these properties have a direct impact on operational performance.
The frictional behavior of biomass grinds is described by the following two independent parameters: the coefficient of internal friction and the coefficient of wall friction [
2]. The coefficient of wall friction is the magnitude ratio of the sliding friction force existing between the contact surfaces of two bodies moving relative to one another and the normal pressure acting on the contact surface [
3]. It can be described as the wall friction property of materials. The effects of a material’s moisture content, physical size, normal load, contact surface style, shear rate, and other factors on the coefficient of wall friction have been extensively studied in experimental research. The coefficient of wall friction at different corn straw grind sizes on a galvanized steel surface has been shown to increase significantly with an increase in the moisture content from 7% to 15% and decrease with an increase in the normal pressure from 10 to 200 kPa [
4]. It has been demonstrated that the coefficient of friction of soft red winter wheat on corrugated and smooth galvanized steel surfaces increases with an increase in the shear rate and decreases with an increase in the normal pressure. Larsson [
5] reported that the coefficient of kinematic wall friction of reed canary grass powder from a hammer mill screen size of 4.0 mm is negatively correlated with normal stress at low (from 0.52 to 7.52 kPa) and high (from 23 to 275 MPa) normal stress levels. Kalkan [
6] found that the dynamic coefficient of friction values of wheat cultivars on frictional surfaces of steel and fiberglass increased with an increase in the moisture content, and they observed that the effect of moisture content was greater at higher moisture levels. Ghorbani [
7] reported that the coefficient of friction of alfalfa grind on a polished steel surface slightly increased as the moisture content increased from 8 to 11% (wb) and increased with an increase in the screen size from 2.38 to 4.76 mm at a moisture content of 9.3%.
Straw fiber base film is a completely biodegradable film made from crop straw as the main raw material, which not only has the properties of ordinary plastic film, such as in terms of temperature and moisture protection and the inhibition of weeds, but also can be completely degraded during the crop growth cycle to avoid white pollution. [
8]. The D200 model straw fiber machine adopts a pure physical pretreatment method to achieve green, clean, and efficient production of agricultural straw fiber. [
9]. The friction properties of the straw are an important reference when evaluating the design of the fiber manufacturing machine and its accompanying raw material supply system [
10]. The fiber extraction machine was evaluated through an experimental analysis and required the physical characteristics of a large particle size and a high moisture content (>45%) for the crop straw to be processed [
10,
11]. However, there have been few studies on the friction characteristics of straws with large particle sizes and high moisture content. Almost all studies were performed at a relatively lower material moisture content (3–35%). Related studies about the determinations of the coefficient of sliding friction at high moisture contents are scarce. Furthermore, limited literatures have investigated the concurrent effects of moisture content and normal pressure on the sliding friction. No studies have been conducted on the sliding friction properties of untreated and extrusion-exploded straws.
In summary, studies on the frictional properties of straw exposed to high moisture content conditions and the sliding frictional properties of the straw fiber after squeeze blasting are lacking. The objective of this study was to investigate the sliding friction characteristics of untreated and extrusion-exploded wheat straw and rice straw on mild steel and aluminum surfaces and the factors influencing the friction characteristics.
2. Materials and Methods
2.1. Materials
Two kinds of agricultural biomass straw (wheat and rice straw) were used in the experiments. The raw materials were harvested during the summer of 2019 from Xiangfang farm and sent to the Biomass Materials Laboratory of the Northeast Agricultural University (Changjiang road 600, Xiangfang District, Harbin, China) where all of the experiments were conducted. The experimental design involved determining the coefficient of sliding friction for untreated and extrusion-exploded straws.
2.1.1. Crushing Pretreatment
For the experimental setup for untreated straws, the raw material moisture content, raw material length, and normal pressure were varied. The straw samples were obtained in two batches, one of which was chopped using a 9QR20-60 Straw hammer crusher (Harbin Longmu Machinery Equipment co. LTD, Harbin, China) to investigate the effects of the moisture content and normal pressure on the coefficient of sliding friction. The straw crusher was modified with the moving blades removed in order to alleviate shearing and strengthen the rubbing action. This facilitated the fibrillation of straw fiber in the subsequent extrusion process.
2.1.2. Extrusion Pretreatment
For the experimental setup for extrusion-exploded straw, the factors varied were the raw material moisture content and normal pressure. Extrusion-exploded straw samples were obtained using a single screw extruder (D200 single screw straw-based fiber extruder, engineering college, Northeast Agricultural University, as shown in
Figure 1) [
12], which had an average barrel length to screw diameter ratio (l/d) of 5:1. The extruder consisted of feeding, compression, and exploding zones, corresponding to three different screws. The screw in the compression zone had a compression ratio of 3:1. Each zone was equipped with a temperature control and cooling system connected with a barrel in order to avoid the straw becoming charred due to the high temperature in the extrusion process. Water was supplied as a cooling agent along the length of the barrel. The gap in the die at the end of the exploding section was adjustable to allow the acquisition of fibers with different particle sizes [
13,
14]. The single screw extruder was fitted to a 75-kW adjustable-speed motor, which had a provision to adjust the screw speed from 0 to 200 rpm. The barrel temperature and screw speed were controlled by a controller cabinet connected to the extruder. In the process of extrusion, the exploding phenomenon happened due to a sudden reduction in air pressure when materials were discharged. Once the exploding effect had stabilized, the straw samples were extruded under the conditions of a screw speed of 100 r/min, a temperature of 96 ℃, and a die gap of 1.5 mm. Consequently, the untreated straws were processed to the fiber magnitude level, i.e., the desired extrusion-exploded straws were formed [
15,
16].
2.1.3. Moisture Content
The chopped straws were cleaned manually to remove foreign matters such as dirt, stones, and other impurities. The initial moisture content of straw was determined as per the procedures presented in [
10], according to the recommended national standard (GB/T462-2003,
Paper and board-Determination of moisture content). The weights of the samples were recorded on an analytical balance (accuracy 0.001 g). Then, these samples were dried in a forced air oven (DGG-9070AD electrothermal constant temperature blast air drying oven (Shanghai SenXin Experimental Instrument Co., LTD., Shanghai, China) at 105 ± 2 °C for 24 h. The initial moisture content of straw was calculated as M
i. then, in order to further achieve the desired moisture content level, a certain amount of distilled water predetermined using the following Equation (1) was added to the samples. After thorough mixing, the moistened samples were sealed in polyethylene bags and kept in a refrigerator at 5 °C for 24 h to enable the moisture to be distributed uniformly throughout the sample.
where Q is the mass of water to be added (g);
mi is the initial mass of the sample (g);
Mi is the initial moisture content of the samples (% w.b), and
Mf is the final content of the samples (% w.b).
For all tests, prior to starting the trials, the necessary sample quantities were removed from the refrigerator to allow them to reach equilibrium with the room temperature.
2.2. Methods
The coefficient of sliding friction was determined using a friction measuring apparatus, shown in detail in
Figure 2, according to Equation (2). The test was conducted on mild steel and an aluminum surface.
where
μs is the = coefficient of sliding friction;
Fs is the = force of friction (N);
N is the = normal load (N).
The measuring device is shown in
Figure 2a. The test scene is shown in
Figure 2b. When testing, a sample box with a diameter of 160 mm connected to a load cell was placed on a friction surface and filled with the straws. The straw was placed randomly. The desired load was applied to the base plate at top of the straw samples and kept there for 30 s. The friction surface was horizontally moved by a driving unit at a constant velocity of 24 mm/min. It should be noticed that the sample box could not contact the surface so as not to affect the accuracy of the measurement data. The friction force was sensed by a load cell connected to the sample box, and the data were recorded on a PC through a data acquisition system. Those data that changed steadily in a certain period were accepted, and data that fluctuated greatly were excluded. For each replication, the samples were emptied and refilled with a different sample. For the friction tests, were conducted in three replicates were used.
2.3. Experimental Design
The experimental design involved determining the coefficient of sliding friction of untreated and extrusion-exploded straw. For the determination of the sliding friction coefficient of untreated straw, we used a double-factor factorial design. Regarding the double-factor factorial design, the moisture content at five levels (35, 45, 55, 65, and 75% w.b) and the normal pressure at five levels (2, 4, 6, 8, and 10 kPa) were used as the independent variables, and the coefficients of sliding friction of wheat and rice straw acquired by machine on mild steel and an aluminum surface were the dependent variables. As per the single-factor factorial design, the straw samples chopped by hand were selected. The length at five levels (30, 60, 90, 120, and 150 mm) was the independent variable and the coefficients of sliding friction of untreated wheat and rice straw on mild steel and an aluminum surface were the dependent variables. For the determination of the coefficient of sliding friction of extruded exploded straw fibers, a double-factor factorial design, similar to that used with untreated straw, was employed, where the moisture content at five levels (35, 45, 55, 65, and 75% w.b) and the normal pressure at five levels (2, 4, 6, 8, and 10 kPa) were the independent variables, and the coefficients of sliding friction of wheat and rice straw on mild steel and an aluminum surface were the dependent variables. All the results represent the average of three replicates.
2.4. Statistical Analysis
To study the changes in the experimental data measured in the friction tests, the statistical description parameters, namely, the mean and standard deviation were used. The Analysis of Variance (ANOVA) method was applied at the 0.01 level of significance to investigate the influences of the applied factors on the dependent variables using SPSS (version 23). Additionally, the Tukey multiple comparison and means comparison were used to compare the difference between any two treatment means at the 0.01 level of significance. The fitting equations were developed for the coefficient of sliding friction with length being the independent variable using the least squares regression method. All the results are presented in table form and plotted in figures.
3. Results
The factors and levels used in the coefficient of sliding friction characteristic tests are listed in
Table 1. The coefficients of sliding friction of the untreated and extrusion-exploded wheat straw and rice straw against mild steel surface and an aluminum surface at different moisture contents and normal pressure values are presented in
Table 2 and
Table 3.
The ANOVA results for the coefficient of sliding friction versus the moisture content and normal pressure are tabulated in
Table 4. As expressed in the table, the moisture content, normal pressure, and the moisture content x normal pressure interaction were shown to have statistically significant effects on the coefficient of sliding friction at
p < 0.01. Significant effects were observed for untreated and extrusion-exploded wheat straw and rice straw on both mild steel and aluminum surfaces.
Our results reveal that the coefficient of sliding friction of untreated wheat straw against mild steel and aluminum surfaces ranged from 0.537 to 0.688 and from 0.569 to 0.702, respectively, in the moisture content range from 35 to 75% (w.b) along with a normal pressure range from 2 to 10 kPa. In contrast, the coefficient of sliding friction of untreated rice straw against mild steel and aluminum surfaces varied between 0.419 and 0.577 and between 0.510 and 0.677, respectively, under the same conditions.
With respect to extrusion-exploded wheat straw and rice straw, it was stated that the coefficient of sliding friction on mild steel and aluminum surfaces varied from 0.685 to 0.788 and from 0.610 to 0.850. Respectively, with a concurrent increase in the moisture content from 35 to 75% (w.b) and normal pressure from 2 to 10 kPa. As a comparison, the coefficient of sliding friction of extrusion-exploded rice straw on mild steel and aluminum surfaces varied from 0.522 to 0.761 and from 0.569 to 0.827, respectively, in the same conditions.
As per
Figure 3 and
Table 2, for extrusion-exploded straw, the phenomenon whereby the coefficient of sliding friction of wheat straw was greater than that of rice straw was observed. The difference was significant on the surface of mild steel but not on aluminum. Furthermore, once again, it was noted that the coefficient of sliding friction of samples was greater on aluminum compared with mild steel; however, the difference was not significant.
Table 5 presents the ANOVA results for the coefficient of sliding friction of untreated straws regarding the length of mild steel and aluminum. The results indicate that the coefficient of sliding friction length had a statistically significant difference at
p < 0.01 at various lengths.
The coefficient of sliding friction of untreated straw on mild steel and aluminum surfaces versus the length at a moisture content of 75% (w.b) and normal pressure of 4 kPa was exhibited in
Table 6 and
Figure 4.
According to the results presented, previously, the coefficient of sliding friction of both test samples on the aluminum surface was markedly higher than on mild steel. The results of the means comparison showed that the difference was significant (p < 0.01) in the length range from 30 to 150 mm for both varieties of samples. Furthermore, the coefficient of sliding friction of untreated wheat straw was greater than that of rice straw on both contact surfaces. A significant difference (p < 0.01) was noted by referring to the comparison of means with only two exceptions.
4. Discussion
4.1. The Effects of the Normal Pressure and Moisture Content on the Coefficient of Sliding Friction
A comparison of the means of the coefficient of sliding friction between untreated and extrusion-exploded straw, wheat straw and rice straw, and mild steel and aluminum surfaces is presented in
Figure 3 and
Table 7. It is demonstrated that the coefficient of sliding friction is greater for wheat straw as compared to rice straw, and the difference is significant at the 0.01 probability level. In addition, the comparison between the coefficient of sliding friction of samples on the aluminum and mild steel surfaces indicated that the former value is higher than the latter with no exceptions, and a significant difference was found at a 99% confidence interval. This could be attributed to the difference in material surface roughness for mild steel and aluminum surfaces, thus leading to a difference in sliding friction. For extrusion-exploded straw, the difference was less apparent.
Figure 5a,b shows the effects of the moisture content and normal pressure on the coefficient of sliding friction of untreated straw. At any level of moisture content, the coefficient of sliding friction was shown to first decrease with an increase in normal pressure from 2 to 4 kPa and then increase sharply when the normal pressure increased from 4 to 6 kPa before finally decreasing gradually as the normal pressure continued to increase from 6 to 10 kPa. The highest coefficient of sliding friction value was found at a normal pressure of 6 kPa, and the lowest value was found at a normal pressure of 2 or 4 kPa. It is commonly found that an increase in the normal pressure leads to a decrease in the wall friction coefficient [
17,
18]. The data points recorded in this study showed a different trend compared with those presented in the literature mentioned above. This may be related to the contact surface moving too fast.
As shown in
Figure 5, the moisture content had different effects on the coefficient of sliding friction based on the various sample varieties, contact surfaces, and normal pressure levels. Generally, the coefficient of sliding friction fluctuated up and down with moisture contents ranging from 35 to 75%. Unlike the specific trends observed by other researchers [
19,
20], no specific relationship was observed between the coefficient of sliding friction of untreated straw and the moisture content. Probably the contact surface was moving too fast during the test, causing the slip-stick phenomenon to disappear and preventing a specific pattern from being observed. Xueli Chen [
21] suggested that the frictional properties of material systems are affected in the following two ways: as the moisture content increases, the friction either decreases because the water acts as a lubricant [
22] or increases due to the force of adhesion stemming from the inter-straw capillary force [
23]. These two effects coexist and interact, leading to a fluctuation in the coefficient of friction.
Figure 6 presents the contributions of factors to the coefficient of sliding friction, which were calculated in terms of the sum of the squares of the variant. For untreated straw, it could be inferred that the normal pressure plays a predominant role in influencing variation in the coefficient of sliding friction [
24]; however, the moisture content and the moisture content x normal pressure interaction showed extremely weak effects [
25].
As seen in
Figure 3, the coefficient of sliding friction of extrusion-exploded straw was significantly higher than that of untreated straw for both wheat and rice straw on both mild steel and aluminum surfaces. The different letters in
Table 7 show significant variation. This phenomenon may be due to the fact that the fibrous external surface of extrusion-exploded straw was rougher compared to that of untreated straw. Additionally, it is possible that, for extrusion-exploded straw, the amount of straw forced to contact the surface increased; in other words, closer contact existed when a normal load was applied. Consequently, this increased the contacting surface area, and then the sliding friction force increased. This could be due to the fact that the structure of straw became looser and more flexible as a result of the removal of partial lignin and hemicellulose, reductions in crystallinity and polymerization, and an increase in porosity through the extrusion process [
26].
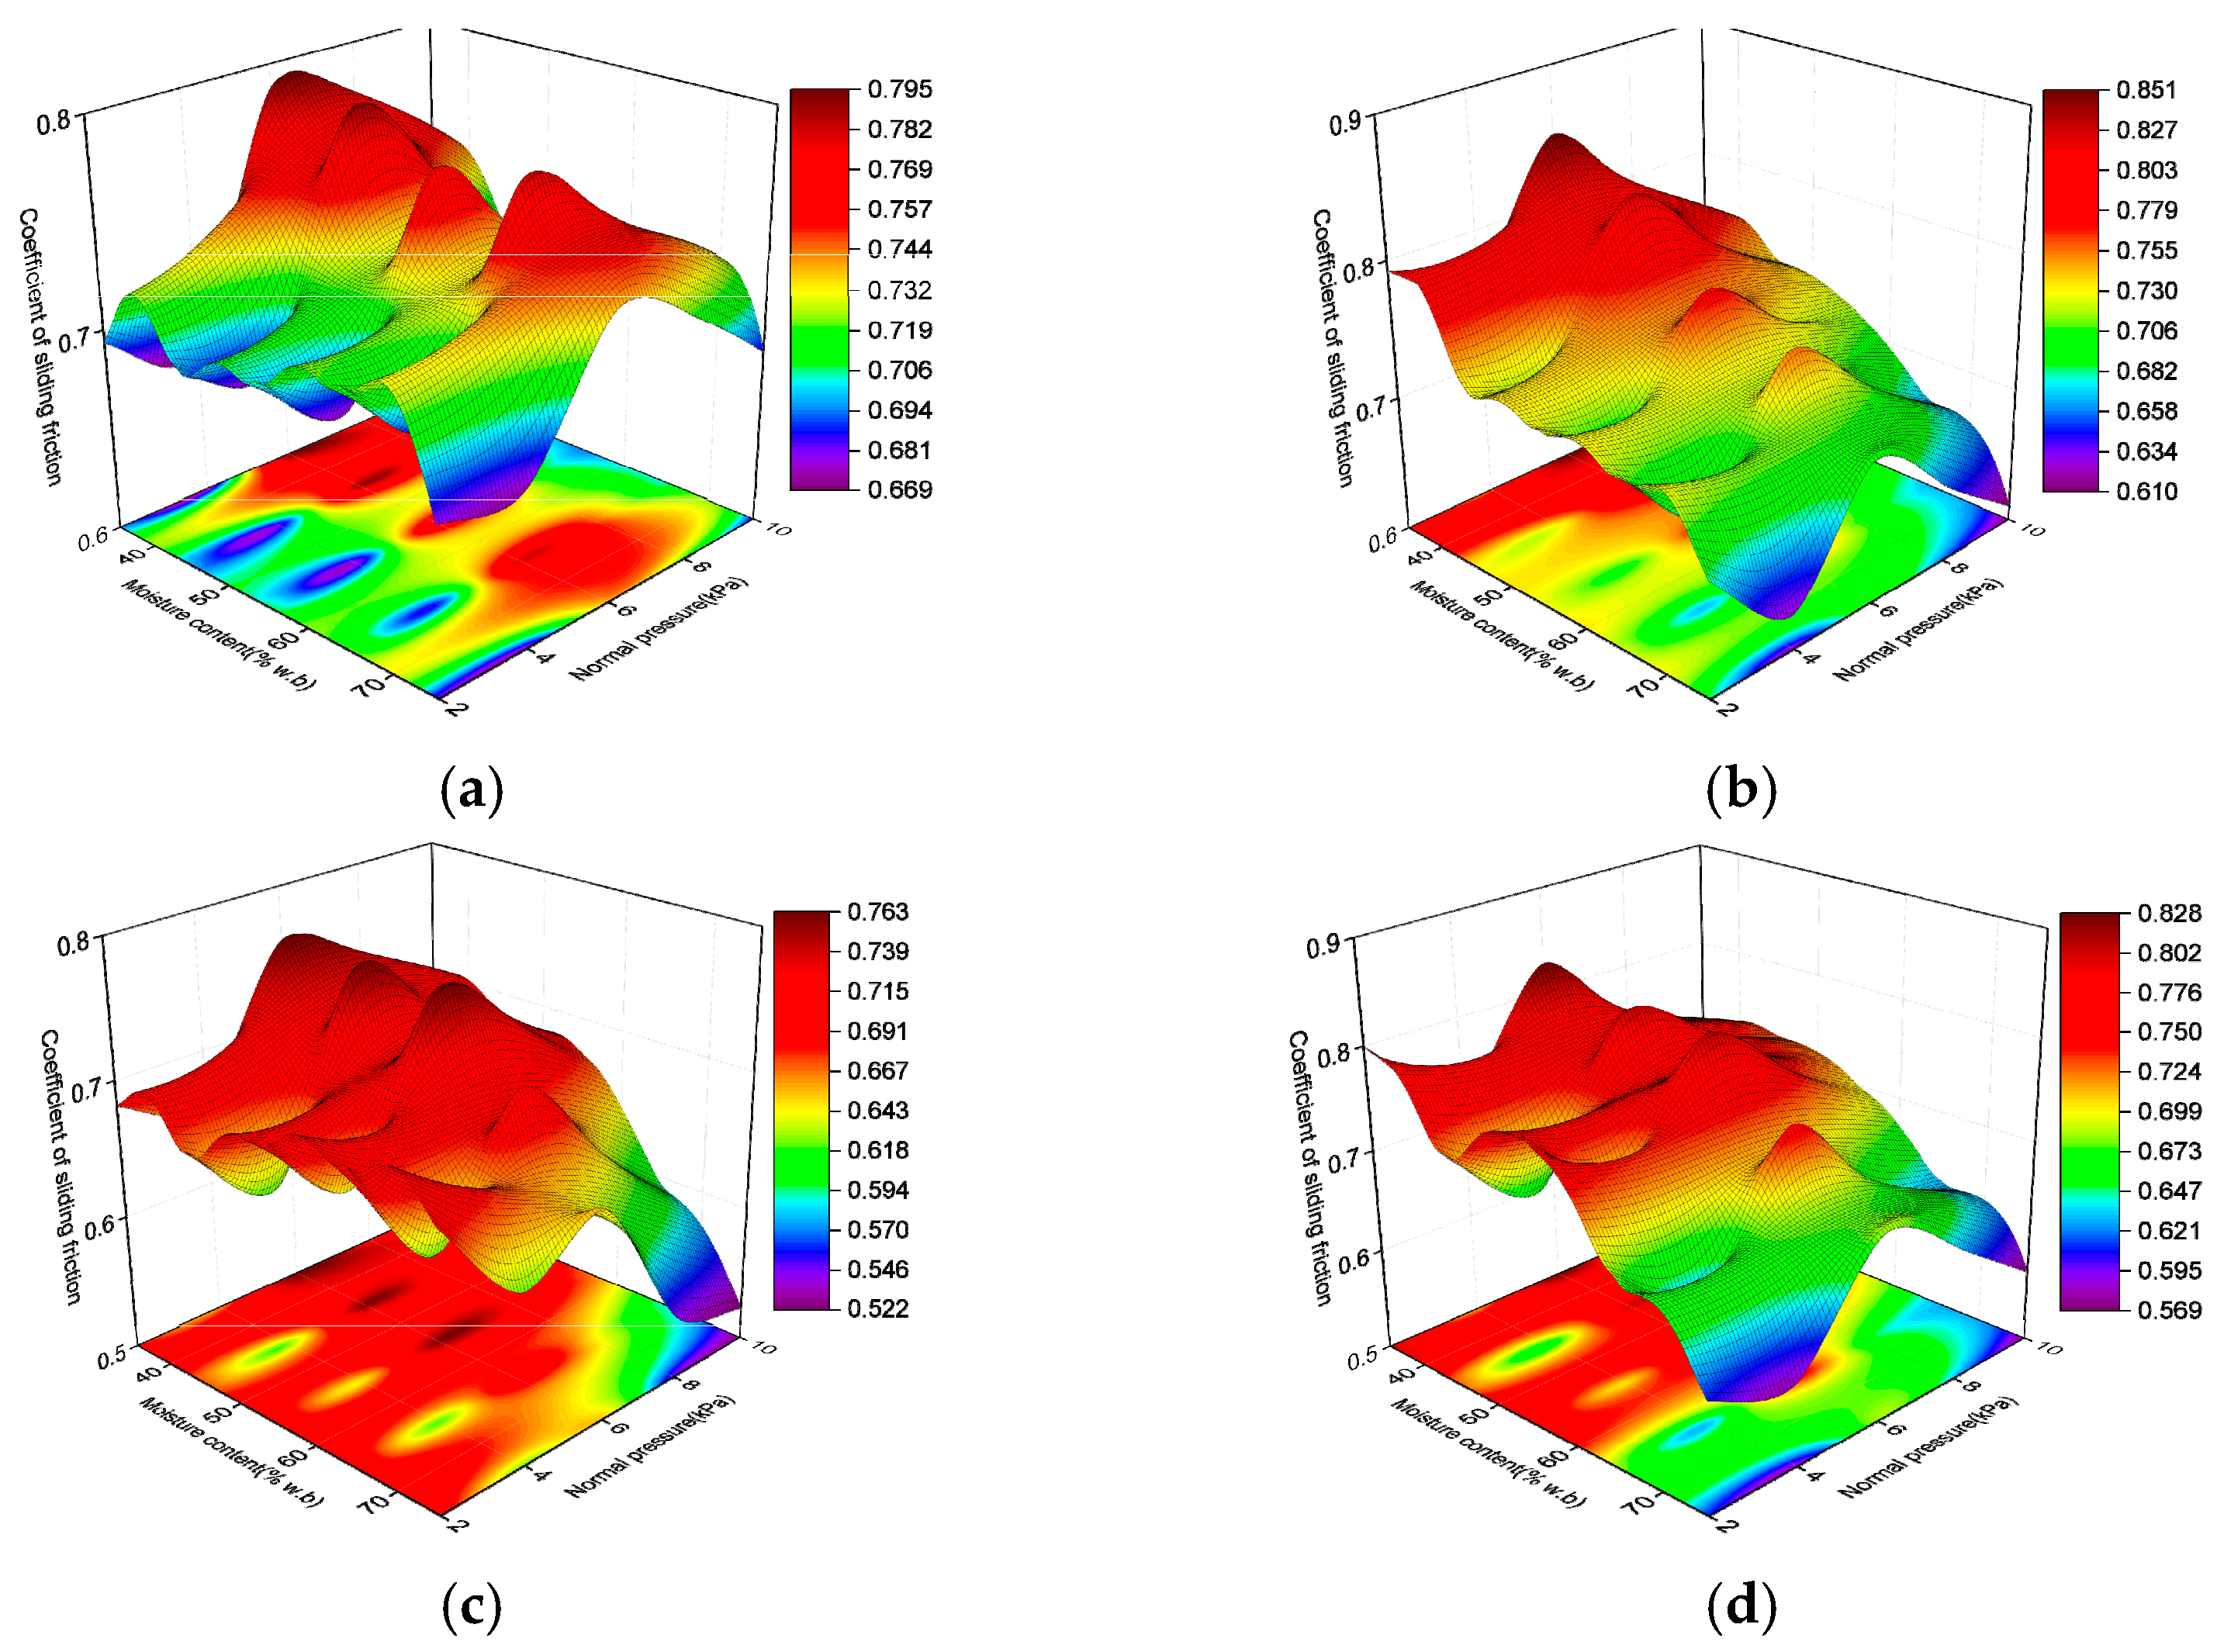
Figure 7c,d shows that the effect of the normal pressure on the coefficient of sliding friction of extrusion-exploded straw is analogous to that of untreated straw; that is, the coefficient of sliding friction decreased initially and then increased dramatically to reach a peak value, before finally decreasing with an increase in normal pressure of 2–10 kPa. The minimum coefficient of sliding friction value occurred at a normal pressure of 4 or 10 kPa.
The effect of the moisture content on the coefficient of sliding friction varied with different sample varieties, contact surfaces, and normal pressure levels. As shown in
Figure 6, compared with untreated straw, relatively large fluctuations existed for the coefficient of sliding friction of extrusion-exploded straw, and no concrete relationship was observed between the coefficient of sliding friction and moisture content. At all levels of normal pressure, the lowest coefficient of sliding friction was observed at a moisture content of 75%.
As shown in
Figure 6b, the moisture content had a more striking effect on the coefficient of sliding friction for extrusion-exploded straw compared with untreated straw, which even surpassed that of normal pressure. This indicates that the sliding friction property of extrusion-exploded straw is more susceptible to the effects of the moisture content. Little effect was observed for the moisture content x normal pressure interaction. This may be related to the breaking of straws. When the pressure gradually increases, the straw is broken, and the contact surface of mild steel becomes larger and rougher, and the friction coefficient increases. When the pressure increases to the critical value, the contact surface tends to be flat, and the friction coefficient decreases.
4.2. The Effect of Length on the Coefficient of Sliding Friction of Untreated Straw
As shown in
Figure 4, for the coefficient of sliding friction of untreated wheat straw, a predominantly linear upward trend was noted from a minimum value of 0.457 to a maximum value of 0.510 on mild steel and from 0.548 to 0.590 on aluminum when the length was in the ascending range from 30 to 150 mm. The multiple comparison results indicated that the difference in the coefficient of sliding friction was significant between two adjacent length intervals, with a few exceptions.
By comparison, at an aggregate level, the coefficient of sliding friction was more susceptible to the effect of length for rice straw than for wheat straw. The coefficient of sliding friction of untreated rice straw increased initially and then decreased for both contact surfaces, ranging from 0.354 to 0.454 and from 0.383 to 0.569, respectively, on the surfaces of mild steel and aluminum in the length range from 30 to 150 mm. The critical points of length were 120 and 90 mm for mild steel and aluminum, respectively. The multiple comparison results indicate that the mean coefficient of sliding friction differed significantly in almost all intervals of length. This may be attributed to the fact that the original surfaces of the straw were smooth, but the fracture surfaces were rough. As the length decreased, the proportion of the rough surface increased, and the coefficient of sliding friction of the straw increased [
26]. Ling et al. (1997) also reported that both the static and sliding coefficients of friction decreased with an increase in ash particle size.
As expressed in
Table 8, the relationship between length and the coefficient of sliding friction can be depicted by a one-variable linear regression equation and a quadratic polynomial equation using the least-squares regression method for untreated wheat straw and rice straw, respectively. This can provide the basis for the design of the forced feeding device.
5. Conclusions
These results of this study show that the coefficient of sliding friction of untreated wheat straw against mild steel and aluminum surfaces ranged from 0.537 to 0.688 and from 0.569 to 0.702, respectively, in the moisture content range from 35 to 75% (w.b) under a normal pressure range from 2 to 10 kPa. In contrast, the coefficient of untreated rice straw against mild steel and aluminum surfaces was found to vary between 0.419 and 0.577 and between 0.510 and 0.677, respectively. The coefficients of sliding friction of extrusion-exploded wheat straw on mild steel and the surfaces of aluminum ranged from 0.685 to 0.788 and from 0.610 to 0.850, respectively. The coefficients of rice straw on mild steel and aluminum surfaces ranged from 0.522 to 0.761 and from 0.569 to 0.827, respectively.
The coefficient of sliding friction was markedly greater for wheat straw as compared with rice straw on the two tested contact surfaces; The coefficient of sliding friction of both straw samples on the aluminum surface was notably higher than the values on mild steel. A significantly higher value was found for the coefficient of sliding friction of extrusion-exploded straw compared with that of untreated straw on both surfaces.
The moisture content, normal pressure, and the moisture content x normal pressure interaction had statistically significant effects on the coefficient of sliding friction at (p < 0.01). Significant effects were observed for untreated and extrusion-exploded wheat straw and rice straw on both mild steel and aluminum surfaces. At any level of moisture content, the coefficient of sliding friction first decreased and then increased sharply before finally decreasing gradually as the normal pressure increased from 2 to 10 kPa. The maximum coefficient of sliding friction was observed at a normal pressure of 6 kPa.
When the length increased from 30 to 150 mm, a slightly linear upward trend was observed for the coefficient of sliding friction of wheat straw, and the coefficient of sliding friction of rice straw initially increased and then decreased.
The normal pressure, straw moisture content, and straw length all affect the friction coefficient of straw on different metal surfaces. Different moisture and normal pressure values affect the advantages and disadvantages of fiber materials produced by a D200 single-screw straw-based fiber extruder. The structural parameters of the feeding device are determined by the friction characteristic interval of the straw so as to achieve a continuous, stable, and uniform conveying effect. In the process of rice and wheat harvesting, different climatic conditions lead to different moisture contents and different compression ratios of straw. This means that the harvesting machine and the packing machine correspond to different parameters. When straw is used as biomass energy, it is fused and compressed to reach a certain density. At this time, the friction between straw and metal material is also an important parameter. This study provides a reference for the optimal design of the D200 single-screw straw-based fiber extruder and its supporting raw material supply system and provides a basis for the wear prediction and service life evaluation of harvesting machinery, packing machinery, and straw treatment equipment. The results provide a theoretical reference for the optimal design of agricultural machinery.
This study was carried out under a specific temperature and straw length. The experiments were also conducted on representative mild steel and aluminum surfaces, and the frictional properties of straw on rubber and other material surfaces can be explored in future studies. It could also be interesting to study the coefficient of friction of the straw at different speeds.
Author Contributions
Conceptualization, X.W. and C.Z.; methodology, X.W. and C.Z.; software, X.W., Z.J., and C.G.; writing-original draft preparation, X.W; writing-review and editing, X.W. and D.J.; project administration, L.L. and H.C. All authors have read and agreed to the published version of the manuscript.
Funding
This research was funded by the Natural Science Foundation Youth Fund of China (Grant No. 31701311) and Heilongjiang Engineering and Technology Major Project of Talent Cultivation (Grant No. 2020ZX17B01).
Institutional Review Board Statement
Not applicable.
Informed Consent Statement
Not applicable.
Data Availability Statement
The data presented in this study are available on request from the corresponding author.
Acknowledgments
Thanks to the “Natural Science Foundation Youth Fund of China” for the financing of this research.
Conflicts of Interest
The authors declare no conflict of interest.
References
- Afzalinia, S.; Roberge, M. Physical and mechanical properties of selected forage materials. Can. Biosyst. Eng. 2007, 49, 23. [Google Scholar]
- Adapa, P.; Tabil, L.; Schoenau, G. Physical and frictional properties of non-treated and steam exploded barley, canola, oat and wheat straw grinds. Powder Technol. 2010, 201, 230–241. [Google Scholar] [CrossRef]
- Ibrahim, M. Determination of dynamic coefficient of friction for some materials for feed pellet under different values of pressure and temperature. Misr J. Agric. Eng. 2008, 25, 1389–1409. [Google Scholar] [CrossRef]
- Molenda, M.; Thompson, S.A.; Ross, I.J. Friction of wheat on corrugated and smooth galvanized steel surfaces. J. Agric. Eng. Res. 2000, 77, 209–219. [Google Scholar] [CrossRef]
- Larsson, S.H. Kinematic wall friction properties of reed canary grass powder at high and low normal stresses. Powder Technol. 2010, 198, 108–113. [Google Scholar] [CrossRef]
- Kalkan, F.; Kara, M. Handling, frictional and technological properties of wheat as affected by moisture content and cultivar. Powder Technol. 2011, 213, 116–122. [Google Scholar] [CrossRef]
- Ghorbani, Z.; Hemmat, A.; Masoumi, A.A. Physical and Mechanical Properties of Alfalfa Grind as Affected by Particle Size and Moisture Content. J. Agric. Sci. Technol. 2012, 14, 65–76. [Google Scholar]
- Chen, H.; Chen, S.; Liu, S. Optimization of manufacturing parameters for sterilizing functional straw fiber mulch. Nongye Gongcheng Xuebao/Trans. Chin. Soc. Agric. Eng. 2019, 35, 306–314. [Google Scholar]
- Liu, H.; Chen, H.; Hou, L. Optimal Design and Experiment for Raw Material Supply System of D200 Straw Fiber Extruder. Nongye Jixie Xuebao/Trans. Chin. Soc. Agric. Mach. 2017, 48, 92–98. [Google Scholar]
- Zhang, Y.; Xing, Z.; Zong, H. Optimization of pulping process parameters for preparing wheat straw fiber mulch material. Nongye Gongcheng Xuebao/Trans. Chin. Soc. Agric. Eng. 2020, 36, 248–253. [Google Scholar]
- Han, Y.; Chen, H.; Liu, L. Optimization of technical parameters for preparing fiber from rice straw. Nongye Gongcheng Xuebao/Trans. Chin. Soc. Agric. Eng. 2020, 36, 248–253. [Google Scholar]
- Ju, D. Research on Feeding Device Design and Coupling Technology of Straw Fiber Preparation Machine System for Straw Fiber-based Mulching Film Preparation; Northeast Agricultural University: Harbin, China, 2021. [Google Scholar]
- Chen, H.; Shang, H.; He, Y. Optimization of process parameters for extrusion explosion wheat straw fiber based mulch. J. Northeast. Agric. Univ. 2021, 52, 71–81+96. [Google Scholar]
- Ming, X.; Chen, H.; Wei, Z. Optimization of technical parameters for making light-basis-weight and environment-friendly rice straw fiber film. Nongye Gongcheng Xuebao/Trans. Chin. Soc. Agric. Eng. 2019, 35, 259–266. [Google Scholar]
- Min, S. Key Technology Research on the Raw Material Supply and Extrusion System of D200 Wheat Straw Fiber Extruder; Northeast Agricultural University: Harbin, China, 2019. [Google Scholar]
- Liu, H. Research on the Key Technology of Design and Optimization for Straw Fiber Pilot Production Platform; Northeast Agricultural University: Harbin, China, 2017. [Google Scholar]
- Shafaei, S.M.; Kamgar, S. A comprehensive investigation on static and dynamic friction coefficients of wheat grain with the adoption of statistical analysis. J. Adv. Res. 2017, 8, 351–361. [Google Scholar] [CrossRef] [PubMed]
- Konak, M.; Carman, K.; Aydin, C. PH—Postharvest Technology: Physical properties of chick pea seeds. Biosyst. Eng. 2002, 82, 73–78. [Google Scholar] [CrossRef]
- Chen, X.; Xu, Y.; Lu, H.; Guo, X. Effect of the moisture content of straw on the internal friction angle of a granular biomass-coal system. Fuel 2018, 215, 266–271. [Google Scholar] [CrossRef]
- Podczeck, F.; Newton, J.M.; James, M.B. The influence of chemical structure on the friction properties between particles and compacted powder surfaces. J. Mater. Sci. 1996, 31, 2213–2219. [Google Scholar] [CrossRef]
- Podczeck, F.; Newton, J.M.; James, M.B. Variations in the adhesion force between a drug and carrier particles as a result of changes in the relative humidity of the air. Int. J. Pharm. 1997, 149, 151–160. [Google Scholar] [CrossRef]
- He, X.; Lv, Y.; Wang, W. Effects of moisture content on physical and mechanical properties of Cyperus esculentus. J. Chin. Agric. Mech. 2022, 43, 80–85. [Google Scholar] [CrossRef]
- Chen, S.; Ding, H.; Tang, Z.; Hao, S.; Zhao, Y. Influence of rice straw forming factors on ring die wear and improved wear prediction model during briquetting. Biosyst. Eng. 2022, 214, 122–137. [Google Scholar] [CrossRef]
- Emami, S.; Tabil, L.G. Friction and compression characteristics of chickpea flour and components. Powder Technol. 2007, 175, 14–21. [Google Scholar] [CrossRef]
- Sologubik, C.A.; Campanone, L.A.; Pagano, A.M. Effect of moisture content on some physical properties of barley. Ind. Crops Prod. 2013, 43, 762–767. [Google Scholar] [CrossRef]
- Adapa, P.; Tabil, L.; Schoenau, G. Grinding performance and physical properties of non-treated and steam exploded barley, canola, oat and wheat straw. Biomass Bioenergy 2010, 35, 549–561. [Google Scholar] [CrossRef]
Figure 1.
D200 single screw straw-based fiber extruder ((a): schematic diagram; (b): physical drawing).
Figure 1.
D200 single screw straw-based fiber extruder ((a): schematic diagram; (b): physical drawing).
Figure 2.
Schematic of the sliding friction test apparatus and test scene diagram ((a): schematic diagram of device; (b): test scene diagram).
Figure 2.
Schematic of the sliding friction test apparatus and test scene diagram ((a): schematic diagram of device; (b): test scene diagram).
Figure 3.
Comparison of the means of coefficients of the sliding friction between untreated and extrusion-exploded straw, wheat straw and rice straw, and mild steel and aluminum surfaces.
Figure 3.
Comparison of the means of coefficients of the sliding friction between untreated and extrusion-exploded straw, wheat straw and rice straw, and mild steel and aluminum surfaces.
Figure 4.
Effect of length on the coefficient of sliding friction of untreated wheat straw and rice straw at a moisture content of 75% (w.b) and normal pressure of 4 kPa ((a): wheat straw; (b): rice straw).
Figure 4.
Effect of length on the coefficient of sliding friction of untreated wheat straw and rice straw at a moisture content of 75% (w.b) and normal pressure of 4 kPa ((a): wheat straw; (b): rice straw).
Figure 5.
Effects of the moisture content and normal pressure on the coefficient of sliding friction of untreated straw ((a): untreated wheat straw on mild steel; (b): untreated wheat straw on aluminum; (c): untreated rice straw on mild steel; (d): untreated rice straw on aluminum).
Figure 5.
Effects of the moisture content and normal pressure on the coefficient of sliding friction of untreated straw ((a): untreated wheat straw on mild steel; (b): untreated wheat straw on aluminum; (c): untreated rice straw on mild steel; (d): untreated rice straw on aluminum).
Figure 6.
Contribution of factors to coefficient of sliding friction ((a): untreated straw; (b): extrusion-exploded straw).
Figure 6.
Contribution of factors to coefficient of sliding friction ((a): untreated straw; (b): extrusion-exploded straw).
Figure 7.
Effects of the moisture content and normal pressure on the coefficient of sliding friction of extrusion-exploded straw ((a): extrusion-exploded wheat straw on mild steel; (b): extrusion-exploded wheat straw on aluminum; (c): extrusion-exploded rice straw on mild steel; (d): extrusion-exploded rice straw on aluminum).
Table 1.
The factors and levels of coefficient used in the sliding friction characteristic test.
Table 1.
The factors and levels of coefficient used in the sliding friction characteristic test.
| Level | Straw Variety | Contact Surface Material | Moisture Content (%) | Normal Pressure (kPa) | Length (mm) |
|---|
| 1 | Untreated wheat straw | Mild steel | 35 | 2 | 30 |
| 2 | Untreated rice straw | Aluminum | 45 | 4 | 60 |
| 3 | Extrusion-exploded wheat straw | | 55 | 6 | 90 |
| 4 | Extrusion-exploded rice straw | | 65 | 8 | 120 |
| 5 | | | 75 | 10 | 150 |
Table 2.
Coefficient of sliding friction of wheat straw on mild steel and an aluminum surface with different levels of moisture content and normal pressure levels.
Table 2.
Coefficient of sliding friction of wheat straw on mild steel and an aluminum surface with different levels of moisture content and normal pressure levels.
| Wheat Straw | Moisture Content (%) | Contact Surface |
|---|
| Mild Steel | Aluminum |
|---|
| Normal Pressure (kPa) | Normal Pressure (kPa) |
|---|
| 2 | 4 | 6 | 8 | 10 | 2 | 4 | 6 | 8 | 10 |
|---|
| Untreated | 35 | 0.560 a
0.002 b | ac
A | 0.563
0.002 | a
C | 0.688 0.001 | d
D | 0.643
0.001 | c
C | 0.615 0.001 | b
B | 0.651 0.002 | c
B | 0.612 0.002 | a
B | 0.702 0.002 | e
C | 0.660 0.001 | d
AB | 0.635 0.001 | b
C |
| 45 | 0.569 0.003 | b
AB | 0.560
0.001 | a
C | 0.658 0.001 | e
C | 0.641
0.001 | d
C | 0.616 0.000 | c
B | 0.595 0.002 | a
A | 0.606 0.002 | b
B | 0.673 0.001 | e
A | 0.661
0.001 | d
B | 0.636 0.000 | c
C |
| 55 | 0.558 0.003 | b
A | 0.537
0.002 | a
A | 0.633 0.001 | e
A | 0.613 0.001 | d
A | 0.596 0.001 | c
A | 0.650 0.003 | b
B | 0.612 0.003 | a
B | 0.685 0.001 | d
B | 0.667 0.001 | c
C | 0.615 0.001 | a
AB |
| 65 | 0.581 0.003 | b
B | 0.554
0.002 | a
B | 0.644 0.001 | d
B | 0.620 0.001 | c
B | 0.615 0.001 | c
B | 0.600 0.003 | b
A | 0.569 0.002 | a
A | 0.686 0.001 | e
B | 0.673 0.002 | d
D | 0.616 0.000 | c
B |
| 75 | 0.562 0.003 | a
A | 0.562
0.002 | a
C | 0.635 0.001 | d
A | 0.611 0.001 | c
A | 0.598 0.001 | b
A | 0.601 0.004 | a
A | 0.606 0.001 | ab
B | 0.681 0.001 | d
B | 0.655 0.001 | c
A | 0.612 0.001 | b
A |
| Extrusion-exploded | 35 | 0.694 0.002 | b
B | 0.674
0.001 | a
A | 0.788 0.001 | e
D | 0.759 0.001 | d
D | 0.718 0.001 | c
D | 0.792 0.003 | d
C | 0.760 0.002 | b
E | 0.850 0.001 | e
E | 0.770 0.001 | c
D | 0.728 0.001 | a
D |
| 45 | 0.697 0.002 | b
B | 0.681
0.001 | a
B | 0.788 0.001 | d
D | 0.749 0.001 | c
C | 0.701 0.001 | b
C | 0.733 0.002 | b
B | 0.728 0.001 | a
D | 0.821 0.001 | d
D | 0.771 0.000 | c
D | 0.734 0.001 | b
E |
| 55 | 0.708 0.003 | c
C | 0.677
0.002 | a
AB | 0.773 0.001 | e
B | 0.725 0.001 | d
B | 0.694 0.002 | b
B | 0.728 0.002 | c
B | 0.704 0.002 | a
C | 0.775 0.002 | d
C | 0.730 0.001 | c
C | 0.717 0.001 | b
C |
| 65 | 0.722 0.002 | c
D | 0.687
0.001 | a
C | 0.780 0.002 | e
C | 0.746 0.001 | d
C | 0.704 0.001 | b
C | 0.723 0.003 | c
B | 0.667 0.002 | a
B | 0.753 0.001 | d
B | 0.706 0.001 | b
B | 0.667 0.001 | a
B |
| 75 | 0.679 0.002 | ab
A | 0.675
0.002 | a
A | 0.737 0.002 | d
A | 0.719 0.001 | c
A | 0.685 0.001 | b
A | 0.682 0.002 | d
A | 0.625 0.002 | b
A | 0.702 0.002 | e
A | 0.656 0.001 | c
A | 0.610 0.001 | a
A |
Table 3.
Coefficient of sliding friction of rice straw on mild steel and an aluminum surface with different levels of moisture content and normal pressure levels.
Table 3.
Coefficient of sliding friction of rice straw on mild steel and an aluminum surface with different levels of moisture content and normal pressure levels.
Rice
Straw | Moisture Content
(%) | Contact Surface |
|---|
| Mild Steel | Aluminum |
|---|
| Normal Pressure (kPa) | Normal Pressure (kPa) |
|---|
| 2 | 4 | 6 | 8 | 10 | 2 | 4 | 6 | 8 | 10 |
|---|
| Untreated | 35 | 0.487 0.002 | a
D | 0.490 0.001 | a
E | 0.552 0.001 | d
B | 0.539
0.001 | c
C | 0.512
0.001 | b
B | 0.510
0.002 | a
A | 0.535
0.002 | b
B | 0.634
0.002 | e
A | 0.599
0.001 | d
A | 0.589
0.001 | c
A |
| 45 | 0.455 0.002 | a
B | 0.450 0.002 | a
B | 0.549 0.001 | d
B | 0.537
0.001 | c
C | 0.518
0.001 | b
C | 0.573
0.003 | a
BC | 0.574
0.001 | a
C | 0.677
0.002 | d
D | 0.646
0.000 | c
C | 0.614
0.001 | b
C |
| 55 | 0.474 0.002 | a
C | 0.471 0.002 | a
D | 0.577 0.001 | d
C | 0.540
0.001 | c
C | 0.521
0.001 | b
C | 0.515
0.003 | a
A | 0.515
0.001 | a
A | 0.649
0.002 | d
B | 0.597
0.001 | c
A | 0.585
0.001 | b
A |
| 65 | 0.419 0.003 | a
A | 0.438 0.002 | b
A | 0.516 0.001 | d
A | 0.516
0.001 | d
A | 0.505
0.001 | c
A | 0.581
0.003 | b
C | 0.570
0.001 | a
C | 0.657
0.002 | d
C | 0.600
0.001 | c
A | 0.596
0.001 | c
B |
| 75 | 0.465 0.003 | a
BC | 0.463 0.002 | a
C | 0.553 0.001 | c
B | 0.527
0.001 | b
B | 0.522 0.001 | b
C | 0.567
0.002 | b
B | 0.538
0.002 | a
B | 0.631
0.002 | d
A | 0.609
0.001 | c
B | 0.626
0.001 | d
D |
| Extrusion-exploded | 35 | 0.682 0.002 | b
B | 0.662 0.001 | a
C | 0.761 0.002 | d
C | 0.721
0.001 | c
D | 0.682
0.001 | b
E | 0.800
0.003 | d
E | 0.719
0.002 | b
E | 0.827
0.001 | e
D | 0.729
0.001 | c
C | 0.694
0.001 | a
C |
| 45 | 0.671 0.002 | b
A | 0.623 0.002 | a
A | 0.759 0.001 | e
C | 0.706
0.001 | d
C | 0.678 0.001 | c
D | 0.727
0.003 | b
C | 0.660
0.002 | a
C | 0.801
0.002 | c
C | 0.757
0.001 | d
E | 0.724
0.001 | b
E |
| 55 | 0.703 0.002 | c
D | 0.645 0.001 | a
B | 0.759 0.002 | e
C | 0.720
0.000 | d
D | 0.673
0.001 | b
C | 0.774
0.002 | c
D | 0.704
0.002 | a
D | 0.805
0.002 | d
C | 0.747
0.002 | b
D | 0.699
0.001 | a
D |
| 65 | 0.709 0.002 | d
D | 0.621 0.002 | b
A | 0.710 0.001 | d
B | 0.648
0.000 | c
B | 0.594
0.001 | a
B | 0.682
0.002 | b
B | 0.631
0.002 | a
B | 0.749
0.002 | c
B | 0.657
0.000 | b
B | 0.630
0.001 | a
B |
| 75 | 0.694 0.002 | e
C | 0.622 0.002 | c
A | 0.652 0.002 | d
A | 0.546
0.000 | b
A | 0.522
0.001 | a
A | 0.608
0.003 | c
A | 0.581
0.001 | b
A | 0.679
0.001 | e
A | 0.631
0.001 | d
A | 0.569
0.001 | a
A |
Table 4.
The ANOVA results for the coefficient of sliding friction versus the moisture content and normal pressure.
Table 4.
The ANOVA results for the coefficient of sliding friction versus the moisture content and normal pressure.
| Dependent Variable | Source | Type III Sum of Squares | Df | Mean Square | F |
|---|
Pretreatment
Method | Sample Variety | Contact Surface |
|---|
| Untreated | Wheat straw | Mild steel | Moisture content(MC) | 0.007 | 4 | 0.002 | 448.605 ** |
| Normal pressure(NP) | 0.099 | 4 | 0.025 | 6124.979 ** |
| MC * NP | 0.006 | 16 | 0.000 | 85.963 ** |
| Error | 0.000 | 50 | 4.03 × 10⁻⁶ | |
| Total | 0.112 | 74 | | |
| Aluminum | Moisture content(MC) | 0.006 | 4 | 0.002 | 338.85 ** |
| Normal pressure(NP) | 0.072 | 4 | 0.018 | 4092.656 ** |
| MC ∗ NP | 0.011 | 16 | 0.001 | 159.051 ** |
| Error | 0.000 | 50 | 4.43 × 10⁻⁶ | |
| Total | 0.090 | 74 | | |
| Rice straw | Mild steel | Moisture content(MC) | 0.014 | 4 | 0.004 | 1151.702 ** |
| Normal pressure(NP) | 0.099 | 4 | 0.025 | 8094.475 ** |
| MC ∗ NP | 0.006 | 16 | 0.000 | 124.901 ** |
| Error | 0.000 | 50 | 3.06 × 10⁻⁶ | |
| Total | 0.119 | 74 | | |
| Aluminum | Moisture content(MC) | 0.021 | 4 | 0.005 | 1339.903 ** |
| Normal pressure(NP) | 0.116 | 4 | 0.029 | 7211.612 ** |
| MC ∗ NP | 0.013 | 16 | 0.001 | 196.076 ** |
| Error | 0.000 | 50 | 4.00 × 10⁻⁶ | |
| Total | 0.150 | 74 | | |
| Extrusion-exploded | Wheat straw | Mild steel | Moisture content(MC) | 0.008 | 4 | 0.002 | 726.172 ** |
| Normal pressure(NP) | 0.085 | 4 | 0.021 | 7322.999 ** |
| MC ∗ NP | 0.006 | 16 | 0.000 | 121.415 ** |
| Error | 0.000 | 50 | 2.91 × 10⁻⁶ | |
| Total | 0.099 | 74 | | |
| Aluminum | Moisture content(MC) | 0.142 | 4 | 0.035 | 9886.966 ** |
| Normal pressure(NP) | 0.076 | 4 | 0.019 | 5283.518 ** |
| MC ∗ NP | 0.011 | 16 | 0.001 | 186.817 ** |
| Error | 0.000 | 50 | 3.58 × 10⁻⁶ | |
| Total | 0.228 | 74 | | |
| Rice straw | Mild steel | Moisture content(MC) | 0.095 | 4 | 0.024 | 9548.013 ** |
| Normal pressure(NP) | 0.100 | 4 | 0.025 | 10089.428 ** |
| MC ∗ NP | 0.066 | 16 | 0.004 | 1651.347 ** |
| Error | 0.000 | 50 | 2.48 × 10⁻⁶ | |
| Total | 0.260 | 74 | | |
| Aluminum | Moisture content(MC) | 0.216 | 4 | 0.054 | 12511.669 ** |
| Normal pressure(NP) | 0.128 | 4 | 0.032 | 7419.379 ** |
| MC ∗ NP | 0.019 | 16 | 0.001 | 281.899 ** |
| Error | 0.000 | 50 | 4.32 × 10⁻⁶ | |
| Total | 0.364 | 74 | | |
Table 5.
The ANOVA results for the coefficient of sliding friction regarding length.
Table 5.
The ANOVA results for the coefficient of sliding friction regarding length.
| Dependent Variable | | Sum of Squares | df | Mean Square | F |
|---|
| Straw Variety | Contact Surface | |
|---|
| Wheat straw | Mild steel | Between Groups | 0.005 | 4 | 0.001 | 415.318 ** |
| Within Groups | 0.000 | 10 | 0.000 | |
| Total | 0.005 | 14 | | |
| Aluminum | Between Groups | 0.003 | 4 | 0.001 | 177.250 ** |
| Within Groups | 0.000 | 10 | 0.000 | |
| Total | 0.003 | 14 | | |
| Rice straw | Mild steel | Between Groups | 0.018 | 4 | 0.005 | 1041.861 ** |
| Within Groups | 0.000 | 10 | 0.000 | |
| Total | 0.019 | 14 | | |
| Aluminum | Between Groups | 0.072 | 4 | 0.018 | 4306.853 ** |
| Within Groups | 0.000 | 10 | 0.000 | |
| Total | 0.072 | 14 | | |
Table 6.
Coefficient of sliding friction for different lengths of straw on mild steel and aluminum surfaces.
Table 6.
Coefficient of sliding friction for different lengths of straw on mild steel and aluminum surfaces.
| Sample Variety | Contact
Surface | Length (mm) |
|---|
| 30 | 60 | 90 | 120 | 150 |
|---|
| Wheat straw | Mild steel | 0.457 a 0.001 b | aDY c,d | 0.473
0.002 | bcDY | 0.479
0.002 | cDY | 0.472
0.001 | bDY | 0.510 0.002 | dDY |
| Aluminum | 0.548
0.002 | aEY | 0.565
0.002 | bEY | 0.571
0.002 | bcEX | 0.574
0.002 | cEX | 0.590 0.002 | dEY |
| Rice straw | Mild steel | 0.354
0.002 | aDX | 0.420
0.002 | bDX | 0.446
0.001 | cDX | 0.454
0.002 | dDX | 0.421 0.002 | bDX |
| Aluminum | 0.383
0.002 | aEX | 0.525
0.002 | bEX | 0.569
0.002 | dEX | 0.567
0.002 | dEX | 0.547 0.001 | cEX |
Table 7.
Comparison of the coefficients of sliding friction between untreated and extrusion-exploded straw, wheat straw and rice straw, and mild steel and aluminum surfaces.
Table 7.
Comparison of the coefficients of sliding friction between untreated and extrusion-exploded straw, wheat straw and rice straw, and mild steel and aluminum surfaces.
| Straw Variety | Treatment Method | Contact Surface |
|---|
| Mild Steel | Aluminum |
|---|
| Wheat straw | Untreated | 0.602 a
0.039 b | aEX c | 0.639
0.036 | bEX |
| Extrusion-exploded | 0.718
0.036 | aEY | 0.725
0.055 | aDY |
| Rice straw | Untreated | 0.504
0.040 | aDX | 0.592
0.045 | bDX |
| Extrusion-exploded | 0.670
0.059 | aDY | 0.703
0.070 | aDY |
Table 8.
The fitting model of the coefficient of sliding friction based on length.
Table 8.
The fitting model of the coefficient of sliding friction based on length.
| Sample Variety | Contact Surface | Fitting Parameters |
|---|
| Fitting Equation | R2 | Sy.x |
|---|
| Wheat straw | Mild steel | Y = 0.0003462 ∗ X + 0.4469 | 0.7179 | 0.009990 |
| Aluminum | Y = 0.0003098 ∗ X + 0.5419 | 0.9268 | 0.004336 |
| Rice straw | Mild steel | Y = −1.714 × 10⁻⁵ ∗ X2 + 0.003644 ∗ X + 0.2605 | 0.9948 | 0.004022 |
| Aluminum | Y = −2.941 × 10⁻⁵ ∗ X2 + 0.006524 ∗ X + 0.2223 | 0.9738 | 0.017740 |
| Publisher’s Note: MDPI stays neutral with regard to jurisdictional claims in published maps and institutional affiliations. |
© 2022 by the authors. Licensee MDPI, Basel, Switzerland. This article is an open access article distributed under the terms and conditions of the Creative Commons Attribution (CC BY) license (https://creativecommons.org/licenses/by/4.0/).


