1. Introduction
All vehicles that use fossil fuels have some emissions. These emissions are divided into greenhouse gas emissions, which trap additional heat into the Earth’s atmosphere [
1], and air pollutant emissions, i.e., substances which can lead to adverse health effects, primarily affecting respiratory and cardiovascular systems [
2,
3]. Emission levels are continuously rising globally [
4], and lowering emissions presents one of the most prominent global goals. On a worldwide level, the Paris Agreement indicated a global intention of keeping the increase in global average temperature to well below 2 °C, which means lowering greenhouse gas emissions by at least 40% by 2030 compared with 1990 [
5]. This has also been reaffirmed by the Glasgow Climate Pact [
6]. The European Union (EU), via the European Commission, further increased its ambition to lower overall carbon dioxide (CO
2) emissions by 2030, setting a goal of 55% CO
2 emission reduction compared with 1990 [
7].
Developing an emission inventory is the first step in determining a course of action to reduce emissions. Listing emissions by source and quantity for each tracked pollutant enables defining the primary emissions sources. Since the development of an emission inventory is a long-term process which requires a continuous collection of data via various sources, it represents one of the most reliable tools in developing technologies. An emission inventory also polices for emission reduction [
8,
9], especially on the local level [
10]. Furthermore, it shows the effectiveness of policies already in place [
11].
In some areas of the emission inventories, there is a significant lack of data, such as non-road mobile machinery (NRMM). The lack of data in this area (NRMM) is mainly because NRMM has been seen as a much smaller pollutant than road vehicles. Emission limits for NRMM are generally much more liberal than emission limits for road vehicles worldwide, including the EU [
12,
13]. Consequently, there is less research concerning NRMM and little data collection from government bodies. The first step in collecting data about NRMM would be for the government to designate an institution for data collection [
14]. This would enable long-term data collection on a national scale, enabling the use of new information in line with new technologies to achieve the previously mentioned targets. Once collected, the NRMM emission data could be presented in a visually engaging way. Such is the case in the United Kingdom, where the NRMM emission inventory, for example, has provided spatial data on primary pollutants [
11]. A similar case is present in the USA, where the Environmental Protection Agency (EPA)-developed NRMM emission inventory for 2017 offers data disaggregated by federal states [
15].
As a subgroup of NRMM, agricultural machinery is an important area of NRMM research. As with the other NRMM, there is a lack of data necessary to develop national emission inventories for researching fuels, operating modes of the machinery, and making connections to other socioeconomic areas, etc. [
16]. An emission inventory would greatly help to formulate long-term policies for emission reduction from agricultural machines and significantly affect their future total emissions [
17,
18]. In China, in the Beijing region, emissions of carbon monoxide (CO), hydrocarbons (HC), nitrogen oxides (NO
X), particulate matter (PM), and the total emissions from agricultural machinery decreased by 63.11%, 62.93%, 72.07%, 74.67%, and 68.66%, respectively, from 2006 to 2016, due to regulations which promoted emission-reduction technologies. In the Yangtze River Delta region, overall air quality was poorer during the heavy agricultural work season [
19], with similar results on a national level [
20]. However, adding emission-reduction technologies to the agricultural machinery puts a considerable financial strain on machinery owners [
21], and is not as efficient as procuring new machinery [
22].
Apart from a lack of general machinery data, developing an agricultural machinery emission inventory is also tricky because of a lack of research on agricultural machinery emissions during fieldwork, which is mainly due to many different types of machinery and field conditions. Gathering activity data from real-world operating conditions, such as engine load profiles, idling times, differences between other machinery operators, etc., helps determine the actual emissions of agricultural machinery instead of using models based on laboratory research. Without this data, the results of emission inventories can have high degrees of uncertainty [
23]. Based on engine load factors throughout a typical working day, measurement results can have variability as high as a factor of 20 [
24]. Emissions also vary among different land types where machinery is used. For example, machinery working in vineyards can emit up to 80% more emissions compared with arable land for the same land area [
25]. However, gathering detailed on-site data on a large scale represents a significant financial strain and is time-consuming.
The EMEP/EEA Air Pollutant Emission Inventory Guidebook includes three methods of determining agricultural machinery emissions, depending on available data [
26]. The Tier 1 method uses only primary NRMM data, i.e., fuel consumption and emission factors. Tier 2 is a method that requires more data as it also uses data on fuel consumption based on equipment type and technology level. The most precise method is the Tier 3 method which is used when there are no available data for fuel consumption but other data are available, e.g., annual hours of use, engine size, and machinery age. However, since the available data on agricultural machinery is substantially limited, most countries have no emission inventories for agricultural machinery at the national level. Existing emission inventories are made mainly by collecting information about vehicle sales or extrapolating data from machinery imports. In Switzerland, data on total fuel sales for agriculture is only available up to 2004 [
27]. NRMM emissions in Germany are reported by the Federal German Environment Agency using vehicle stock data. However, activity data are taken from various resale platforms, and further investments towards real-world measurements are needed [
22]. A similar system of data collecting is in place in Denmark, where the Association of Danish Agricultural Machinery Dealers provides annual sales data, but there is no available activity data [
28]. The Netherlands also has only vehicle sales data but no activity data [
29]. Sweden uses the Tier 3 method described in the EMEP/EEA Air Pollutant Emission Inventory Guidebook, which uses activity data and machinery age [
26] for its national emission inventories [
30]. Regarding Croatia, there are currently no official data on agricultural machinery emissions. Additionally, there are no data on which to base initial assessments since there is no continuous data collection regarding the machinery numbers or types of activity, making it very difficult to develop an emission inventory.
More reliable data can be collected by conducting a large-scale survey. By collecting the data via a questionnaire, accurate data can be collected about fuel consumption, several different types of machinery, land types, etc., and it provides more accurate data about real-world fuel consumption [
20,
31]. However, conducting a large-scale survey is logistically and financially consuming, thus requiring logistical and financial support, in most cases, from governmental bodies [
32]. Such large-scale surveys are conducted in the Netherlands [
33] and Sweden [
34], where several governmental bodies participate in national surveys on energy statistics. The Finnish model offers publicly available data on NRMM emissions divided into subcategories by emission source, fuel type, end-use of NRMM and year, even providing future estimations up to the year 2040 [
35].
As previously mentioned, most countries do not have an agricultural machinery emission inventory, or if they do, it is developed based on vehicle stock data or vehicle sales without using actual data from the agricultural entities. This paper aims to develop a spatial agricultural machinery emission inventory using large-survey data. An emission inventory for agricultural machinery can be developed without conducting a census or gathering detailed on-site activity data. Such an emission inventory, with emission data by machinery category and county, offers a baseline for developing policies for specific areas or machinery types. Furthermore, this paper represents the first emission inventory for agricultural machinery in Croatia, with results disaggregated spatially, by counties, and by machinery type. The survey includes several thousand respondents. Agricultural machinery emissions are compared with energy consumption and emissions from road vehicles. Additionally, spatially disaggregated emissions are compared with the respective total distribution of agricultural land.
4. Conclusions
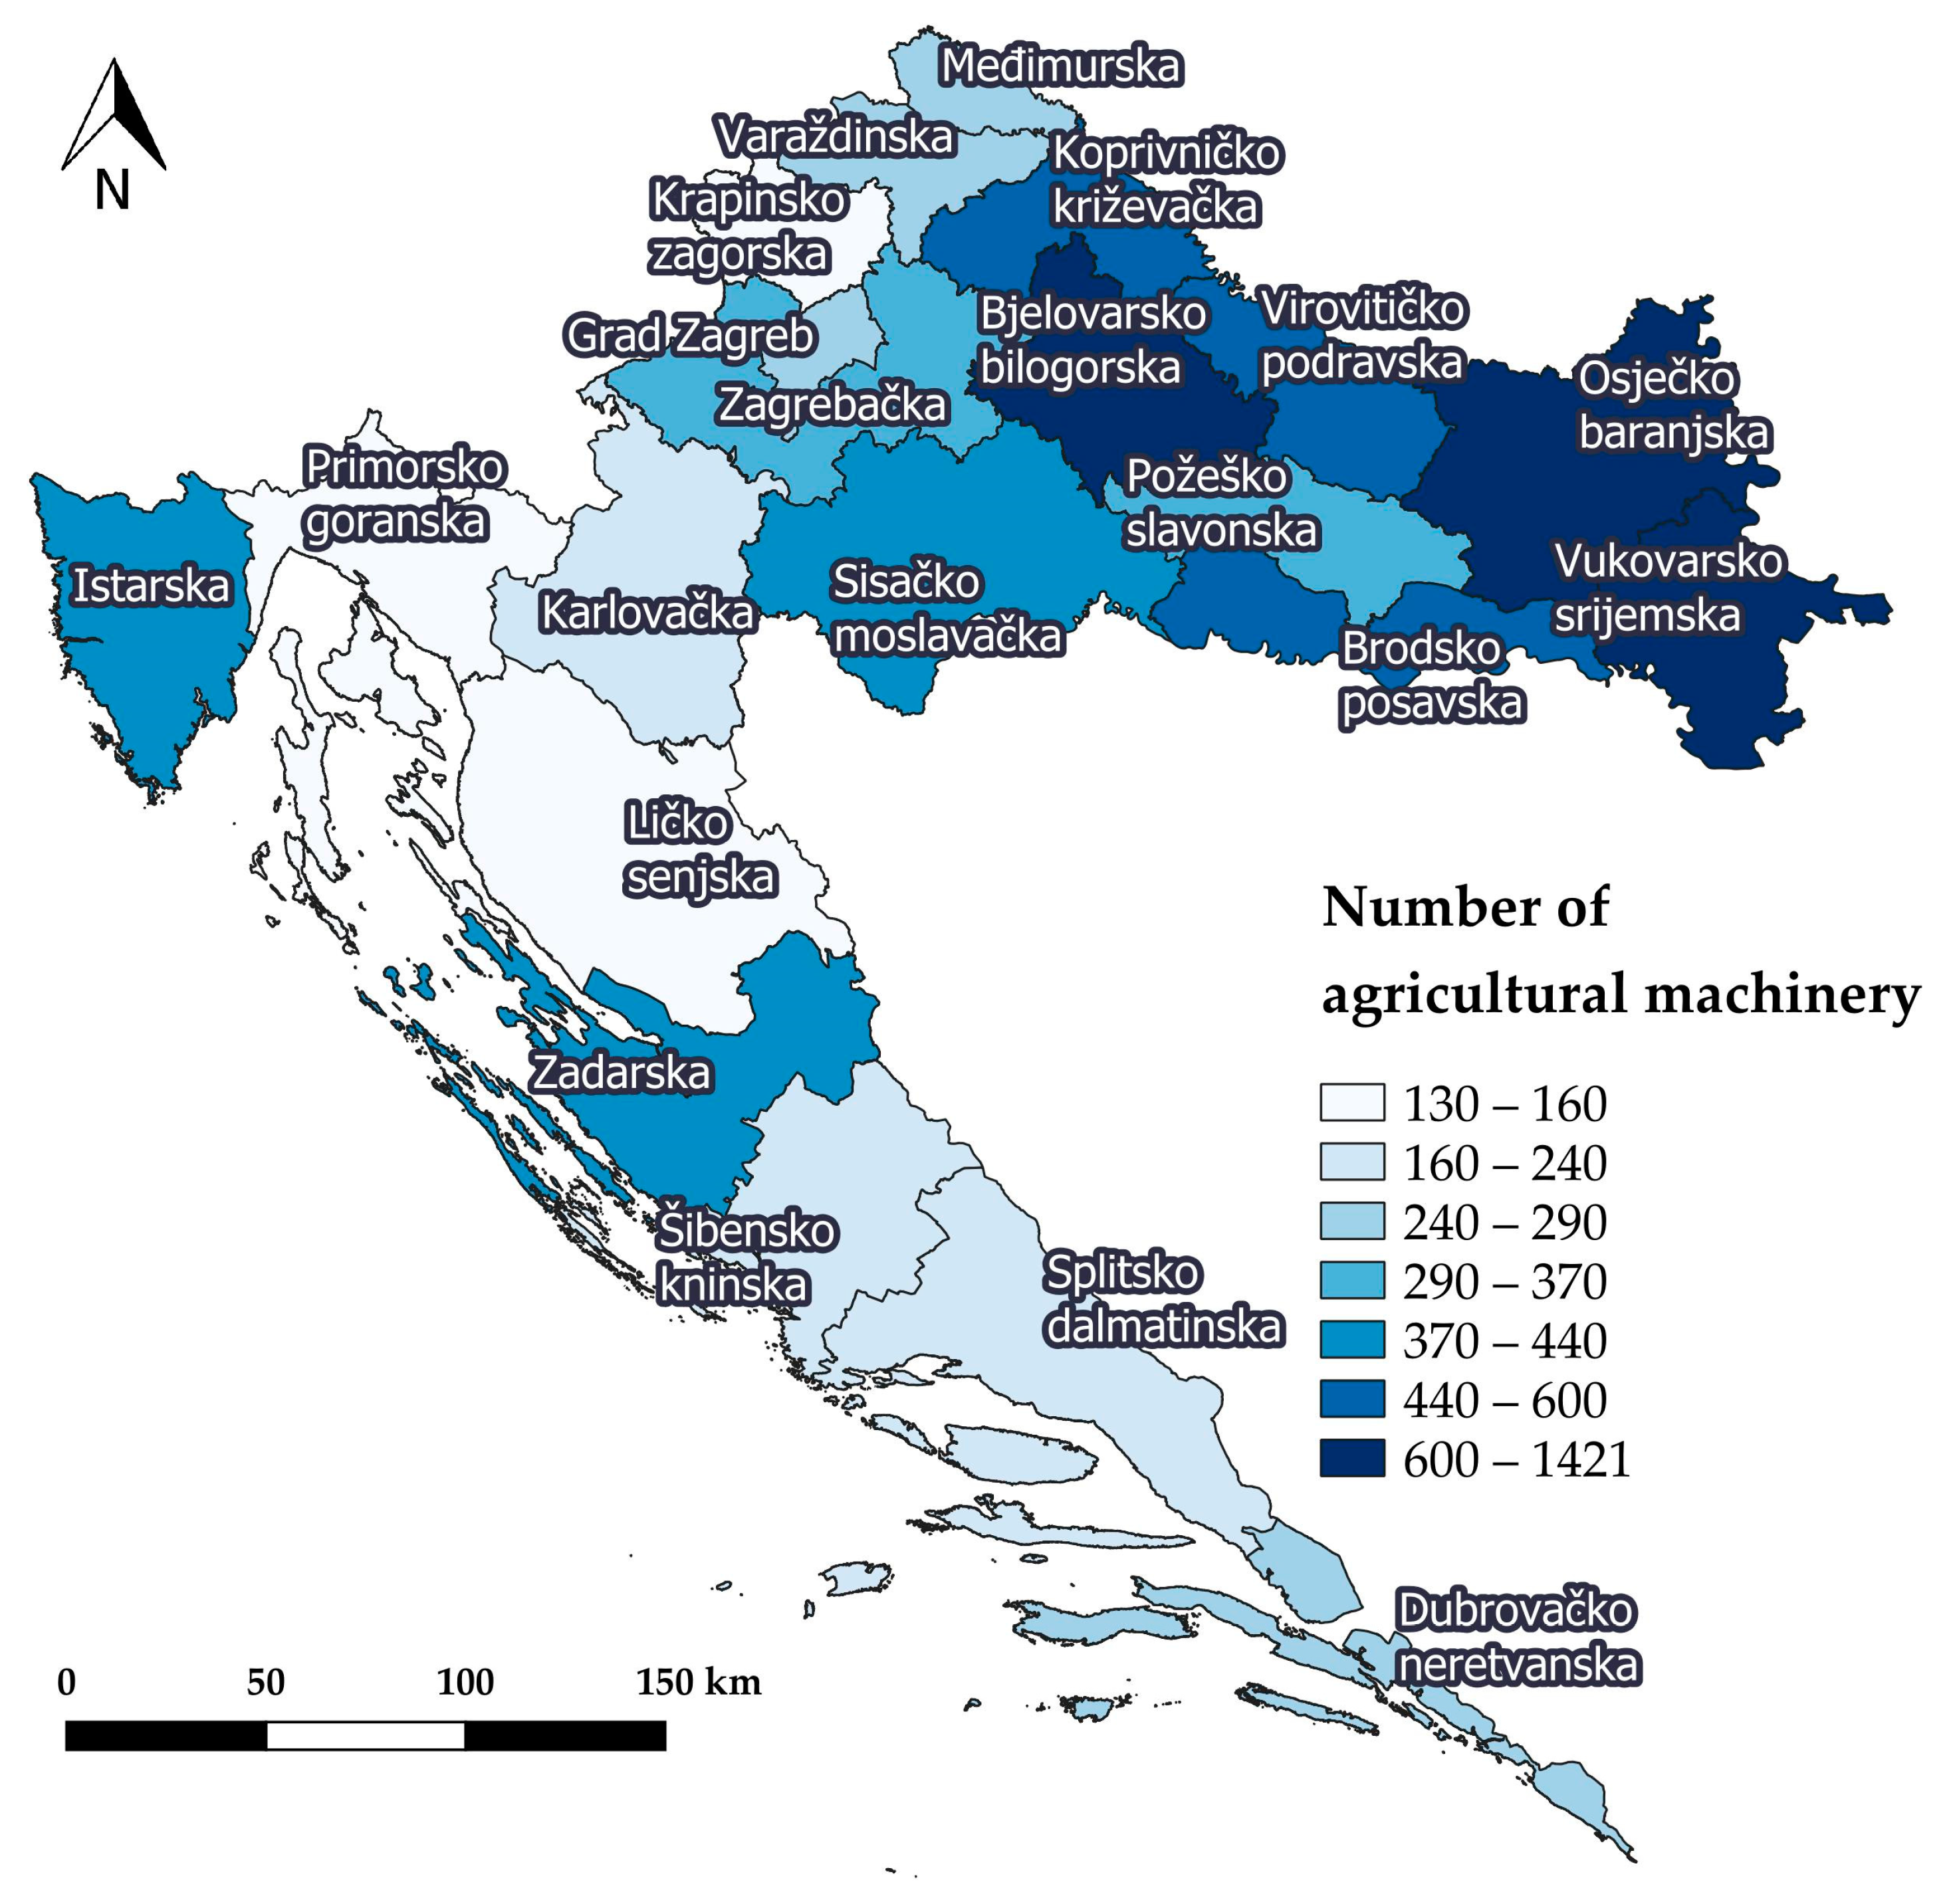
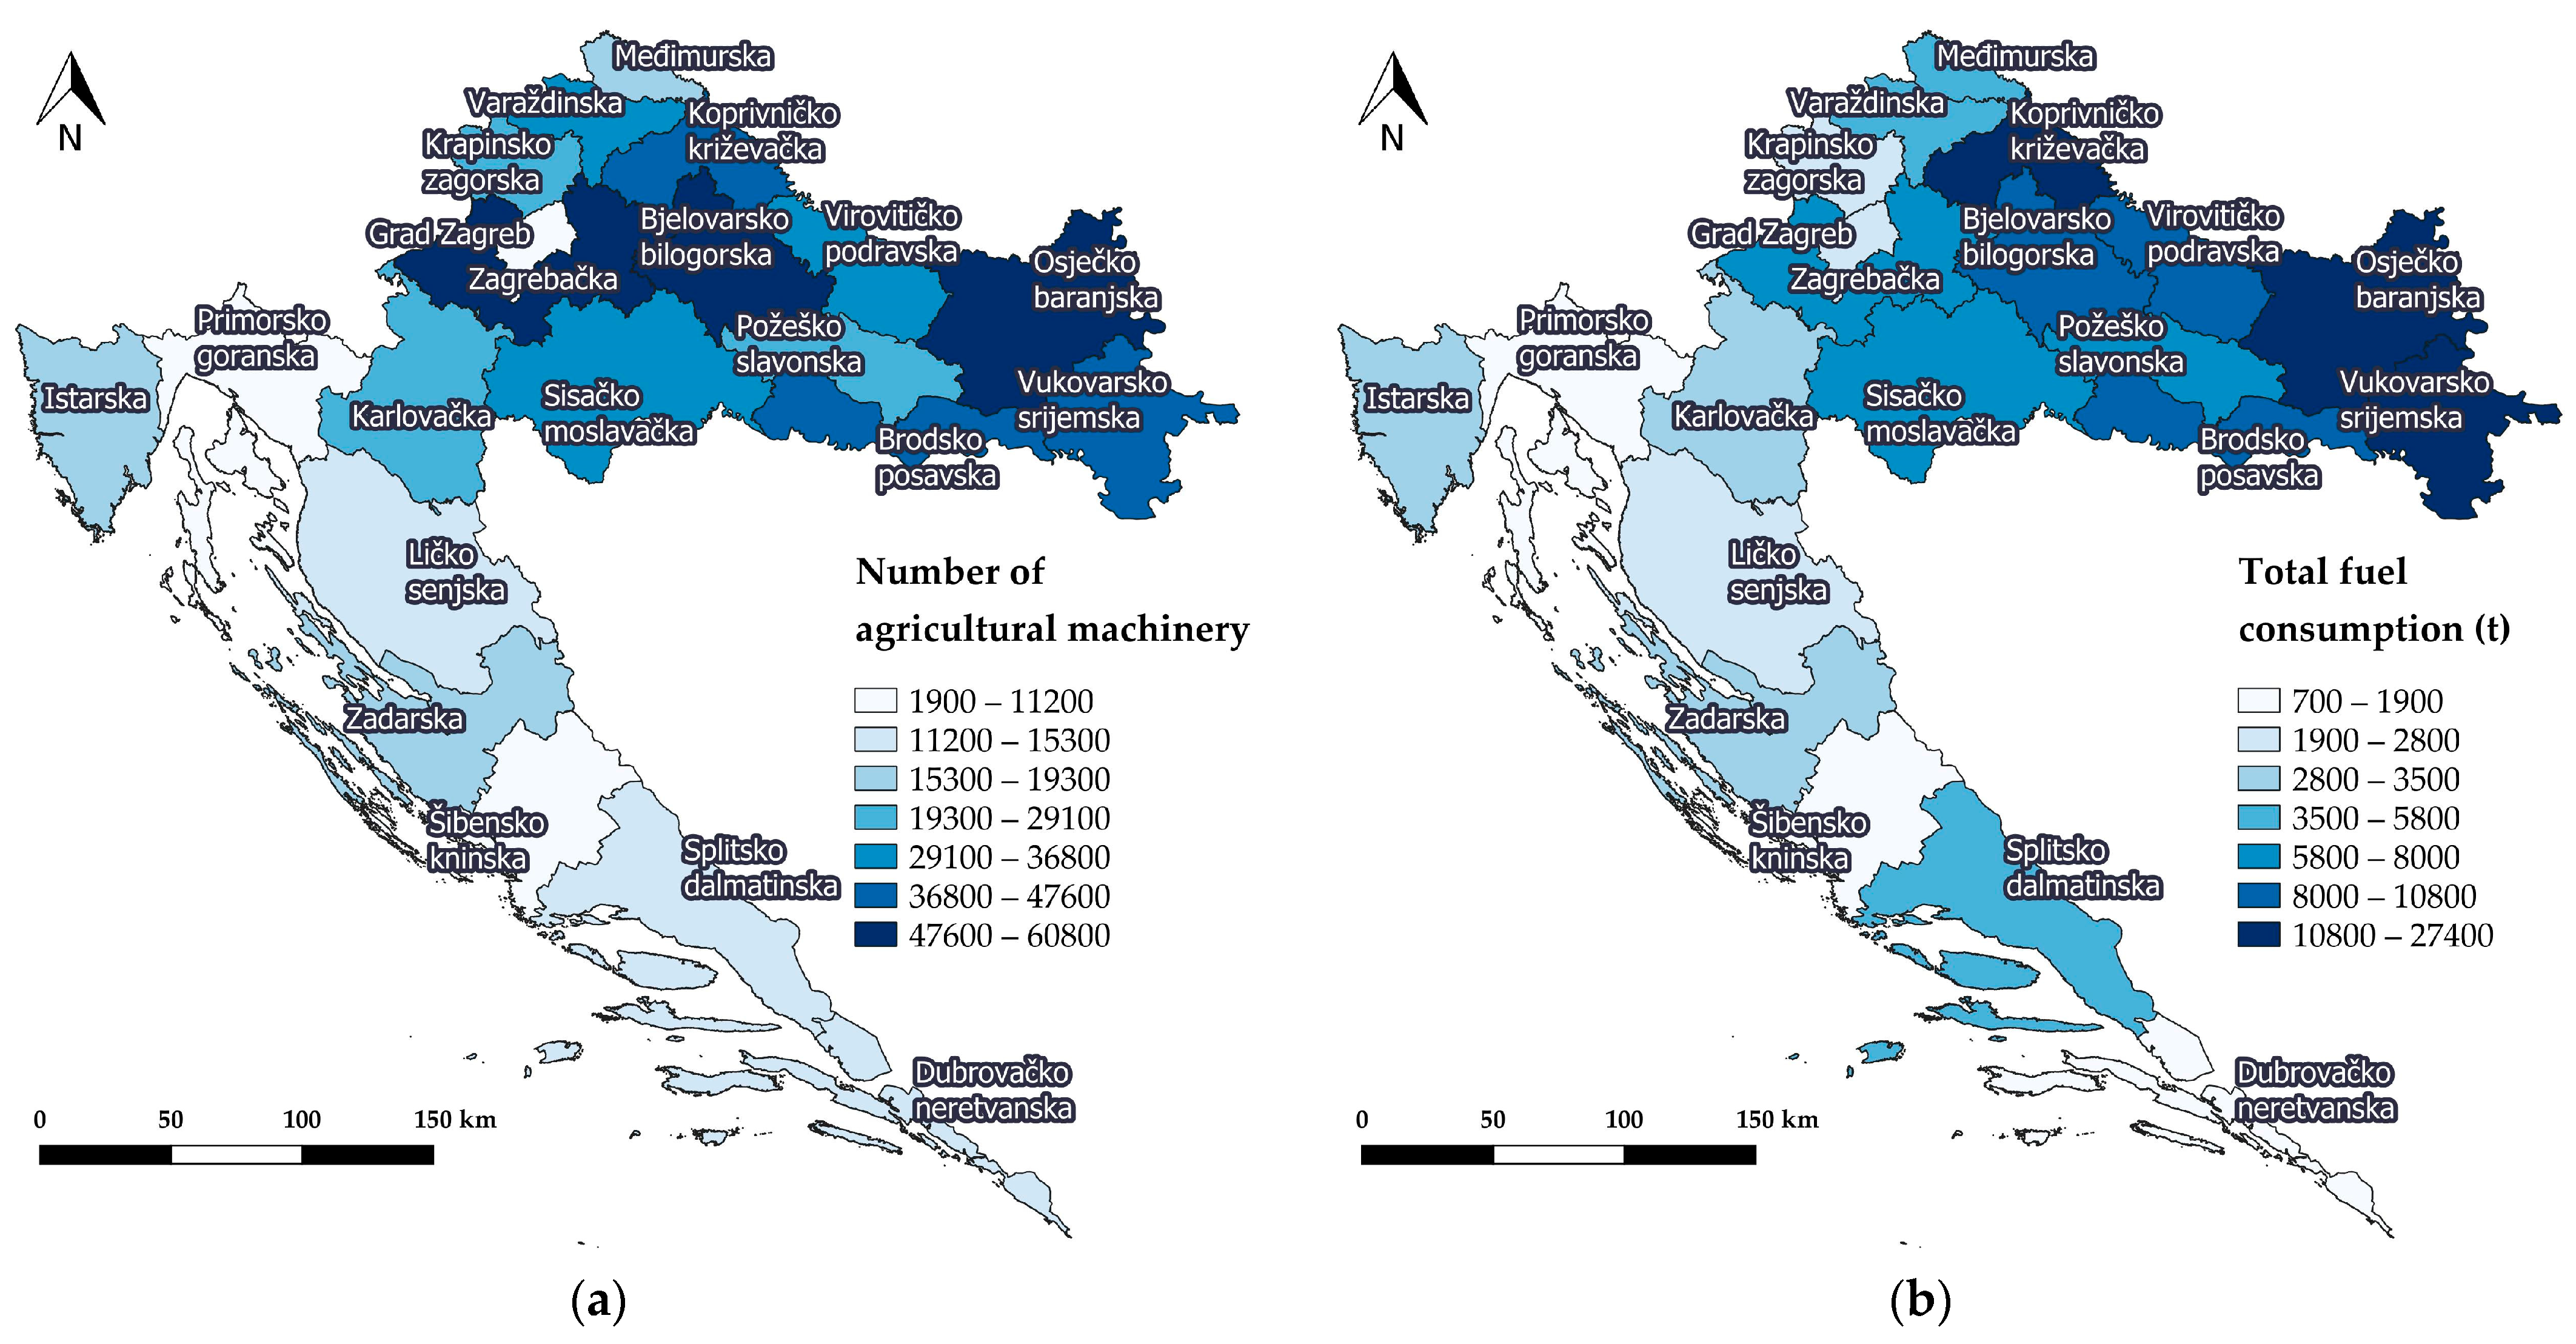
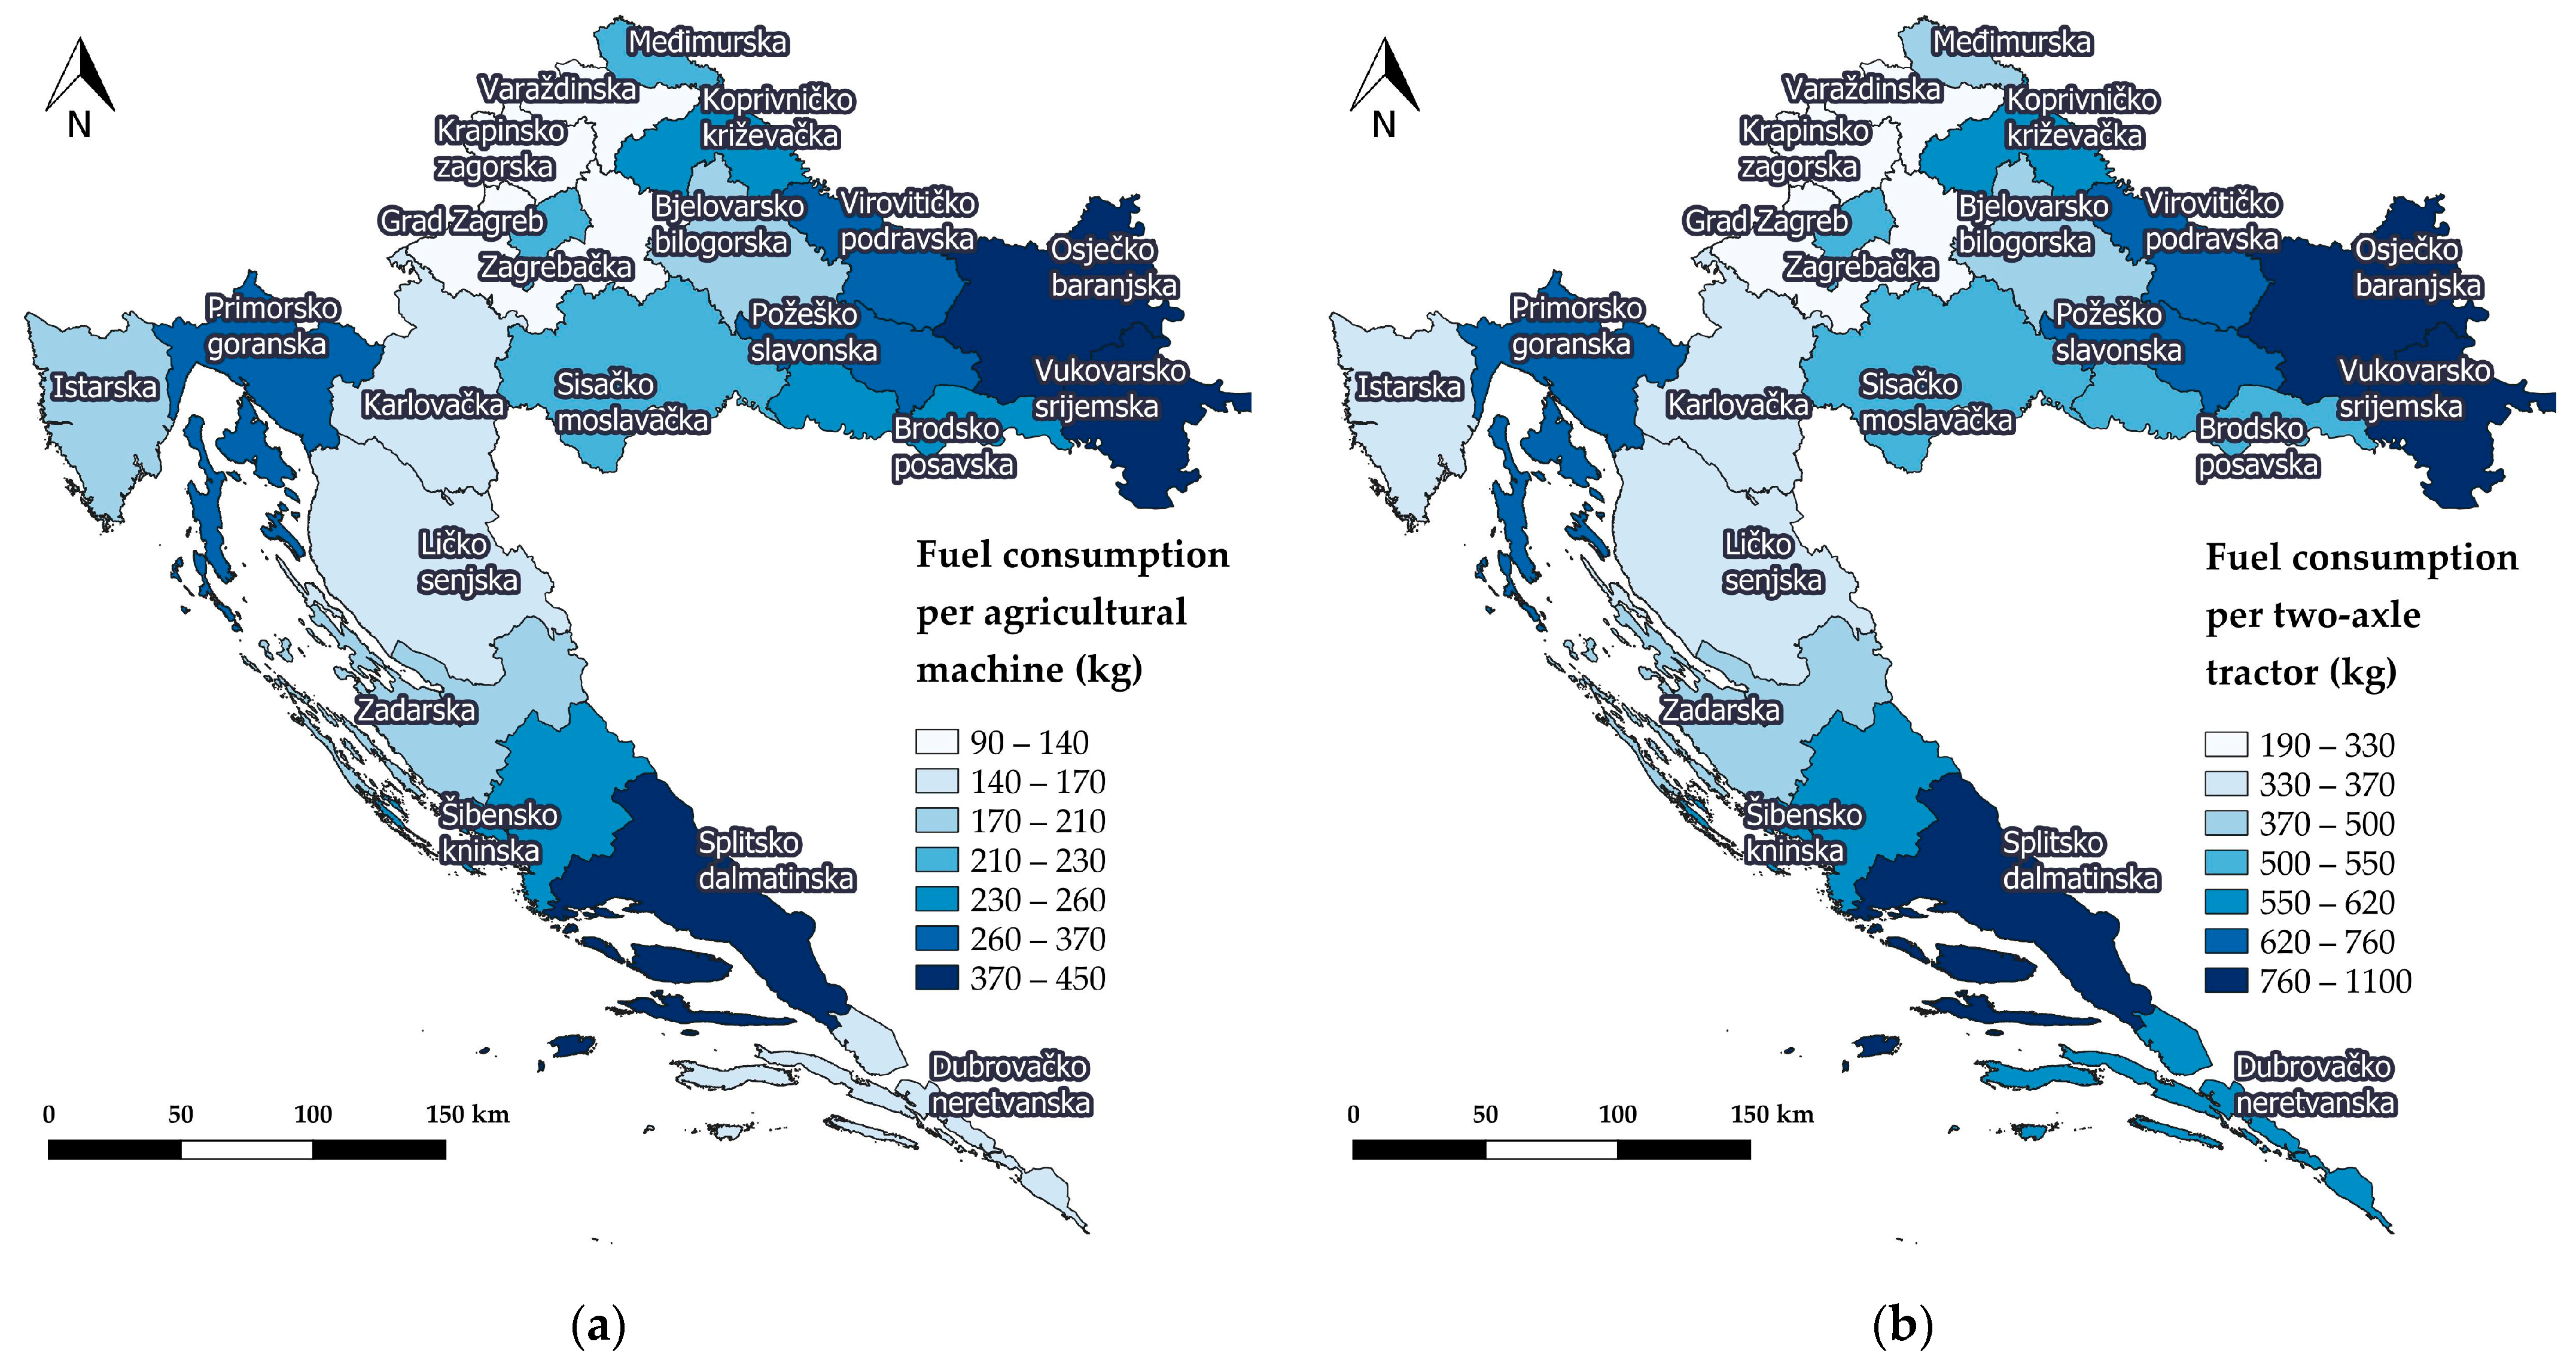
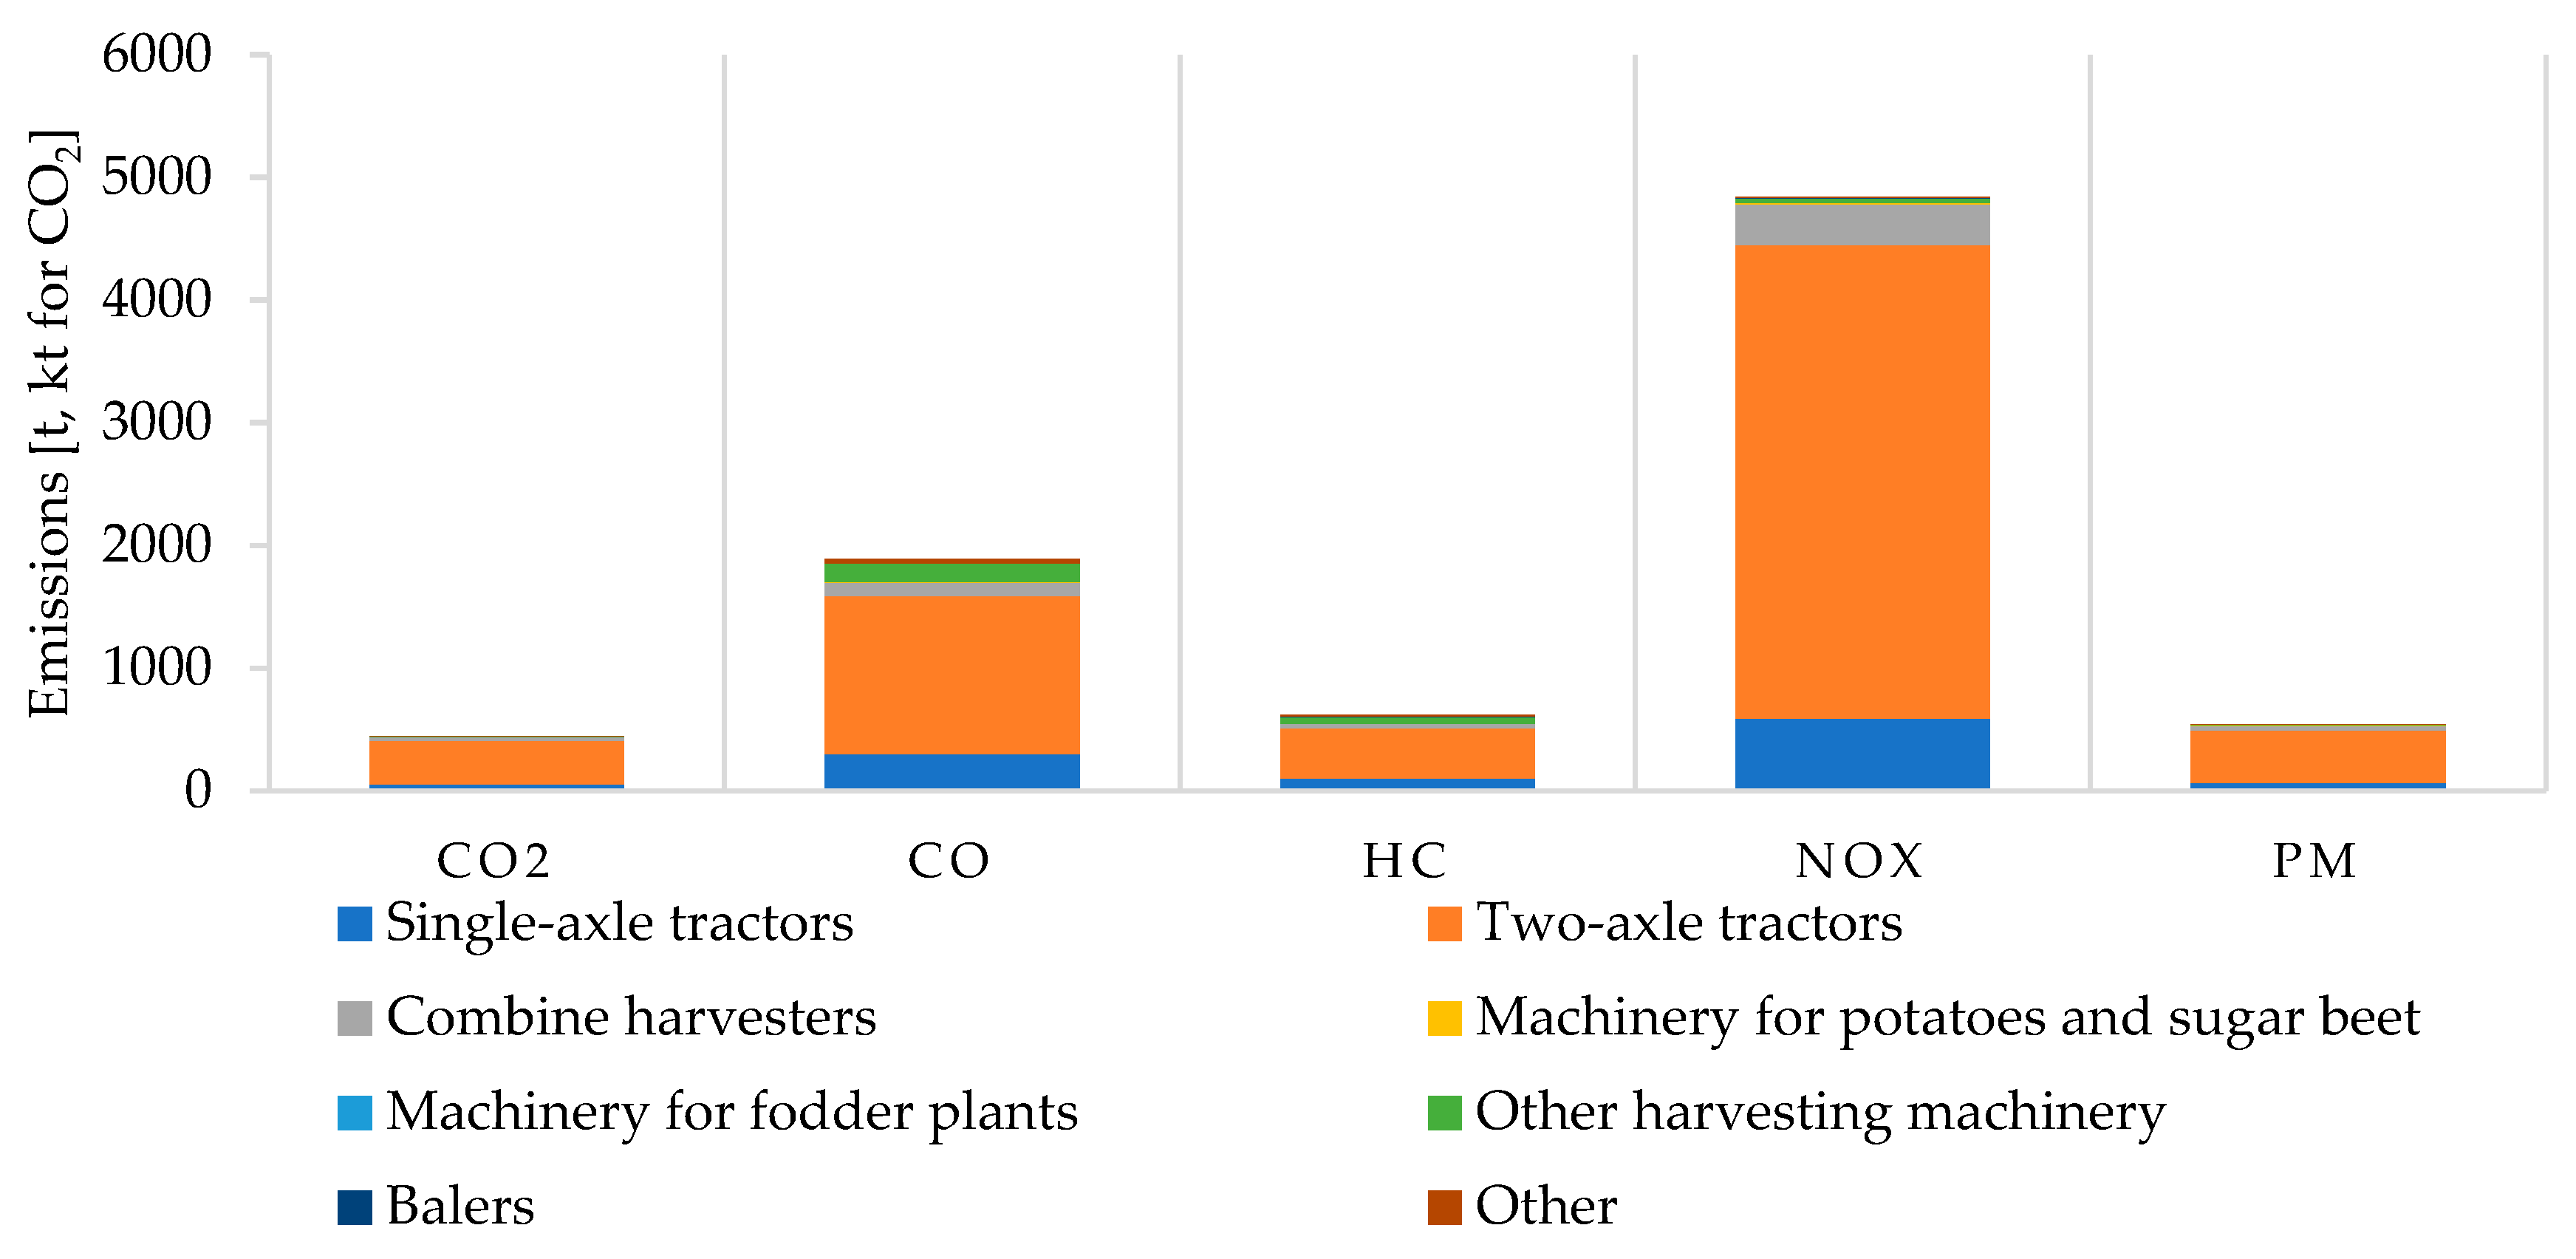
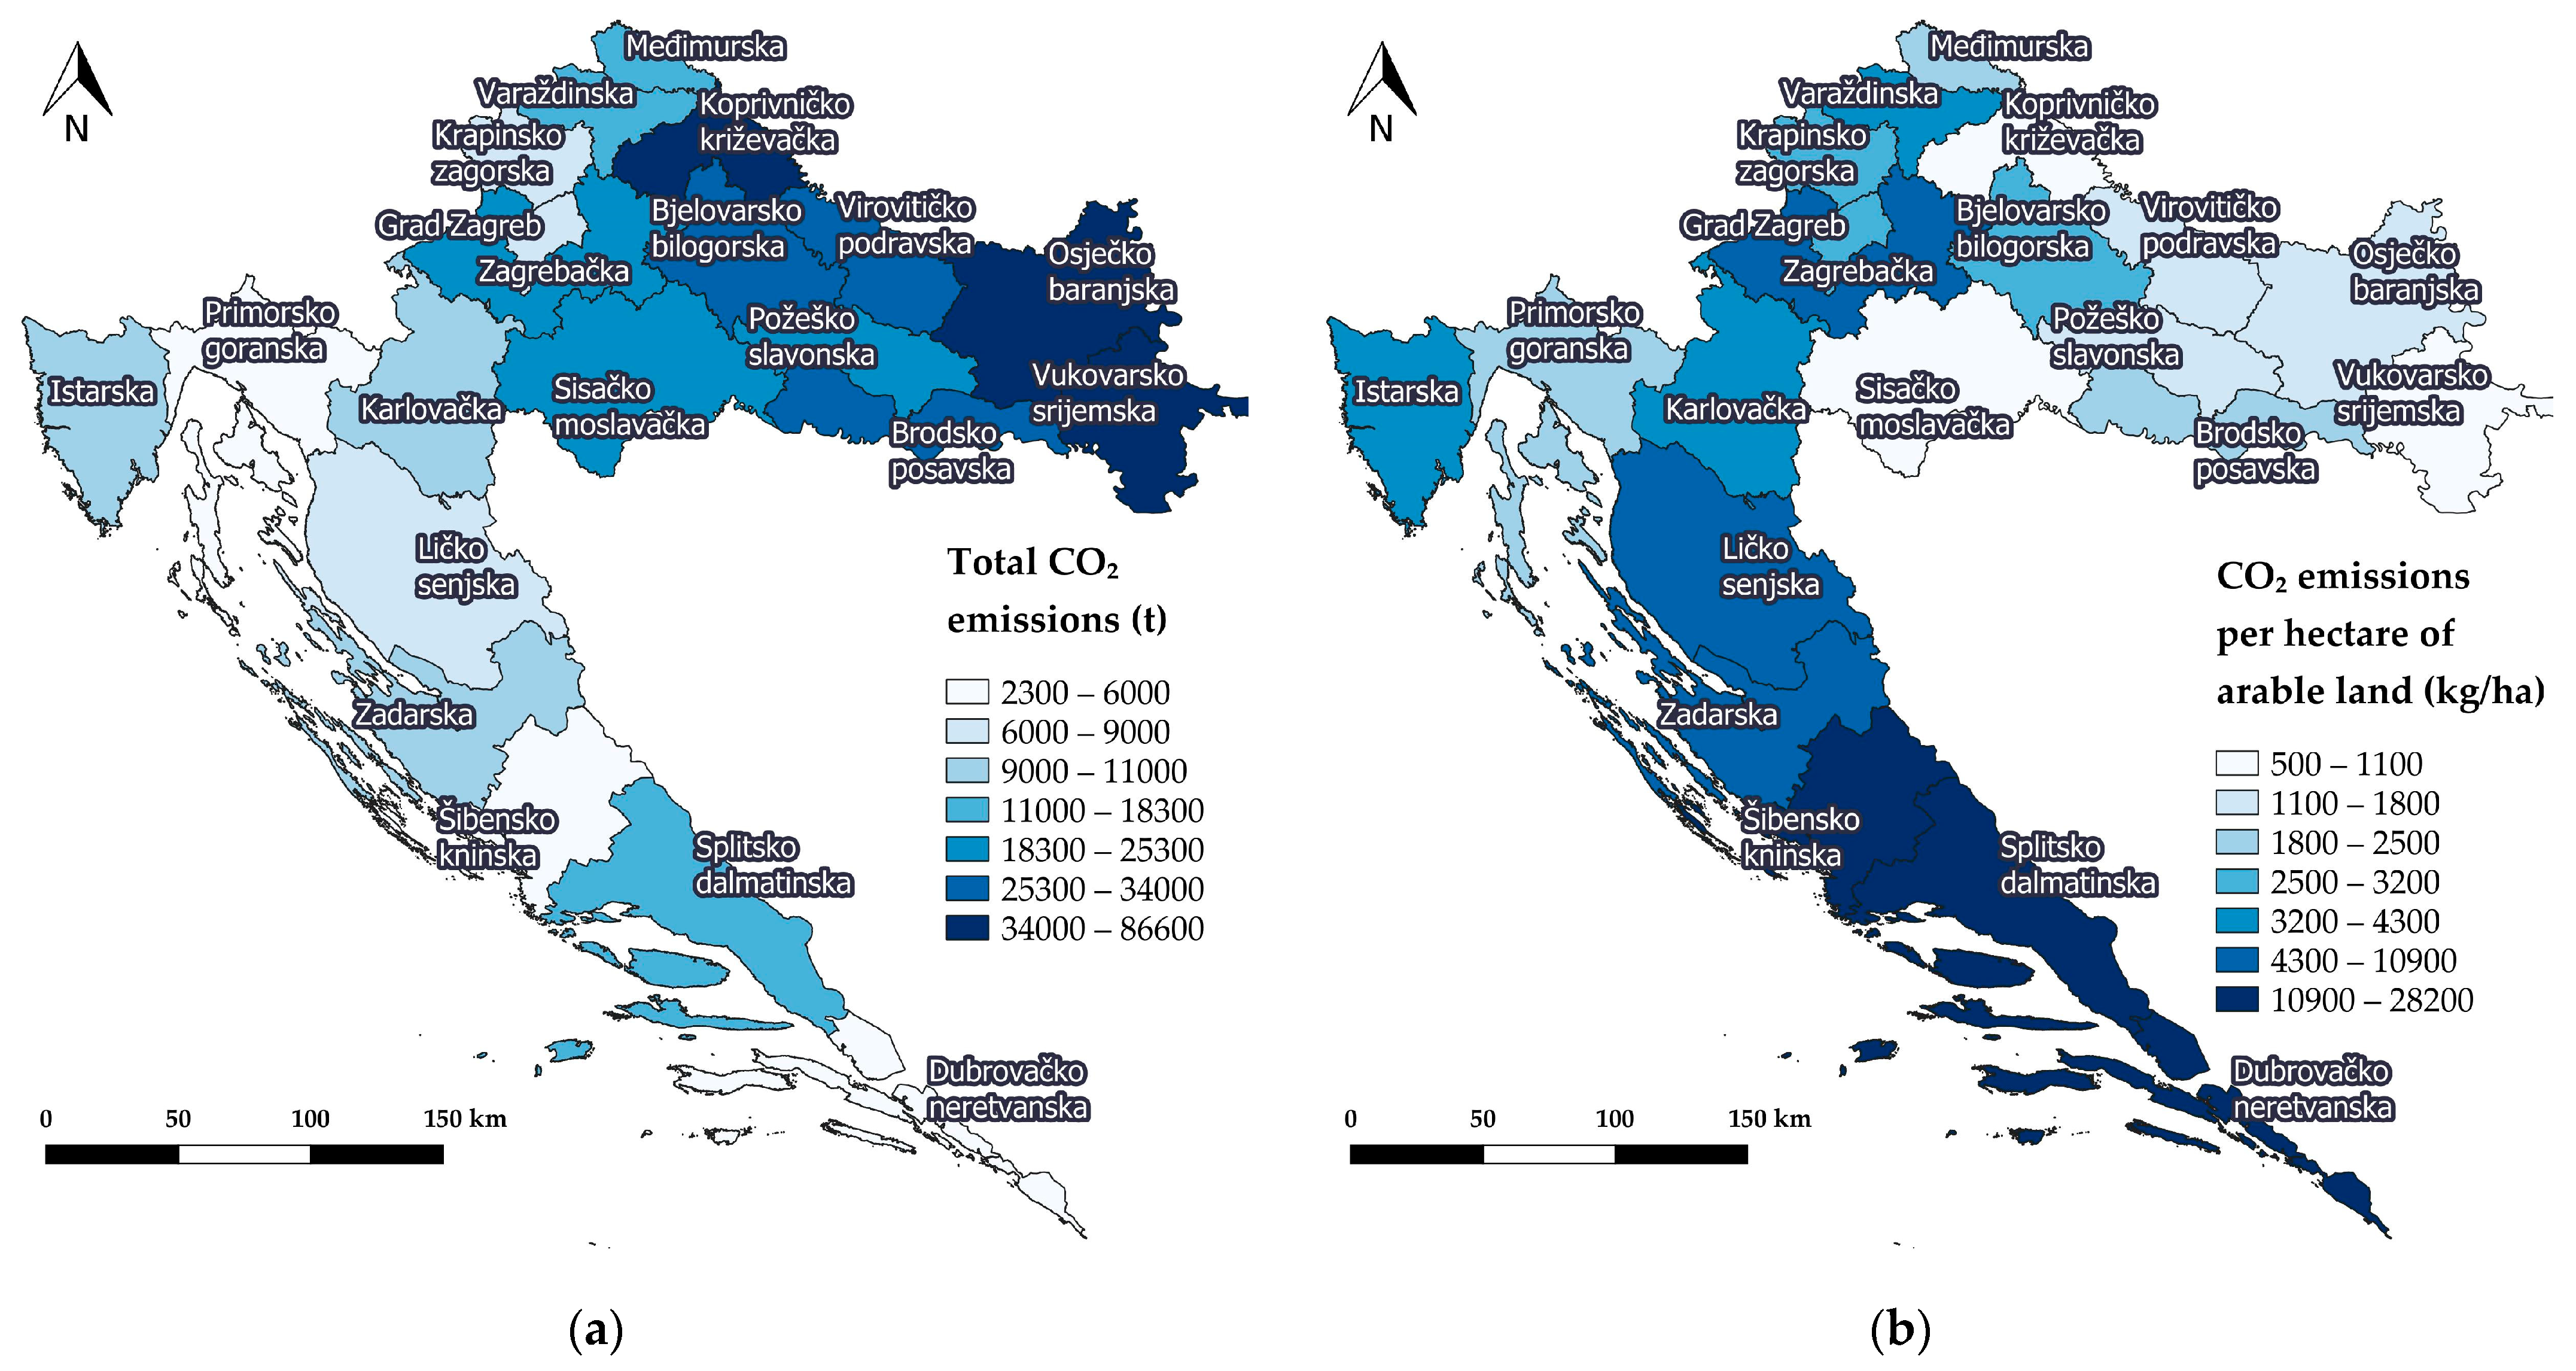
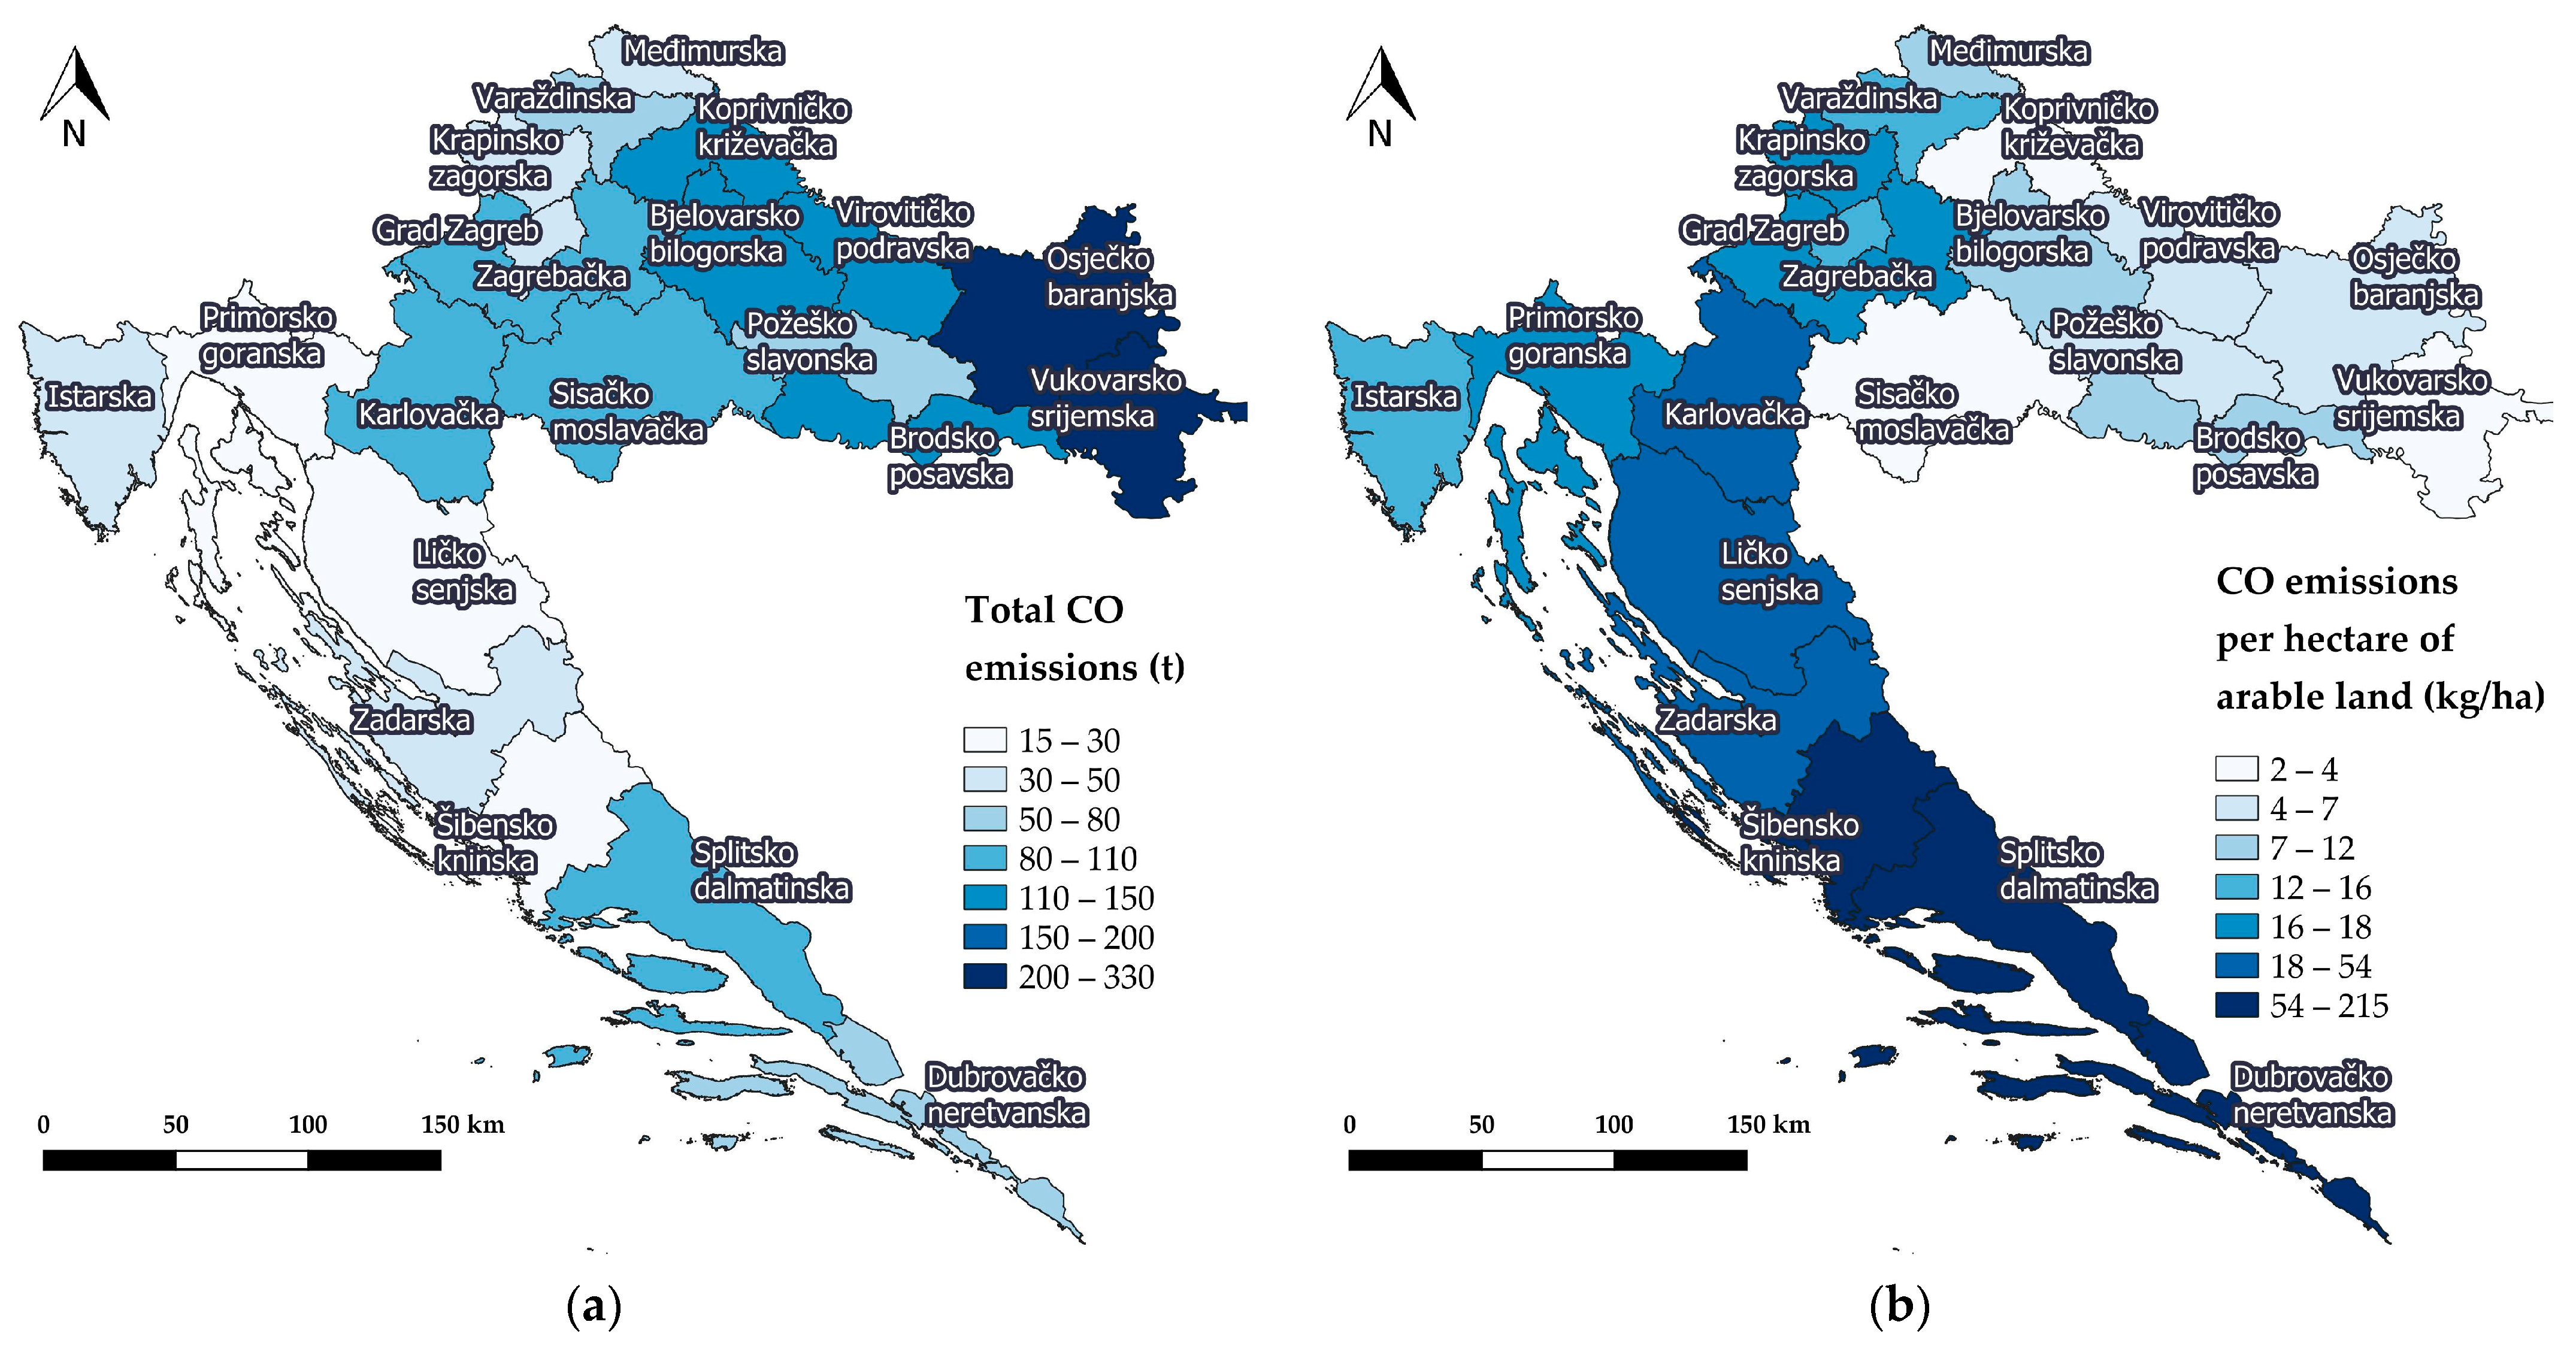
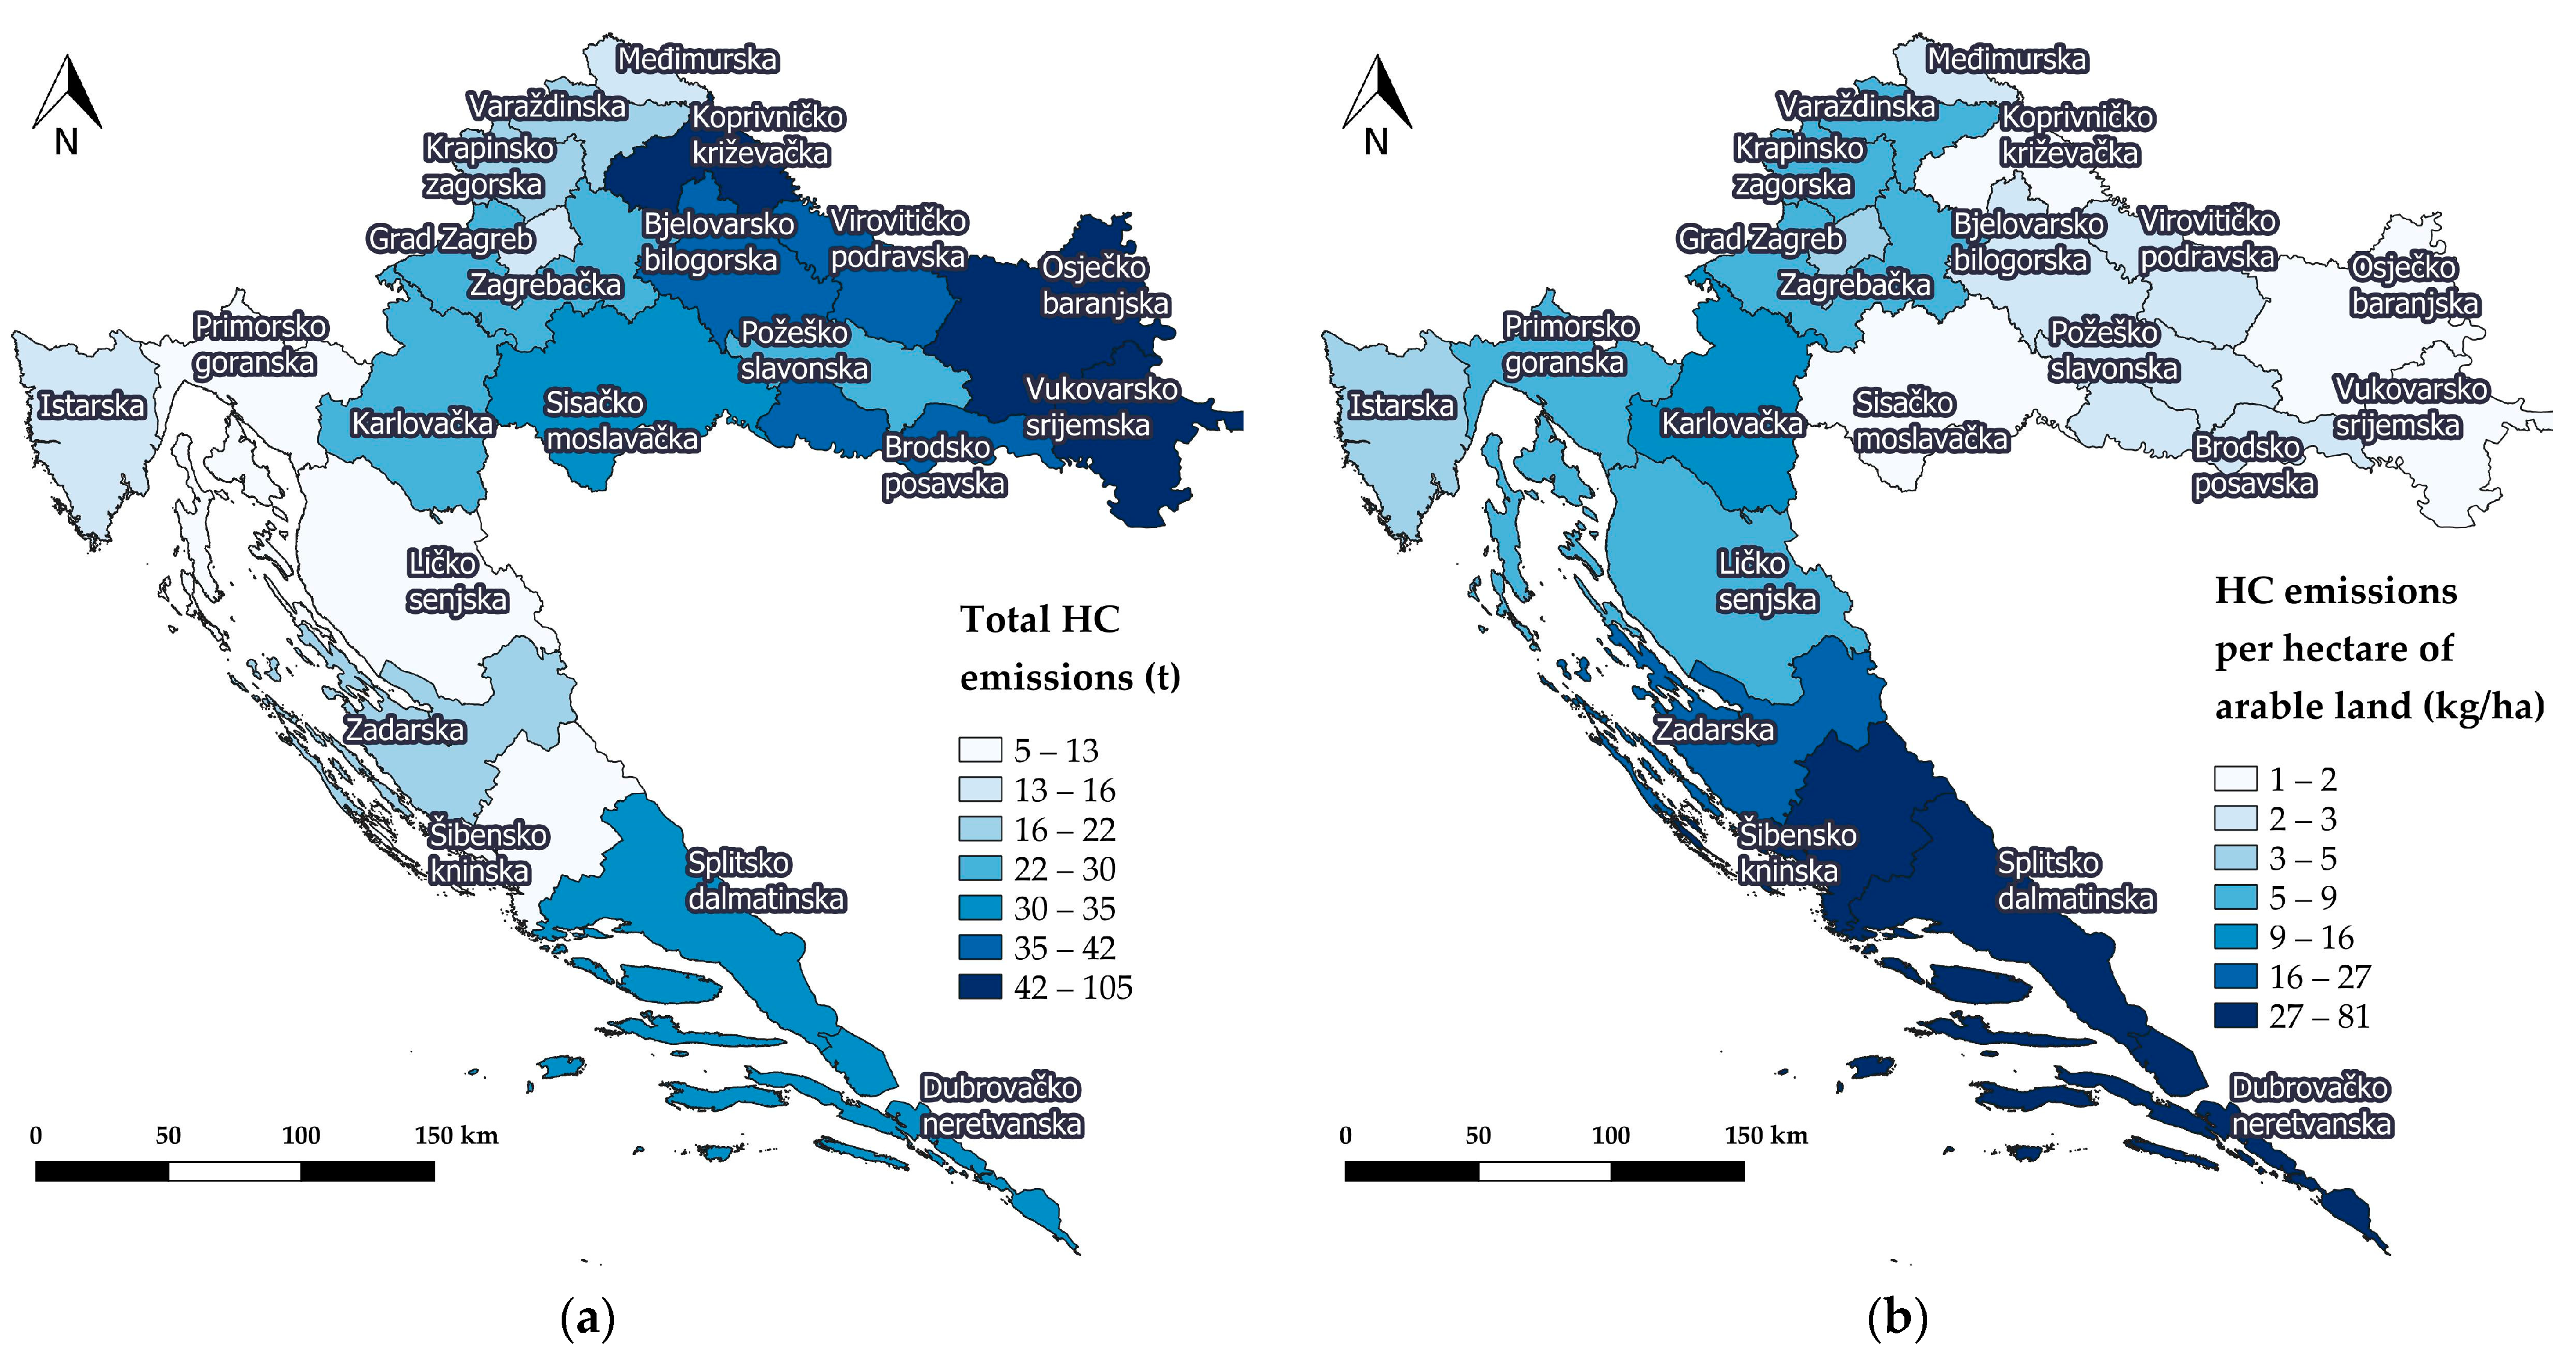
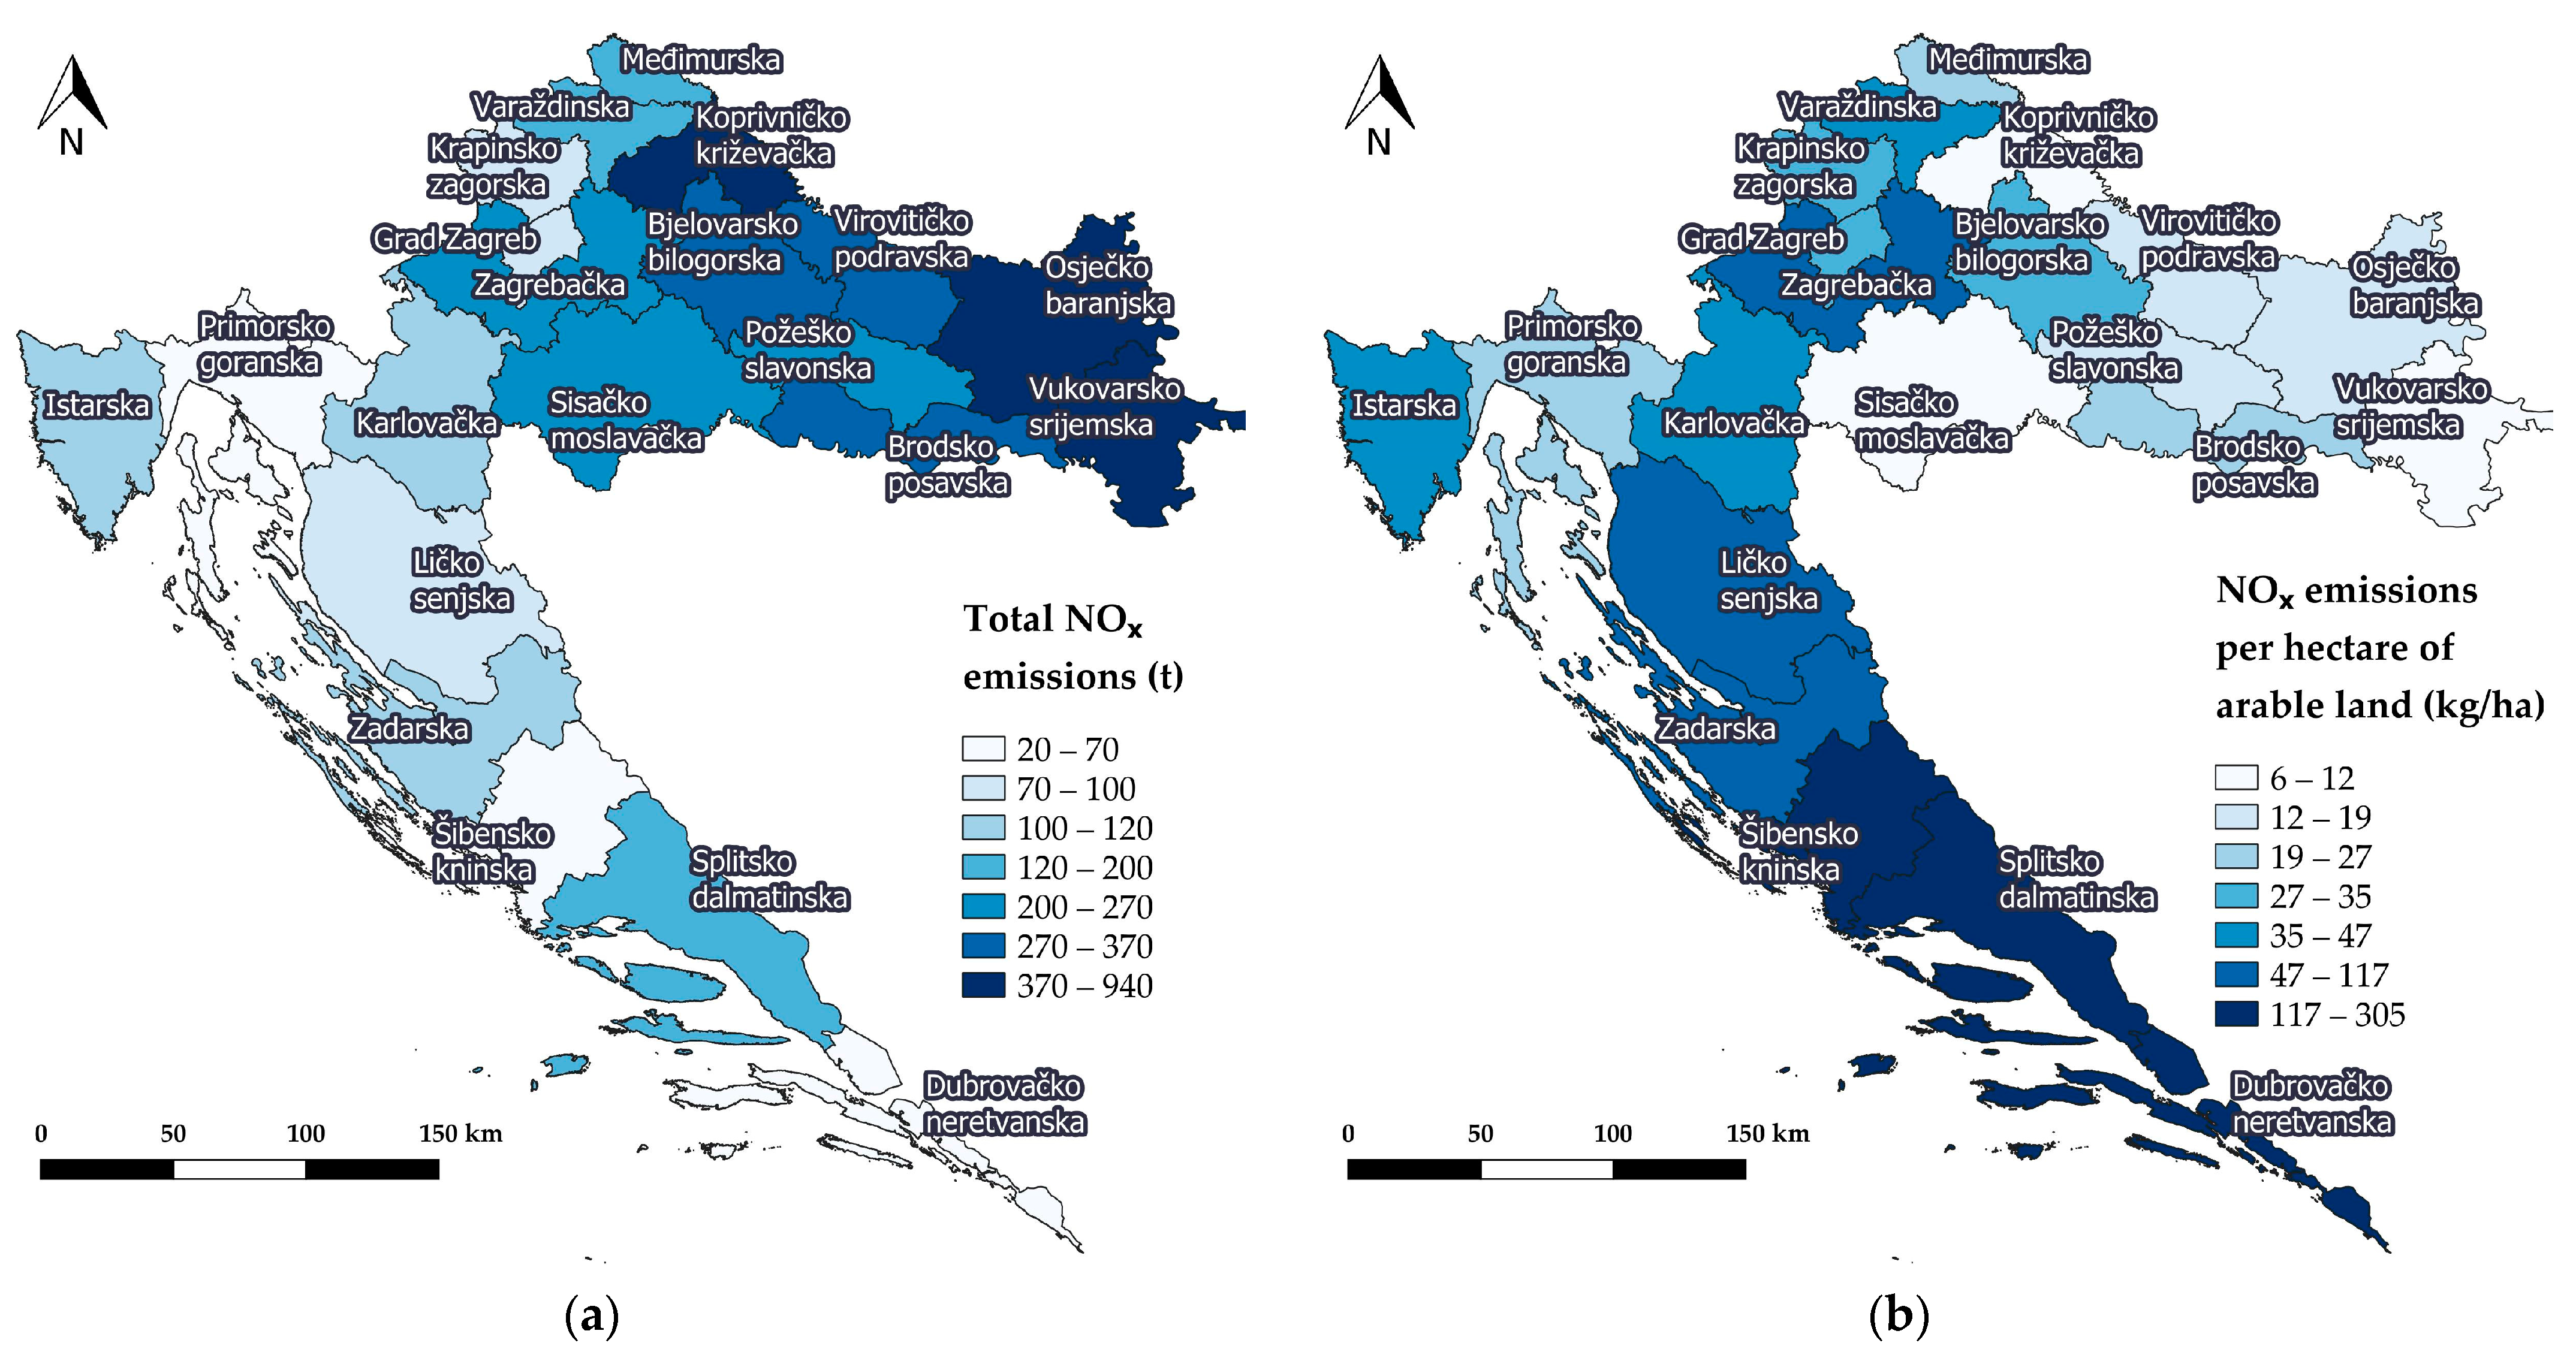
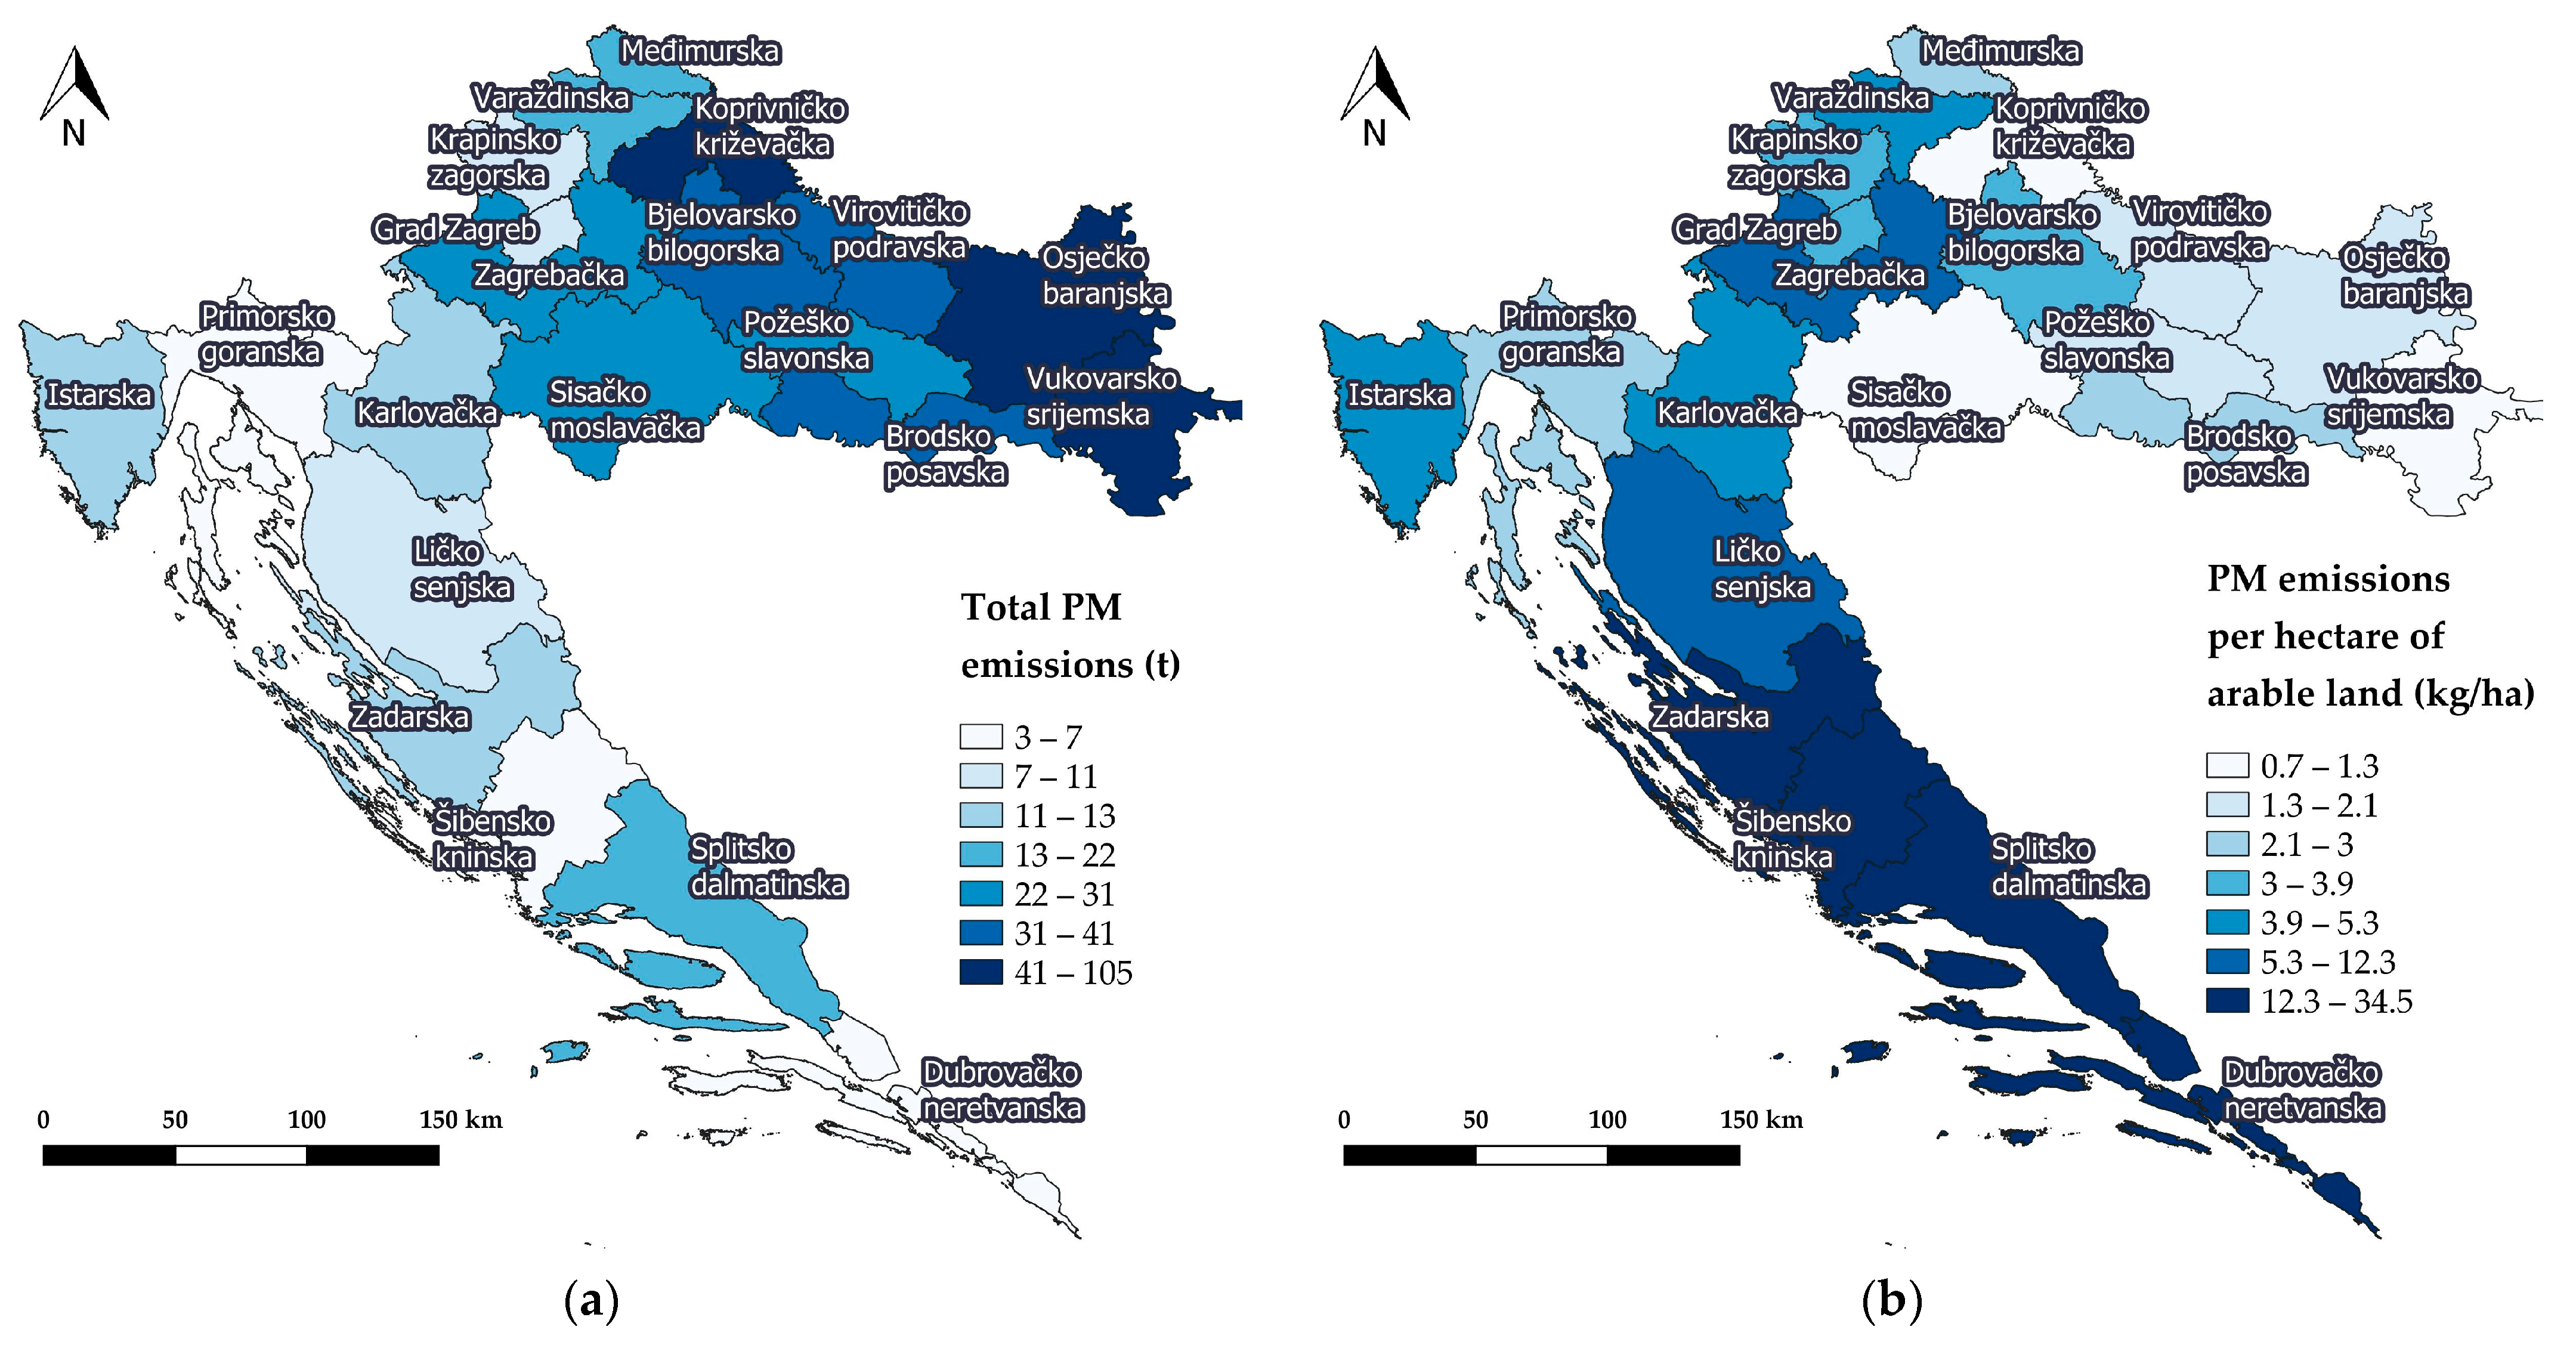
Emissions from agricultural machinery impact the climate, produced food, and the health of the agricultural workers. The first step in emission control is data analysis, where an emission inventory plays the most critical role. In this paper, a spatial emission inventory was developed via data gathered from a large-scale survey with 8895 respondents in Croatia. After determining the fuel consumption, agricultural machinery emissions were calculated using the EEA Tier 1 method. Two-axle tractors had the most significant fuel consumption and emitted the most emissions for all emission types. A spatial presentation of emissions showed that Osječko-baranjska county had the most emissions, with 86,637 t of CO2, 324 t of CO, 103 t of HC, 944 t of NOX, and 105 t of PM. However, the most arable land emissions per hectare were present in Dubrovačko-neretvanska and Splitsko-dalmatinska counties. Dubrovačko-neretvanska had the most CO and HC emissions, with 215 kg CO/ha and 81 kg HC/ha, whereas Splitsko-dalmatinska county had the most CO2, NOX, and PM emissions, with 28,218 kg CO2/ha, 305 kg NOX/ha, and 35 kg PM/ha.
Without an official figure to compare the results, data verification was done by relating the results with the emissions from road vehicles and comparing those relations with other relative values in some other countries. When comparing fuel consumption and emissions of agricultural machinery with those of road vehicles, it is evident that agricultural machinery in Croatia in 2016 had a more significant proportion of emissions than their respective share in fuel consumption, except for CO emissions, and with no data for road vehicles for PM emissions. A comparison with other countries indicated similar proportions, i.e., a higher proportion of emissions compared with energy consumption in the Netherlands, Sweden, Finland, Denmark, Germany, and Switzerland, except for CO2 emissions in Finland and CO emissions in Germany. Unfortunately, there is no official data for agricultural machinery energy consumption in the Netherlands and Sweden. Future studies could focus on determining additional information, such as vehicle age or work hours, or information on emission-reduction technologies, in order to determine the effects on overall emissions.
Lack of data presents a significant problem in developing an emission inventory for agricultural machinery. Conducting an extensive survey can ensure that quality data can be collected, enabling policies to target specific areas and machinery categories. This task could be done annually by an institution with enough resources to collect and process the data. Government funding for such an institution would benefit its stability and capacity to develop annual emission inventories. It is essential to determine which data can be accurately collected from the agricultural entities to avoid collecting unreliable data and to ensure that the agricultural entities can fill the survey with accurate and up-to-date data. Collaborating between government, academic, and professional institutions with agricultural entities can help optimize data selection and collection. The critical point, however, is to ensure the continuity of surveying.


