Graphical and Numerical Analysis of the Components of Gene Effect on the Quality Traits of Bread Wheat (Triticum aestivum L.) under Varying Environmental Conditions
Abstract
1. Introduction
2. Materials and Methods
2.1. Plant Material and Field Performance Evaluation
2.2. Graphical and Numerical Approach
2.3. Estimation of Genetic Parameters
3. Results
3.1. Numerical Approach
3.1.1. Protein Content
3.1.2. Sedimentation Value
3.1.3. Gluten: Wet Gluten
3.1.4. Starch Content
3.2. Graphical Analysis
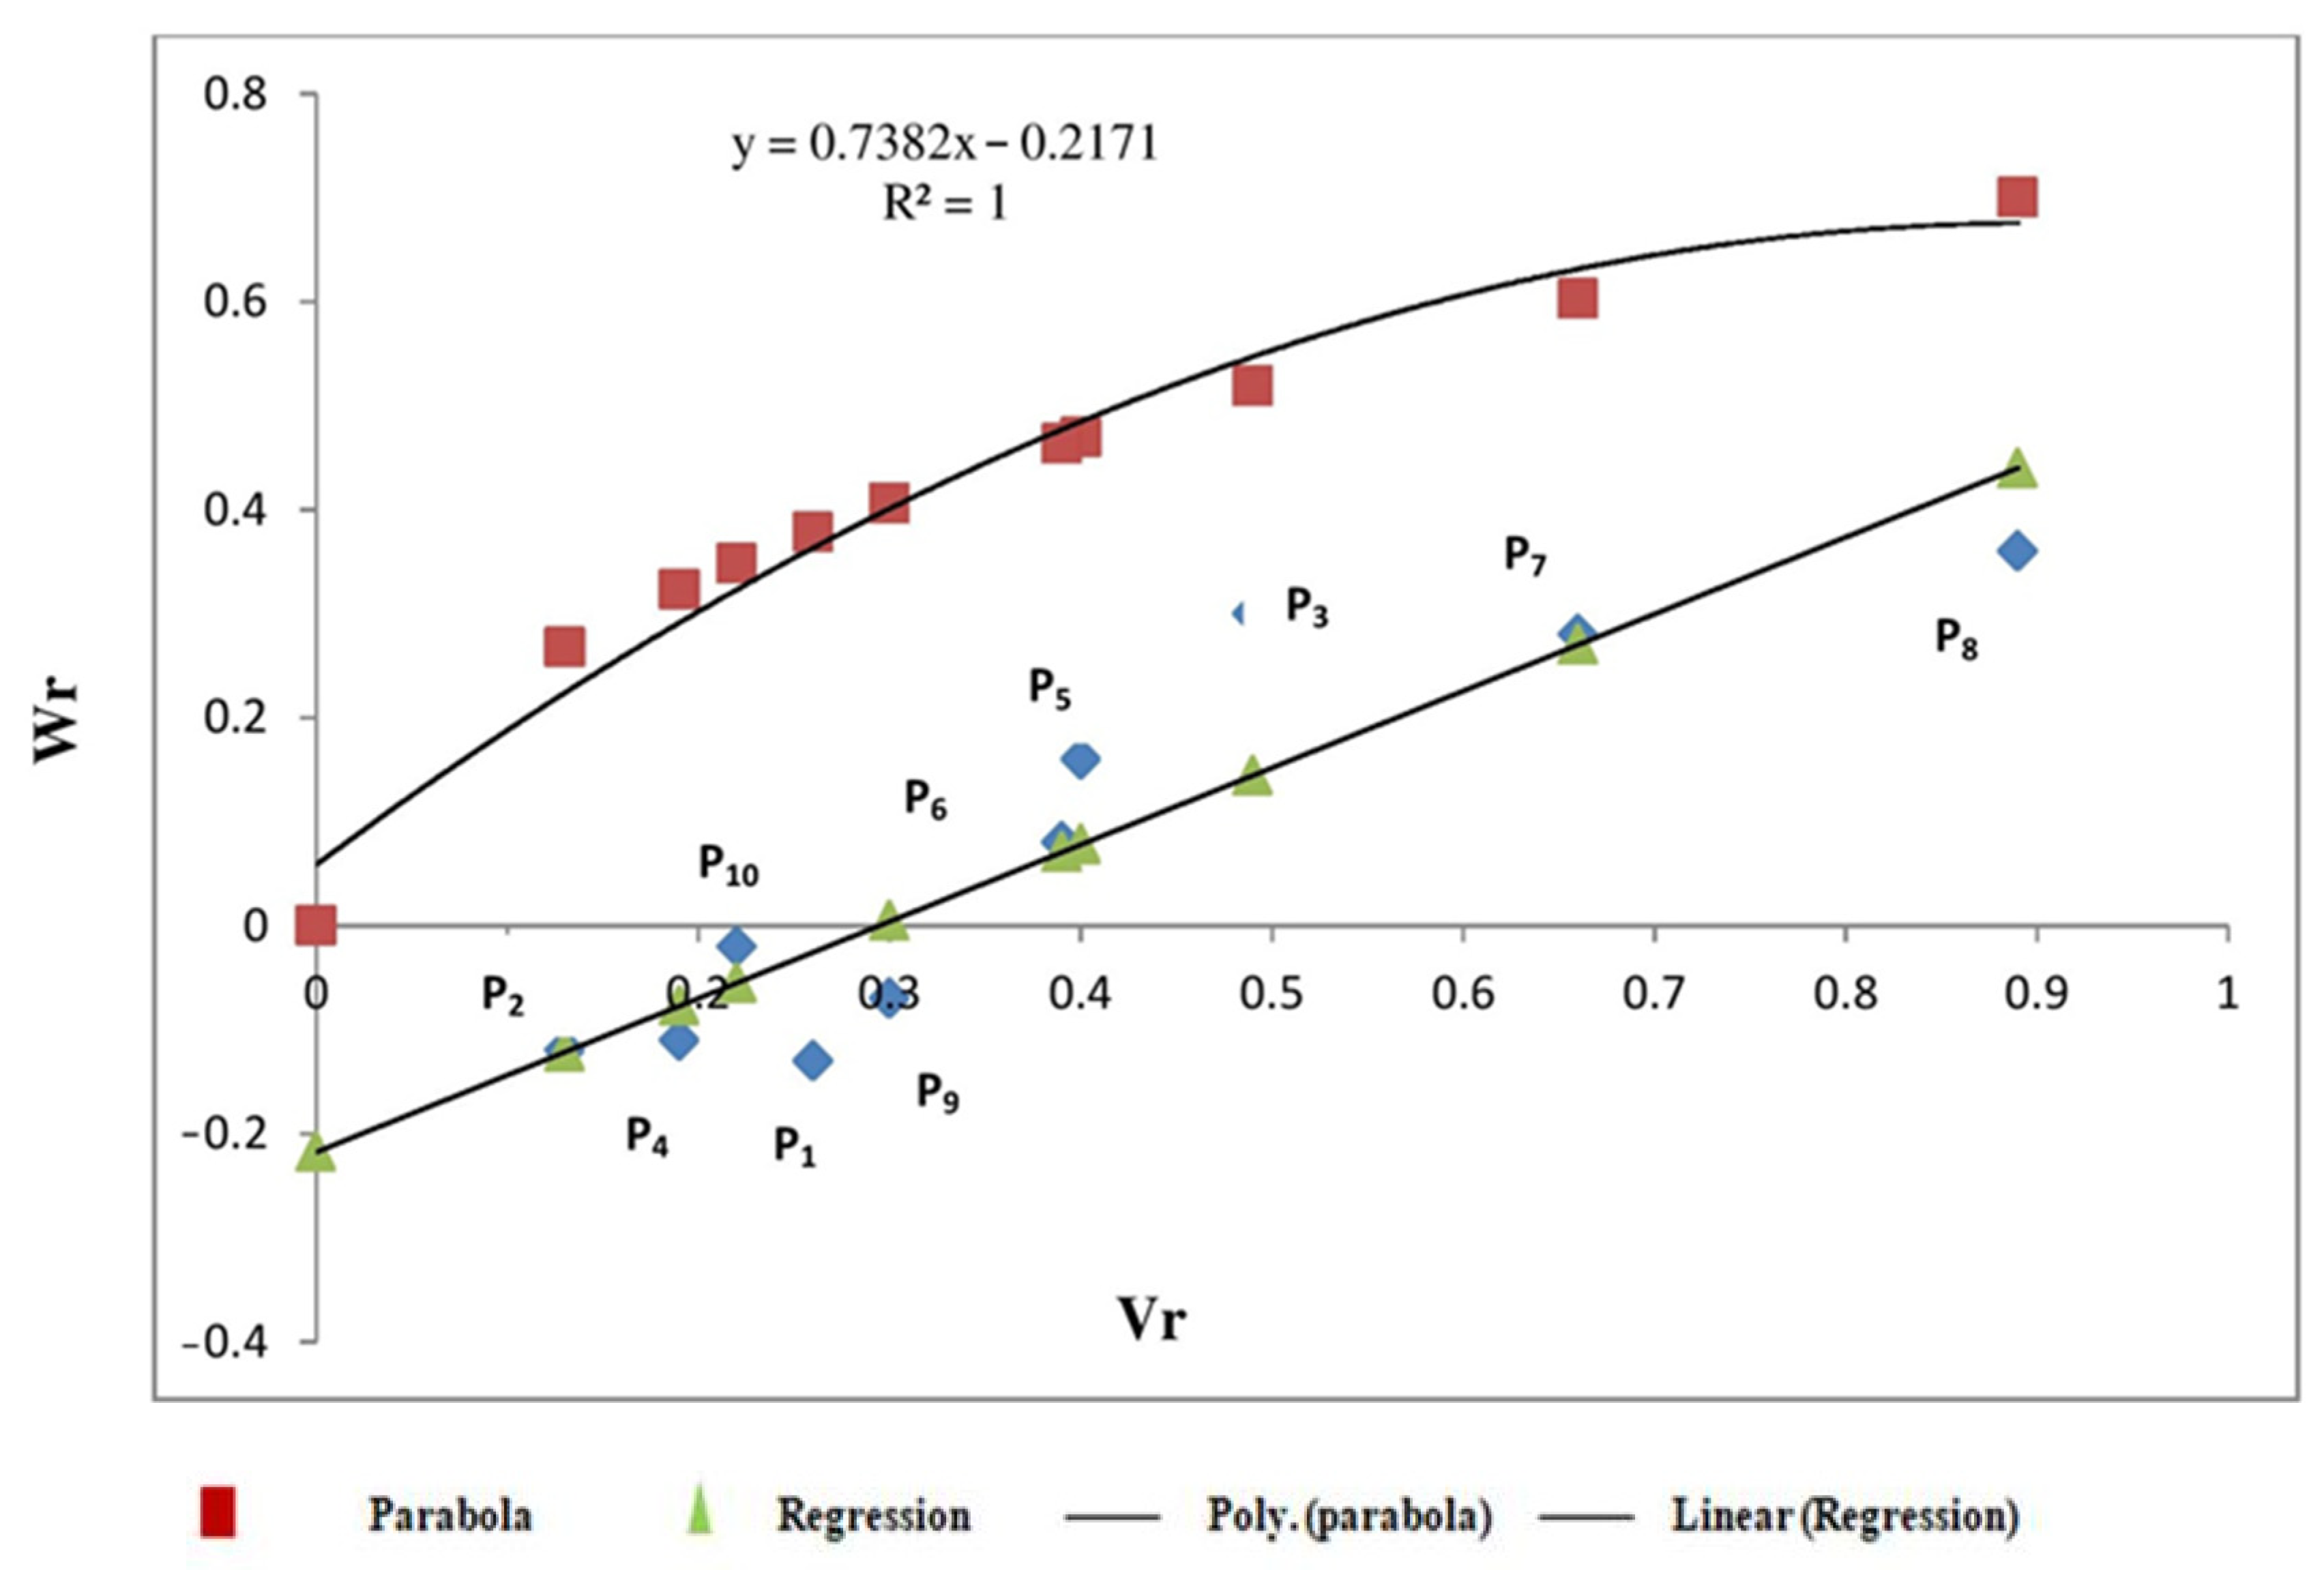
3.2.1. Protein Content
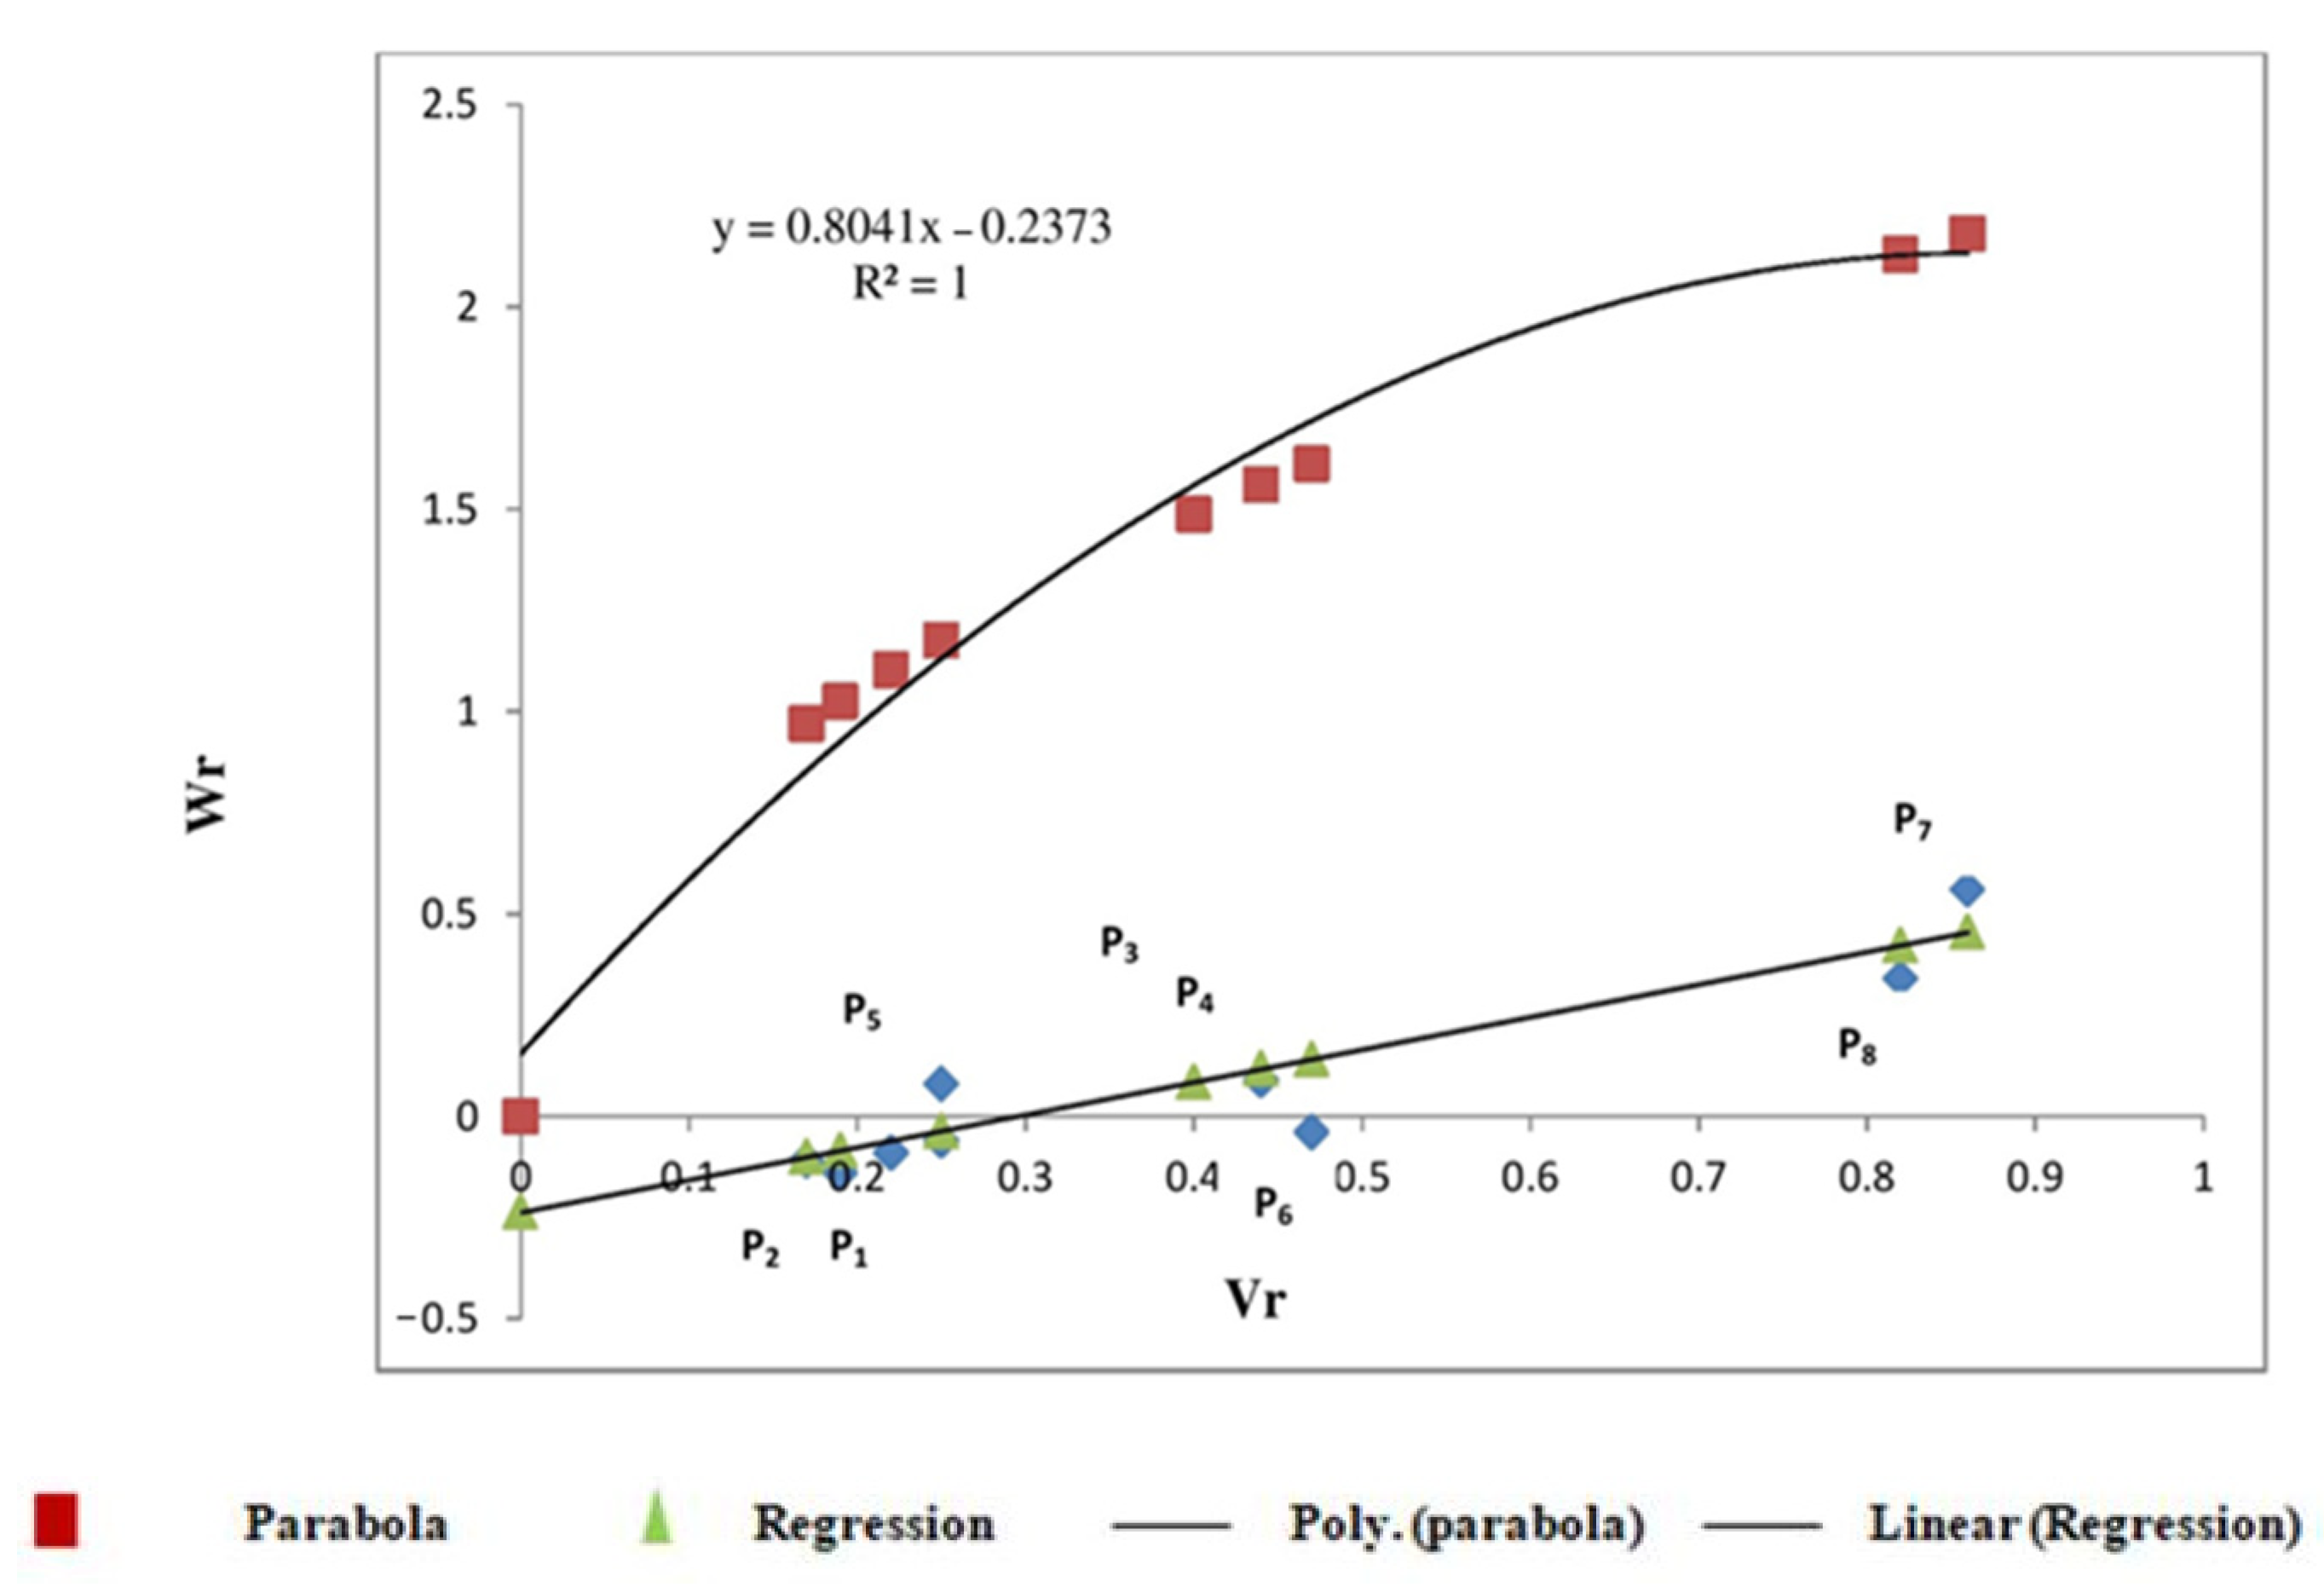
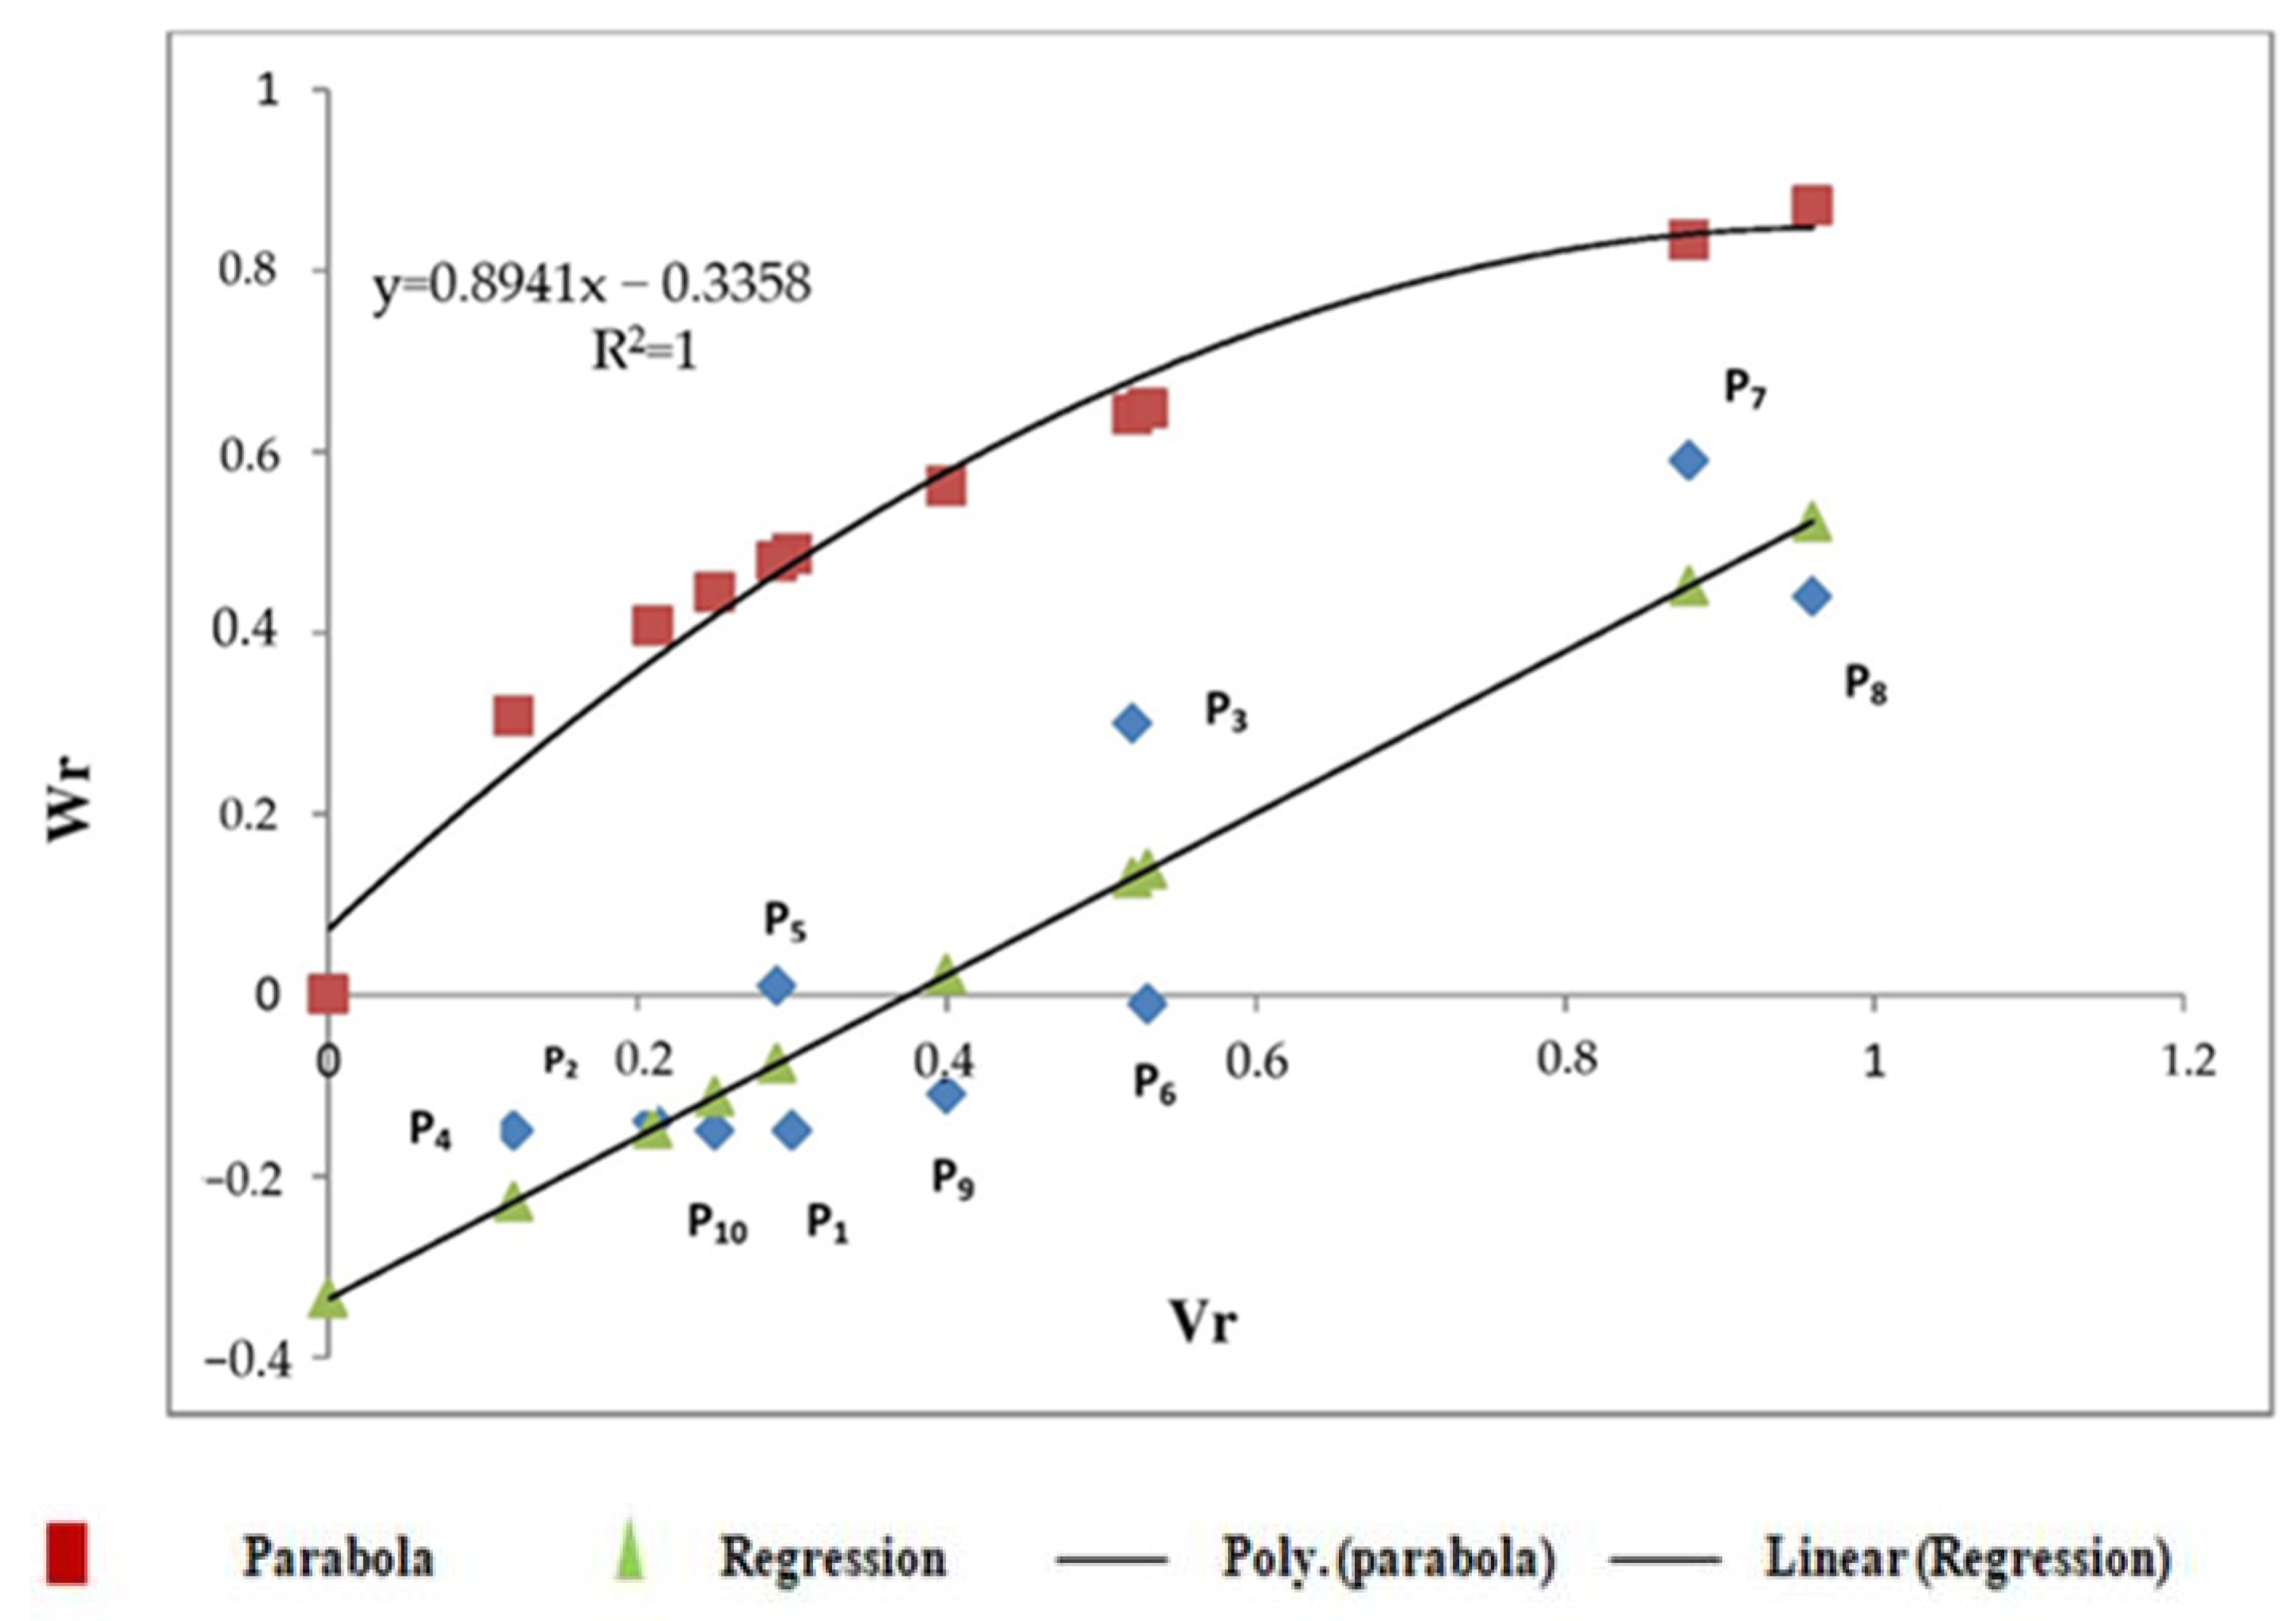
3.2.2. Sedimentation Value

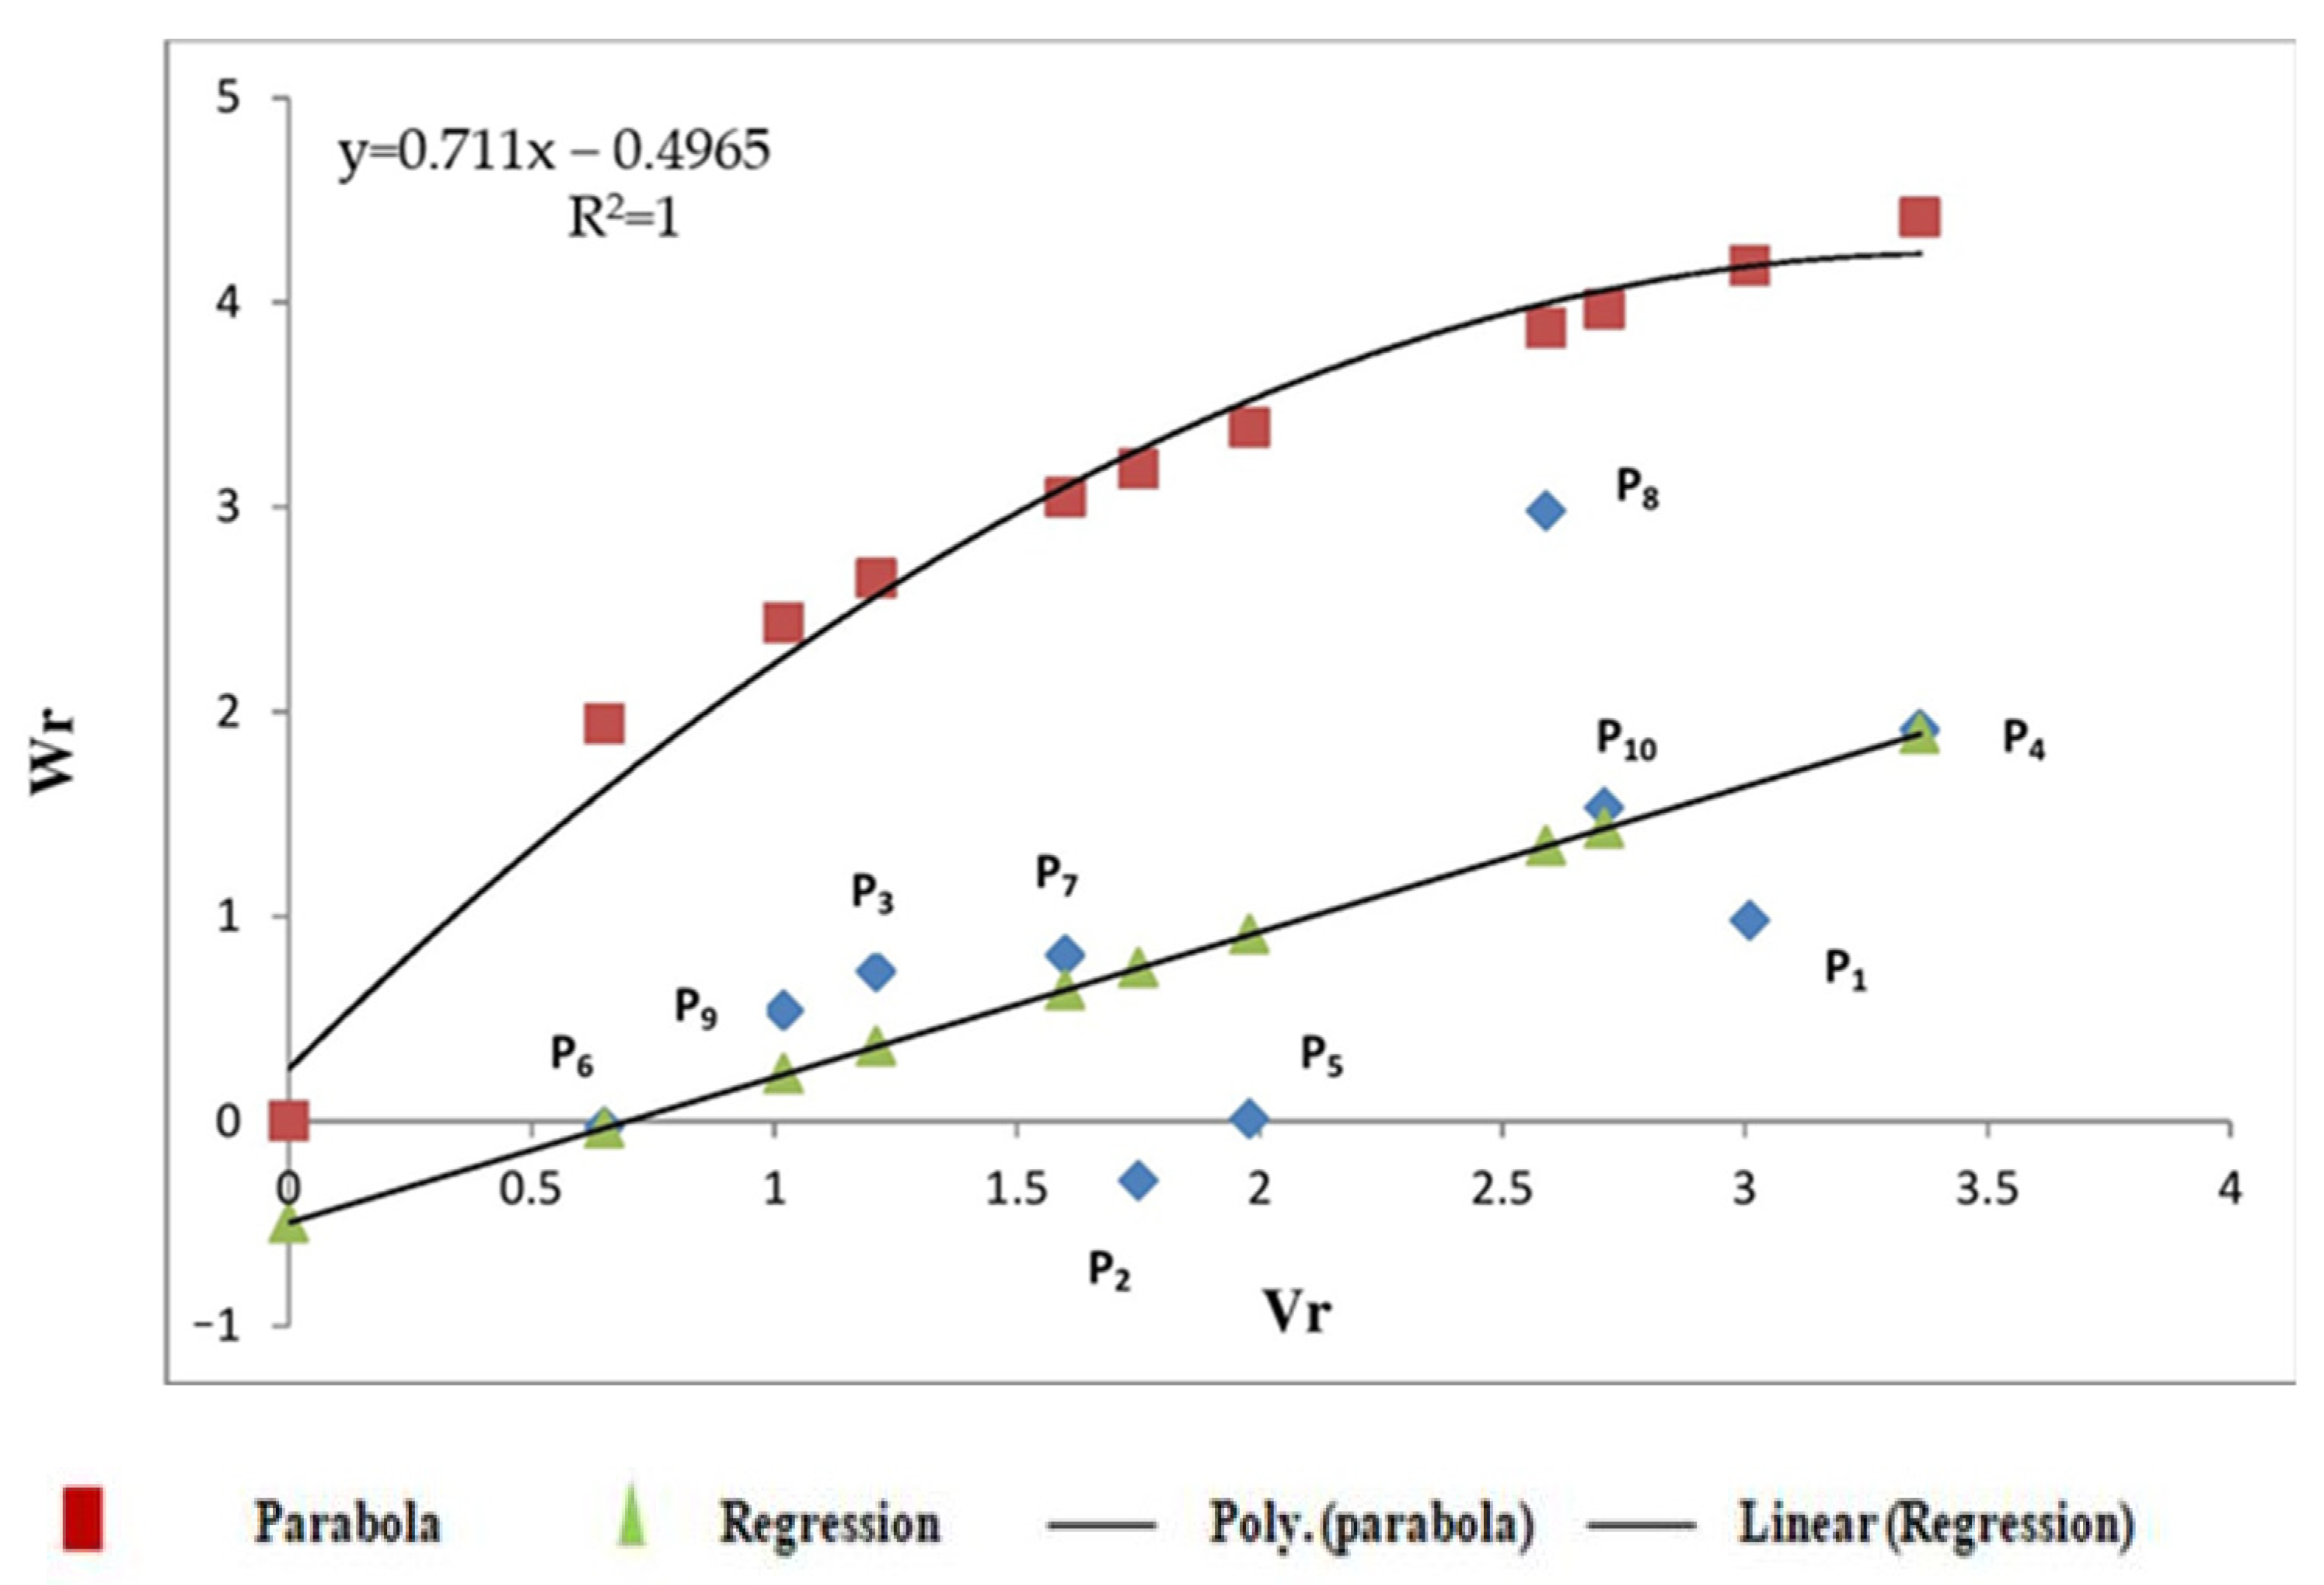
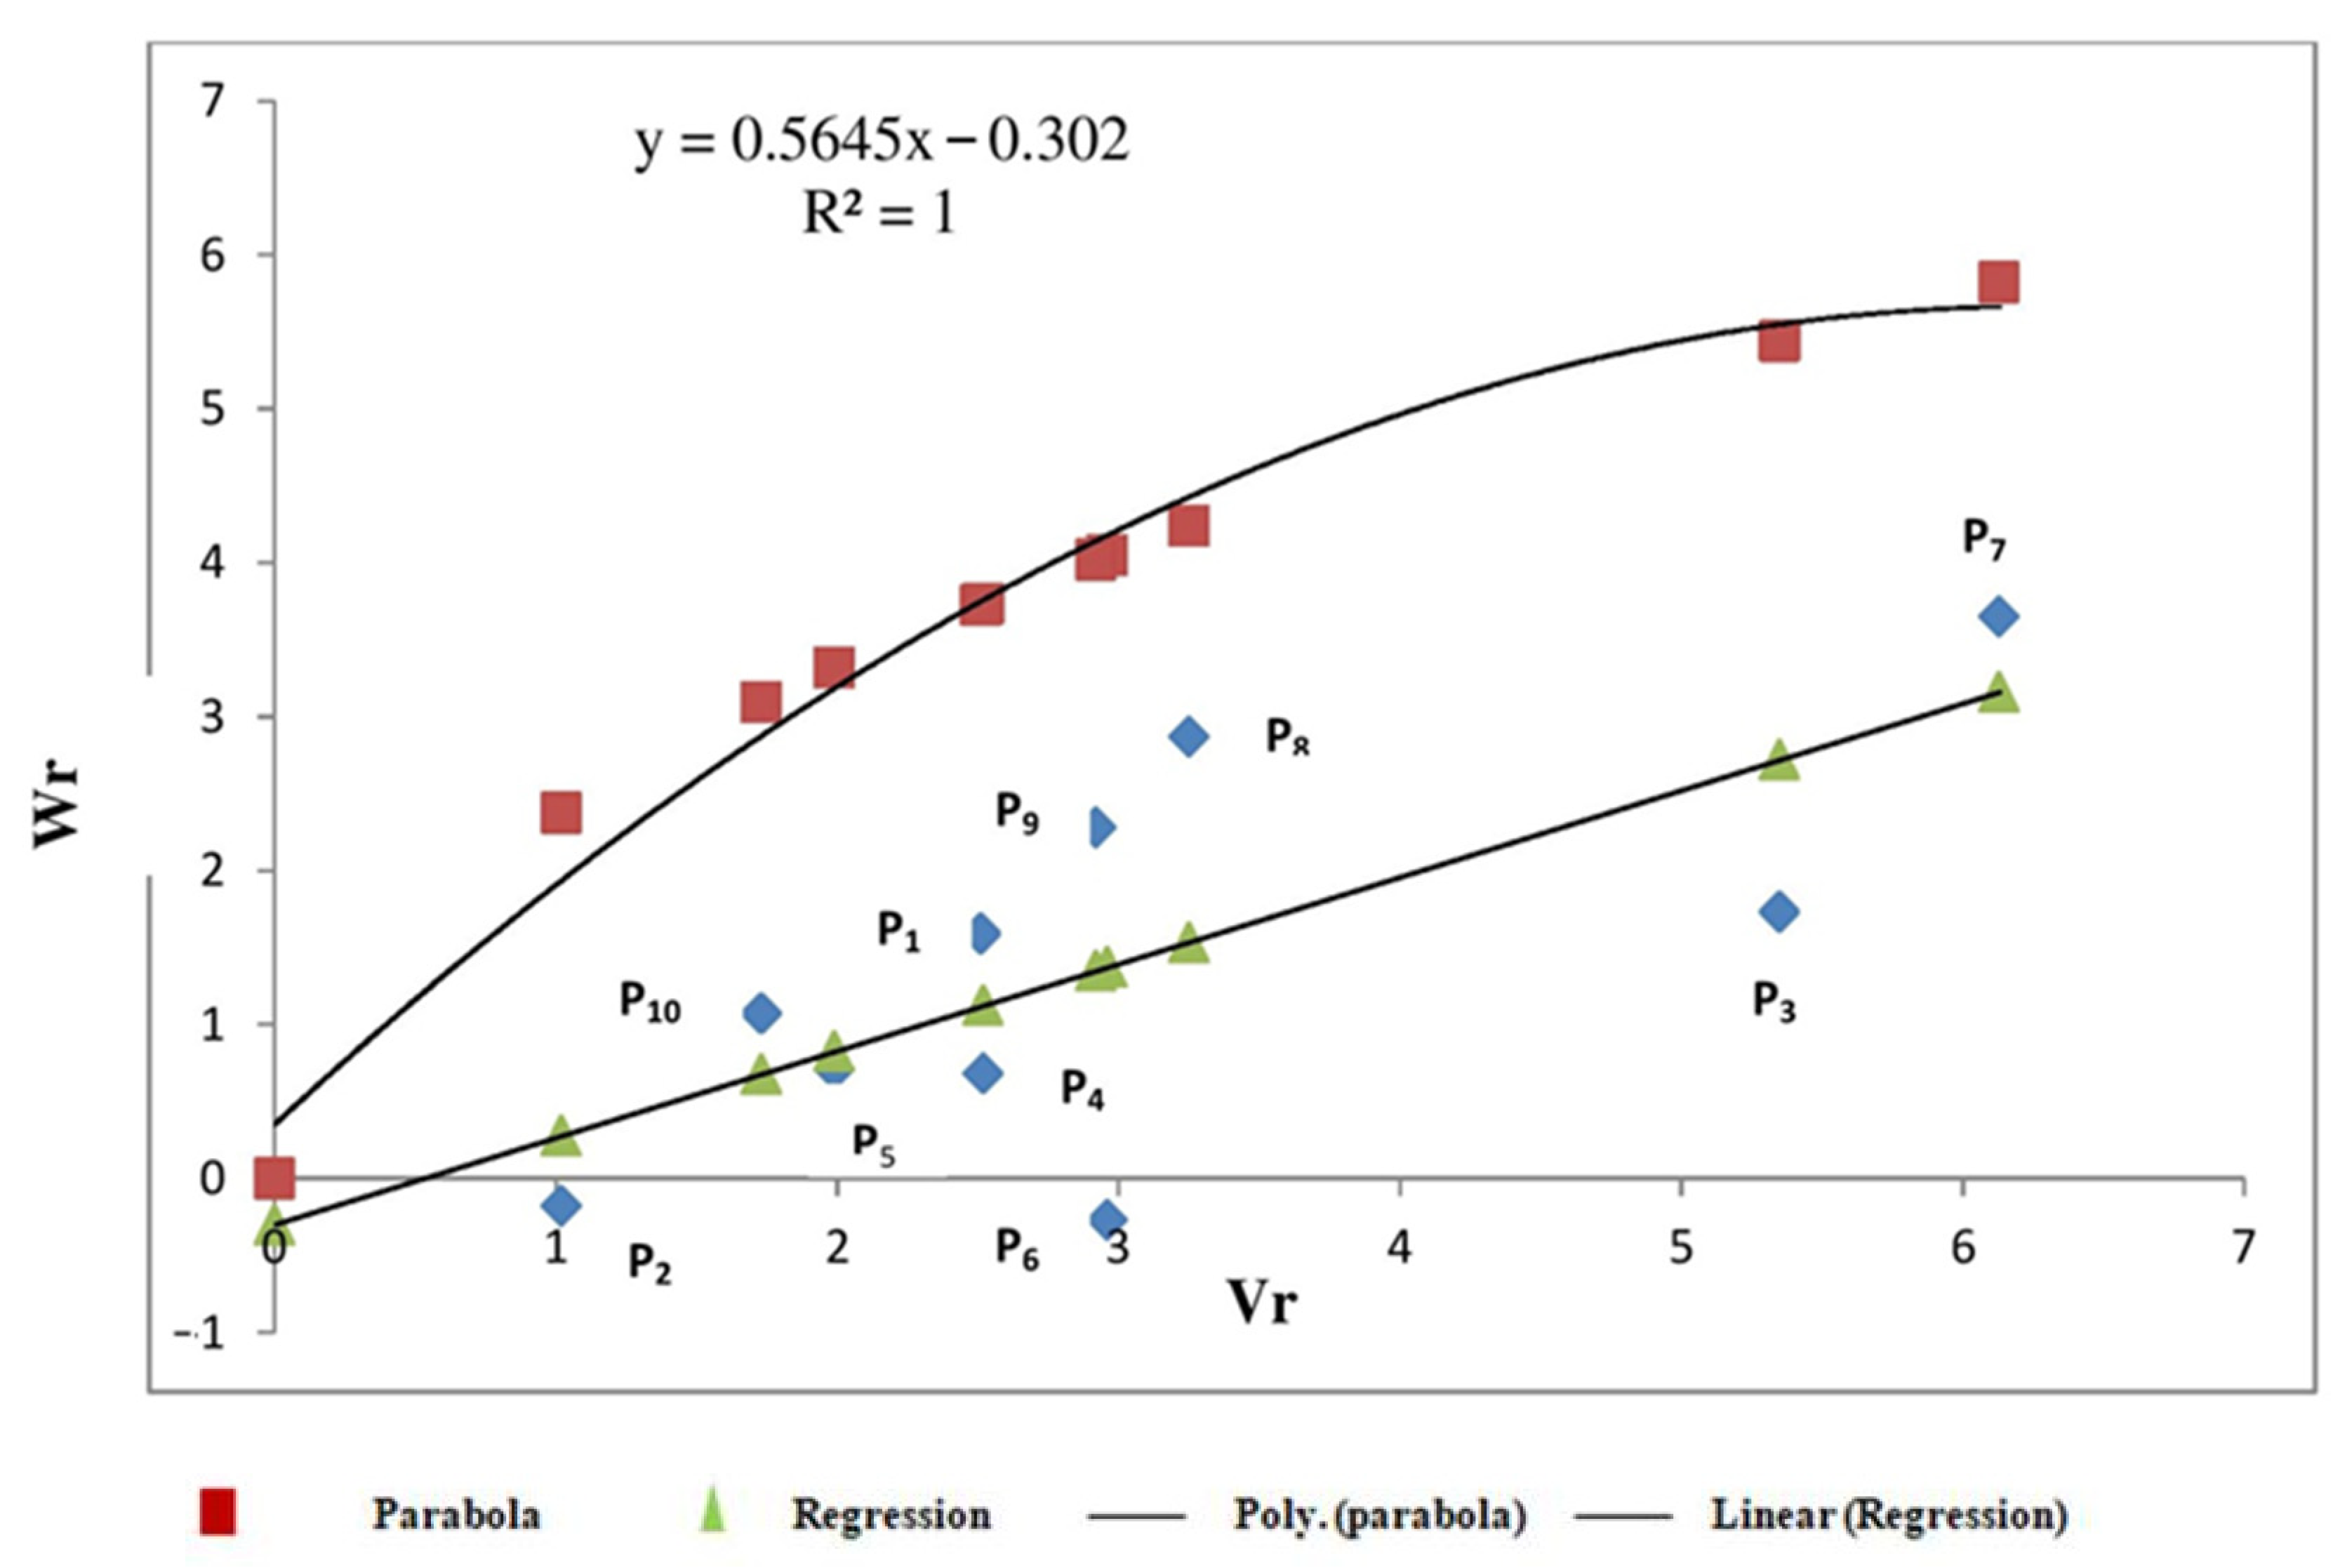
3.2.3. Starch Content
4. Discussion
4.1. Numerical Approach
4.2. Graphical Analysis
5. Conclusions
Supplementary Materials
Author Contributions
Funding
Data Availability Statement
Acknowledgments
Conflicts of Interest
References
- Belderok, B. Bread Making Quality of Wheat: A Century of Breeding in Europe; Kulwer Academic Publisher Belderok: Amsterdam, The Netherlands, 2000; p. 34. [Google Scholar]
- Mohammadi-Joo, S.; Mirasi, A.; Saediaboeshaghi, R.; Amiri, M. Evaluation of bread wheat (Triticum aestivum L.) genotypes based on resistance indices under field conditions. Intl. I. Biosci. 2015, 6, 331–337. [Google Scholar] [CrossRef]
- Qadir, M.; Wang, X.; Baloch, A.H.; Baloch, I.A.; Azeem, M.; Imran, M.; Saleem, M. The impact of drought on phenotypic characters of 5 advance wheat genotypes. Pure Appl. Biol. 2015, 7, 635–642. [Google Scholar] [CrossRef]
- Debasis, P.; Khrrana, P. Wheat Biotechnology: A mini-review. Electron. J. Biotechnol. 2001, 4, 74–102. [Google Scholar] [CrossRef]
- Welch, R.M.; Graham, R.D. Breeding for micronutrients in staple food crops from a human nutrition perspective. J. Exp. Bot. 2004, 55, 353–364. [Google Scholar] [CrossRef]
- Grew, R. Food in Global History; Routledge: New York, NY, USA, 2018. [Google Scholar] [CrossRef]
- White, P.J.; Broadely, M.R. Biofortification of crops with seven mineral elements often lacking in human diets-iron, zinc, copper, calcium, magnesium, selenium & iodine. New Phytol. 2009, 182, 49–84. [Google Scholar] [CrossRef]
- Gomez-Galera, S.; Rojas, E.; Sudhakar, D.; Zhu, C.; Pelacho, A.M.; Capell, T.; Christou, P. Critical evaluation of strategies for mineral fortification of staple food crops. Transgenic Res. 2010, 19, 165–180. [Google Scholar] [CrossRef] [PubMed]
- Hurrell, R.; Ranum, P.; de Pee, S.; Biebinger, R.; Hulthen, L.; Johnson, Q.; Lynch, S. Revised recommendations for iron fortification of wheat flour and an evaluation of the expected impact of current national wheat flour fortification. Programs Food Nutr. Bull. 2010, 31, S7–S21. [Google Scholar] [CrossRef]
- De Valenca, A.W.; Bake, A.; Brouwe, L.D.; Giller, K.E. Agronomic Biofortification of crops to fight hidden hunger in sub-Saharan Africa. Glob. Food Sec. 2017, 12, 8–14. [Google Scholar] [CrossRef]
- Fageria, N.K.; Baligar, V.C. Ameliorating soil acidity of tropical oxisols by liming for crop production. Adv. Agron. 2008, 99, 345–399. [Google Scholar] [CrossRef]
- Fageria, N.K.; Baligar, V.C.; Clark, R.B. Micronutrients in crop production. Adv. Agron. 2002, 77, 85–268. [Google Scholar] [CrossRef]
- Bouis, H.E.; Saltzman, A. Improving nutrition through Biofortification: A Review of evidences from Harvest Plus. 2003 through 2016. Glob. Food Sec. 2017, 12, 49–58. [Google Scholar] [CrossRef] [PubMed]
- Garg, M.; Sharma, N.; Sharma, S.; Kapoor, P.; Kumar, A.; Chandari, V.; Arora, P. Biofortified Crops generated by Breeding agronomy & Transgenic Approaches are improving lives of millions of people around the world. Front. Nutr. 2018, 5, 12. [Google Scholar] [PubMed]
- Ahmadi, J.; Pour-Aboughadareh, A.; Ourang, S.F.; Mehrabi, A.; Sidduqe, K.H.M. Wild Relatives of Wheat: Aegilops–Triticum accessions disclose differential antioxidative and physiological responses toward water stresses. Acta Physiol. Plant. 2018, 40, 1–14. [Google Scholar] [CrossRef]
- Dempewolf, H.; Baute, G.; Anderson, J.; Killian, B.; Smith, C.; Guarion, L. Past and future uses of wild Relative in Crop Breeding. Crop Sci. 2017, 57, 1070–1082. [Google Scholar] [CrossRef]
- Nadeem, M.A.; Yeken, M.Z.; Tekin, M.; Mustafa, Z.; Hatipoğlu, R.; Aktaş, H.; Baloch, F.S. Contribution of Landraces in Wheat Breeding. In Wheat Landraces; Springer: Cham, Switzerland, 2021; pp. 215–258. [Google Scholar]
- Breseghello, F.; Coelho, A.S.G. Traditional and Modern Plant Breeding Methods with Examples in Rice (Oryza sativa L). J. Agric. Food Chem. 2013, 61, 8277–8286. [Google Scholar] [CrossRef]
- Cui, Y.; Zhong, F.; Xu, J.; Li, Z.; Xu, S. Mapping quantitative trait loci in selected breeding populations: A Segregation distortion approach. Heredity 2015, 115, 538–546. [Google Scholar] [CrossRef]
- Moose, S.P.; Mumm, R.H. Molecular plant breeding as the foundation for 21st century crop improvement. Plant Physiol. 2008, 147, 969–977. [Google Scholar] [CrossRef]
- Lopes, M.S.; Reynolds, M.P.; Jalal-Kamali, M.R.; Moussa, M.; Feltaous, Y.; Tahir, I.S.A.; Barma, N.; Vargas, M.; Mannes, Y.; Baum, M. The yield correlations of selectable physiological traits in a population of advanced spring wheat lines grown in warm and drought environments. Field Crops Res. 2012, 128, 129–136. [Google Scholar] [CrossRef]
- Li, Y.; Wu, Y.; Hernandez-Espinoza, N.; Pena, R.J. The influence of drought and heat stress on the expression of end-use quality parameters of common wheat. J. Cereal Sci. 2013, 57, 73–78. [Google Scholar] [CrossRef]
- Jinks, J.L.; Hayman, B.I. The analysis of diallel crosses. Maize Genet. Newsl. 1953, 27, 48–54. [Google Scholar]
- Hayman, B.I. The analysis of variance of diallel tables. Biometrics 1954, 10, 235–244. [Google Scholar] [CrossRef]
- Hayman, B.I. The theory and analysis of diallel crosses. Genetics 1954, 39, 789–809. [Google Scholar] [CrossRef] [PubMed]
- Mather, K.; Jinks, J.L. Biometrical Genetics, the Study of Continuous Variation, 3rd ed.; Chapman and Hall Ltd.: London, UK, 1982. [Google Scholar]
- Ahuja, S.; Malhotra, P.K.; Bhatia, V.K.; Prasad, R. Statistical Package for Agricultural Research (SPAR 2.0). J. Ind. Soc. Agril. Statist. 2008, 62, 65–74. [Google Scholar]
- Hussain, M.; Kiani, T.T.; Shah, K.N.; Ghafoor, A.; Rabbani, A. Gene action studies for protein quality traits in zea mays L. under normal and drought conditions. Pak. J. Bot. 2015, 47, 57–61. [Google Scholar]
- Al-Naggar AM, M.; Atta MM, M.; Ahmed, M.A.; Younis AS, M. Numerical and graphical diallel analyses of maize (Zea mays L.) agronomic and yield traits under well watering and water deficit at silking. Arch. Curr. Res. Int. 2016, 5, 1–18. [Google Scholar] [CrossRef]
- Rohman, M.M. Genetic action and potence ratio of maize in an 8 × 8 diallel cross growing under saline condition. J. Plant Breed. Crop Sci. 2019, 11, 17–25. [Google Scholar] [CrossRef]
- Kumar, D.; Kerkhi, S.A.; Singh, Y.P.; Harinarayan, B. Regression analysis for yield components and quality traits in wheat. J. Wheat Res. 2016, 8, 25–29. [Google Scholar]
| Sr. No. | Genotypes | Pedigree | Source |
|---|---|---|---|
| 1 | GW 451 | GW324/4/CROC_1/AE.SQUARROSA (205)/JUP/JY/3/SKAUZ/4/KAUZ/5/GW 339 | Center of Excellence for Research on Wheat, SDAU, Vijapur 382 870 |
| 2 | GW 496 | HD 2285/CPAN 1861 | |
| 3 | LOK 1 | S 308/S 311 | |
| 4 | GW 322 | PBW 173/GW 196 | |
| 5 | GW 366 | DL 802-3/GW 232 | |
| 6 | HI 1544 | HIND162/BOBWHITE/CPAN 2099 | |
| 7 | GW 173 | TW 275-7-6-10/LOK1 | |
| 8 | GW 11 | LOK 1/HW 1042//LOK 1 | |
| 9 | HD 2864 | DL509-2/DL377-8 | |
| 10 | UAS 385 | GW344/UAS239/DWR162 | |
| Standard check varieties | |||
| 1 | MACS 6222-TS | HD 2189*2//MASC 2496 | |
| 2 | HD 2932-LS | KAUZ/STAR//HD 2643 | |
| SN | Characters | t2 Test | b (Regression) | ||||||
|---|---|---|---|---|---|---|---|---|---|
| E1 | E2 | E3 | E4 | E1 | E2 | E3 | E4 | ||
| 1 | Protein content | 0.09 | 2.37 | 0.019 | 1.33 | 0.80 $$ | 0.32 ++ | 0.89 $$ | 0.44 + |
| 2 | Sedimentation value | 0.43 | 0.13 | 0.75 | 0.46 | 0.90 $$ | 0.71 $ | 0.56 $ | 0.64 |
| 3 | Gluten: wet gluten | 3.07 | 1.63 | 1.40 | 1.74 | 0.26 ++ | 0.32 + | 0.29 + | 0.50 |
| 4 | Starch content | 2.05 | 0.25 | 3.09 | 10.59 ** | 0.73 $$ | 0.25 | −0.0008 ++ | −0.85 |
| 5 | Iron content | 31.63 ** | 1.22 | 15.94 ** | 1.27 | −0.007 ++ | −0.19 ++ | 0.17 ++ | −0.23 ++ |
| 6 | Zinc content | 12.52 ** | 0.03 | 9.72 ** | 1.49 | 0.30 $++ | 0.43 | 0.27 ++ | −0.14 ++ |
| Genetic Components | Protein Content | Sedimentation Value | ||||||
|---|---|---|---|---|---|---|---|---|
| E1 | E2 | E3 | E4 | E1 | E2 | E3 | E4 | |
| 0.00 | 0.05 * | 0.06 | 0.05 ** | 0.44 | 0.50 ** | 0.62 * | 0.67 ** | |
| 0.77 ** | 0.15 ** | 0.72 ** | 0.13 ** | 6.05 ** | 5.29 ** | 4.91 ** | 5.28 ** | |
| 1.26 ** | 0.29 ** | 1.21 ** | 0.17 | 7.02 ** | 7.12 ** | 4.41 ** | 7.05 ** | |
| 2.11 ** | 0.70 ** | 2.13 ** | 0.60 ** | 12.81 ** | 8.67 ** | 10.29 ** | 8.21 ** | |
| 1.40 ** | 0.47 ** | 1.42 ** | 0.44 ** | 8.98 ** | 5.73 ** | 7.81 ** | 5.41 ** | |
| 4.21 ** | 0.21 ** | 5.09 ** | 0.12 ** | 26.67 ** | 0.20 | 22.50 ** | 0.46 | |
| (/)0.5 | 1.65 | 2.17 | 1.72 | 2.19 | 1.45 | 1.28 | 1.45 | 1.25 |
| /4 | 0.17 | 0.17 | 0.17 | 0.18 | 0.18 | 0.17 | 0.19 | 0.16 |
| KD/KR | 2.95 | 2.62 | 2.91 | 1.88 | 2.33 | 3.22 | 1.90 | 3.30 |
| / | 3.01 | 0.45 | 3.58 | 0.27 | 2.97 | 0.03 | 2.88 | 0.09 |
| % Heritability (narrow sense) | 47.09 | 19.92 | 38.07 | 17.02 | 44.46 | 59.75 | 36.94 | 57.76 |
| Genetic Components | Gluten: Wet Gluten | Starch Content | ||||||
|---|---|---|---|---|---|---|---|---|
| E1 | E2 | E3 | E4 | E1 | E2 | E3 | E1 | |
| 0.34 | 0.47 ** | 0.50 * | 0.45 ** | 0.28 ** | 0.21 ** | 0.21 ** | 0.28 ** | |
| 2.07 ** | 0.28 | 1.89 ** | 0.88 ** | 0.27 ** | 0.41 ** | −0.04 | 0.27 ** | |
| 3.61 | −0.03 | 2.80 | 0.57 | 0.35 ** | 0.92 ** | −0.10 | 0.35 ** | |
| 7.49 ** | 3.10 ** | 5.77 ** | 2.67 ** | 1.04 ** | 1.15 ** | 0.86 ** | 1.04 ** | |
| 4.83 ** | 2.74 ** | 3.84 ** | 2.21 ** | 0.81 ** | 0.53 ** | 0.64 ** | 0.81 ** | |
| 10.60 ** | 3.43 ** | 8.62 ** | 0.16 | 4.26 ** | −0.07 | 0.20 | 4.26 ** | |
| (/)0.5 | 1.90 | 3.31 | 1.75 | 1.75 | 1.97 | 1.67 | 0.00 | 1.97 |
| /4 | 0.16 | 0.22 | 0.17 | 0.21 | 0.20 | 0.11 | 0.19 | 0.20 |
| KD/KR | 2.69 | 0.97 | 2.47 | 1.46 | 1.99 | 5.06 | 1.74 | 1.99 |
| / | 2.19 | 1.25 | 2.24 | 0.07 | 5.26 | −0.13 | 0.31 | 5.26 |
| % Heritability (narrow sense) | 28.37 | 5.35 | 27.49 | 18.38 | 12.92 | 28.22 | −2.20 | 12.92 |
Publisher’s Note: MDPI stays neutral with regard to jurisdictional claims in published maps and institutional affiliations. |
© 2022 by the authors. Licensee MDPI, Basel, Switzerland. This article is an open access article distributed under the terms and conditions of the Creative Commons Attribution (CC BY) license (https://creativecommons.org/licenses/by/4.0/).
Share and Cite
Chaudhari, G.R.; Patel, D.A.; Kalola, A.D.; Kumar, S. Graphical and Numerical Analysis of the Components of Gene Effect on the Quality Traits of Bread Wheat (Triticum aestivum L.) under Varying Environmental Conditions. Agriculture 2022, 12, 2055. https://doi.org/10.3390/agriculture12122055
Chaudhari GR, Patel DA, Kalola AD, Kumar S. Graphical and Numerical Analysis of the Components of Gene Effect on the Quality Traits of Bread Wheat (Triticum aestivum L.) under Varying Environmental Conditions. Agriculture. 2022; 12(12):2055. https://doi.org/10.3390/agriculture12122055
Chicago/Turabian StyleChaudhari, Gita R., D. A. Patel, A. D. Kalola, and Sushil Kumar. 2022. "Graphical and Numerical Analysis of the Components of Gene Effect on the Quality Traits of Bread Wheat (Triticum aestivum L.) under Varying Environmental Conditions" Agriculture 12, no. 12: 2055. https://doi.org/10.3390/agriculture12122055
APA StyleChaudhari, G. R., Patel, D. A., Kalola, A. D., & Kumar, S. (2022). Graphical and Numerical Analysis of the Components of Gene Effect on the Quality Traits of Bread Wheat (Triticum aestivum L.) under Varying Environmental Conditions. Agriculture, 12(12), 2055. https://doi.org/10.3390/agriculture12122055


