Article

The Agro-Climatic Change Characteristics across China during the Latest Decades

1
State Key Laboratory of Severe Weather, Chinese Academy of Meteorological Sciences, 46 Zhongguancun South St., Beijing 100081, China
2
National Meteorological Center, 46 Zhongguancun South St., Beijing 100081, China
*
Author to whom correspondence should be addressed.
Agriculture 2022, 12(2), 147; https://doi.org/10.3390/agriculture12020147
Submission received: 29 November 2021 / Revised: 17 January 2022 / Accepted: 19 January 2022 / Published: 21 January 2022
(This article belongs to the Section Ecosystem, Environment and Climate Change in Agriculture)

Abstract

:
Climate change has been highlighted over the last decades worldwide, with pronounced higher warming trends for China. Induced by climate change, to some extent, agricultural production has changed, as well as the climatic resources during the agricultural growing season. An obvious longer potential agricultural growing season (PAGS) was detected in the latest decades from 1961–2020. The spatial–temporal characteristics of change and variation of climatic resources during the PAGS were explored, utilizing comparisons of the differences in mean magnitude, standard deviation, and trends. In the period of 1991–2020 relative to 1961–1990, alterations in PAGS were characterized by increases of 0–1.5 °C in mean air temperature overall, 0.8–23.8% increases in precipitation in the southeast, northeast, and west, as well as a decrease of 2.1–10.2% in insolation in central-south regions but an increase of 0.3–6.7% in the north and west. The features were pronounced during the PAGS in the primary agricultural zones as follows: (1) Northeast China, increasing and stable temperature but unstable precipitation and insolation; (2) North, eastern-west, and Southwest China, increasing but unstable temperature, decreasing but stable precipitation as well as decreasing and unstable insolation; (3) Southeast China, increasing but unstable temperature and precipitation as well as decreasing and unstable insolation; (4) West China, increasing but unstable temperature and precipitation as well as increasing but unstable insolation. Further comparisons between agro-climatic change and climate change indicated that temperature alterations during the PAGS were less numerous while precipitation and insolation were more unstable than the changes during the whole year. These findings can assist the understanding of regional agricultural climate changes and guide agricultural production practices in response.

1. Introduction

Climate change has been predicted for decades and will remain a catastrophic alteration that will be under serious scientific and public scrutiny long into the future. The Fifth Assessment Report of the Intergovernmental Panel on Climate Change [1] reported that global mean surface air temperature has increased by 0.85 °C from 1880 to 2020 and even by 0.72 °C from 1951 to 2012 [2]. During the last 20 years (2001–2020), warming was most obvious, with an increase of 0.99 °C relative to 1850–1900 [3]. Prevailing scientific investigations and modeling have indicated that the occurrence of precipitation events will increase, and more intense global events are expected [4,5]. In China, higher temperature increases have been recorded with a tendency of 0.26 °C per decade from 1951 to 2020 [6]. The annual precipitation during the past decades has been characterized by considerable regional differences with an obvious increase across northwestern China [3].
Variation of climatic conditions over time is another hotpot when assessing the impact of climate change, except for alterations of mean values. For example, more frequent and intense heatwaves have been detected in mid-eastern China [7,8], and precipitation patterns have been altered [9] and particularly amplified over wet regions where the increase is twice that of the mean precipitation [10]. These global scale alterations in the climate have significant effects on the human, plant, and animal biospheres; these effects reach the social economy and many other human endeavors. Climate alterations also have a huge impact on agricultural production because agriculture is dominated by thermal, water, and insolation factors [11].
Climate change has been reflected in alterations in crops grown and productivity. For example, the length of the crop growing season has increased at least 1.0 d per decade since 1960 across China [12]. As a result of climate warming, there is a general trend for earlier spring and summer phenophases but later autumn phenophases [13]. The phenological dates for maize and wheat, e.g., flower and maturity date, have been found to generally advance [14]. It was recently reported that climate change slowed the growth rate in agricultural productivity between 1961 and 2020, and the annual fluctuation below the growth trend can be attributed to unfavorable weather such as drought, heatwaves or floods [15,16]. Agriculture is vulnerable, very sensitive to, and closely connected with climate change [17,18,19], and climate change can also be affected by the change in agriculture. Whilst the adverse impacts of climate change on crop yield have been estimated, these can be substantially moderated by adaptations such as adjustment in planting and harvesting dates and migration and irrigation expansion for crops [16,20]. Continued and alternative adaptations will be needed, not only in the current time period, but also in the future, given that climate change has negative impacts on crop production if no adaptation is implemented [21]. It is imperative to assess the characteristics of the agriculture growing season and its climatic resources, as they are fundamental and important determinants for guiding agricultural adaptations in response to climate change.
To our knowledge, insights in the alterations and characteristics of the agricultural growing season and within climatic resources, i.e., thermal, water, and insolation factors, are currently lacking for latest decades. What is the difference in the climate change and variation between agricultural growing seasons and natural changes throughout the whole year? As the spatial heterogeneity of climatic changes also has regional effects on agricultural production [22,23,24], a systematic study of spatial–temporal change and variation of climatic variables such as temperature, precipitation, and insolation during the season of agricultural production is needed for China, which can help us to better understand the linkage between climate change and agricultural production.
In the current study, we addressed this by collating up-to-date meteorological observations over the latest 60 years from >2000 weather monitoring stations across mainland China as primary data to explore the effect of climate change on the agricultural growing season and the features of climate change and variation during the dynamic agricultural growing season.

2. Materials and Methods
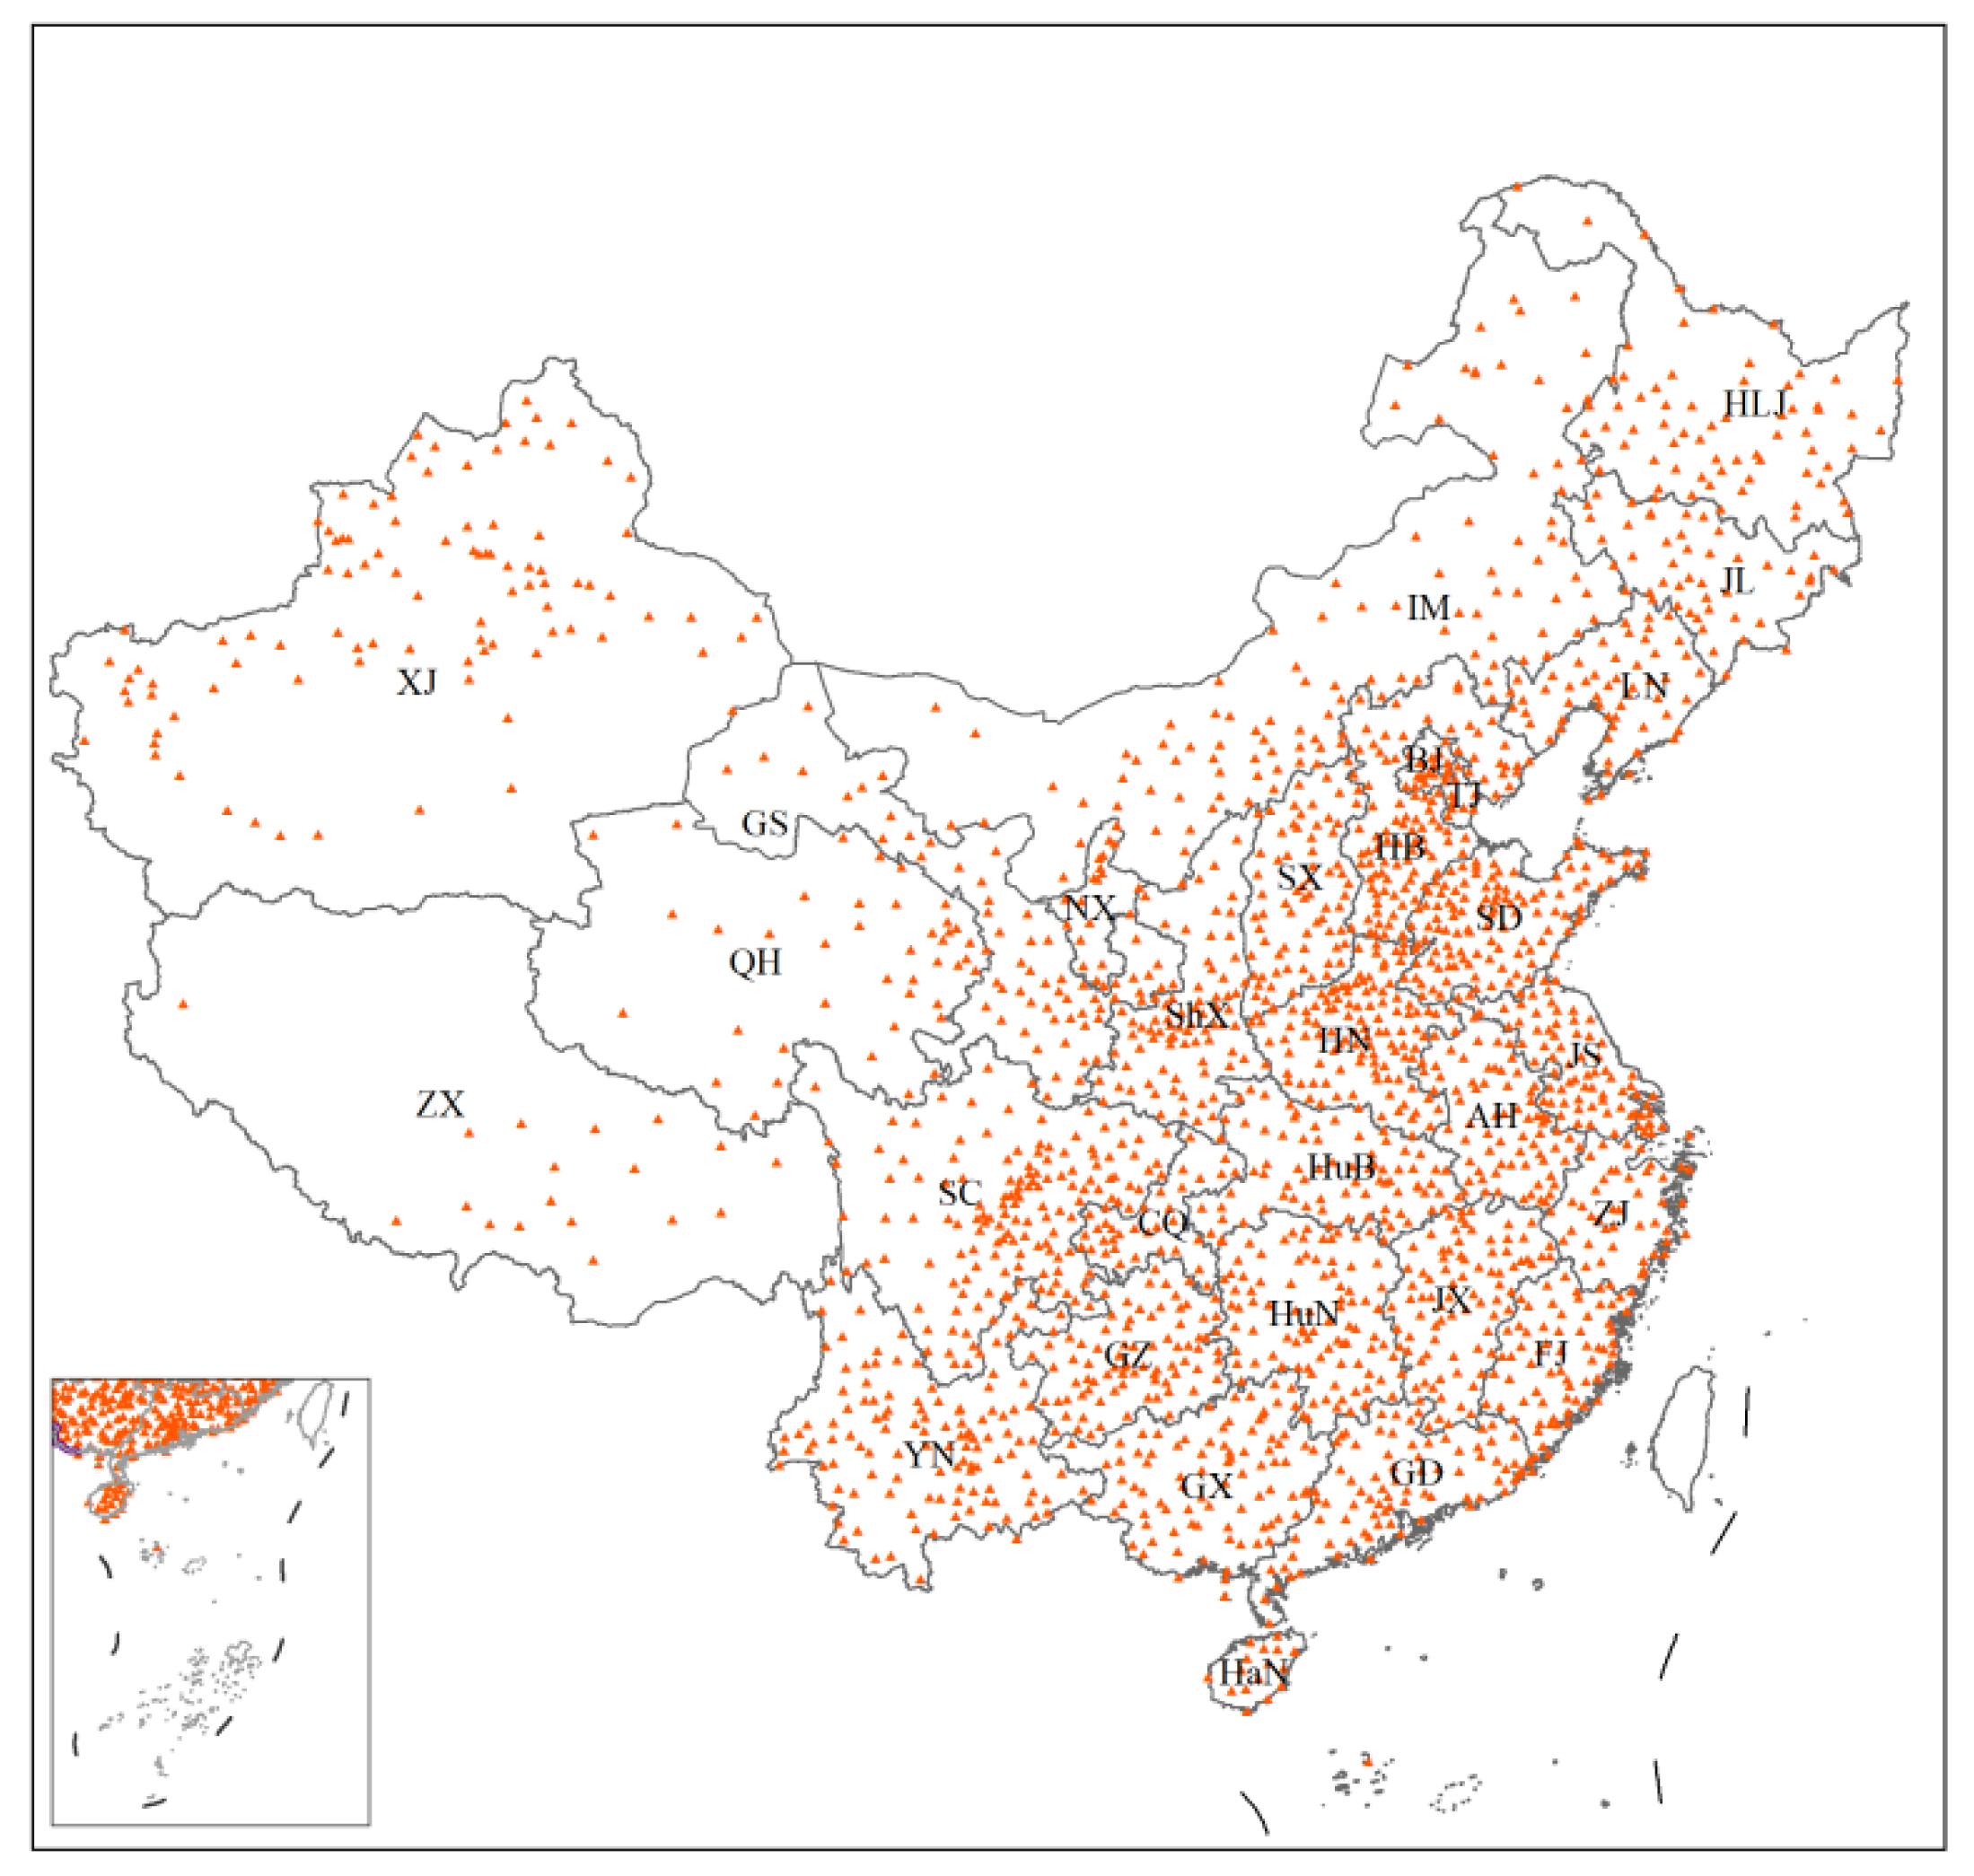
2.1. Data Resources

The domain of this study was across mainland China and included the provinces Heilongjiang (HLJ), Jilin (JL), Liaoning (LN), Inner Mongolia (IM), Xingjiang (XJ), Gansu (GS), Qinghai (QH), Ningxia (NX), Shannxi (ShX), Shanxi (SX), Beijing (BJ), Tianjin (TJ), Hebei (HB), Henan (HN), Shandong (SD), Jiangsu (JS), Shanghai (ShH), Anhui (AH), Hubei (HuB), Zhejiang (ZJ), Jiangxi (JX), Hunan (HuN), Fujian (FJ), Guangdong (GD), Guangxi (GX), Hainan (HaN), Chongqing (CQ), Guizhou (GZ), Sicuan (SC), Yunnan (YN), and Xizang (XZ), as shown in Figure 1. There were 2057 meteorological observation stations with complete records from 1961 to 2020 across the domain, which were obtained from the China Meteorological Data Sharing Service System of China Meteorological Administration. The observed records of daily mean air temperature (unit was °C), precipitation (unit was mm), and insolation (unit was h) were strictly quality-controlled to maintain internal long-term consistency and homogeneity, and remained missing records were replaced by the mean magnitude of the same date during 1961–2020.

2.2. Indices for Agro-Climatic Change and Variation

The threshold for the start time point of an active agriculture growing season was set at 10 °C, according to the general agreement in previous publications [25,26]. The period between the first date (FD) with daily mean air temperature ≥ 10 °C and the last date (LD) with daily mean air temperature ≤ 10 °C was thus defined as the length of the potential agricultural growing season (PAGS), implying the potential time period for major crop production. The values of FD and LD were calculated by the 5-day moving average method [27,28].
It was recommended by the World Meteorological Organization [29] that a climatic baseline of 30 years should be updated every 10 year. Thus, 1991–2020 was taken as the current climatic baseline. In addition to an analysis of average agro-climatic conditions as well as their linear trends in 1991–2020, a comparison was conducted between the periods 1991–2020 and 1961–1990. A dynamic PAGS in each year from 1961 to 2020 was utilized to quantify the targeted agricultural growing season. The effects of climate change on the agricultural growing season were characterized by the change in FD, LD, and PAGS between 1991–2020 and 1961–1990.
Agricultural production is closely connected to temperature, precipitation, and insolation. Therefore, agro-climatic change was characterized using the difference in the probability density function (PDF, which was used to illustrate the detail distribution pattern) as well as the mean magnitude of the mean air temperature, sum of precipitation, and sum of insolation during the PAGS between periods. Moreover, agro-climatic variation was characterized by the standard deviation of the mean air temperature, sum of precipitation, and sum of insolation during the PAGS. The differences in the magnitude change and variation of temperature, precipitation, and insolation during the PAGS between 1991–2020 and 1961–1990 were thus used to reveal the change characteristics of agro-climatic change. The changes in the mean magnitude and variation of the above factors during the whole year (from 1 January to 31 December) were additionally analyzed to reveal the characteristics of annual climate change. Thus, the difference in the changes of the mean magnitude and variation between PAGS and the whole year was used to reveal the difference between agro-climatic change and climate change.

3. Results

3.1. The Effects of Climate Change on the Agricultural Growing Season

A spatial increase in FD but a decrease in LD from the south to the north-west was demonstrated in 1961–1990 and 1991–2020 (Figure S1), with the general value being before DOY 150 for FD and after DOY 250 for LD. It was thus accepted that PAGS decreased from the south to the north-west in response to the change in FD and LD. There was an obvious advancement of 1–10 d in FD and a delay of 1–15 d in LD in 1991–2020 relative to 1961–1990 (Figure 2). A longer length of the PAGS characterized by an increase of 1–20 d was also detected in 1991–2020 relative to 1961–2020, implying a prolonged growing season in response to climate change.

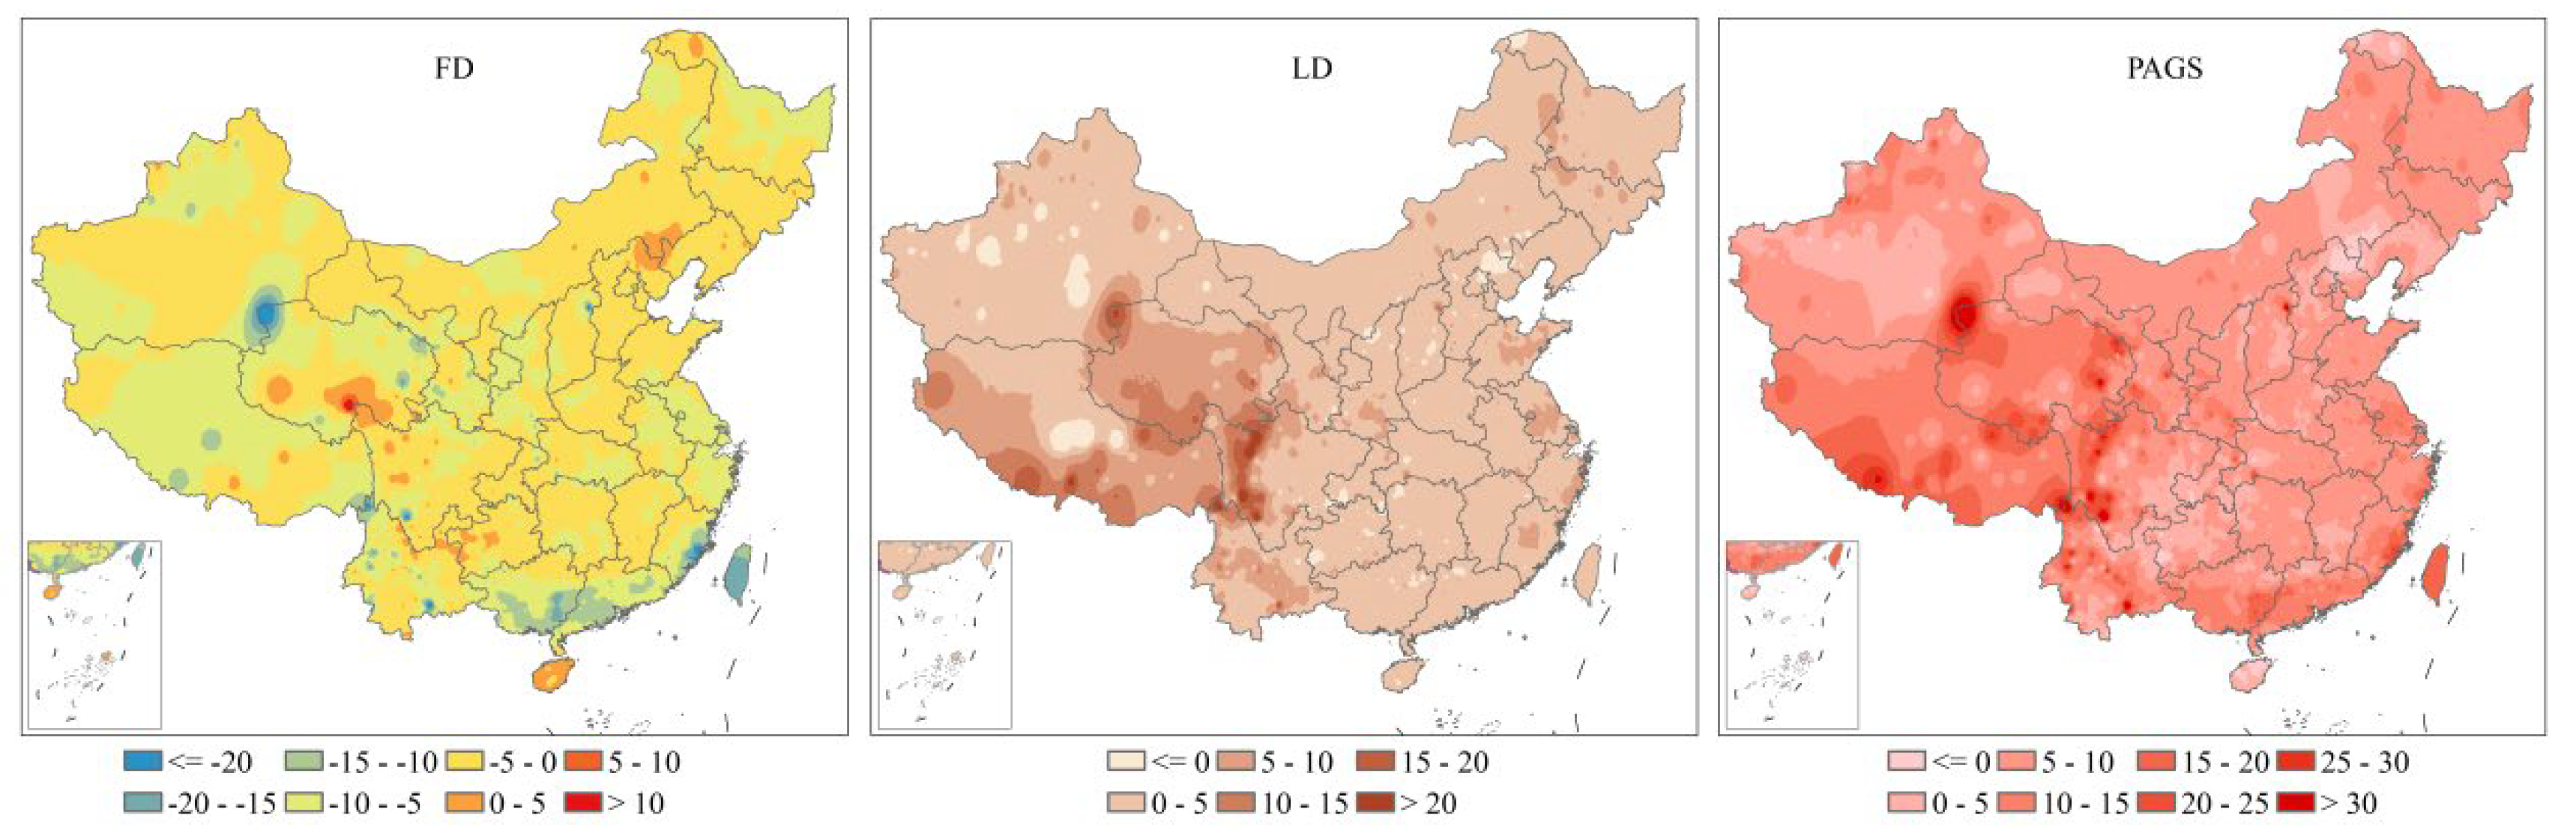
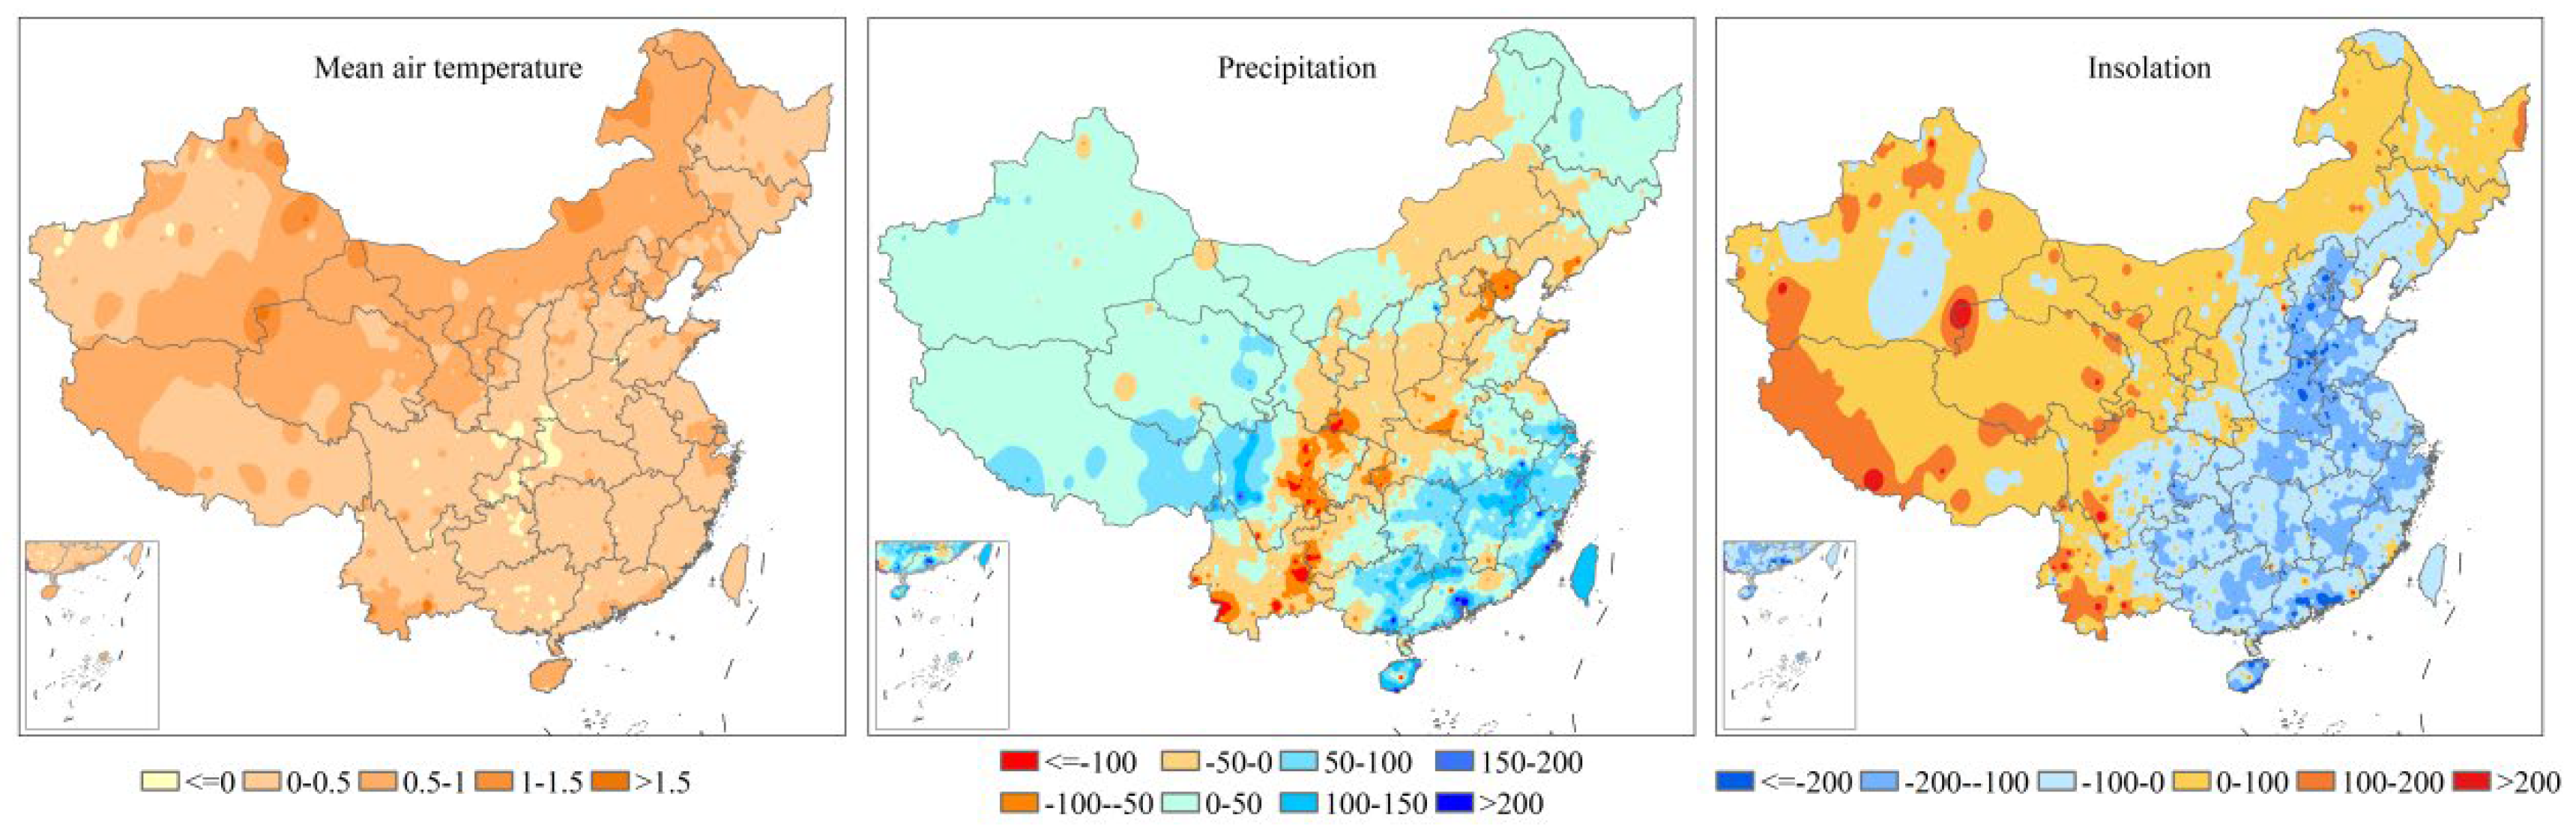
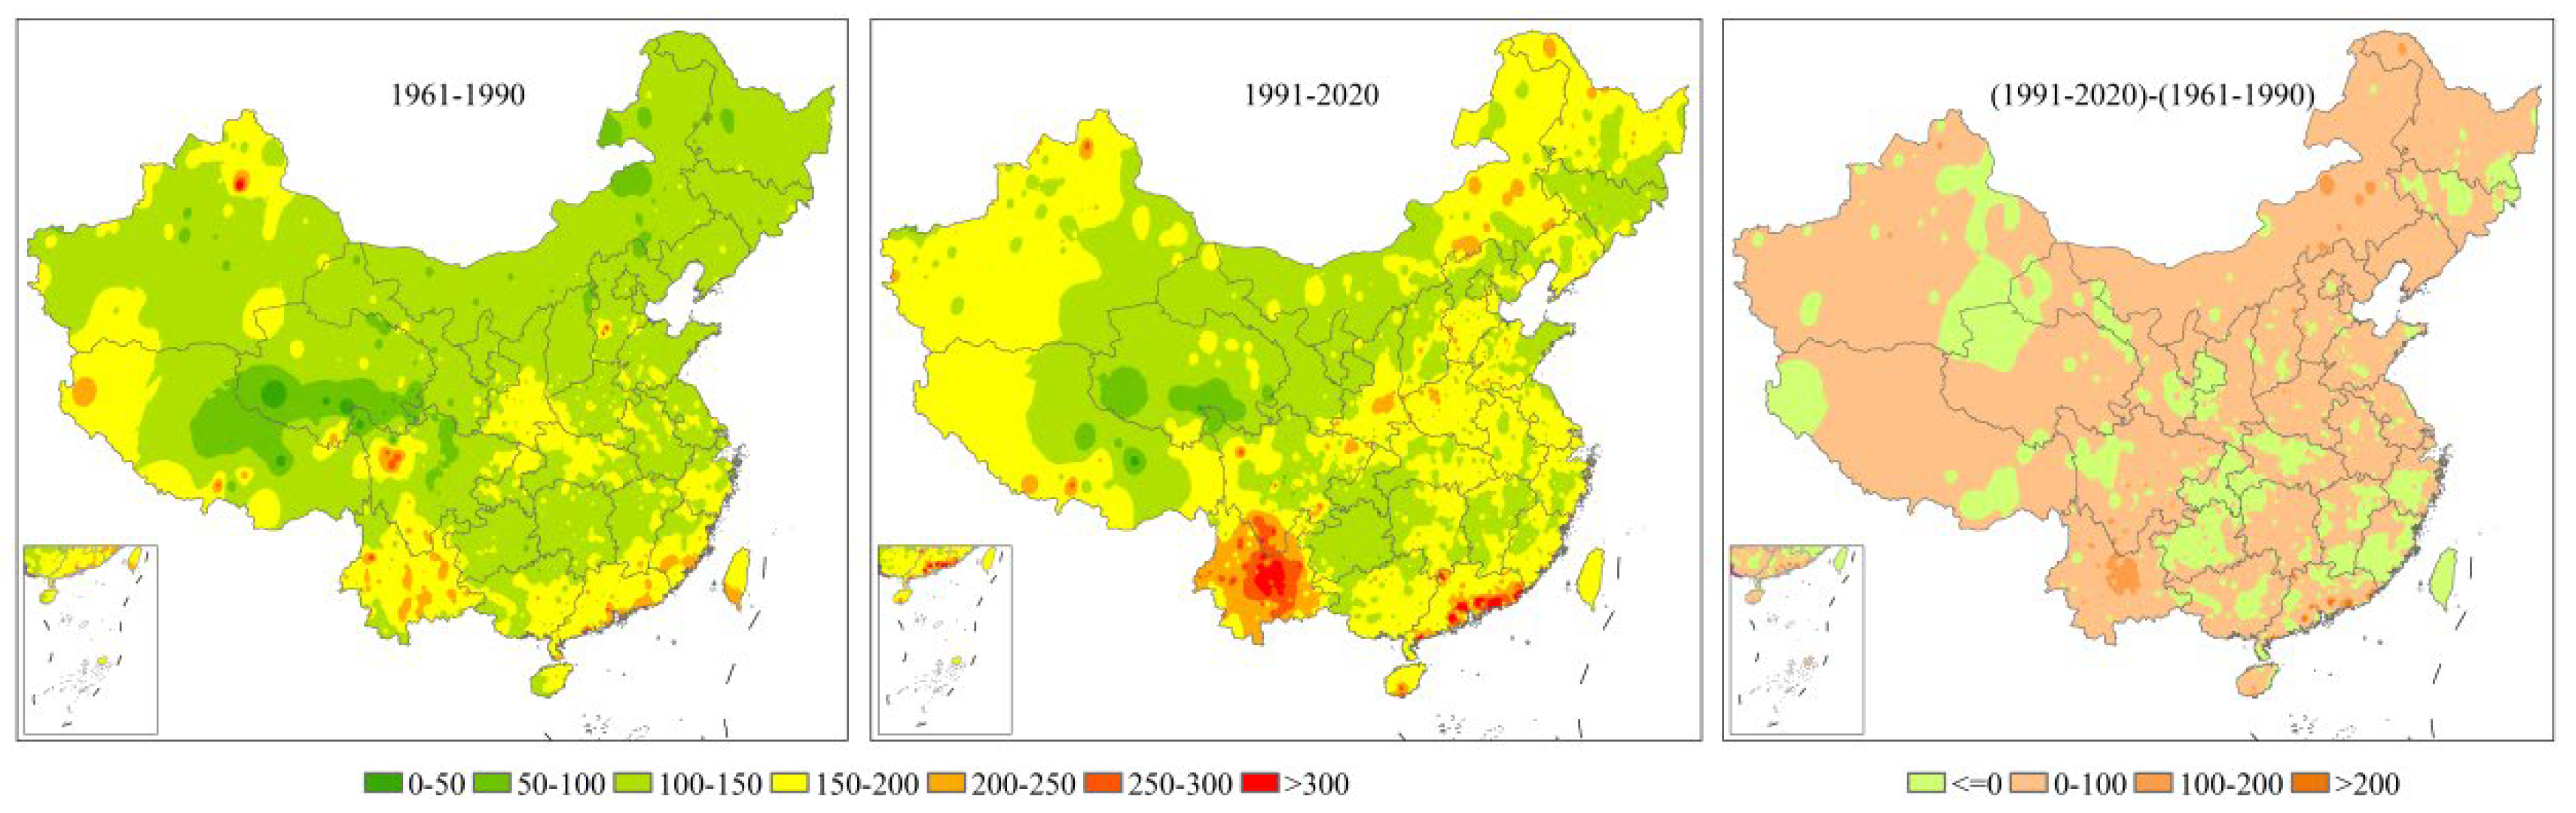
3.2. Characteristics of Agro-Climatic Change

A general increase in mean air temperature during the PAGS in 1991–2020 relative to 1961–1990 was detected across mainland China and was of higher magnitudes (0.43–0.72 °C) in the northern regions. On an individual basis, this increase (°C) was 0.72 for IM, 0.66 for NX, 0.62 for GS, 0.57 for BJ, 0.54 for TJ, 0.49 for LN, 0.47 for QH, 0.45 for HLJ and XJ, and 0.43 for JL (Figure 3 and Figure 4). The mean air temperature in these northern zones significantly increased at the rate of >0.10 °C per decade during 1961–2020 and >0.15 °C per decade during 1991–2020 (Figure S2 and Table S1).
The southeastern, northeastern, and western portions of the study area were exposed to increased levels of precipitation characterized by 0.8–23.8% increases in 1991–2020 relative to 1961–1990 (Figure 3 and Figure 5) as well as increasing and decreasing overall trends for these time periods, respectively (Figure S3 and Table S1). In contrast, the northeastern–southeastern belt received less precipitation and this decreased (mm) by 62.0 (11.0%) in TJ, 41.1 (7.3%) in BJ, 32.3 (6.6%) in HB, 22.4 (3.9%) in ShX, 24.7 (3.8%) in HN, 16.6 (2.9%) in LN, 11.2 (2.7%) in SX, 2.3 (0.9%) in NX, 16.6 (0.8%) in IM, 8.1 (0.8%) in HuB, 29.9 (2.9%) in YN, 23.6 (2.7%) in SC, and 14.1 (1.3%) in CQ (Figure 5).
It was clear that insolation decreased in the central-southern regions with a decrease of 27.3–168.7 h (2.1–10.2%) in 1991–2020 relative to 1961–1990 (Figure 2 and Figure 6). Although these trends were significantly negative in 1961–2020, the trend reversed to positive in 1991–2020 (Figure S4 and Table S1). This indicated that insolation increased. In contrast, an increase of 3.5–60.7 h (0.3–6.7%) in northern and western regions was observed with a general trend of 0–100 h per decade (even >100 h per decade in YN) during 1991–2020 (Figure S4).

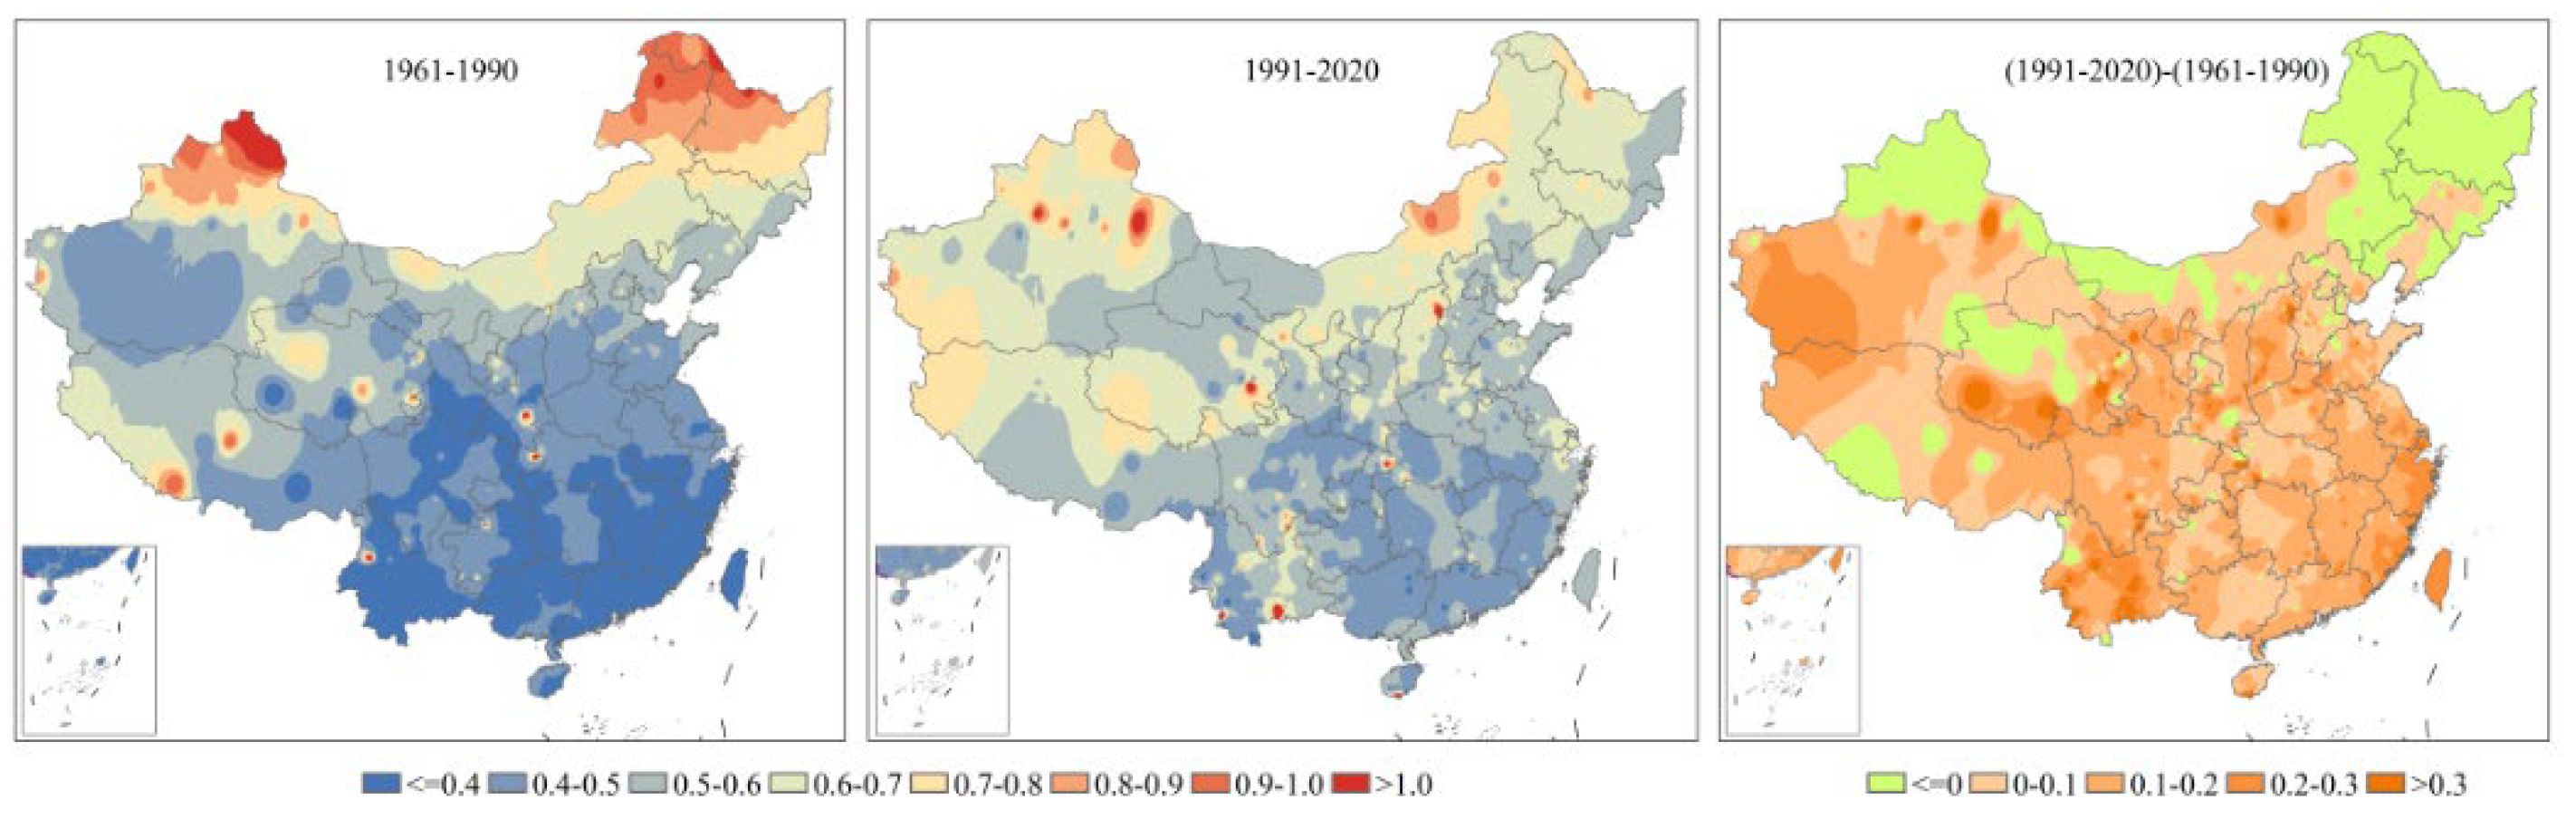
3.3. Characteristics of Agro-Climatic Variation

It was clear that the variation in the mean air temperature during the PAGS increased from south to north in both 1961–1990 and 1991–2020. A direct comparison between the two periods indicated that the variation in 1991–2020 was greater than that in 1961–1990 in the major regions except for the northeast and northwest, implying that the temperature variation increased (Figure 7). In contrast, the variation in precipitation decreased from the southeast to northwest in both 1961–1990 and 1991–2020. The variation in 1991–2020 relative to 1961–1990 was >0 in most southern, northeastern, and western regions, indicating precipitation regularity was unstable (Figure 8). Interestingly, the data for insolation did not show an obvious spatial pattern in its variation. In general, the variation in 1991–2020 was greater than that in 1961–1990, meaning that overall insolation was increasingly variable (Figure 9).

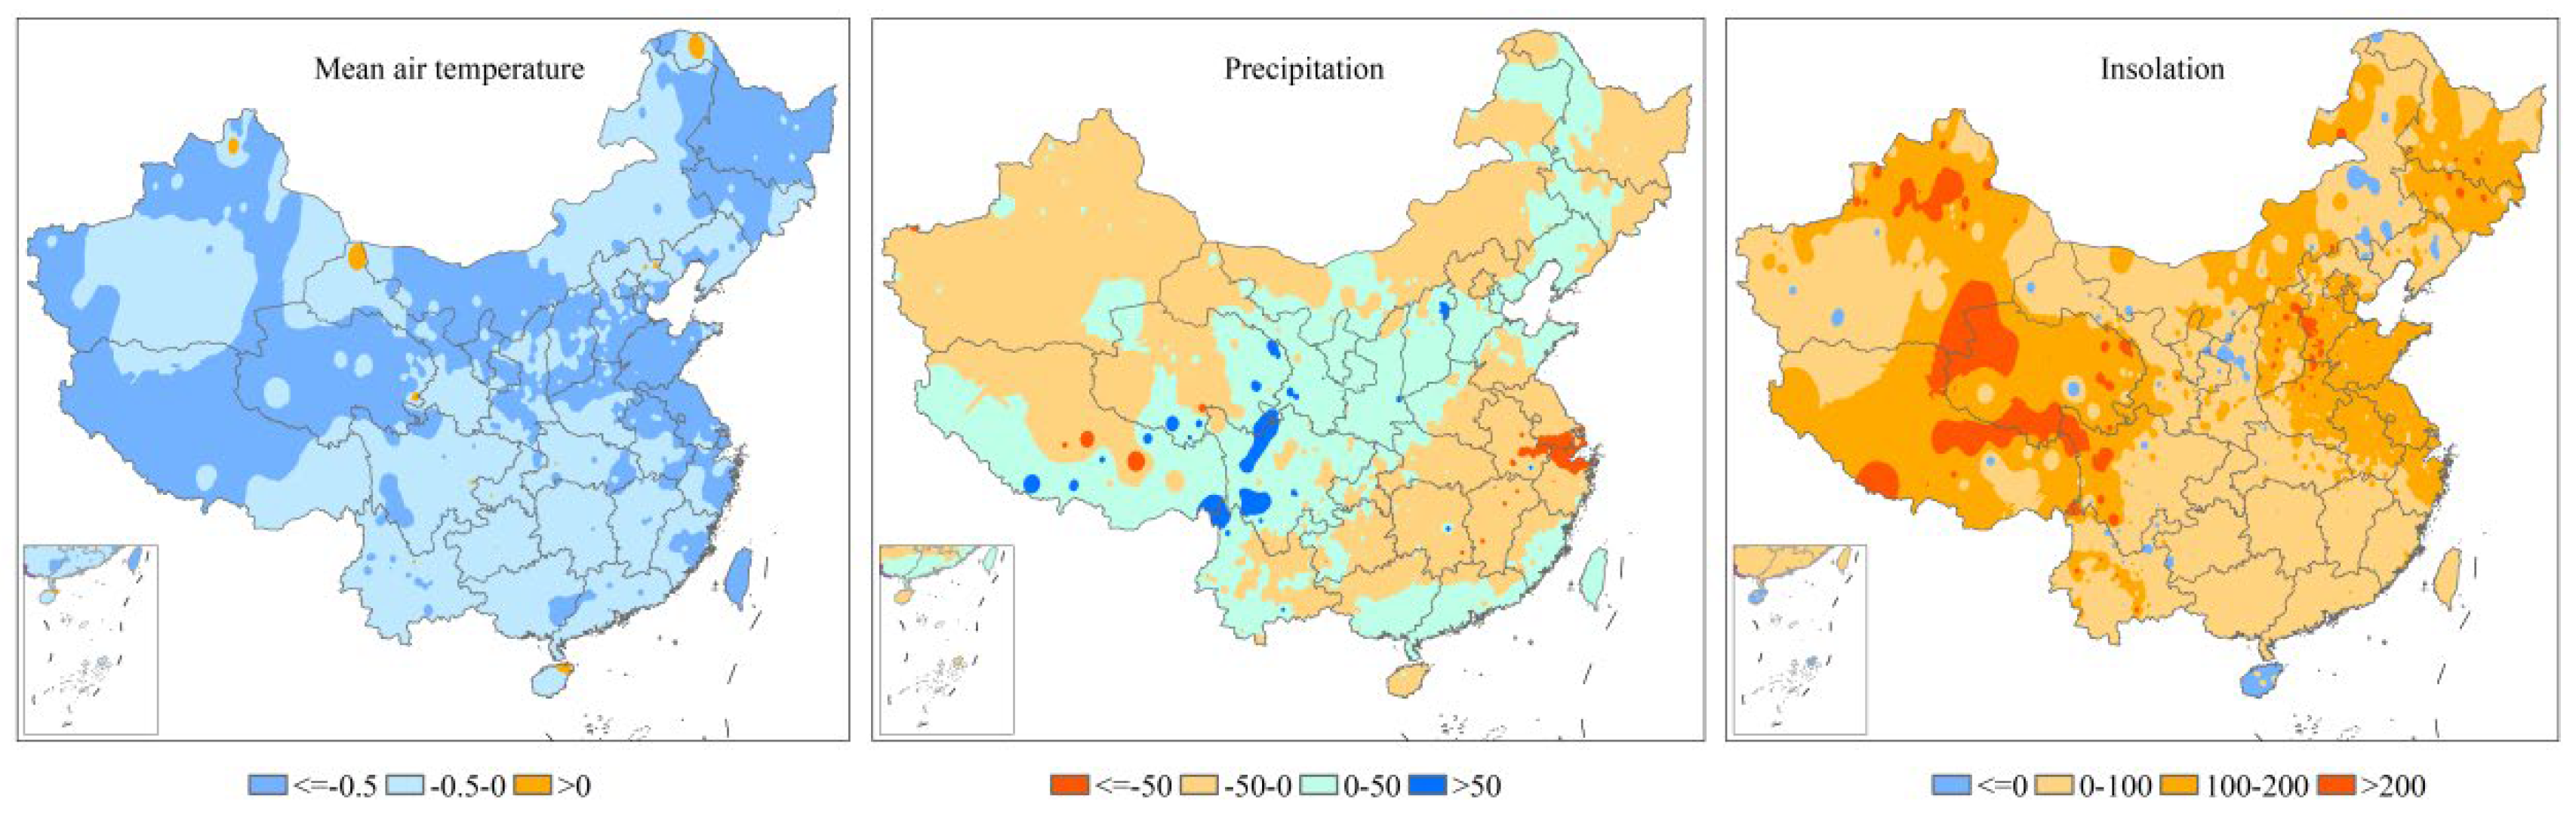
3.4. A Comparison of Agro-Climatic and Climate Change/Variation

In order to determine whether there were significant differences between agro-climatic change and annual climatic change, alterations were quantified between the differences in mean air temperature, precipitation as well as insolation during the PAGS in 1991–2020 relative to 1961–1990 and the differences in mean air temperature, precipitation as well as insolation during the whole year in 1991–2020 relative to 1961–1990. It was obvious that the change in mean air temperature during the PAGS was less than that calculated for the change during the whole year, although the change in insolation during the PAGS was greater than that during the whole year (Figure 10). The change in precipitation during the PAGS in the northeastern–southeastern dry regions was greater than that during the whole year. This trend was reversed for the wet regions (Figure 10).
A similar comparison was made for variations in mean air temperature, precipitation, and insolation. It was found that a positive variation in mean air temperature during the PAGS relative to that during the whole year was present in northern regions. A larger precipitation variation during the PAGS relative to the whole year was found in the northeast, north, southwest, and central-west. Additionally, a generally larger variation of insolation during the PAGS relative to the whole year was detected in the central-eastern regions (Figure 11).

4. Discussion

A better understanding of the change and variation of temperature, precipitation, and insolation during the agricultural growing season is necessary for assessing climatic resources during the period of agricultural production. It is generally accepted that the crop planting date has changed and growing seasons have lengthened significantly in response to climate warming, especially under contemporaneous temperature and precipitation [12,30]. Climatic conditions for agriculture are thus expected to be measured at the yearly dynamic PAGS instead of the fixed time period.
In general, mean air temperature, precipitation, and insolation have been altered by climate change. Previous studies focused primarily on the changes and variations of annual metrics for climate change, and a consistent increase in the mean air temperature had been cited across China [6]. In the context of regional features, the mean air temperature in western China increased higher than that for mainland China, and this trend was more rapid after 1990 with a tendency of 0.38 °C per decade during 1990–2012 [31,32]. Annual precipitation displayed a decreasing trend in the belt from the southwest to northeast and a positive trend for eastern and northwestern China [33]. The variability in annual precipitation generally became greater, but its spatial distribution pattern was not consistent [34]. Surface insolation also generally increased since the early 1990s relative to the declining trends before the early 1990s [35]. For example, in HLJ Province, the mean air temperature increased but precipitation and insolation decreased over 1951–2018 [36]. These changes were consistent with the annual climatic conditions in the current study (Figures S5–S8). In relation to PAGS, the changes differed and did not follow the patterns for the general climate data, and this has been discussed in only a few publications. For example, mean air temperature increased but insolation decreased from 1965 to 2016 during the cotton growing season on the North China plain [37]. There was also a negative trend for insolation in June, July, and August but a positive trend in the period from the last date of frost to May and from September to the first date of frost. These led to small changes on decadal and annual scales [38]. The variation in precipitation during June and September decreased from the southeast to the north [5]. These results and especially those depicting trends in climatic resources were generally consistent with the trends for the current study although the time periods differed. Moreover, insolation alterations varied and followed changes in the length of the frost-free season due to the advancing of the last date of frost and the delay in the first date of frost forced by climate warming. Therefore, agro-climatic changes during the PAGS are important and necessary for understanding the relationships between climate change and agriculture.
A comparison of the linkage between agro-climatic change and agricultural production was further analyzed at the national scale, for the reason of limitations in the dataset for specific crops in specific regions across China. There was an obvious increasing trend (0.10 °C per decade) and variation in mean air temperature, a slight increasing trend (4.90 mm per decade) and variation in precipitation, as well as a decreasing trend (−15.10 h per decade) and variation in insolation during the PAGS, from the perspective of the national scale during 1961–2020 (Figure S9). Meanwhile, a significant increase in the yield of national total major crops was detected at the tendency of 777.84 kg·ha−1 per decade in these years (Figure S10). The respective correlation between the national crops yield and mean air temperature, precipitation, and insolation was 0.55 (at the 0.05 significance level), 0.17 (not significant), and −0.50 (at the 0.05 significance level). It was thus accepted that an increase in agricultural production was attributed to increasing temperature, followed by decreasing insolation and slight upward precipitation. Moreover, the increasing trend of the yield of total major crops was 641.25 kg·ha−1 per decade in 1991–2020, which was much less than that in 1961–1990 (926.65 kg·ha−1 per decade). This decrease of the trend between the two periods meant that climate change slowed the rate of agricultural growth [16]. The variation of the yield anomaly in the national total major crops (Figure S10) decreased in recent years but the variations of mean air temperature and precipitation during the PAGS increased, implying that agriculture also mitigated the effect of climate change by the usage of some adaptations, i.e., changing the sowing date and longer-duration and stress-resistant varieties [39,40]. Whilst agricultural production was comprehensively affected by management, cultivation technique, soil, and climatic conditions, the above-mentioned adaptations were inevitably induced and determined by the change in climatic resources. However, these were still not totally consistent with the variation in climatic resources, and the subsequent effects of the variation on agricultural production should be further explored.
Some inevitable limitations were involved in the current study. For example, the actual agricultural growing periods differed between specific crops and regions, and the actual growing times varied from year to year as a result of weather, cultivation, and policy. It was thus difficult to quantify the precise growing period, and the general PAGS was alternatively chosen to represent the primary agricultural production season. Detailed research on specific crops should be implemented in the future in order to acquire more accurate information on agricultural climate change.
The current climatic baseline period of 1991–2020 showed that the values of the mean air temperature, precipitation, and insolation during the PAGS were generally becoming more unstable than those seen for 1961–1990. The reasons for this might be attributed to more frequent occurrence and higher magnitude of climatic extremes. Although temperature increases are beneficial for agricultural production, increases of the frequency and intensity in temperature extremes, e.g., heat stress, would be harmful for rice in central and southern China following a warming climate [41,42]. It is expected that the intensity and variation of precipitation in southern, northeastern, and western regions will increase, particularly in wet zones [10]. This would lead to an increase in extreme precipitation and floods [4,5]. Comparatively, the intensity and variation of precipitation decreased in northern regions, suggesting an increase in water scarcity with associated droughts for agriculture and irrigation planning [11]. Therefore, the climate variations for agriculture must be more fully explored to develop rational agricultural management practices.

5. Conclusions

The spatial–temporal change characteristics of the agricultural growing season and agro-climatic resources including temperature, precipitation, and insolation were explored in the latest decades. Earlier FD, later LD, and longer PAGS were generally identified across the major parts of China in 1991–2020 relative to 1961–1990. Given a longer period available for agricultural production due to a longer PAGS, there was a general increase in mean air temperature during the PAGS with larger increases in northern and western regions, as well as an increasing variation in 1991–2020 relative to 1961–1990. It was clear that precipitation during the PAGS increased in southeastern, northeastern and western regions, but the variation was amplified in 1991–2020 relative to 1961–1990. This contrasted with the southwestern–northeastern belt. Decreased insolation during the PAGS was detected in central–southern regions, and a generally larger variation was demonstrated across the major areas of China in 1991–2020 compared to 1961–1990. These changes and variations implied that climatic resources during the PAGS tended to be more unstable, even though resources increased in some regions. Moreover, the change in temperature during the PAGS was more stable than that during the whole year, even though precipitation and insolation during the PAGS were generally becoming more random in comparison with those during the whole year. The detection of these types of patterns can assist the development of more effective adaptations in specific regions in response to climate change.

Supplementary Materials

The following are available online at https://www.mdpi.com/article/10.3390/agriculture12020147/s1, Figure S1. The first date with daily mean air temperature ≥ 10 °C, the last date with daily mean air temperature, and the potential agricultural growing season in 1961–1990 and 1991–2020, Figure S2. The trend of mean air temperature during the potential agricultural growing season in different periods (the dot with a circle represents the 0.05 significance level), Table S1 The number of stations characterized by increasing and decreasing trends (The number in parentheses represents the trend at the 0.05 significance level), Figure S3. The trend of precipitation during the potential agricultural growing season in different periods (the dot with a circle represents the 0.05 significance level), Figure S4. The trend of insolation during the potential agricultural growing season in different periods (the dot with a circle represents the 0.05 significance level), Figure S5. The difference in mean air temperature, precipitation, and insolation during the whole year in 1991–2020 relative to 1961–1990, Figure S6. The variation in mean air temperature during the whole year in different periods (From left to right represents 1961–1990, 1991–2020 and (1991–2020)–(1961–1990)), Figure S7. The variation in precipitation during the whole year in different periods (From left to right represents 1961–1990, 1991–2020 and (1991–2020)–(1961–1990)), Figure S8. The variation in insolation during the whole year in different periods (From left to right represents 1961–1990, 1991–2020 and (1991–2020)–(1961–1990)), Figure S9. The change in national mean air temperature, precipitation, and insolation during the potential agricultural growing season in 1961–2020 (Blue and red lines represent the mean value of 1961–1990 and 1991–2020), Figure S10. The change in national crop yield and yield anomaly in 1961–2020 (Blue and red lines represent the mean value of 1961–1990 and 1991–2020).

Author Contributions

Conceptualization, Z.H.; methodology, Z.H. and L.Z.; software, L.Z. and R.K.; formal analysis, M.J. and H.Z.; writing—original draft preparation, Z.H.; writing—review and editing, L.Z.; funding acquisition, Z.H. All authors have read and agreed to the published version of the manuscript.

Funding

This research was financially supported by the National Key Research and Development Plan of China (NO. 2018YFC1505605 and 2018YFC1507802).

Institutional Review Board Statement

Not applicable.

Informed Consent Statement

Not applicable.

Data Availability Statement

All data are contained within the article or supplementary material.

Conflicts of Interest

The authors declare no conflict of interest.

References

  1. IPCC. Climate change 2013: The physical science basis. In Contribution of Working Group I to the Fifth Assessment Report of the Intergovernmental Panel on Climate Change; Cambridge University Press: Cambridge, UK; New York, NY, USA, 2013. [Google Scholar]
  2. Sun, Y.; Zhang, X.B.; Zwiers, F.W.; Song, L.C.; Wan, H.; Hu, T.; Yin, H.; Ren, G.Y. Rapid increase in the risk of extreme summer heat in eastern China. Nat. Clim. Change 2014, 4, 1082–1085. [Google Scholar] [CrossRef]
  3. IPCC. Summary for Policymakers. In Climate Change 2021: The Physical Science Basis. Contribution of Working Group I to the Sixth Assessment Report of the Intergovernmental Panel on Climate Change; Cambridge University: Cambridge, UK, 2021. [Google Scholar]
  4. Hegerl, G.C.; Black, E.; Allan, R.P.; Ingram, W.J.; Polson, D.; Trenberth, K.E.; Chadwick, R.S.; Arkin, P.A.; Sarojini, B.B.; Becker, A.; et al. Challenges in quantifying changes in the global water cycle. Bull. Am. Meteorol. Soc. 2015, 96, 1097–1115. [Google Scholar] [CrossRef] [Green Version]
  5. Brown, J.R.; Moise, A.F.; Colman, R.A. Projected increases in daily to decadal variability of Asian-Australian monsoon rainfall. Geophys. Res. Lett. 2017, 44, 5683–5690. [Google Scholar] [CrossRef]
  6. CMA Climate Change Centre. Blue Book on Climate Change in China; Science Press: Beijing, China, 2021. [Google Scholar]
  7. Huang, D.P.; Zhang, L.; Gao, G.; Shao, S. Projected changes in population exposure to extreme heat in China under a RCP8.5 scenario. J. Geogr. Sci. 2018, 28, 1371–1384. [Google Scholar] [CrossRef] [Green Version]
  8. Lin, L.; Wang, Z.L.; Xu, Y.Y.; Zhang, X.Y.; Zhang, H.; Dong, W.J. Additional intensification of seasonal heat and flooding extreme over China in a 2 °C warmer world compared to 1.5 °C. Earths Future 2018, 6, 968–978. [Google Scholar] [CrossRef]
  9. Shortridge, J. Observed trends in daily rainfall variability result in more severe climate change impacts to agriculture. Clim. Change 2019, 157, 429–444. [Google Scholar] [CrossRef]
  10. Zhang, W.X.; Furtado, K.; Wu, P.L.; Zhou, T.J.; Chadwick, R.; Marzin, C.; Rsotorn, J.; Sexton, D. Increasing precipitation variability on daily-to-multiyear time scales in a warmer world. Sci. Adv. 2021, 7, eabf8021. [Google Scholar] [CrossRef]
  11. Praveen, B.; Sharma, P. A review of literature on climate change and its impacts on agriculture productivity. J. Public Affairs 2019, 19, 1472–3891. [Google Scholar] [CrossRef]
  12. Xia, J.J.; Jin, S.F.; Yan, Z.W.; Xiong, Z.; Zheng, Z.Y.; Han, Z.Q. Shifts in timing of local growing season in China during 1961–2012. Theor. Appl. Climatol. 2019, 137, 1637–1642. [Google Scholar] [CrossRef]
  13. Wang, H.J.; Rutishauser, T.; Dai, J.H. Phenological response to climate change in China: A meta-analysis. Glob. Change Biol. 2015, 21, 265–274. [Google Scholar] [CrossRef]
  14. Xiao, D.P.; Liu, D.L.; Feng, P.Y.; Wang, B.; Waters, C.; Shen, Y.J.; Qi, Y.Q.; Bai, H.Z.; Tang, J.Z. Future climate change impacts on grain yield and groundwater use under different cropping systems in the North China Plain. Agric. Water Manag. 2021, 246, 106685. [Google Scholar] [CrossRef]
  15. Ortiz-Bobea, A.; Ault, T.R.; Carrillo, C.M.; Chambers, R.G.; Lobell, D.B. Anthropogenic climate change has slowed global agricultural productivity growth. Nat. Clim. Change 2021, 11, 306–312. [Google Scholar] [CrossRef]
  16. Fuglie, K. Climate change upsets agriculture. Nat. Clim. Change 2021, 11, 294–295. [Google Scholar] [CrossRef]
  17. Polley, H.W.; Briske, D.D.; Morgan, J.A.; Polley, H.W.; McCarl, B.A.; Bailey, D.W. Climate change and North American rangelands: Trends, projections, and implications. Rangel. Ecol. Manag. 2013, 66, 493–511. [Google Scholar] [CrossRef]
  18. Steiner, J.L.; Briske, D.D.; Brown, D.P.; Rottler, C.M. Vulnerability of Southern Plains agriculture to climate change. Clim. Change 2018, 146, 201–208. [Google Scholar] [CrossRef] [Green Version]
  19. Sloat, L.L.; Davis, S.J.; Gerber, J.S.; Moore, F.C.; Ray, D.K.; West, P.C.; Mueller, N.D. Climate adaptation by crop migration, Climate adaptation by crop migration. Nat. Commun. 2020, 11, 1241. [Google Scholar] [CrossRef] [Green Version]
  20. Xiao, D.P.; Liu, D.L.; Wang, B.; Feng, P.Y.; Bai, H.Z.; Tang, J.Z. Climate change impact on yields and water use of wheat and maize in the North China Plain under future climate change scenarios. Agric. Water Manag. 2020, 238, 106238. [Google Scholar] [CrossRef]
  21. Zhao, W.; Yu, X.B.; Jiao, C.C.; Xu, C.D.; Liu, Y.; Wu, G.N. Increased association between climate change and vegetation index variation promotes the coupling of dominant factors and vegetation growth. Sci. Total Environ. 2021, 767, 144669. [Google Scholar] [CrossRef]
  22. Stanhill, G.; Cohen, S. Global dimming: A review of the evidence for a widespread and significant reduction in global radiation with discussion of its probable causes and possible agricultural consequences. Agric. For. Meteorol. 2001, 107, 255–278. [Google Scholar] [CrossRef]
  23. Licker, R.; Kucharik, C.J.; Doré, T.; Lindemane, M.J.; Makowski, D. Climatic impacts on winter wheat yields in Picardy, France and Rostov, Russia: 1973-2010. Agric. For. Meteorol. 2013, 176, 25–37. [Google Scholar] [CrossRef]
  24. Gourdji, S.; Läderach, P.; Valle, A.M.; Martinez, C.Z.; Lobell, D.B. Historical climate trends, deforestation, and maize and bean yields in Nicaragua. Agric. For. Meteorol. 2015, 200, 270–281. [Google Scholar] [CrossRef] [Green Version]
  25. Chu, Z.; Guo, J.P.; Zhao, J.F. Impacts of projected climate change on agricultural climate resources in Northeast China. Acta Geogr. Sin. 2017, 72, 1248–1260. [Google Scholar] [CrossRef]
  26. Li, X.H.; Xu, Y.L.; Meng, C.C.; Wang, C.G. Analysis on the changes of agro-meteorological thermal indices in Northeast China under RCP4.5 scenario using the PRECIS2.1. Atmosphere 2018, 9, 323. [Google Scholar] [CrossRef] [Green Version]
  27. Ye, Q.; Yang, X.G.; Dai, S.W.; Chen, G.S.; Li, Y.; Zhang, C.X. Effects of climate change on suitable rice cropping areas, cropping systems and crop water requirements in southern China. Agric. Water Manag. 2015, 159, 35–44. [Google Scholar] [CrossRef]
  28. Zhang, L.; Li, S.; Tan, F.Y.; Guo, A.H.; Huo, Z.G. Potential agro-thermal resources dynamic for double-season rice cultivation across China under greenhouse gas emission scenarios. Theor. Appl. Climatol. 2021, 144, 67–75. [Google Scholar] [CrossRef]
  29. World Meteorological Organization. The 17th Congress held by World Meteorological Organization; World Meteorological Organization: Geneva, Switzerland, 2015. [Google Scholar]
  30. Cui, X.M.; Xie, W. Adapting agriculture to climate change through growing season adjustments: Evidence from corn in China. Am. J. Agric. Econ. 2021, 104, 249–272. [Google Scholar] [CrossRef]
  31. Sun, Y.; Zhang, X.B.; Ren, G.Y.; Zwiers, F.W.; Hu, T. Contribution of urbanization to warming in China. Nat. Clim. Change 2016, 4, 1082–1085. [Google Scholar] [CrossRef]
  32. Wang, Y.J.; Sun, Y.; Hu, T.; Qin, D.H.; Song, L.C. Attribution of temperature changes in Western China. Int. J. Climatol. 2018, 38, 742–750. [Google Scholar] [CrossRef]
  33. Zhou, B.T.; Xu, Y.; Wu, J.; Dong, S.Y.; Shi, Y. Changes in temperature and precipitation extreme indices over China: Analysis of a high-resolution grid dataset. Int. J. Climatol. 2016, 36, 1051–1066. [Google Scholar] [CrossRef]
  34. He, C.; Li, T. Does global warming amplify interannual climate variability? Clim. Dyn. 2019, 52, 2667–2684. [Google Scholar] [CrossRef]
  35. Ren, Y.Y.; Parker, D.; Ren, G.Y.; Dunn, R. Tempo-spatial characteristics of sub-daily temperature trends in mainland China. Clim. Dyn. 2016, 46, 2737–2748. [Google Scholar] [CrossRef] [Green Version]
  36. Hu, X.H.; Chen, M.T.; Liu, D.; Li, D.; Jin, L.; Liu, S.H.; Cui, Y.L.; Dong, B.; Khan, S.; Luo, Y.F. Reference evapotranspiration change in Heilongjiang Province, China from 1951 to 2018: The role of climate change and rice area expansion. Agric. Water Manag. 2021, 253, 106912. [Google Scholar] [CrossRef]
  37. Yang, X.L.; Jin, X.N.; Chu, Q.Q.; Pacenka, S.; Steenhuis, T.S. Impact of climate variation from 1965 to 2016 on cotton water requirements in North China Plain. Agric. Water Manag. 2021, 243, 106502. [Google Scholar] [CrossRef]
  38. Liu, L.L.; Zhu, Y.; Tang, L.; Cao, W.X.; Wang, E. Impacts of climate changes, soil nutrients, variety types and management practices on rice yield in East China: A case study in the Taihu region. Field Crop. Res. 2013, 149, 40–48. [Google Scholar] [CrossRef] [Green Version]
  39. Bai, H.Z.; Tao, F.L.; Xiao, D.P.; Liu, F.S.; Zhang, H. Attribution of yield change for rice-wheat rotation system in China to climate change, cultivars and agronomic management in the past three decades. Clim. Change 2016, 135, 539–553. [Google Scholar] [CrossRef]
  40. Hu, Q.; Pan, F.F.; Pan, X.B.; Li, Q.Y.; Shao, C.X.; Pan, Z.H.; Wei, Y.R. Trends in agricultural heat and solar radiation resources in Northeast China: A multistage spatio-temporal analysis. Int. J. Climatol. 2016, 36, 2461–2468. [Google Scholar] [CrossRef] [Green Version]
  41. Yang, J.Y.; Huo, Z.H.; Li, X.X.; Wang, P.J.; Wu, D.R. Hot weather event-based characteristics of double-early rice heat risk: A study of Jiangxi province, South China. Ecol. Indic. 2020, 113, 106148. [Google Scholar] [CrossRef]
  42. Zhang, L.; Yang, B.Y.; Li, S.; Hou, Y.Y.; Huang, D.P. Potential rice exposure to heat stress along the Yangtze River in China under RCP8.5 scenario. Agric. For. Meteorol. 2018, 248, 185–196. [Google Scholar] [CrossRef]
Figure 1. The location of the study region (Triangular points represent the location of meteorological observation stations).
Agriculture 12 00147 g001
Figure 2. The change of the first date with daily mean air temperature ≥ 10 °C, the last date with daily mean air temperature ≤ 10 °C, and the length of the potential agricultural growing season in 1991–2020 relative to 1961–1990.
Agriculture 12 00147 g002
Figure 3. Differences in mean air temperature, precipitation, and insolation during the potential agricultural growing season in 1991–2020 relative to 1961–1990.
Agriculture 12 00147 g003
Figure 4. Probability density function (PDF) patterns of the mean air temperature during the potential agricultural growing season in 1961–1990 and 1991–2020 (blue and red curve represents the PDF value in 1961–1990 and 1991–2020, respectively; blue dotted line and red dotted line represents the mean magnitude of mean air temperature in 1991–2020).
Agriculture 12 00147 g004
Figure 5. Probability density function patterns of precipitation during the potential agricultural growing season in 1961–1990 and 1991–2020 (blue and red curve represents the PDF value in 1961–1990 and 1991–2020, respectively; blue dotted line and red dotted line represents the mean magnitude of precipitation in 1991–2020).
Agriculture 12 00147 g005
Figure 6. Probability density function patterns of insolation during the potential agricultural growing season in 1961–1990 and 1991–2020 (blue and red curve represents the PDF value in 1961–1990 and 1991–2020, respectively; blue dotted line and red dotted line represents the mean magnitude of insolation in 1991–2020).
Agriculture 12 00147 g006
Figure 7. Variation in mean air temperatures during the potential agricultural growing season for the indicated time periods.
Agriculture 12 00147 g007
Figure 8. Variation in precipitation during the potential agricultural growing season for the indicated time periods.
Agriculture 12 00147 g008
Figure 9. Variation in insolation during the potential agricultural growing season for the indicated time periods.
Agriculture 12 00147 g009
Figure 10. Difference between the change in factors (mean air temperature, precipitation, and insolation) during the potential agricultural growing season in 1991–2020 relative to 1961–1990 and the change in factors (mean air temperature, precipitation, and insolation) during the whole year in 1991–2020 relative to 1961–1990.
Agriculture 12 00147 g010
Figure 11. Difference between the variation of factors (mean air temperature, precipitation, and insolation) during the potential agricultural growing season in 1991–2020 relative to 1961–1990 and the variation of factors (mean air temperature, precipitation, and insolation) during the whole year in 1991–2020 relative to 1961–1990.
Agriculture 12 00147 g011
Publisher’s Note: MDPI stays neutral with regard to jurisdictional claims in published maps and institutional affiliations.

