
Content and Balance of Trace Elements (Co, Mn, Zn) in Agroecosystems of the Central Chernozemic Region of Russia


Abstract
:1. Introduction
2. Materials and Methods
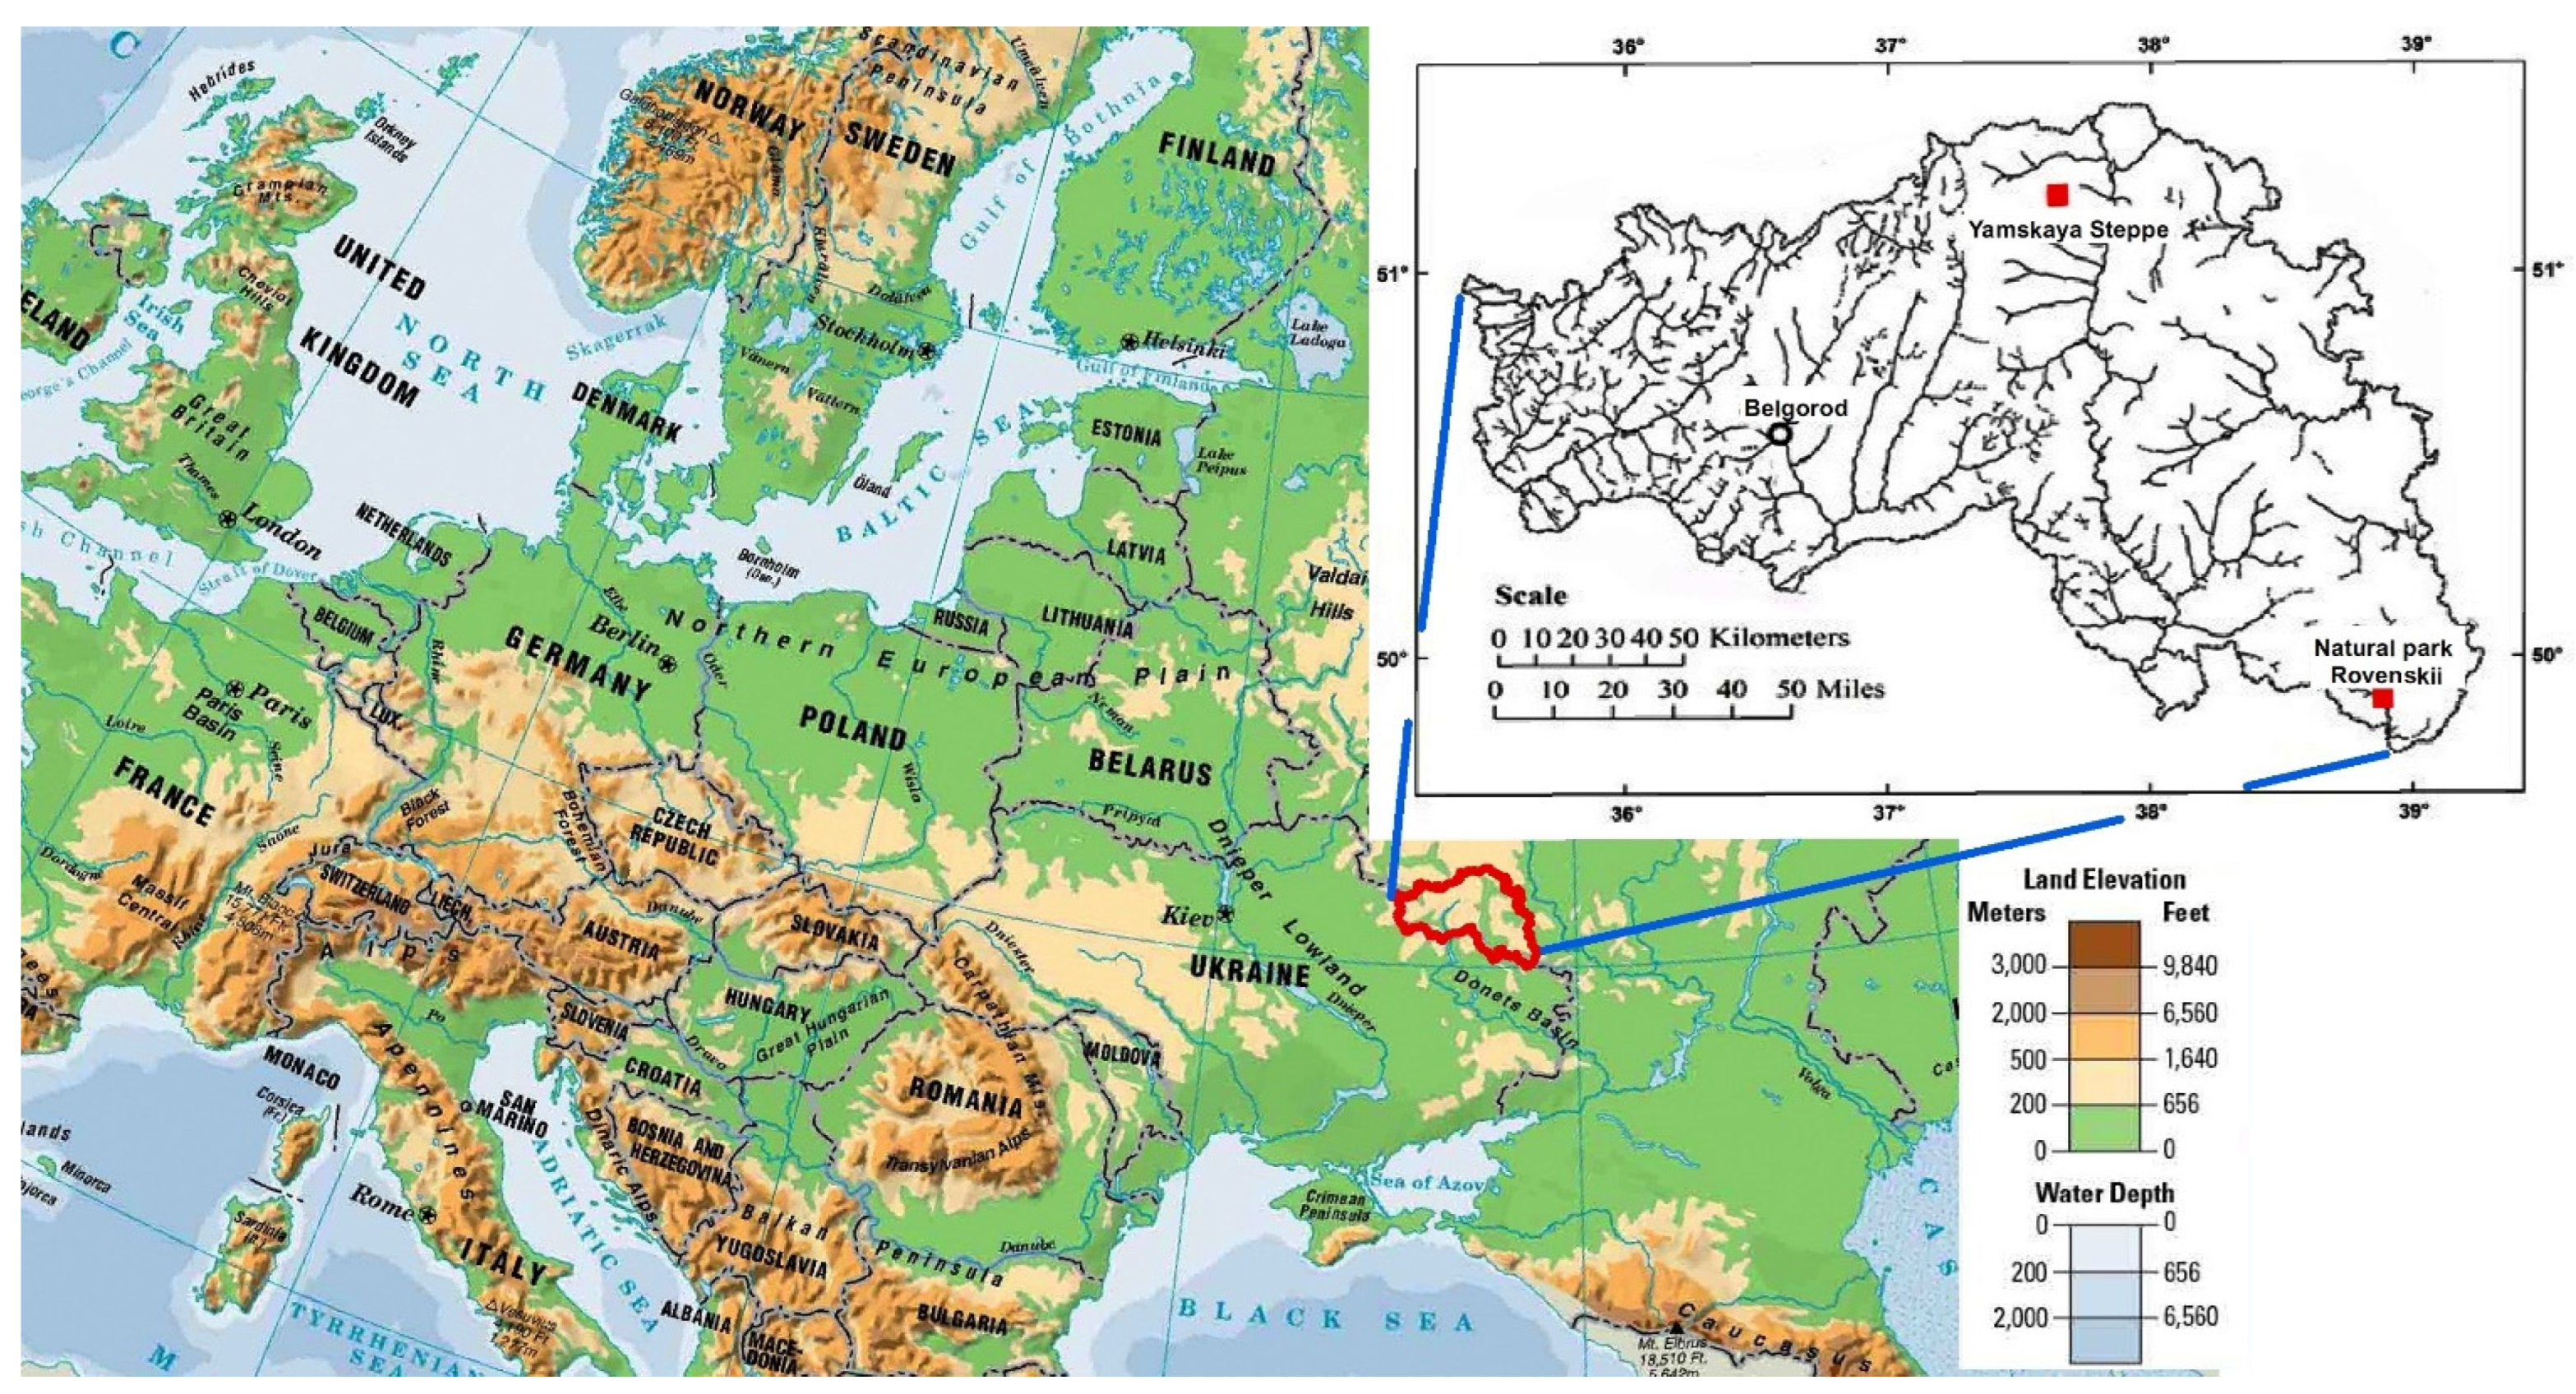
2.1. Soil and Climatic Conditions in the Study Area
2.2. Peculiarities of Regional Agroecological Monitoring
2.3. Peculiarities of Local Agroecological Monitoring
2.4. Peculiarities of Background Environmental Monitoring
2.5. Methodology of Analytical Studies
2.6. Processing of Experimental Data
3. Research Results
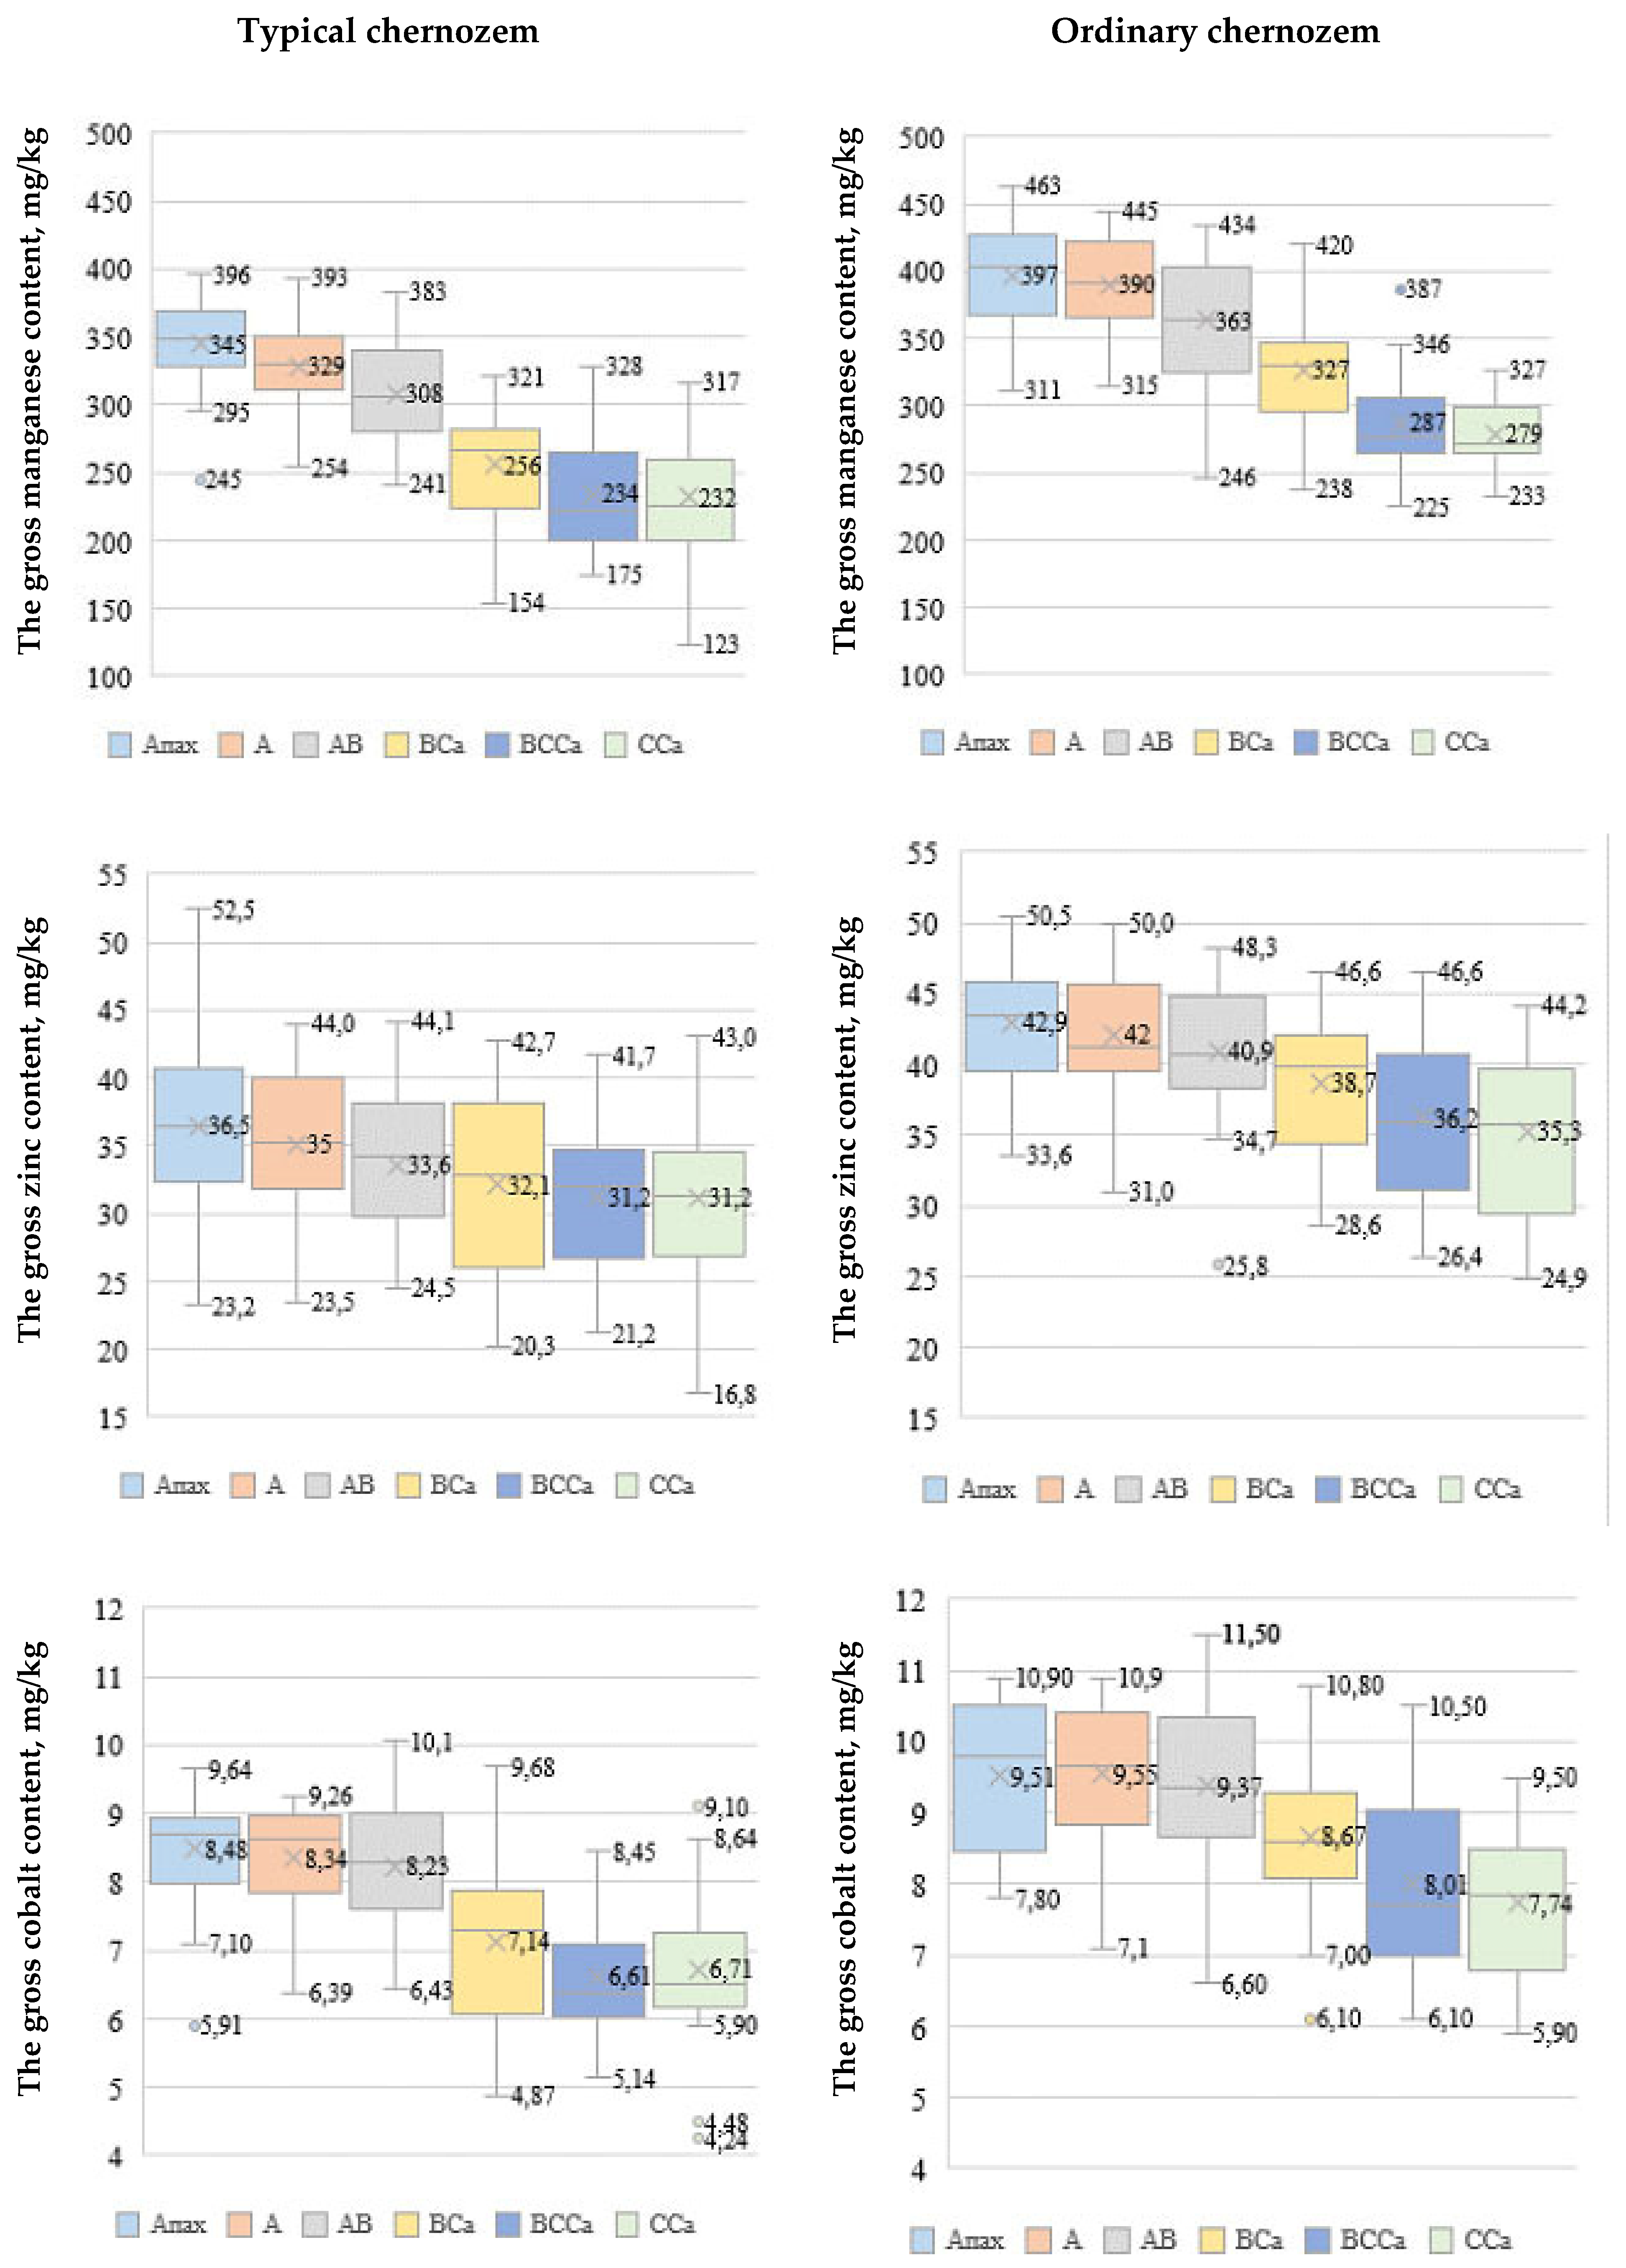
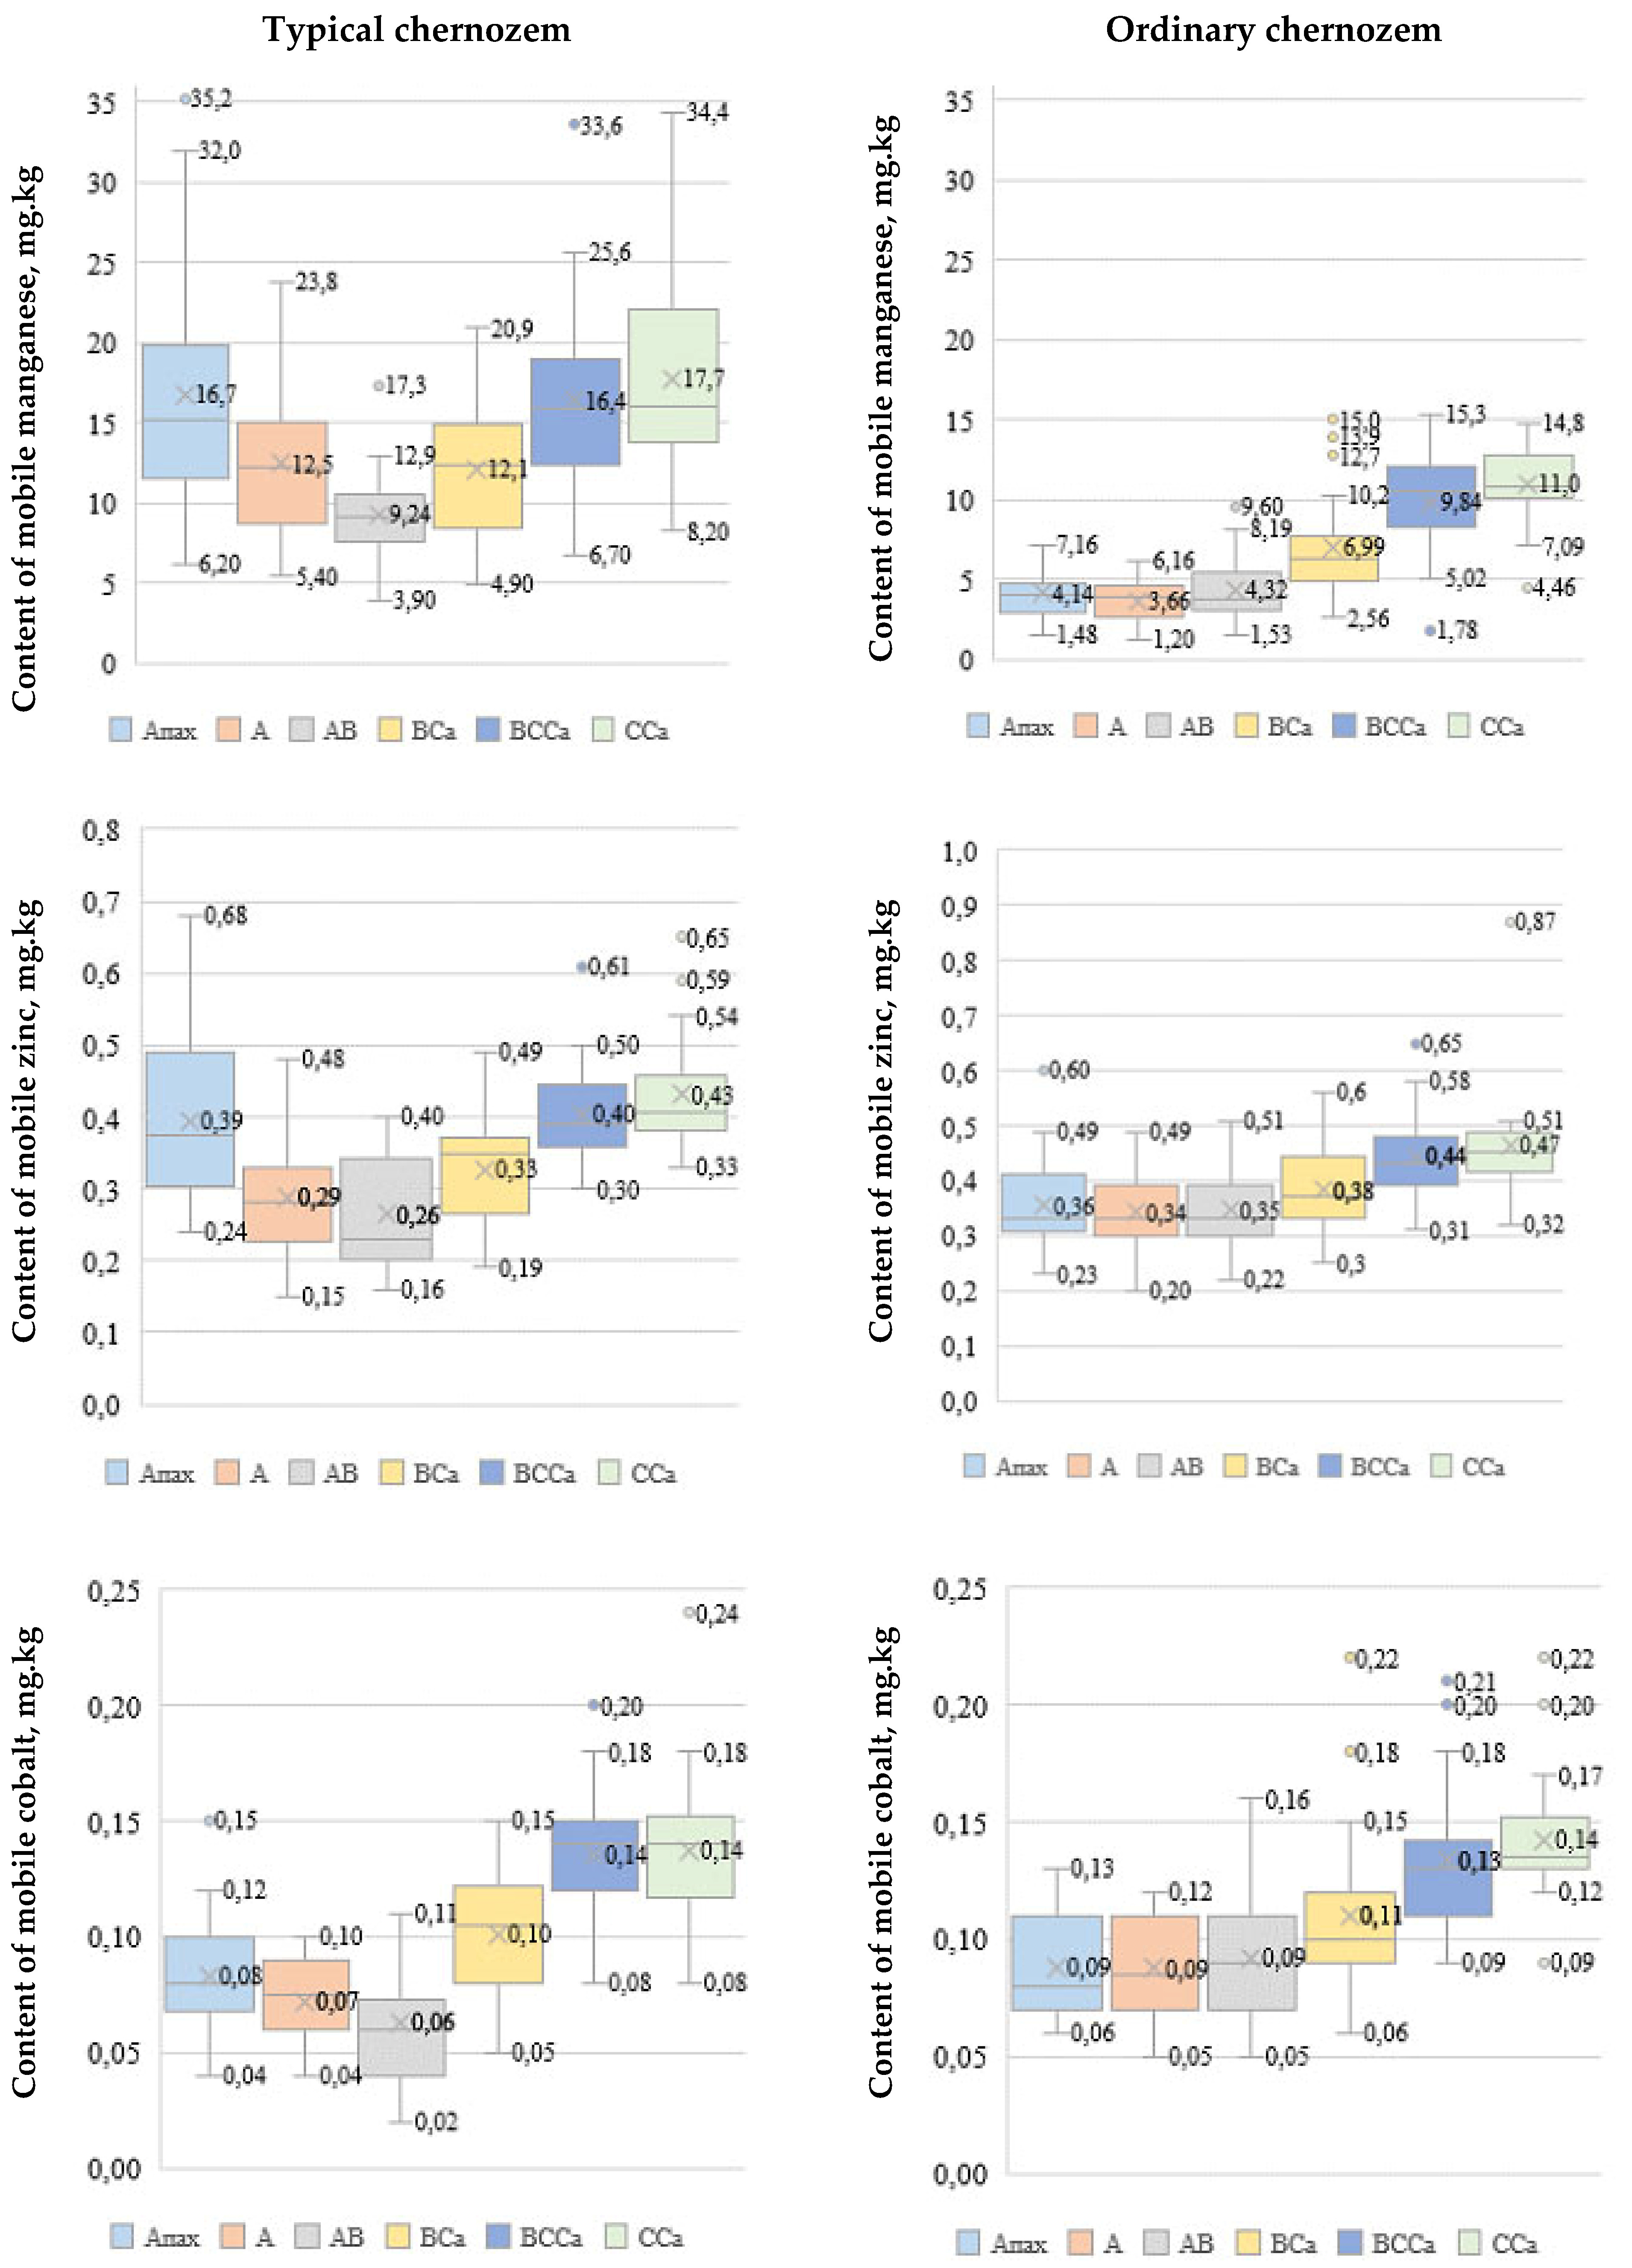
3.1. The Content of Trace Elements in Soils
3.2. The Content of Trace Elements in Plants
3.3. Sources of Supply and Balance of Trace Elements in Agriculture
4. Results and Discussion
4.1. The Content of Trace Elements in Soils
4.2. The Content of Trace Elements in Plants
4.3. Sources of Supply and Balance of Trace Elements in Agriculture
5. Conclusions
- It was found that due to the lower content of physical clay, the gross contents of the studied trace elements in the arable and virgin typical chernozems of the forest-steppe zone were lower than those in the chernozems of the ordinary steppe zone. In the distribution of the gross contents of the studied trace elements in the profile of arable chernozems, a tendency of a gradual decrease in their concentrations with increasing depth was revealed. The background level of mobile forms of cobalt in virgin typical chernozem was estimated as average; the levels of manganese and zinc were estimated as low. In the virgin ordinary chernozem, the contents of mobile forms of all studied trace elements corresponded to a low supply level.
- Amongst the studied crops, the grain of white lupine was found to have the highest contents of manganese (1053 mg/kg), zinc (43.5 mg/kg), and cobalt (0.9 mg/kg) in the main products. The lowest contents of manganese (5.1 mg/kg) and cobalt (0.05 mg/kg) were recorded in corn grain; the lowest content of zinc (14.0 mg/kg) was recorded in alfalfa hay. The safety of using white lupine grain with an abnormally high manganese content for the preparation of concentrated feed will require additional comprehensive study.
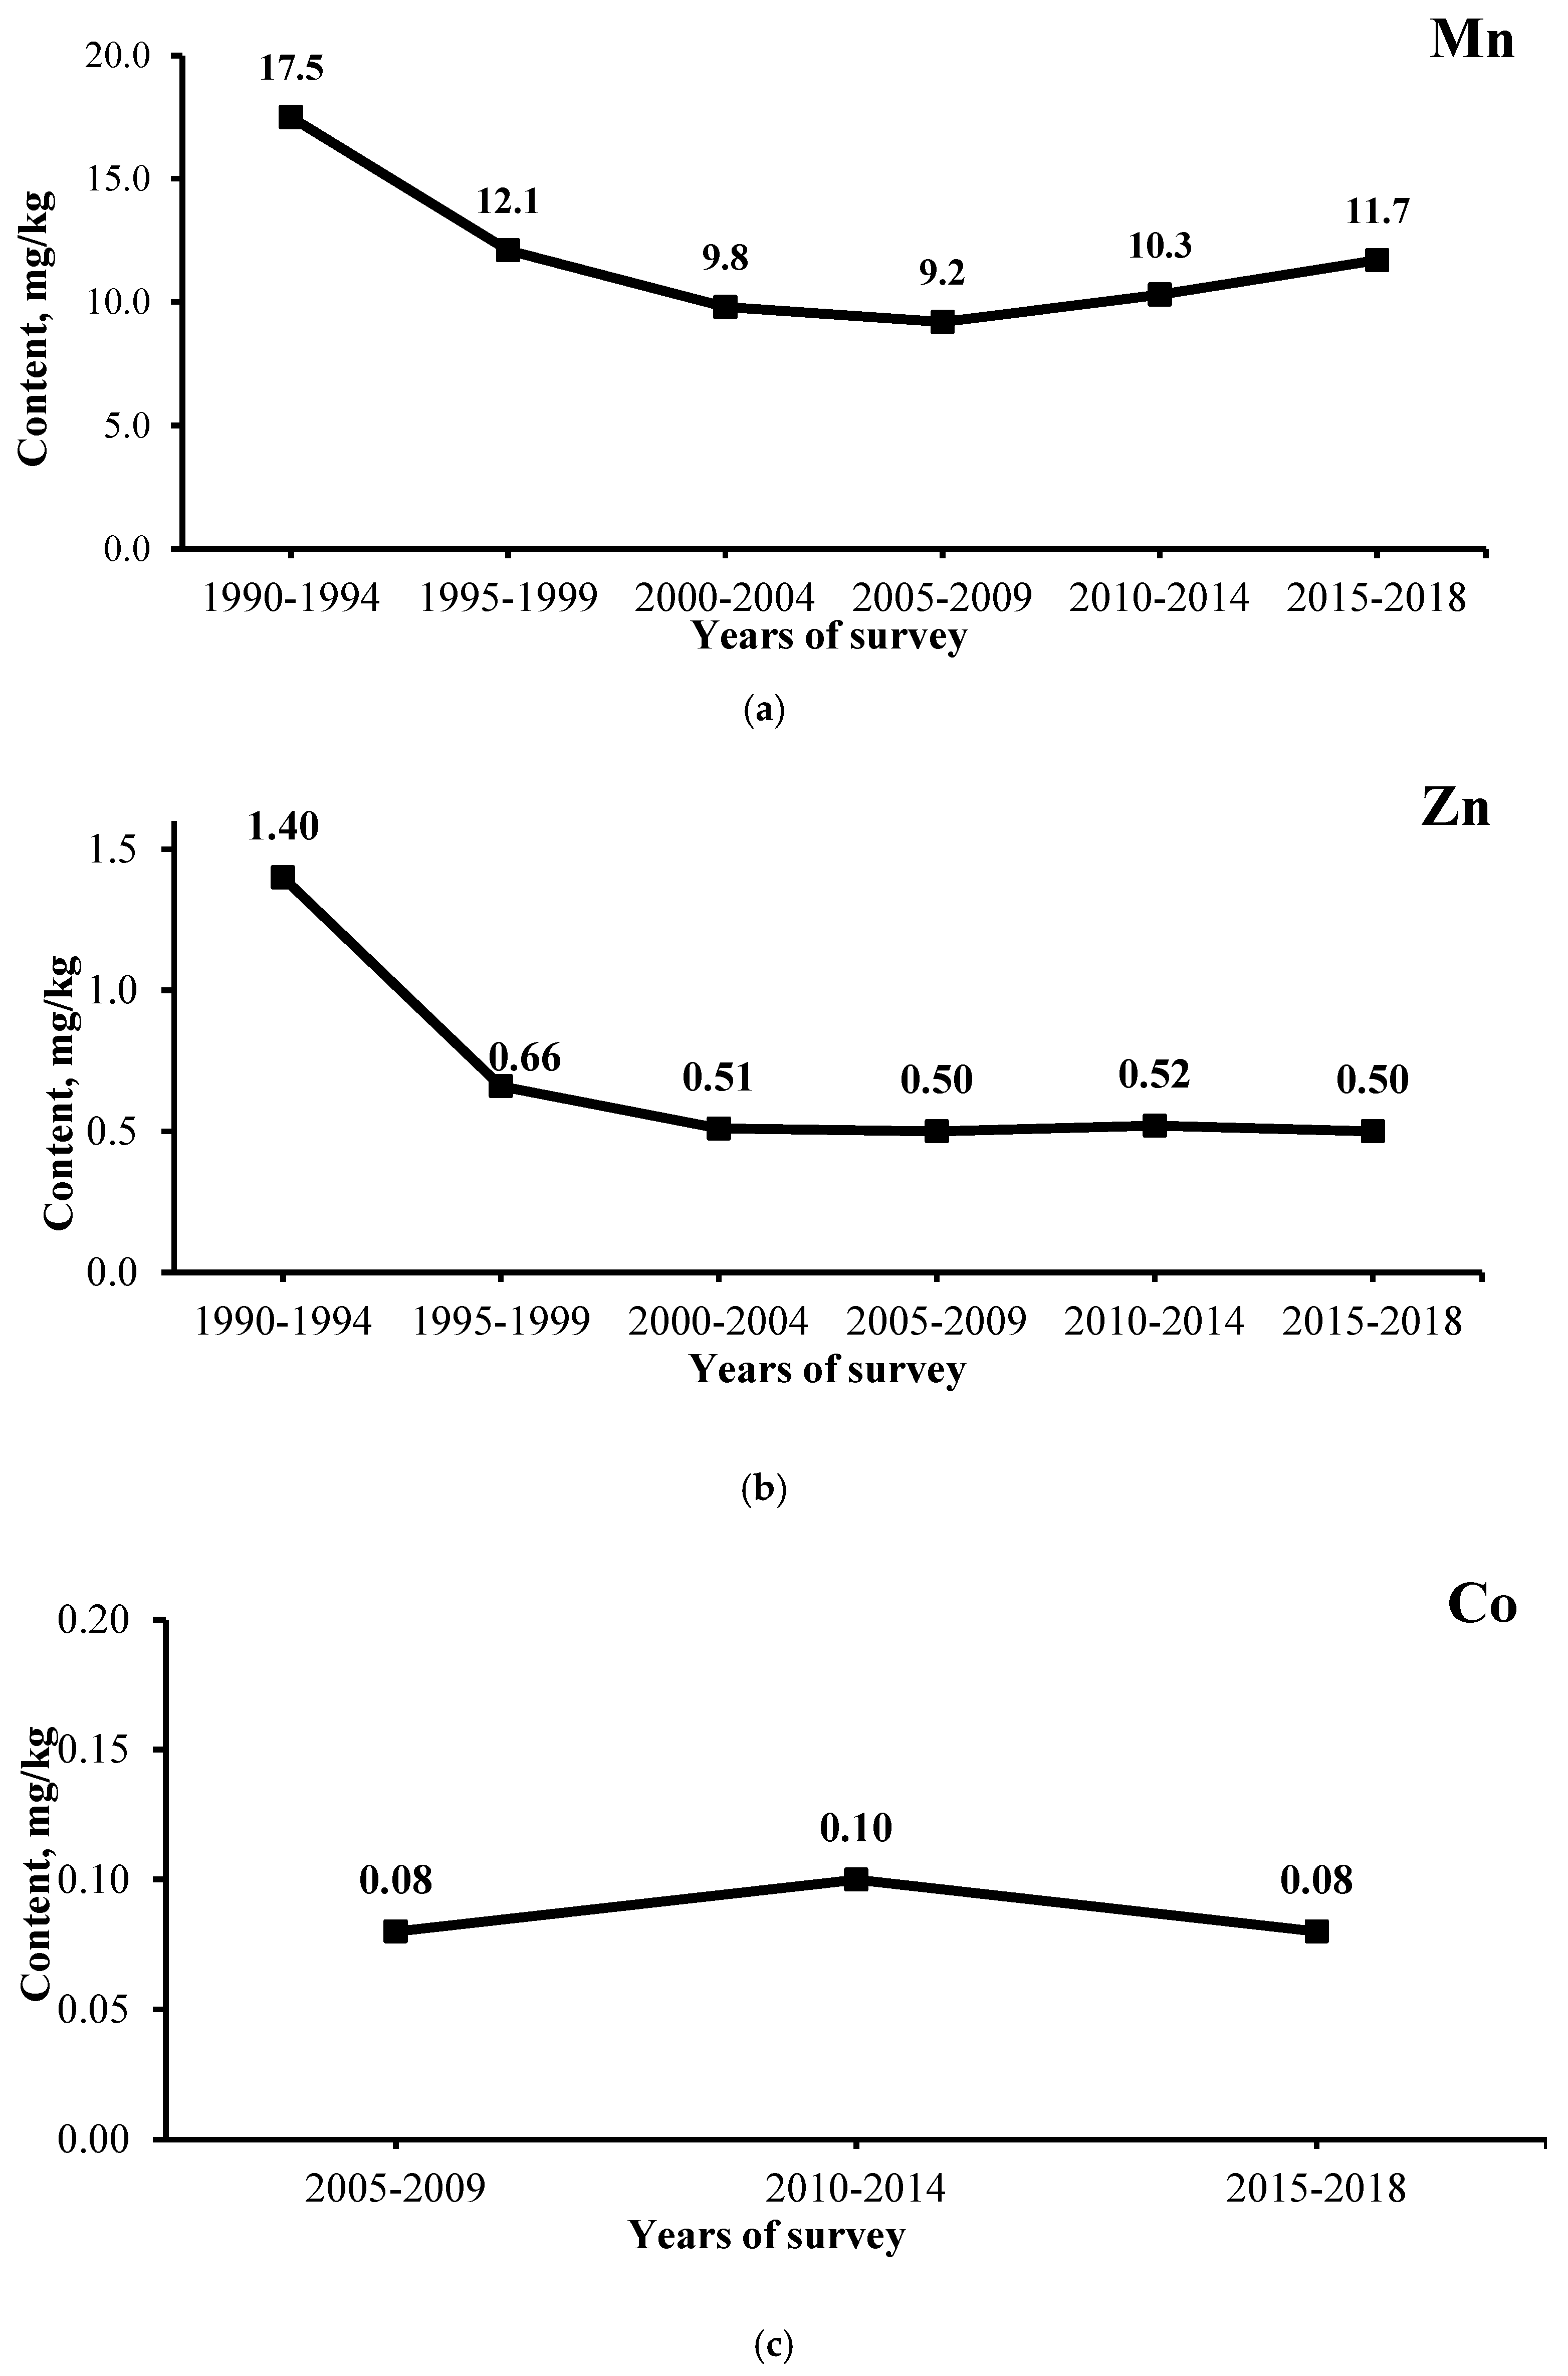
- According to the results of the regional agroecological monitoring of arable soils in the Belgorod region for 2015–2018, it was found that the proportion of soils with a low content of mobile compounds of zinc (<2 mg/kg) was 90.3%; for cobalt (<0.2 mg/kg) it was 99.3%; and for manganese (<10 mg/kg) it was 38.6%. On these soils, it is advisable to introduce microfertilizers containing trace elements that are in deficit.
- The main source of manganese, zinc, and cobalt input to agroecosystems is organic fertilizers, which account for 79.3%, 86.3%, and 66.6% of the total amounts, respectively. Losses of manganese and cobalt from agroecosystems mainly occur as a result of the washing away of arable soils—82.8% and 96.8% of total losses, and 60.5% of zinc losses are due to alienation with the marketable part of the crop. A positive balance had been a feature of zinc with an intensity of 106%, while manganese and cobalt had a negative balance with intensities of 61.3% and 25.3%, respectively.
Author Contributions
Funding
Data Availability Statement
Conflicts of Interest
References
- Lukin, S.V.; Zhuikov, D.V. Monitoring of the contents of manganese, zinc, and copper in soils and plants of the Central Chernozemic region of Russia. Eurasian Soil Sci. 2021, 54, 63–71. [Google Scholar] [CrossRef]
- Poddubnyi, A.S. Dynamics of an agrochemical state of arable lands in the forest-steppe of Belgorod region. Achiev. Sci. Technol. AICis 2018, 32, 15–17. [Google Scholar] [CrossRef]
- Popov, V.V. State of fertility of arable land in the southeastern districts of Rostov region. Achiev. Sci. Technol. AICis 2018, 32, 7–11. [Google Scholar] [CrossRef]
- Sukhova, O.V.; Boldyrev, V.V.; Akulov, A.V. Monitoring of trace elements in the soils of the Volgograd region. Achiev. Sci. Technol. AICis 2019, 33, 20–21. [Google Scholar] [CrossRef]
- Surinov, A.V. Dynamics of fertility of arable chernozems of the forest-steppe zone of the Central Chernozem regions of Russia. Vestn. Kazan State Agrar. Univ. 2021, 61, 57–61. [Google Scholar] [CrossRef]
- Perelman, A.I. Landscape Geochemistry; Vysshaya Shkola: Moscow, Russia, 1975. (In Russian) [Google Scholar]
- Zhuikov, D.V. Sulphur and trace elements in agrocenoses (review). Achiev. Sci. Technol. AICis 2020, 34, 32–42. [Google Scholar] [CrossRef]
- Zhuikov, D.V. Monitoring of the content of trace elements (Mn, Zn, Co) in agrocenoses of the southwestern part of the central chernozem region of Russia. Zemledelie 2020, 5, 9–13. [Google Scholar] [CrossRef]
- Vodyanitskii, Y.N. Zinc forms in soils (review of publications). Eurasian Soil Sci. 2010, 43, 269–277. [Google Scholar] [CrossRef]
- Kabata-Pendias, A. Trace Elements in Soils and Plants, 4th ed.; CRC Press, Taylor and Francis Group: Boca Raton, FL, USA, 2011. [Google Scholar]
- McKenzie, R.M.; Varentsov, I.M.; Grasselly, G. The Manganese Oxides in Soils. In Geology and Geochemistry of Manganese; Akademiai Kiado: Budapest, Hungary, 1980. [Google Scholar]
- Van der Voet, E.; Salminen, R.; Eckelman, M.; Mudd, G.; Norgate, T.; Hischier, R. Environmental Risks and Challenges of Anthropogenic Metals Flows and Cycles; A Report of the Working Group on the Global Metal Flows to the International Resource Panel; United Nations Environment Programme (UNEP): Nairobi, Kenya, 2013. [Google Scholar]
- Lukin, S.V.; Zhuikov, D.V.; Kostin, I.G.; Prazina, E.A.; Zavalin, A.A.; Chernikov, V.A. Monitoring of the content of manganese in soils and agricultural plants of the central chernozem region of Russia. Eur. Asian J. BioSci. 2019, 13, 877–881. [Google Scholar]
- Ilyin, V.B. Heavy Metals and Non-Metals in the Soil-Plant System; Publishing House of Siberian Branch of the Russian Academy of Sciences: Novosibirsk, Russia, 2012. (In Russian) [Google Scholar]
- Medvedev, I.F.; Derevyagin, S.S. Heavy Metals in Ecosystems; Rakurs: Saratov, Russia, 2017. (In Russian) [Google Scholar]
- SanPiN 1.2.3685-21: Hygienic Standards and Requirements for Ensuring the Safety and (or) Harmlessness to Humans of Environmental Factors, Approved. Chief State Sanitary Doctor of the Russian Federation on 28 January 2021, the Official Internet Portal of Legal Information. Available online: http://publication.pravo.gov.ru/Document/View/0001202102030022 (accessed on 15 March 2021).
- VMDU-87: Temporal Maximum Permissible Concentrations of Some Chemical Elements and Gossypol in Fodders and Food Additives for Livestock. Approved by the GUV Gosagroprom of the USSR dated 07.08.87 No. 123-4/281-87 (Moscow, 1987). Available online: https://docs.cntd.ru/document/1200086835 (accessed on 14 December 2021). (In Russian).
- Khizhnyak, R.M. Environmental Assessment of the Content of Microelements (ZN, CU, CO, MO, CR, NI) in the Agroecosystems of the Forest-Steppe Zone of the South-Western Part of the Central–Chernozem Regions. Ph.D. Thesis, Russian State Agrarian University, Moscow, Russia, 2015. [Google Scholar]
- Solovichenko, V.D.; Lukin, S.V.; Lisetskii, F.N.; Goleusov, P.V. The Red Data Book of Soils of Belgorod Oblast; Belgorod State University: Belgorod, Russia, 2007. (In Russian) [Google Scholar]
- Lukin, S.V. Dynamics of the agrochemical fertility parameters of arable soils in the southwestern region of Central Chernozemic zone of Russia. Eurasian Soil Sci. 2017, 50, 1323–1331. [Google Scholar] [CrossRef]
- GOST R 50683-94; Soils. Determination of Mobile Compounds of Copper and Cobalt by the Method of Krupskiy and Aleksandrova in the Modification of TsINAO. Central Research Institute of Agrochemical Services for Agriculture, Main Directorate of Chemicalization, Plant Protection and the State Chemical Commission of the Ministry of Agriculture of the Russian Federation. Publishing House of Standards: Moscow, Russia, 1994. Available online: https://docs.cntd.ru/document/1200025927 (accessed on 14 December 2021). (In Russian)
- GOST R 50685-94; Soils. Determination of Mobile Manganese compounds by the Method of Krupskiy and Aleksandrova in the Modification of TsINAO. Central Research Institute of Agrochemical Services for Agriculture, Main Directorate of Chemicalization, Plant Protection and the State Chemical Commission of the Ministry of Agriculture of the Russian Federation. Publishing House of Standards: Moscow, Russia, 1994. Available online: https://docs.cntd.ru/document/1200025929 (accessed on 14 December 2021). (In Russian)
- GOST R 50686-94; Soils. Determination of Mobile Zinc Compounds by the Method of Krupskiy and Aleksandrova in the Modification of TsINAO. Central Research Institute of Agrochemical Services for Agriculture, Main Directorate of Chemicalization, Plant Protection and the State Chemical Commission of the Ministry of Agriculture of the Russian Federation. Publishing House of Standards: Moscow, Russia, 1994. Available online: https://docs.cntd.ru/document/1200025930 (accessed on 14 December 2021). (In Russian)
- Practical Guide for Analysis of Heavy Metals in Agricultural Soils and Vegetable Products; Approved Deputy Minister of Agriculture of the Russian Federation A.G. Efremov. March 10, 1992; Timiryazev Moscow Agricultural Academy: Moscow, Russia, 1992; Available online: https://docs.cntd.ru/document/1200078918 (accessed on 14 December 2021). (In Russian)
- Russian Regions: Social-Economic Indices. Federal State Statistics Service. Available online: http://www.fedstat.ru/indicators/stat.do (accessed on 24 April 2020).
- Bowen, H.J.M. Environmental Chemistry of the Elements; Academic Press: London, UK, 1979. [Google Scholar]
- Vinogradov, A.P. Geochemistry of Rare and Scattered Chemical Elements in Soils; Academy of Sciences of the USSR: Moscow, Russia, 1957. (In Russian) [Google Scholar]
- Protasova, N.A.; Shcherbakov, A.P. Trace Elements (Cr, V, Ni, Mn, Zn, Cu, Co, Ti, Zr, Ga, Be, Sr, Ba, B, I, Mo) in Chernozems and Gray Forest Soils of Central Chernozemic Region; Voronezh State University: Voronezh, Russia, 2003. (In Russian) [Google Scholar]
- Gorbunova, N.S.; Protasova, N.A. Forms of connections of manganese, copper, zinc in chernozems of central chernozemic region. Proc. Voronezh State Univ. Ser. Chem. Biol. Pharm. 2008, 2, 77–85. [Google Scholar]
- Orlov, D.S.; Sadovnikova, L.K.; Lozanovskaya, I.N. Ecology and Protection of Soils of the Biosphere under Chemical Pollution; Vysshaya Shkola: Moscow, Russia, 2002. (In Russian) [Google Scholar]
- Mazhaiskii, Y.A. The distribution of heavy metals in the profile of soils of Ryazan oblast. Agrochemistry 2003, 8, 74–79. [Google Scholar]
- Sheudzhen, A.K. Biogeochemistry; Adygeya: Maikop, Russia, 2003. (In Russian) [Google Scholar]
- Yumashev, N.P.; Trunov, I.A. Soils of Tambov Oblast; Michurinsk State Agrarian University: Michurinsk, Russia, 2006. (In Russian) [Google Scholar]
- Korchagin, V.I. Environmental and Agrochemical Assessment of Soil Fertility in the Voronezh Region. Ph.D. Thesis, Voronezh State Agrarian University, Voronezh, Russia, 2017. [Google Scholar]
- Duglas, P.O. Impact of trace element pollution on the plants? In Aerial Pollution and Life of the Plants; Gidrometeoizdat: Leningrad, Russia, 1988; pp. 327–356. [Google Scholar]
- Puzanov, A.V.; Meshkinova, S.S. Trace elements in the plants of the Srednyaya Katun valley. Vestn. Altaisk. Gos. Agrar. Univ. 2009, 62, 47–54. [Google Scholar]
- Khizhnyak, R.M. Environmental Assessment of the Content of Trace Elements (Zn, Cu, Co, Mo, Cr, Ni) in the Agroecosystems of the Forest-Steppe Zone of the Southwestern Part of the Central Black Earth Region. Bachelor’s Thesis, Russian State Agrarian University, Moscow, Russia, 2015. [Google Scholar]
- Pavilonis, B.T.; Lioy, P.J.; Guazzetti, S.; Bostick, B.C.; Donna, F.; Peli, M.; Georgopoulos, P.G.; Lucchini, R.G. Manganese concentrations in soil and settled dust in an area with historic ferroalloy production. J. Expo. Sci. Environ. Epidemiol. 2014, 25, 443–450. [Google Scholar] [CrossRef] [PubMed] [Green Version]
- Timofeev, I.; Kosheleva, N.; Kasimov, N. Contamination of soils by potentially toxic elements in the impact zone of tungsten molybdenum ore mine in the Baikal region: A survey and risk assessment. Sci. Total Environ. 2018, 642, 63–76. [Google Scholar] [CrossRef] [PubMed]
- Xiao, R.; Ali, A.; Wang, P.; Li, R.; Tian, X.; Zhang, Z. Comparison of the feasibility of different washing solutions for combined soil washing and phytoremediation for the detoxification of cadmium (Cd) and zinc (Zn) in contaminated soil. Chemosphere 2019, 230, 510–518. [Google Scholar] [CrossRef] [PubMed]
- Melentsova, S.V. Agroecological Assessment of the Content of Chemical Elements S, Zn, Mn, Cu, Cd, Pb in the Soils of the Forest-Steppe and Steppe Zones (by the Example of the Belgorod Region). Bachelor’s Thesis, Russian State Agrarian University, Moscow, Russia, 2007. [Google Scholar]

| Object | Orientation Extreme Points | Geographical Coordinates | |
|---|---|---|---|
| Prokhorovskii District | West | 36.44489° E | 50.95693° N |
| North | 37.02882° E | 51.20390° N | |
| East | 37.20146° E | 51.03487° N | |
| South | 36.90474° E | 50.79393° N | |
| Rovenskii District | West | 38.68557° E | 49.96214° N |
| North | 38.94682° E | 50.30798° N | |
| East | 39.28003° E | 50.03585° N | |
| South | 38.94882° E | 49.79702° N | |
| Genetic Horizon | Typical Chernozem (Forrest-Steppe Zone) | Ordinary Chernozem (Steppe Zone) | ||||
|---|---|---|---|---|---|---|
| Average Thickness of Horizon, cm | Corg, % | pHH2O | Average Thickness of Horizon, cm | Corg, % | pHH2O | |
| Ap (ploughable) | 0–25 | 3.25 | 6.7 | 0–25 | 3.02 | 7.8 |
| A (humus-accumulative) | 26–36 | 2.90 | 6.9 | 26–43 | 2.78 | 7.9 |
| AB (transitional humus) | 37–90 | 2.01 | 7.5 | 44–72 | 2.38 | 7.9 |
| BCa (illuvial carbonate) | 91–111 | 1.22 | 8.0 | 73–90 | 1.68 | 8.1 |
| BCCa (transitional) | 112–134 | 0.75 | 8.1 | 91–124 | 1.10 | 8.3 |
| CCa (parent material) | ˃135 | 0.58 | 8.1 | ˃125 | 0.93 | 8.3 |
| Typical Chernozem (Forest-Steppe Zone) | Ordinary Chernozem (Steppe Zone) | ||||||||
|---|---|---|---|---|---|---|---|---|---|
| Genetic Horizon | Average Thickness of Horizon, cm | Sampling Depth, cm | Corg, % | pHH2O | Genetic Horizon | Average Thickness of Horizon, cm | Sampling Depth, cm | Corg, % | pHH2O |
| A | 7–47 | 10–20 | 5.86 | 6.0 | ACa | 5–35 | 15–25 | 3.77 | 7.1 |
| 30–40 | 3.36 | 6.4 | |||||||
| ABCa | 48–75 | 55–65 | 2.73 | 6.9 | BCa | 36–55 | 40–50 | 1.45 | 6.9 |
| BCa | 76–98 | 80–90 | 1.91 | 7.3 | |||||
| BCCa | 99–120 | 105–115 | 1.62 | 7.3 | BCCa | 56–83 | 65–75 | 1.04 | 7.3 |
| CCa | 121–165 | 150–160 | 0.64 | 7.4 | CCa | 83–150 | 110–120 | 0.35 | 7.3 |
| Typical Chernozem (Forest-Steppe Zone) | Ordinary Chernozem (Steppe Zone) | ||||||||
|---|---|---|---|---|---|---|---|---|---|
| Genetic Horizon | Sampling Depth, cm | Total Content, mg/kg | Genetic Horizon | Sampling Depth, cm | Total Content, mg/kg | ||||
| Mn | Zn | Co | Mn | Zn | Co | ||||
| A | 10–20 | 476 | 44.7 | 8.3 | ACa | 15–25 | 480 | 49.9 | 8.7 |
| 30–40 | 460 | 45.3 | 8.5 | ||||||
| ABCa | 55–65 | 424 | 43.8 | 7.9 | BCa | 40–50 | 455 | 47.3 | 8.0 |
| BCa | 80–90 | 420 | 44.9 | 7.7 | |||||
| BCCa | 105–115 | 393 | 44.3 | 7.4 | BCCa | 65–75 | 426 | 44.2 | 7.1 |
| CCa | 150–160 | 349 | 38.7 | 6.8 | CCa | 110–120 | 355 | 43.4 | 6.6 |
| Typical Chernozem (Forest-Steppe Zone) | Ordinary Chernozem (Steppe Zone) | ||||||||
|---|---|---|---|---|---|---|---|---|---|
| Genetic Horizon | Sampling Depth, cm | Content of Mobile Compounds, mg/kg | Genetic Horizon | Sampling Depth, cm | Content of Mobile Compounds, mg/kg | ||||
| Mn | Zn | Co | Mn | Zn | Co | ||||
| A | 10–20 | 8.11 | 0.79 | 0.20 | ACa | 15–25 | 6.10 | 0.80 | 0.07 |
| 30–40 | 7.64 | 0.64 | 0.16 | ||||||
| ABCa | 55–65 | 3.87 | 0.72 | 0.25 | BCa | 40–50 | 5.83 | 0.57 | 0.06 |
| BCa | 80–90 | 2.59 | 0.36 | 0.22 | |||||
| BCCa | 105–115 | 2.13 | 0.36 | 0.24 | BCCa | 65–75 | 7.77 | 0.42 | 0.07 |
| CCa | 150–160 | 1.74 | 0.67 | 0.22 | CCa | 110–120 | 8.63 | 0.66 | 0.10 |
| Crop | Manganese | Zinc | Cobalt | |||||||
|---|---|---|---|---|---|---|---|---|---|---|
| Lim | V, % | Lim | V, % | Lim | V, % | |||||
| Winter wheat | Grain | 33.3 ± 2.79 | 23.0–48.1 | 18.9 | 28.6 ± 1.55 | 26.4–34.0 | 11.6 | 0.12 ± 0.01 | 0.08–0.15 | 15.4 |
| Straw | 23.7 ± 1.99 | 15.3–30.9 | 19.0 | 10.4 ± 0.69 | 8.55–13.7 | 14.1 | 0.11 ± 0.01 | 0.09–0.14 | 13.9 | |
| Spring | Grain | 14.1 ± 1.0 | 10.2–18.4 | 17.9 | 25.4 ± 1.6 | 19.4–32.7 | 15.7 | 0.09 ± 0.01 | 0.06–0.13 | 22.9 |
| Straw | 23.8 ± 2.9 | 14.0–39.6 | 29.4 | 11.9 ± 1.3 | 7.8–18.2 | 26.1 | 0.11 ± 0.01 | 0.08–0.14 | 14.6 | |
| Corn | Grain | 5.1 ± 0.2 | 4.6–6.9 | 9.3 | 17.6 ± 0.9 | 13.0–20.6 | 12.1 | 0.05 ± 0.01 | 0.03–0.09 | 26.3 |
| Straw | 47.9 ± 1.9 | 34.3–53.2 | 9.5 | 14.0 ± 0.3 | 13.3–15.9 | 4.8 | 0.16 ± 0.01 | 0.12–0.20 | 15.2 | |
| Sunflower | Seeds | 18.3 ± 0.7 | 12.6–19.6 | 8.7 | 41.1 ± 1.3 | 34.1–45.7 | 7.4 | 0.13 ± 0.01 | 0.10–0.20 | 18.2 |
| Stems | 10.8 ± 1.0 | 8.9–17.3 | 22.7 | 14.6 ± 0.8 | 13.0–19.3 | 12.5 | 0.17 ± 0.01 | 0.11–0.20 | 11.7 | |
| White lupine | Grain | 1053 ± 50.9 | 857–1221 | 10.3 | 43.5 ± 1.91 | 36.5–51.1 | 9.4 | 0.90 ± 0.11 | 0.64–1.41 | 27.0 |
| Straw | 841 ± 91.2 | 594–1207 | 23.2 | 8.98 ± 1.20 | 6.10–16.21 | 28.5 | 0.60 ± 0.07 | 0.38–0.93 | 25.1 | |
| Soybean | Grain | 24.1 ± 1.15 | 16.9–27.9 | 10.8 | 35.6 ± 3.54 | 25.3–47.3 | 22.5 | 0.21 ± 0.01 | 0.16–0.25 | 14.3 |
| Straw | 12.4 ± 1.10 | 7.50–17.6 | 20.0 | 6.38 ± 0.59 | 4.49–8.54 | 20.7 | 0.14 ± 0.01 | 0.11–0.19 | 18.4 | |
| Pea | Grain | 9.22 ± 0.47 | 7.33–10.9 | 11.6 | 26.45 ± 1.47 | 17.34–30.9 | 12.6 | 0.18 ± 0.01 | 0.15–0.21 | 10.0 |
| Straw | 18.0 ± 1.67 | 7.76–22.5 | 21.0 | 3.34 ± 0.57 | 1.30–5.51 | 38.5 | 0.10 ± 0.01 | 0.06–0.12 | 16.0 | |
| Clover | Hay | 31.2 ± 1.69 | 24.5–37.6 | 12.3 | 16.5 ± 0.81 | 13.0–19.2 | 11.0 | 0.21 ± 0.01 | 0.17–0.24 | 9.3 |
| Sainfoin | Hay | 30.7 ± 0.97 | 27.4–34.9 | 7.1 | 17.8 ± 1.0 | 12.7–20.7 | 12.7 | 0.07 ± 0.01 | 0.04–0.08 | 17.0 |
| Alfalfa | Hay | 28.5 ± 1.48 | 22.9–37.5 | 11.8 | 14.0 ± 1.82 | 6.88–19.8 | 29.3 | 0.07 ± 0.01 | 0.05–0.12 | 21.7 |
| Steppe mixed herbs | Hay | 25.9 ± 1.52 | 20.0–31.1 | 13.2 | 8.26 ± 0.57 | 5.30–9.95 | 15.4 | 0.09 ± 0.01 | 0.04–0.15 | 30.6 |
| Steppe mixed herbs | Hay | 29.4 ± 2.75 | 17.3–44.2 | 21.1 | 6.06 ± 0.51 | 4.02–8.07 | 18.9 | 0.035 ± 0.004 | 0.02–0.06 | 23.2 |
| Crop | Manganese | Zinc | Cobalt | |
|---|---|---|---|---|
| Winter wheat | Grain | 4.39 | 35.6 | 0.59 |
| Straw | 0.99 | 4.13 | 0.24 | |
| Spring | Grain | 1.36 | 23.2 | 0.35 |
| Straw | 1.02 | 4.82 | 0.19 | |
| Corn | Grain | 0.99 | 32.1 | 0.39 |
| Straw | 1.9 | 5.26 | 0.26 | |
| Sunflower | Seeds | 2.12 | 45.0 | 0.61 |
| Stems | 0.61 | 7.84 | 0.23 | |
| White lupine | Grain | 72.7 | 28.4 | 2.48 |
| Straw | 39.3 | 3.97 | 1.18 | |
| Soybean | Grain | 1.34 | 18.8 | 0.47 |
| Straw | 0.64 | 3.12 | 0.35 | |
| Pea | Grain | 0.86 | 23.4 | 0.71 |
| Straw | 0.65 | 1.15 | 0.12 | |
| Alfalfa | Hay | 0.97 | 4.51 | 0.12 |
| Clover | Hay | 1.03 | 5.14 | 0.24 |
| Sainfoin | Hay | 1.59 | 8.71 | 0.12 |
| Steppe mixed grasses (Belogorye Reserve, Yamskaya steppe section) | Hay | 0.71 | 3.66 | 0.12 |
| Steppe mixed grasses (Rovenskii Natural Park) | Hay | 0.88 | 3.21 | 0.11 |
| Statistical Value | Manganese | Zinc | Cobalt |
|---|---|---|---|
| Straw and litter compost (34% moisture content) | |||
| n | 25 | 25 | 25 |
| lim | 66–257 | 139–451 | 0.65–2.54 |
| 159 ± 21 | 300 ± 42 | 1.56 ± 0.21 | |
| V, % | 32.6 | 34.7 | 33.7 |
| Cattle manure (75% moisture content) | |||
| n | 32 | 32 | 32 |
| lim | 17.4–88.4 | 11.5–37.4 | 0.14–0.56 |
| 48.0 ± 5.32 | 20.0 ± 2.44 | 0.35 ± 0.05 | |
| V, % | 30.8 | 33.8 | 36.5 |
| Manure sewage (97.78% moisture content) | |||
| n | 26 | 26 | 26 |
| lim | 1.13–7.08 | 22.7–88.9 | 0.08–0.23 |
| 3.97 ± 0.59 | 53.3 ± 7.77 | 0.15 ± 0.02 | |
| V, % | 36.7 | 36.1 | 25.6 |
| Defecate (13% moisture content) | |||
| n | 18 | 18 | 18 |
| lim | 97.4–268 | 16.6–62.7 | 1.81–4.35 |
| 185 ± 26.9 | 43.8 ± 7.54 | 2.76 ± 0.40 | |
| V, % | 29.3 | 34.6 | 28.8 |
| Balance Particles | Manganese | Zinc | Cobalt | |
|---|---|---|---|---|
| Inflow, g/ha | with organic fertilizers | 389 | 162 | 2.84 |
| with ameliorants | 7.42 | 1.37 | 0.06 | |
| with seeds | 90.7 | 21.5 | 1.35 | |
| with mineral fertilizers | 3.34 | 2.85 | 0.013 | |
| total | 490 | 188 | 4.26 | |
| Outflow, g/ha | removal with crops | 138 | 107 | 0.53 |
| as a result of soil erosion losses | 662 | 70.1 | 16.3 | |
| total | 800 | 177 | 16.8 | |
| Balance, ±g/ha | −310 | 10.3 | −12.6 | |
| Balance intensity, % | 61.3 | 106 | 25.3 | |
Publisher’s Note: MDPI stays neutral with regard to jurisdictional claims in published maps and institutional affiliations. |
© 2022 by the authors. Licensee MDPI, Basel, Switzerland. This article is an open access article distributed under the terms and conditions of the Creative Commons Attribution (CC BY) license (https://creativecommons.org/licenses/by/4.0/).
Share and Cite
Lukin, S.V.; Zhuikov, D.V. Content and Balance of Trace Elements (Co, Mn, Zn) in Agroecosystems of the Central Chernozemic Region of Russia. Agriculture 2022, 12, 154. https://doi.org/10.3390/agriculture12020154
Lukin SV, Zhuikov DV. Content and Balance of Trace Elements (Co, Mn, Zn) in Agroecosystems of the Central Chernozemic Region of Russia. Agriculture. 2022; 12(2):154. https://doi.org/10.3390/agriculture12020154
Chicago/Turabian StyleLukin, Sergei Victorovich, and Denis Valerievich Zhuikov. 2022. "Content and Balance of Trace Elements (Co, Mn, Zn) in Agroecosystems of the Central Chernozemic Region of Russia" Agriculture 12, no. 2: 154. https://doi.org/10.3390/agriculture12020154
APA StyleLukin, S. V., & Zhuikov, D. V. (2022). Content and Balance of Trace Elements (Co, Mn, Zn) in Agroecosystems of the Central Chernozemic Region of Russia. Agriculture, 12(2), 154. https://doi.org/10.3390/agriculture12020154