Article

Research on Dynamic Load Characteristics of Advanced Variable Speed Drive System for Agricultural Machinery during Engagement

1
Department of Vehicle Engineering, Nanjing Forestry University, Nanjing 210037, China
2
College of Engineering, Nanjing Agricultural University, Nanjing 210031, China
*
Author to whom correspondence should be addressed.
Agriculture 2022, 12(2), 161; https://doi.org/10.3390/agriculture12020161
Submission received: 6 January 2022 / Revised: 19 January 2022 / Accepted: 21 January 2022 / Published: 24 January 2022

Abstract

:
A wet clutch is the key component to realize power uninterrupted in agricultural machinery operation. To reduce impact of the system and improve engagement quality, this paper studies and establishes the dynamic load characteristics model of a wet clutch and analyzes three kinds of tractor working conditions. This paper proposes and adopts the method of combining ‘PLS analysis-Improved SA—Comparison of various models-Actual test data’. The results show that with the limit of 100 Nm, the relationship between dynamic load characteristics and oil pressure is opposite. Load is highly inversely correlated with dynamic load, and it has enough precision to build a power curve model only by load (MAPE is 4.5929%). Take a certain type of tractor for example, oil pressure should be maintained at a low level, plowing resistance should be greater than 1600 N and the mass of transportation should avoid 600~1800 kg. This study provides a direct basis for the control, design and performance improvement of agricultural machinery.

1. Introduction

Agricultural machinery faces bad working environment and variable load conditions. When the engine type is determined, the power performance and economic performance of agricultural machinery are mainly determined by the transmission ratio (the gear number) of the power transmission system. When the variable gear number of the transmission system is small, the engine is more difficult to work within the operating range of power or economy (unable to meet the performance requirements of agricultural machinery in complex and changeable conditions). Therefore, agricultural machinery usually has more working gear positions (or modes), and it is also necessary to ensure that the power is continuous during switching [1,2,3]. Hydro-mechanical continuously variable transmission (HMCVT) [4,5], power shift transmission [6,7], multi-power source coupling driven systems [8,9] as advanced agricultural machinery transmission systems can meet the above performance requirements. Most of the advanced systems use a wet clutch. Wet clutch is the core component to realize the uninterrupted power of agricultural machinery such as tractors and cotton pickers. At present, the research on wet clutches in agricultural machinery such as tractors is relatively limited. Chen et al. [10], Han et al. [11], Raikwar et al. [12], Li et al. [13], Tan et al. [14] and Song et al. [15], respectively, studied the performance, control and function of a wet clutch in tractor systems.
However, during the engagement process of a wet clutch, the load torque of the power transmission system increases instantaneously (dynamic load increases, that is, the ratio of instantaneous output torque to steady torque is greater than one in a short time) [16]. Therefore, in order to protect the agricultural machinery power transmission system, improve the reliability of the system components and reduce the impact, it is necessary to study the dynamic load characteristics.
At present, some scholars have carried out a certain degree of research on the dynamic load characteristics of the power transmission system of agricultural machinery. The research is mainly divided into two types. Lu et al. [17] used Simulation X software to build the simulation test platform of a wet clutch and compared the simulation test platform with the actual test results (combined with three different working conditions). After verifying the correctness of the simulation test platform, they carried out the simulation test and analysis of the dynamic load characteristics of two factors (oil pressure and flow rate) based on the platform. Similarly, Wang et al. [18] also studied the dynamic load characteristics of a wet clutch by using the simulation model with verified accuracy. Likewise, Qian et al. [19] built a dynamic load characteristics model based on Simulation X software and adopted orthogonal test and range analysis. Xu et al. [20] simulated and analyzed the dynamic load characteristics of dual-clutch automatic transmission for tractors. Ni et al. [21] carried out bench tests by using a test bench equipped with a wet clutch and combined with an orthogonal test method. Wang et al. [22,23] studied the dynamic load characteristics of a wet clutch by loading test with single factor and orthogonal test with three levels and four factors (oil pressure, flow rate, rotation speed and torque). Yu et al. [24] studied the variation of friction torque with working parameters through the wet clutch test bench, and the results showed that the reasonable design of working parameters could improve the working quality of the clutch. Park et al. [25] used a combination of model and experiment to show the clutch torque variation characteristics and conduct the corresponding estimate. In summary, the technical route of the current research is mainly divided into two types. The first type of research uses computer software to establish a virtual model of the wet clutch and conducted simulation tests. The second type is an actual measurement test of dynamic load characteristics by bench. At the same time, most of the current studies have certain limitations in the number of influencing factors or in the number of factor levels (that is, both simulation and actual tests have adopted fewer samples for analysis and research).
Moreover, these studies used single factor tests, orthogonal tests or full factor tests to analyze the influence of various factors on dynamic load characteristics. However, few scholars have studied the variation of dynamic load characteristics and established dynamic load prediction models. In addition, it is difficult to obtain the specific and quantitative influence of various factors on dynamic load characteristics by range analysis. The MAP of dynamic load characteristics under various working conditions of agricultural machinery, such as tractors, is of direct help to the formulation, design and performance improvement of control strategy. However, no such research has been reported. The study of dynamic load characteristics under low load also has some deficiencies. There are also some deficiencies in the study of dynamic load characteristics under low load.
In addition to the above, the research results in references [17,18,19,20,21,22,23] show that engine speed, load, oil pressure and flow rate have an impact on the variation characteristics of output torque in the wet clutch engagement process (the dynamic load characteristics are affected). Additionally, combined with these studies, the influence of load and oil pressure on dynamic load is relatively greater. However, more practical experiments and data analysis techniques are needed for further proof. Moreover, there are still some deficiencies in the research on the use of load and oil pressure to describe the dynamic load characteristics and the quantitative value to reflect the correlation between factors and dynamic load.
To solve the above problems, this paper mainly carries on four parts of work. (1) PLS is used to analyze the influencing factors of dynamic load on the data obtained by previous studies. (2) The actual test of dynamic load is carried out based on the wet clutch bench, and 214 groups of test data are obtained. (3) Based on the analysis of PLS, I-SA and various types of models, the dynamic load characteristics prediction model is established. (4) Based on the prediction model, the dynamic load MAP of a certain type of tractor is obtained under three working conditions. The variation of dynamic load and measures for improving performance are analyzed.

2. Materials and Methods

2.1. Reference Data Analysis Method Based on PLS

PLS combines multiple linear regression, canonical correlation analysis and principal component analysis. Additionally, PLS can better explain the influence of each independent variable on the dependent variable [26,27]. In order to further quantitatively analyze the influence of each factor on dynamic load, this paper proposes to use PLS to analyze the research data in references [19] (select three independent variables: load, oil pressure and flow rate), refs. [21,22] (select four independent variables: load, oil pressure, rotational speed and flow rate) to obtain the influence degree of each factor.

2.2. Test Bench for Dynamic Load Characteristic Measurement

The test bench for measuring dynamic load characteristics of a tractor transmission system is shown in Figure 1.
The test bench uses a diesel engine (Deutz TCD2013L062V diesel engine, the power rating of the engine is 197.7 kw and the rated speed is 2300 r/min) as the power source. The engine power is input to the active end of the wet clutch through the gear transmission system with a fixed transmission ratio. The speed and torque sensors are installed at the driven end of the wet clutch to measure the torque change of the power transmission system and calculate the dynamic load. The loading system uses an eddy current dynamometer (DW250 device of Jiangsu Lanmec Electromechanical Technology, the maximum power of the dynamometer is 250 kw and the rated speed is 2000 r/min). The output side of a wet clutch is ZJ-5000A speed and torque sensor of Jiangsu Lanmec. The rated torque is 4000 Nm and the range of working speed is 0–5000 r/min. The signal output range of signal converter (model: ZJ-A-F/A, the company: Jiangsu Lanmec Electromechanical Technology Co., Ltd., Hai’an, China) is 4–20 mA.
Other details of the test bench refer to previous studies [16,28]. The variable transmission system with a wet clutch is mainly composed of the engine, a variable displacement pump-constant displacement motor system, eight gear pairs, two planetary rows and three wet clutches. It is a hydraulic-mechanical power coupled continuously variable transmission system. The system has three working sections (the speed ratio in each section is stepless). The first section is the hydrostatic transmission mode (the theoretical variation range of speed ratio is 5.59~+∞). The second section and the third section are power coupling modes (the theoretical variation range of speed ratio is 1.91~15.51). This continuously variable transmission system changes the working sections by switching wet clutches. The auxiliary gearbox (model: 8JS105TA, the company: Shaanxi Fast Auto Drive Group Co., Ltd., Xi’an, China) is a stepped gearbox with eight forward gears (with the increase of gear positions, the transmission ratios are 8.08, 5.66, 3.98, 2.86, 2.03, 1.42, 1.00 and 0.72, respectively).
The wet clutch is completely separated before measuring dynamic load. In the measurement of dynamic load, firstly, the input speed of the wet clutch is adjusted by the diesel engine (the power output from the diesel engine passes through the transmission shaft, gears and planetary gear train to the input end of the clutch). Secondly, the load torque of the wet clutch output end is adjusted by the electric eddy current dynamometer (the output power of the clutch passes through the transmission shaft, the auxiliary gearbox and then reaches the electric eddy current dynamometer). Finally, the clutch engagement is controlled by the valve with a certain oil pressure or flow rate (specifically, the final stable oil pressure of the hydraulic system is regulated by the electromagnetic relief valve, and the flow rate of the hydraulic system at work is regulated by the proportional directional valve).

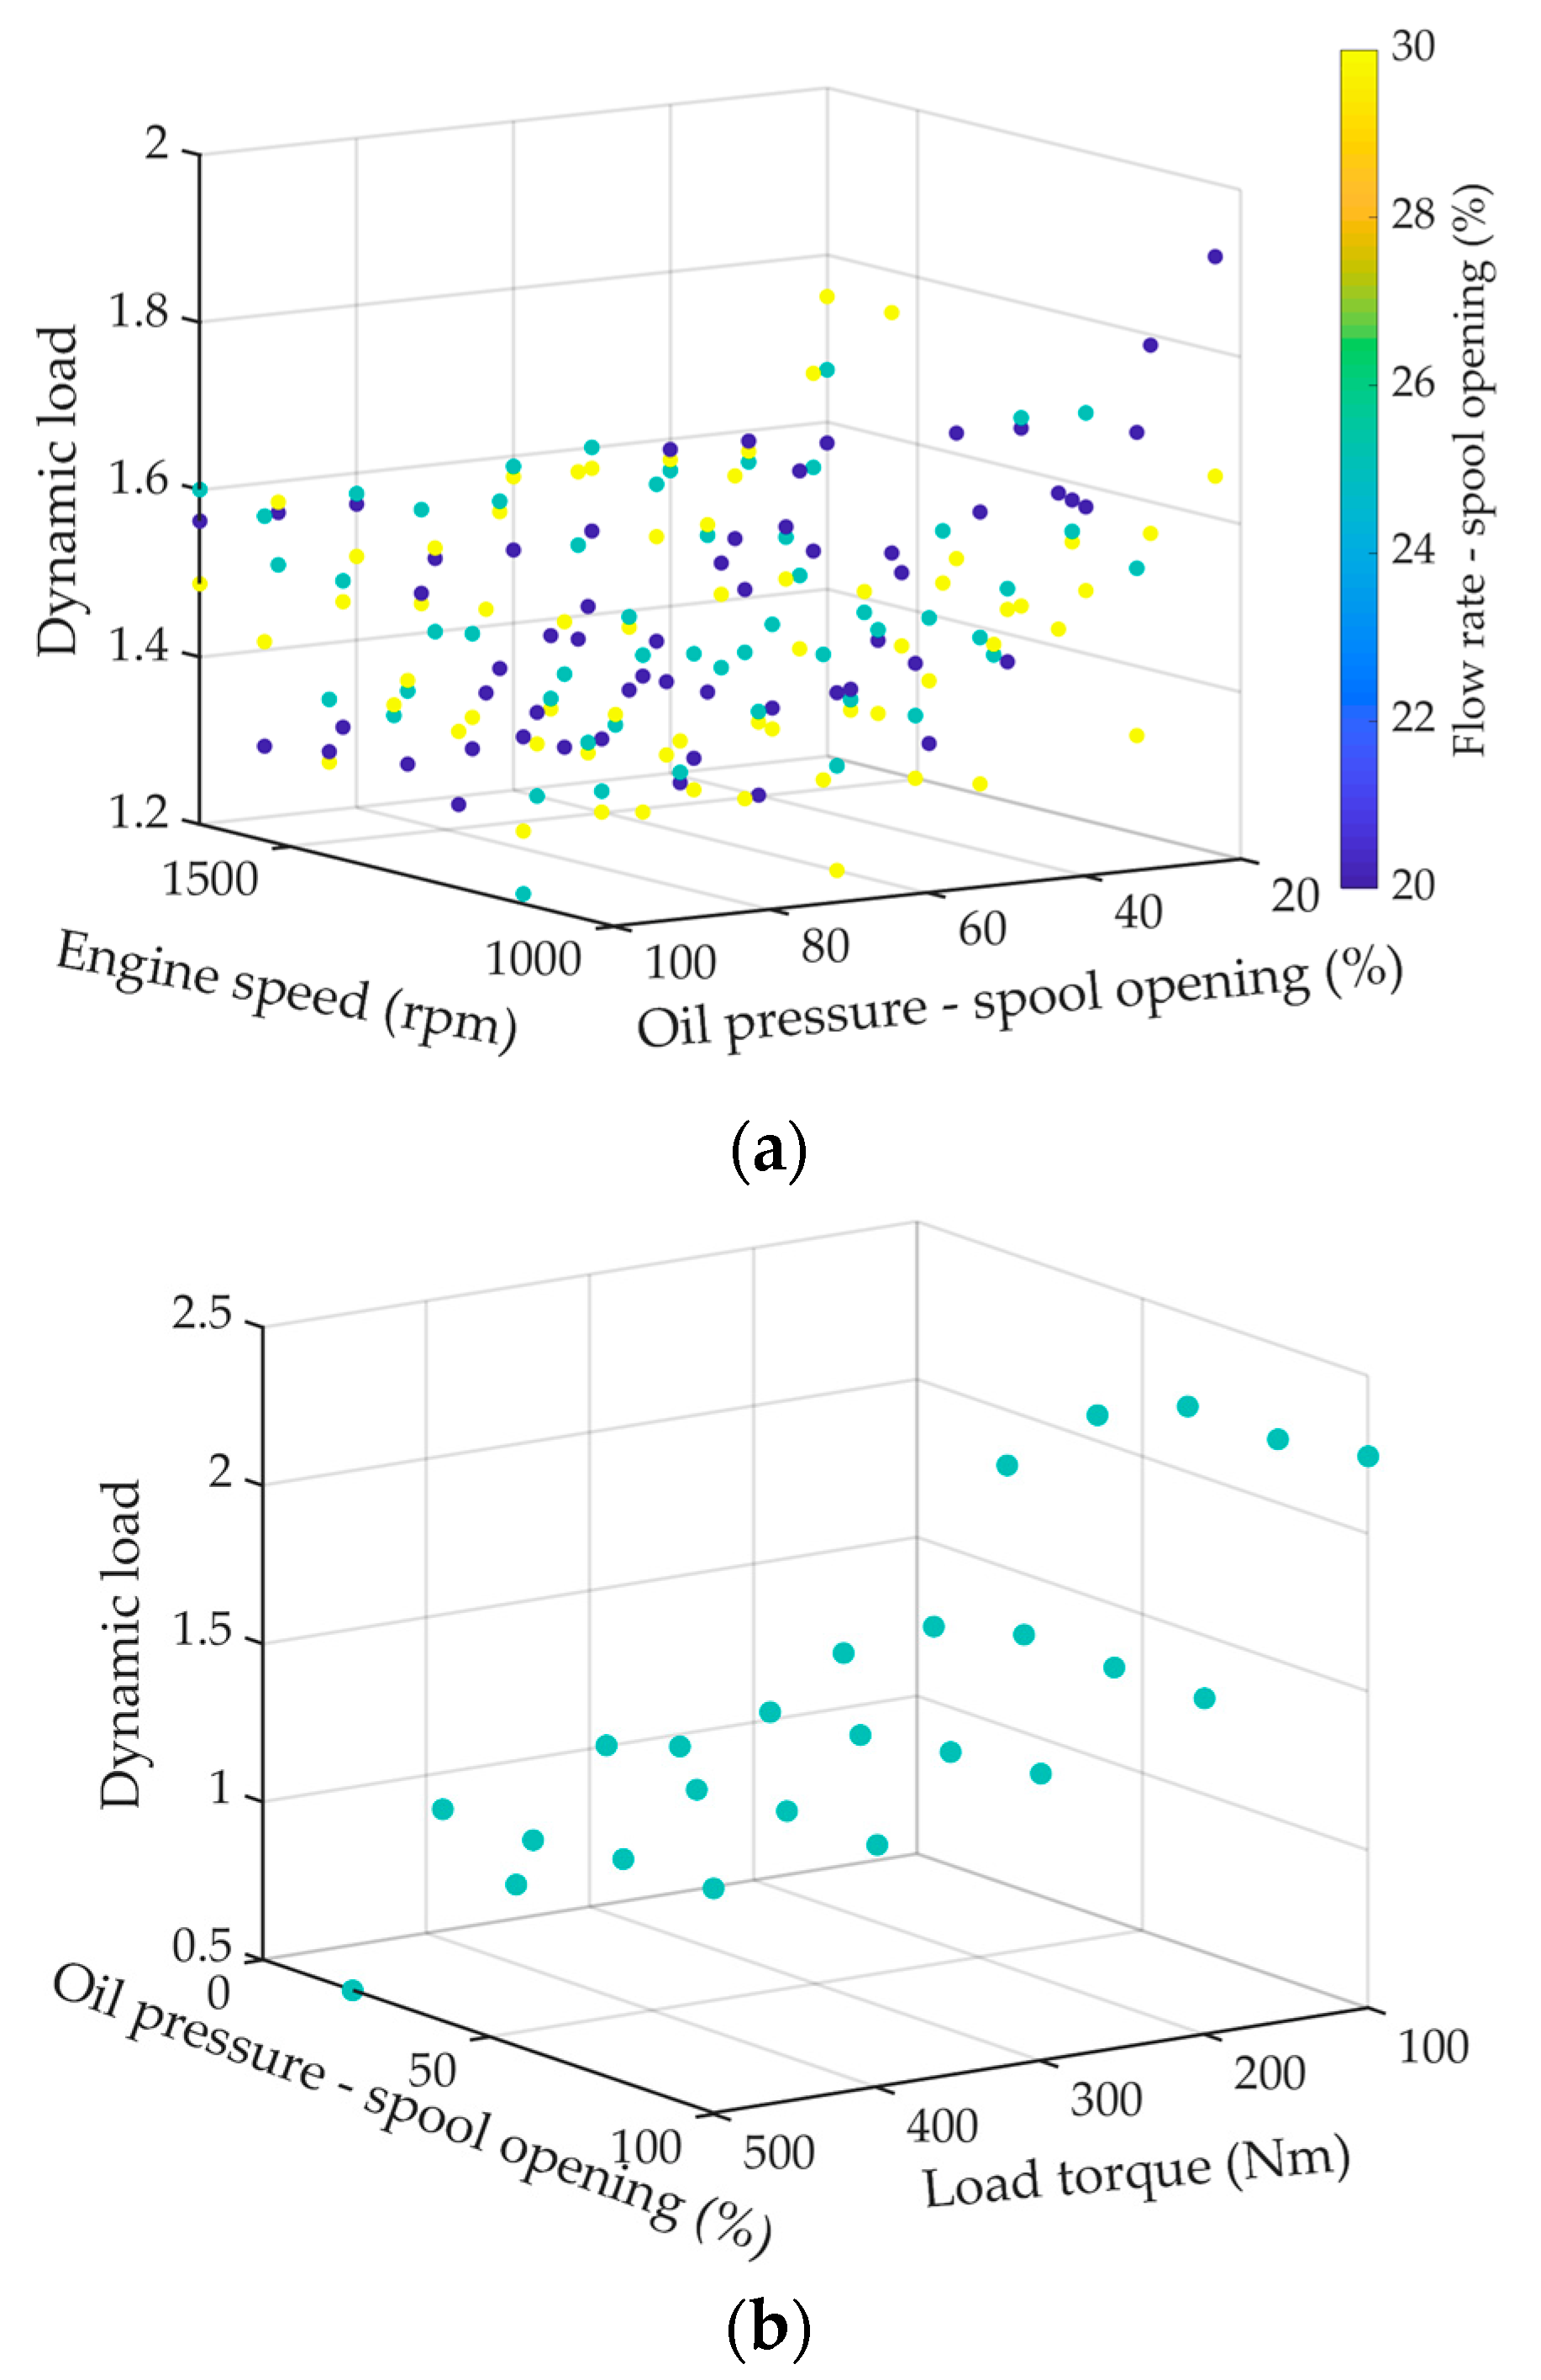
2.3. Dynamic Load Characteristics Test and Data Acquisition

According to PLS analysis of reference data (Section 3.1), this paper conducts experimental design based on load, which is the most significant factor affecting the dynamic load characteristics. Two types of experiments are conducted in this paper.
Test 1: Full factor tests of dynamic load characteristics are conducted with oil pressure (opening of valve core is 20, 30, 40, …, 100%, a total of 9 levels), rotational speed (engine working speed is 1040, 1140, 1240, …, 1640 rpm, a total of 7 levels) and flow rate (opening of valve core is 50%, 75% and 100%, a total of 3 levels) as independent variables under the same load (the load is 50 Nm to study the dynamic load characteristics). There are 189 trials in total.
Test 2: Two factors that have significant influence on dynamic load are selected in the test (results of PLS analysis are shown in Section 3.1 and Section 3.2). The load (output load of the clutch is 100, 200, 300, 400, 500 Nm, a total of 5 levels) and oil pressure (opening of valve core is 20, 40, 60, 80, 100%, a total of 5 levels) are taken as independent variables for the full factor test of dynamic load characteristics. There are 25 trials in total.
The level number and value of each influencing factor in Test 1 and Test 2 (full factor tests) are shown in Table 1.
This research uses PLS to analyze Test 1 and Test 2, and a comprehensive comparison with the reference is made to obtain the general characteristics of the main factors affecting the dynamic load characteristics.
The formula of dynamic load is as follows [17,18,19,20,21,22,23]:
k = T max T
where k is dynamic load of agricultural mechanical transmission system, dimensionless; T max is the instantaneous maximum output load of wet clutch, Nm; and T is the steady output load of wet clutch, Nm.
The results of the test data acquisition are shown in Figure 2.

2.4. Establish and Compare Multiple Dynamic Load Characteristic Models Based on I-SA

According to PLS analysis of reference data (Section 3.1), this paper conducts experimental design based on load, which is the most significant factor affecting the dynamic.
To further determine the universal prediction model of dynamic load characteristics, this paper studies and compares the prediction precision of the following three models. Additionally, the models are established according to the analysis results of influencing factors based on PLS (Section 3.1 and Section 3.2).
Model 1: Power function model consisting of significant factors oil pressure and load:
k = a 0 + a 1 P a 2 + a 3 T h a 4
Model 2: Polynomial regression model consisting of significant factors oil pressure and load:
k = a 0 + a 1 P + a 2 T h + a 3 P 2 + a 4 P T h + a 5 T h 2
Model 3: Power curve model consisting of the most significant single factor oil pressure or load:
k = a 0 + a 1 V a 2
where a 0 ~ a 5 are the coefficients for each component; P is physical quantity characterizing the properties of oil pressure, this paper uses the opening of valve core in modeling, %; T h is the output load of wet clutch, Nm; and V is the most significant factor for a single test, oil pressure or load.
Due to the nonlinear characteristics of the three models, this paper studies the I-SA for parameter identification to improve the precision of the models. The I-SA used in this paper refers to the algorithm flow that has been proposed and verified in previous studies [29,30]. This paper uses the coefficient of determination R2 as the objective function, and the average absolute percentage error (MAPE) as the evaluation index of model accuracy.
The flow chart of establishing a dynamic load characteristics prediction model based on ‘PLS analysis-Improved SA—Comparison of various models-Actual test data’ is shown in Figure 3.

2.5. The Establishment Method of Tractor Dynamic Load MAP under Three Working Conditions

The prediction model established in this paper is used to analyze the variation law of dynamic load characteristics of a transmission system during dynamic transformation, when the tractor is working. Taking some tractors as examples (the vehicle parameters are shown in Table 2), the dynamic load MAP of the tractor transmission system under normal driving, transportation and ploughing conditions is obtained.
When the tractor is on the normal road with constant speed, the clutch output power only needs to overcome the basic driving resistance. The load calculation formula is as follows:
T h 1 = ( m 1 g f + C D A u a 2 21.15 ) / ( i g r d )
When the tractor is in the transportation condition, the clutch output power needs to overcome the basic driving resistance and the additional resistance caused by the mass of trailer. The load calculation formula is as follows:
T h 2 = ( ( m 1 + m 2 ) g f + C D A u a 2 21.15 ) / ( i g r d )
When the tractor is in the ploughing condition, the clutch output power needs to overcome the basic driving resistance and ploughing resistance. The load calculation formula is as follows:
T h 3 = ( m 1 g f + C D A u a 2 21.15 + K n 1 b H ) / ( i g r d )
where T h 1 , T h 2 and T h 3 is the clutch output load under normal road driving, transportation and ploughing conditions, respectively; Nm; m 2 is the mass of the trailer carried by an electric tractor, kg; m 1 is the mass of the whole tractor, kg; f is coefficient of rolling resistance; g is the acceleration of gravity; C D is the coefficient of air resistance; A is the frontal area, m2; i g is the transmission ratio of tractor; r d is the radius of driving wheel, m; K is the soil specific resistance; b is the width of a single plough; n 1 is the amount of plough shares; and H is the depth of tillage.

3. Results and Discussion

3.1. Data Analysis of References Based on PLS

The results of PLS analysis of the research data in reference [19,21,22] are shown in Figure 4.
According to Figure 4, oil pressure and load have significant effects on the dynamic load of agricultural machinery transmission systems. The influence of load is the most significant, and it is inversely correlated with dynamic load. Oil pressure is positively correlated with dynamic load. The analysis results based on PLS are consistent with those in reference [12,13,14]. The range of influence degree of load is about −0.7492~−0.8381, and the range of influence degree of oil pressure is about 0.2030~0.4304.

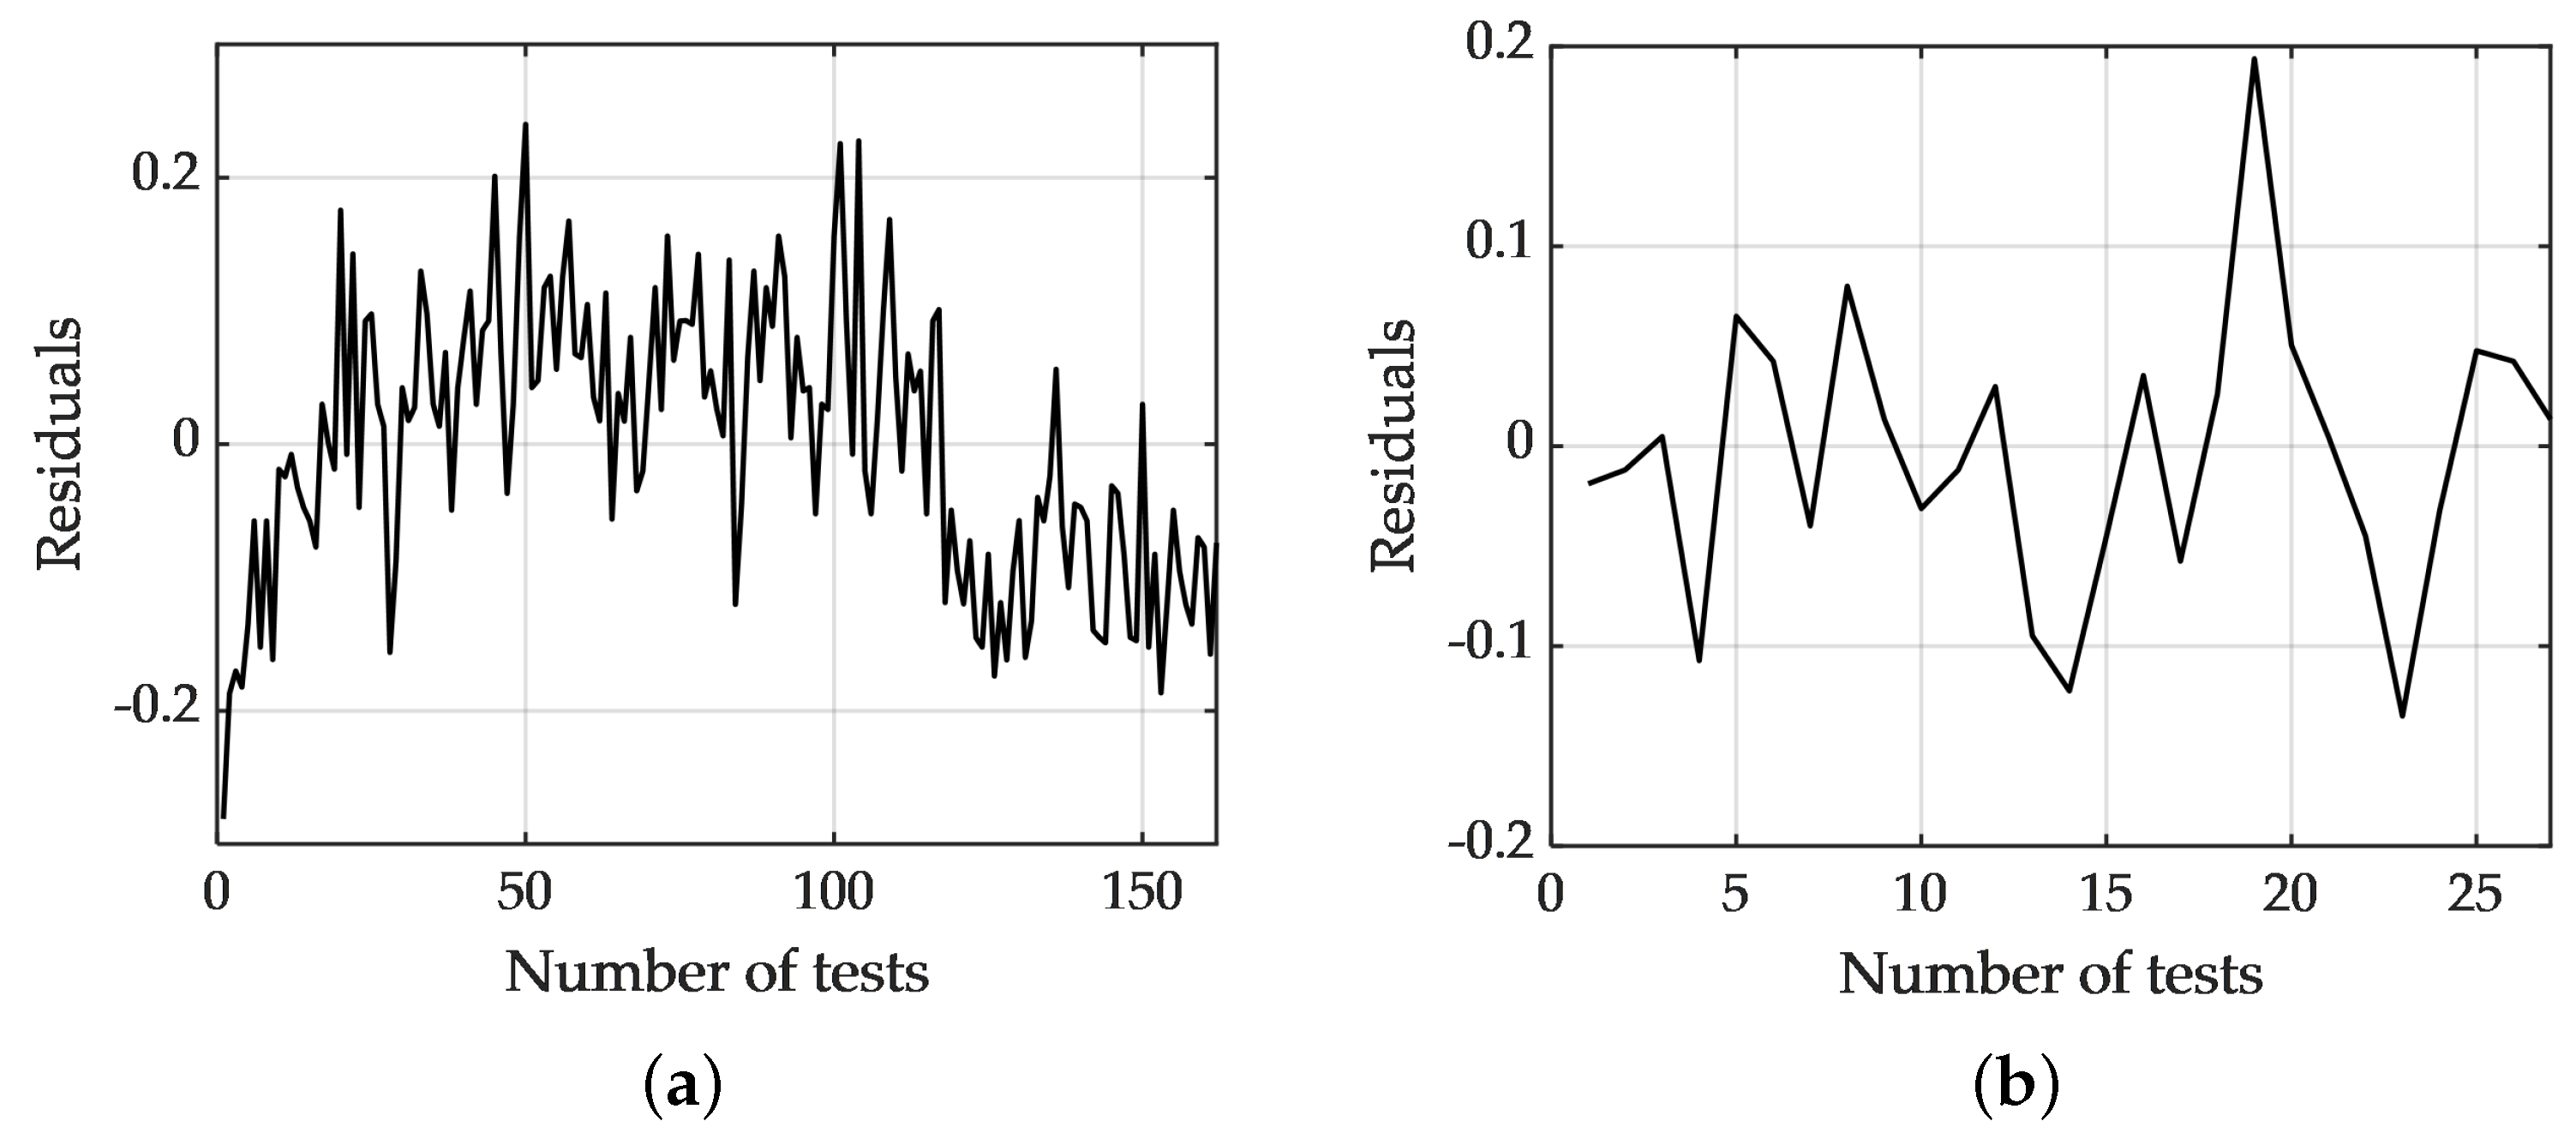
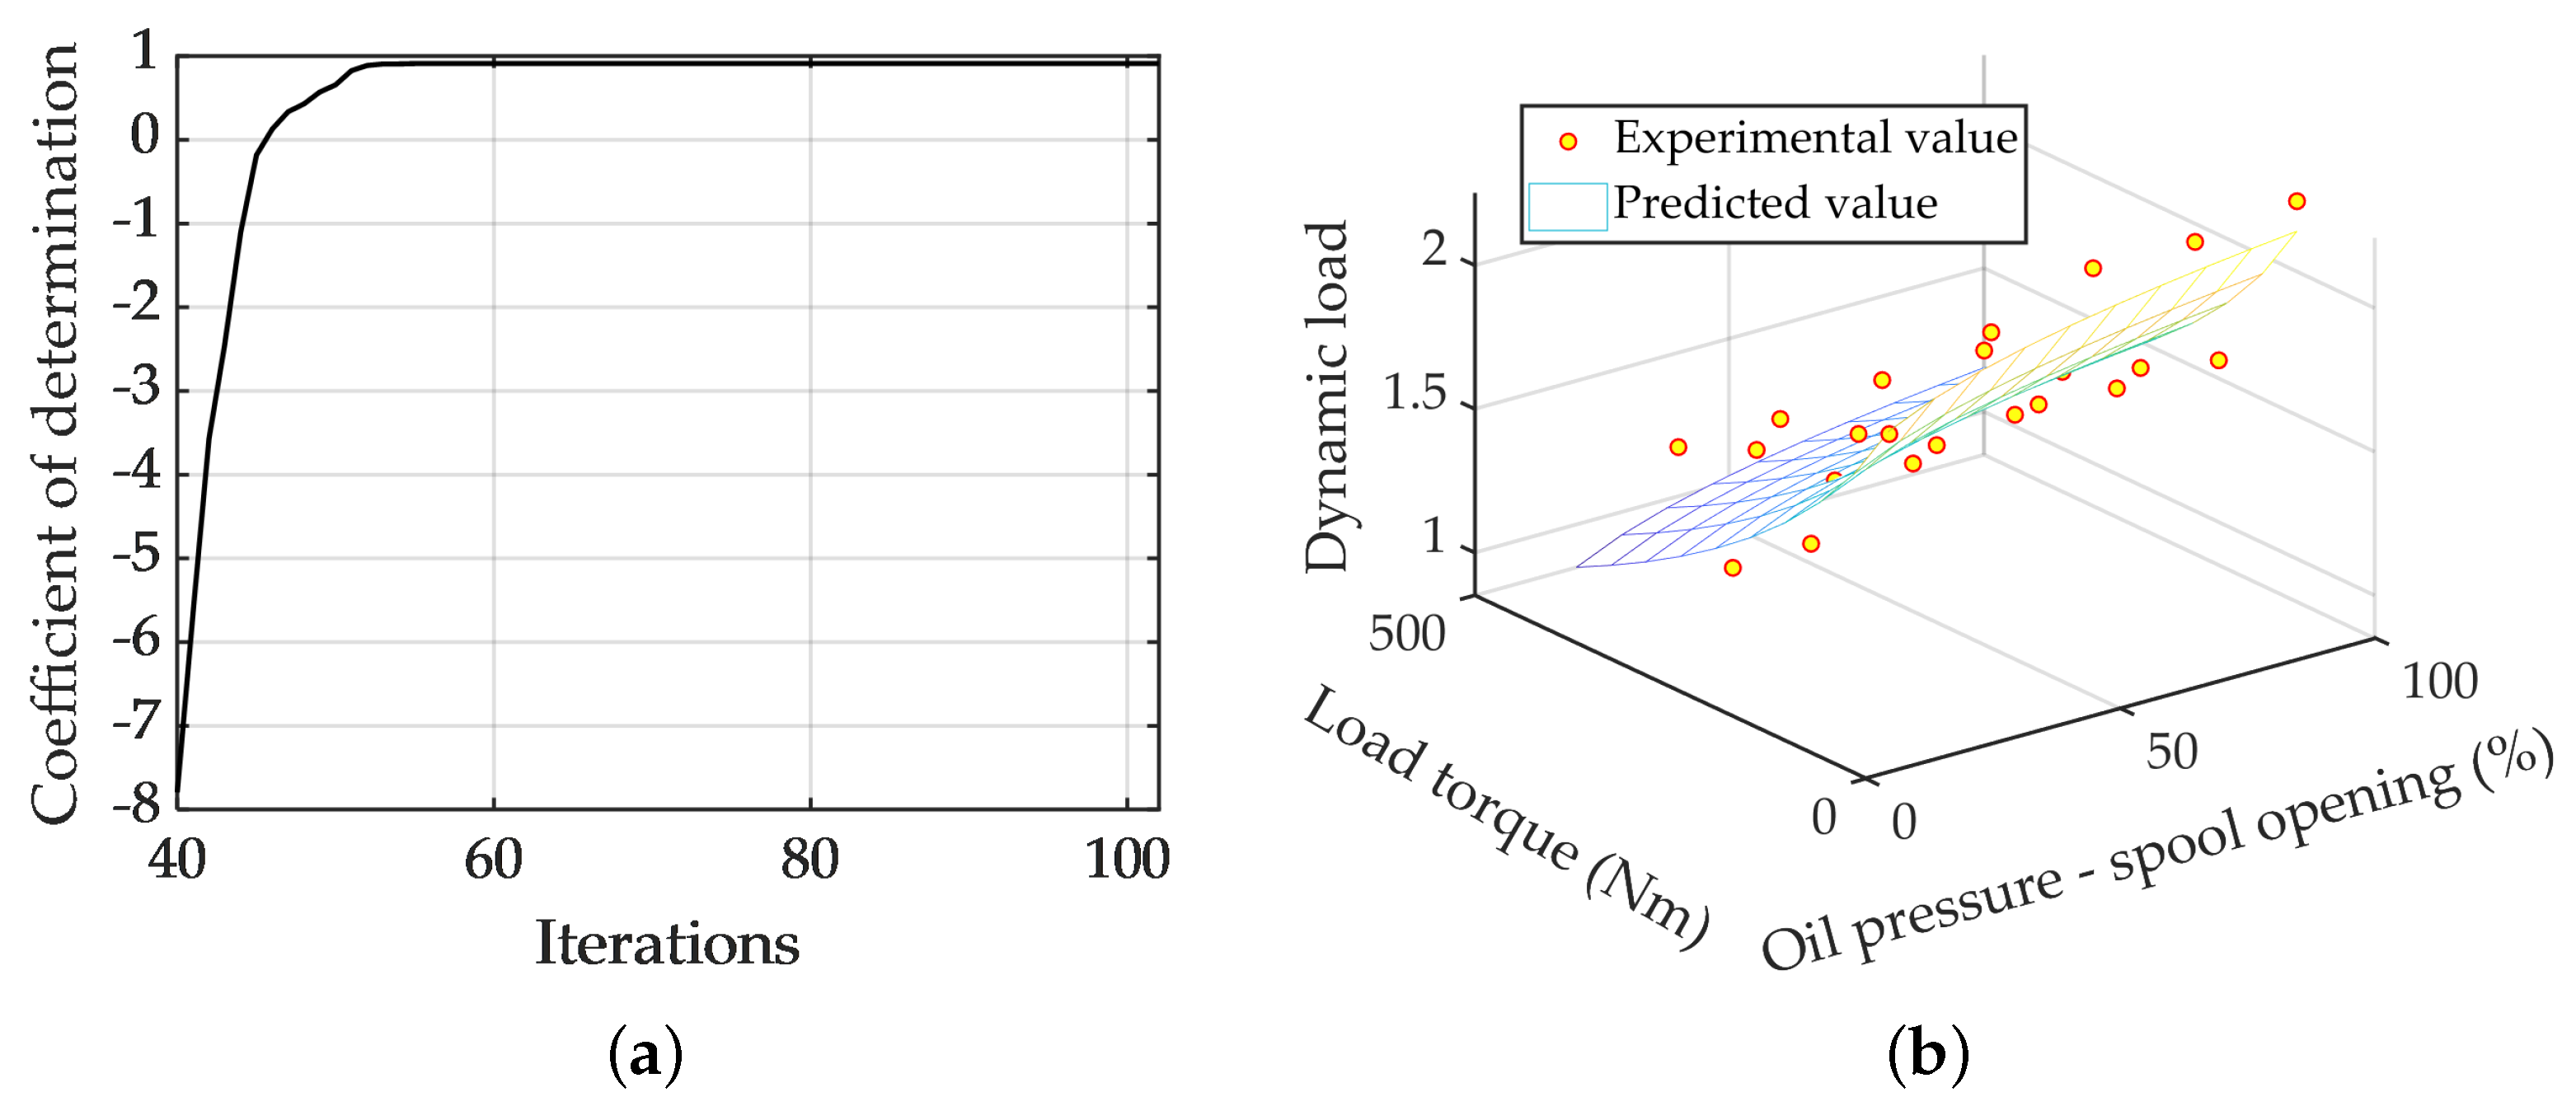
3.2. Establishment and Analysis of Dynamic Load Model under Low Load

PLS is used to analyze 189 sets of test data under low load (50 Nm), and the influence degrees of oil pressure, engine rotational speed and flow rate are −0.4760, 0.2305 and −0.0808, respectively. Therefore, it is further shown that the oil pressure has the most significant influence on the dynamic load characteristics under the same load condition. Moreover, the correlation between oil pressure and dynamic load is inversely correlated under low load. It is different from the correlation under medium and high load (the correlation under medium and high loads is shown in Section 3.1 and Section 3.2).
Select the test data of 1340 r/min (a total of 27 groups) for test validation. The remaining 162 sets of data for learning and training. The results of parameter identification using I-SA are shown in Figure 5 (the comparison results between average test values and the predicted values of dynamic load at the same oil pressure level). The prediction model of dynamic load (power curve) is shown as below:
k = 1.388 + 16.460 P 1.407
The coefficient of determination R2 between the model and 162 sets of training data is 0.9672.
The MAPE between the predicted value of the dynamic load model and 162 sets of training data is 5.8318 %, the residuals are shown in Figure 6a; The MAPE between the predicted value of the dynamic load model and 27 sets of test validation data is 3.5249%, the residuals are shown in Figure 6b.

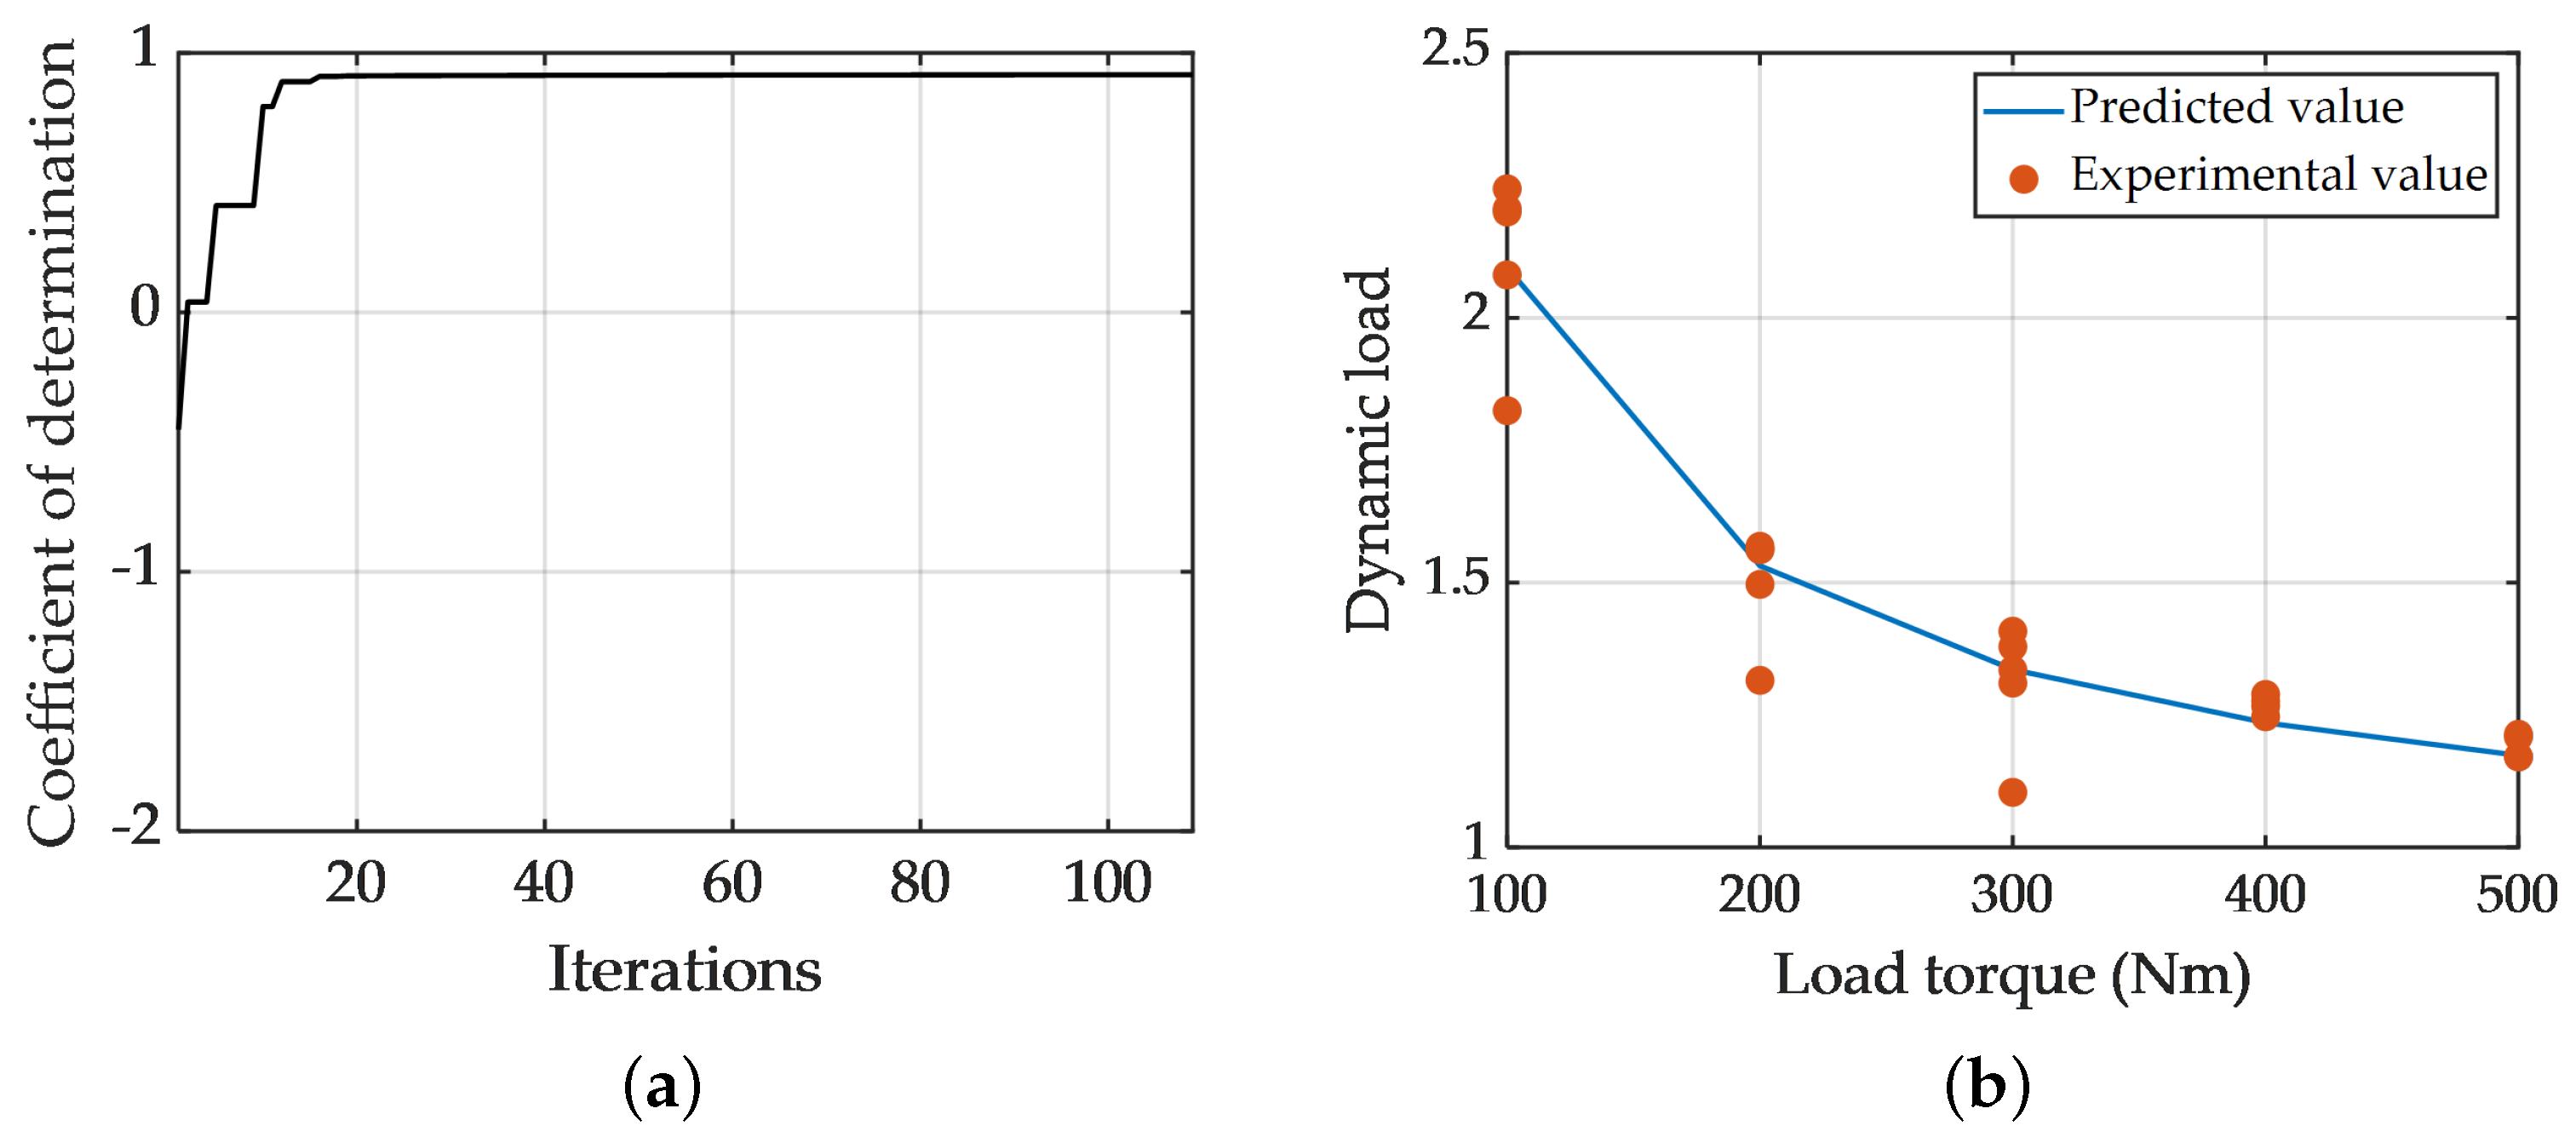
3.3. Establishment and Analysis of Dynamic Load Model under Medium and High Load

In order to further study and confirm the influence degree of two significant influencing factors (load torque and oil pressure) on dynamic load characteristics and establish the dynamic load characteristics model of transmission system under medium and high load, this paper uses PLS to analyze 25 sets of full factor test data under medium and high load (100~500 Nm), and the influence degree of load torque and oil pressure are −0.8788 and 0.2456, respectively. Therefore, it is further confirmed that the load has the most significant influence on the dynamic load characteristics.
Combined with the analysis of reference data in Section 3.1 (the load torque used in existing studies is greater than 100 Nm), there is a positive correlation between oil pressure and dynamic load characteristics under medium and high load. The influence degree of load torque (−0.8788) and oil pressure (0.2456) are basically consistent with the variation range obtained in Section 3.1.
The parameter identification results of the three models using I-SA are shown in Figure 7, Figure 8 and Figure 9 and Table 3.
According to Figure 7, Figure 8 and Figure 9 and Table 3, the three models identified by I-SA have high precision, and the coincidence degree with the bench test data is high. Because Model 3 has only three parameters, the convergence rate of parameter identification is faster. The iterative times required for the convergence of the three models are about 53, 50 and 19, respectively. In addition, the lesser parameters also indicates that Model 3 has low dependence on the amount of data for modeling.
Model 3 also shows that as a single influencing factor, the change of load itself can better explain and characterize the variation law of dynamic load characteristics in the power transmission system.

3.4. Acquisition and Analysis of Dynamic Load Characteristics MAP of Tractor under Three Working Conditions

The dynamic load characteristics MAP of the tractor power transmission system under normal road driving, transportation and ploughing conditions are shown in Figure 10. The opening of valve core 20~100% is corresponding to oil pressure 0.5~5 Mpa.
According to Figure 10, the maximum dynamic load of tractor under normal road driving, transportation and ploughing conditions are 1.78, 2.24 and 2.24, respectively. As the tractor is in normal road driving condition, the dynamic load is small when the speed and oil pressure is low while the speed is medium or high and oil pressure is high. The variation range of dynamic load is 1.58~1.78, the variation amplitude is 12.66% and the variation is relatively small. As the tractor is in transportation condition, the dynamic load is relatively large when the mass of tailer is in the range of 600~1800 kg. The variation range of dynamic load is 1.47~2.24, the variation amplitude is 52.71% and the variation is relatively large. As the tractor is in ploughing condition, the dynamic load is relatively large when the variation range of ploughing resistance is 200~1600 N (the tractor used in the study has a large dynamic load under the condition of medium and low tillage resistance). The variation range of dynamic load is 1.01~2.24, the variation amplitude is 121.78% and the range of variation is wide. The overall dynamic load characteristics under low oil pressure are obviously better.

4. Conclusions

Load has the most significant impact on the dynamic load characteristics of a wet clutch. The impact of oil pressure is only second to the load, and the relationship between oil pressure and dynamic load is affected by the change of load. The relationship between oil pressure and dynamic load under low load is inversely correlated, and the relationship between oil pressure and dynamic load under medium and high load is positively correlated. The impact of other factors can be ignored.
Three prediction models based on I-SA algorithm proposed in this paper have high accuracy. Among them, Model 2 has the highest prediction accuracy and considers the influence of oil pressure and load. Model 3 has the least parameters (three parameters model) and only considers the influence of load. Therefore, Model 3 has low dependence on the number of samples.
In the conceptual design stage, the dynamic load characteristics modeling method proposed in this paper can be used to evaluate the dynamic load characteristics of agricultural machinery such as tractors under different operating conditions directly. Additionally, the method has low dependence on the number of influencing factors when estimating dynamic load. (At least the load is known, at most the load and oil pressure are known).

Author Contributions

Methodology, Z.C.; software, Z.C.; validation, Z.C.; investigation, Z.C.; resources, Z.L.; writing—original draft preparation, Z.C.; writing—review and editing, Z.C. and Z.L.; supervision, Z.L.; and project administration, Z.L. All authors have read and agreed to the published version of the manuscript.

Funding

This research was funded by the National Natural Science Foundation of China (grant number: 52105063), National Key Research and Development Plan (2016YFD0701103) and the Metasequoia teacher research start-up fund of Nanjing Forestry University (163106061).

Institutional Review Board Statement

Not applicable.

Informed Consent Statement

Not applicable.

Data Availability Statement

The data presented in this study are available on demand from the corresponding author at ([email protected]).

Acknowledgments

The authors thank the National Natural Science Foundation of China (grant number: 52105063), the National Key Research and Development Plan (2016YFD0701103) and the Metasequoia teacher research start-up fund of Nanjing Forestry University (163106061) for funding. We also thank the anonymous reviewers for providing critical comments and suggestions that improved the manuscript.

Conflicts of Interest

The authors declare no conflict of interest.

References

  1. Cheng, Z.; Lu, Z.; Qian, J. A new non-geometric transmission parameter optimization design method for HMCVT based on improved GA and maximum transmission efficiency. Comput. Electron. Agric. 2019, 167, 105034. [Google Scholar] [CrossRef]
  2. Wang, J.Y.; Xia, C.G.; Fan, X.; Cai, J.Y. Research on transmission characteristics of hydromechanical continuously variable transmission of tractor. Math. Probl. Eng. 2020, 2020, 6978329. [Google Scholar] [CrossRef]
  3. Jenane, C.; Bashford, L.L. Tractive performance of a mechanical front-wheel assist tractor as related to forward speeds. J. Agric. Eng. Res. 2000, 77, 221–226. [Google Scholar] [CrossRef]
  4. Lu, L.Q.; Zhou, Y.Q.; Li, H.; Wang, Y.; Yin, Y.F.; Zhao, J. Electro-hydraulic shift quality of power shift transmission of heavy duty tractor. Trans. Chin. Soc. Agric. Mach. 2020, 51, 550–556, 602. [Google Scholar]
  5. Xi, Z.Q.; Zhou, Z.L.; Zhang, M.Z.; Cao, Q.M. Shift characteristics and control strategy of powershift transmission on tractor. Trans. Chin. Soc. Agric. Mach. 2016, 47, 350–357. [Google Scholar]
  6. Wan, L.R.; Dai, H.Z.; Zeng, Q.L.; Sun, Z.Y.; Tian, M.Q. Characteristic analysis and co-validation of hydro-mechanical continuously variable transmission based on the wheel loader. Appl. Sci. 2020, 10, 5900. [Google Scholar] [CrossRef]
  7. Zhu, Z.; Gao, X.; Cao, L.L.; Cai, Y.M.; Pan, D.Y. Research on the shift strategy of HMCVT based on the physical parameters and shift time. Appl. Math. Model. 2016, 40, 6889–6907. [Google Scholar] [CrossRef]
  8. Li, T.H.; Xie, B.; Li, Z.; Li, J.K. Design and optimization of a dual-input coupling powertrain system: A case study for electric tractors. Appl. Sci. 2020, 10, 1608. [Google Scholar] [CrossRef] [Green Version]
  9. Chen, Y.N.; Xie, B.; Du, Y.F.; Mao, E.R. Powertrain parameter matching and optimal design of dual-motor driven electric tractor. Int. J. Agric. Biol. Eng. 2019, 12, 33–41. [Google Scholar] [CrossRef] [Green Version]
  10. Chen, Y.; Qian, Y.; Lu, Z.; Zhou, S.; Xiao, M.; Bartos, P.; Xiong, Y.; Jin, G.; Zhang, W. Dynamic characteristic analysis and clutch engagement test of HMCVT in the high-power tractor. Complexity 2021, 2021, 8891127. [Google Scholar] [CrossRef]
  11. Han, H.W.; Han, J.S.; Chung, W.J.; Kim, J.T.; Park, Y.J. Prediction of synchronization time for tractor power-shift transmission using multi-body dynamic simulation. Trans. ASABE 2021, 64, 1483–1498. [Google Scholar] [CrossRef]
  12. Raikwar, S.; Tewari, V.K.; Mukhopadhyay, S.; Verma, C.R.B.; Rao, M.S. Simulation of components of a power shuttle transmission system for an agricultural tractor. Comput. Electron. Agric. 2015, 114, 114–124. [Google Scholar] [CrossRef]
  13. Li, B.G.; Sun, D.Y.; Hu, M.H.; Liu, J.L. Automatic starting control of tractor with a novel power-shift transmission. Mech. Mach. Theory 2019, 131, 75–91. [Google Scholar] [CrossRef]
  14. Tan, L.D.; Zong, X.J.; Chang, Z.Y.; Wang, Y.B.; Chen, D.H. Design and test of biomimetic wear resistant for wet clutch friction plate for heavy tractor. Trans. Chin. Soc. Agric. Eng. 2018, 34, 54–59. [Google Scholar]
  15. Song, Y.; Liu, F.P.; Wang, G.M.; Han, M.M.; Huang, D.M.; Song, G.M. Design of hydraulic test bench for big-power wet clutch shifting tractor. J. Chin. Agric. Mech. 2019, 40, 78–84. [Google Scholar]
  16. Qian, Y.; Cheng, Z.; Lu, Z.X. Bench testing and modeling analysis of optimum shifting point of HMCVT. Complexity 2021, 2021, 6629561. [Google Scholar] [CrossRef]
  17. Lu, K.; Lu, Z.X.; Cheng, Z.; Zheng, S.Q. Study on influence rules of clutch parameters on HMCVT shift performance. Mech. Sci. Technol. Aerosp. Eng. 2019, 38, 1695–1701. [Google Scholar]
  18. Wang, G.M.; Zhang, X.H.; Zhu, S.H.; Zhang, H.J.; Tai, J.J.; Nguyen, V. Shift performance of tractor hydraulic power-split continuously variable transmission. Trans. Chin. Soc. Agric. Mach. 2015, 46, 7–15. [Google Scholar]
  19. Qian, Y.; Cheng, Z.; Lu, Z.X. Study on stepwise regression optimization of shift quality of heavy-duty tractor HMCVT based on five factors. J. Nanjing Agric. Univ. 2020, 43, 564–573. [Google Scholar]
  20. Xu, L.Y.; Liu, H.L.; Zhou, Z.L.; Wang, X.B. Evaluation indexes of shifting quality for dual clutch transmission for tractor. Trans. Chin. Soc. Agric. Eng. 2015, 31, 48–53. [Google Scholar]
  21. Ni, X.D.; Zhu, S.H.; Zhang, H.J.; Chang, Y.L.; Ouyang, D.Y.; Wang, G.M. Experiment of shift quality factors for hydro-mechanical CVT. Trans. Chin. Soc. Agric. Mach. 2013, 44, 29–34. [Google Scholar]
  22. Wang, G.M. Study on Characteristics, Control and Fault Diagnosis of Tractor Hydro-Mechanical CVT; Nanjing Agricultural University: Nanjing, China, 2014. [Google Scholar]
  23. Wang, G.M.; Zhu, S.H.; Shi, L.X.; Tao, H.L.; Nguyen, V. Experimental optimization on shift control of hydraulic mechanical continuously variable transmission for tractor. Trans. Chin. Soc. Agric. Eng. 2013, 29, 51–59. [Google Scholar]
  24. Yu, L.; Ma, B.; Chen, M.; Xue, J.Q.; Zhao, P.Y. Variation mechanism of the friction torque in a Cu-based wet clutch affected by operating parameters. Tribol. Int. 2020, 147, 106169. [Google Scholar] [CrossRef]
  25. Park, J.; Choi, S.; Oh, J.; Eo, J. Adaptive torque tracking control during slip engagement of a dry clutch in vehicle powertrain. Mech. Mach. Theory 2019, 134, 249–266. [Google Scholar] [CrossRef]
  26. Xia, L. Analysis of partial least squares modeling and multi-collinearity ability. Agro Food Ind. Hi-Tech 2017, 28, 885–889. [Google Scholar]
  27. Xu, Q.S.; Liang, Y.Z.; Shen, H.L. Generalized PLS regression. J. Chemom. 2001, 15, 135–148. [Google Scholar] [CrossRef]
  28. Cheng, Z.; Lu, Z.X. Research on load disturbance based variable speed PID control and a novel denoising method based effect evaluation of HST for agricultural machinery. Agriculture 2021, 11, 960. [Google Scholar] [CrossRef]
  29. Cheng, Z.; Lu, Z.X. Research on the PID control of the ESP system of tractor based on improved AFSA and improved SA. Comput. Electron. Agric. 2018, 148, 142–147. [Google Scholar] [CrossRef]
  30. Cheng, Z.; Lu, Z.X.; Dai, F. Research on HMCVT efficiency model based on the improved SA algorithm. Math. Probl. Eng. 2019, 2019, 2856908. [Google Scholar] [CrossRef]
Figure 1. Test bench for measuring dynamic load characteristics of tractors. Note: ① Engine (DEUTZ TCD2013L062V); ② variable transmission system with wet clutch; ③ speed torque sensor of ZJ-5000A model; ④ auxiliary gearbox; ⑤ electrical eddy current dynamometer of DW250 model; ⑥ hydraulic system (realizing lubrication, cooling and other functions). (a) The picture of test site. (b) Schematic diagram.
Agriculture 12 00161 g001
Figure 2. Actual test data of dynamic load of agricultural machinery system. (a) Data of Test 1. (b) Data of Test 2.
Agriculture 12 00161 g002
Figure 3. Technical route of establishing dynamic load characteristic prediction model.
Agriculture 12 00161 g003
Figure 4. PLS analysis results of research data in reference [19,21,22].
Agriculture 12 00161 g004
Figure 5. Comparison between average test values and predicted values of dynamic load at the same oil pressure.
Agriculture 12 00161 g005
Figure 6. Estimation residuals of dynamic load models under low load; (a) 162 sets of learning and training data; (b) 27 sets of test validation data.
Agriculture 12 00161 g006
Figure 7. Parameter identification results of Model 1. (a) Iterative evolution curve. (b) Comparison of predicted and experimental values.
Agriculture 12 00161 g007
Figure 8. Parameter identification results of Model 2. (a) Iterative evolution curve. (b) Comparison of predicted and experimental values.
Agriculture 12 00161 g008
Figure 9. Parameter identification results of Model 3. (a) Iterative evolution curve. (b) Comparison of predicted and experimental values.
Agriculture 12 00161 g009
Figure 10. Dynamic load characteristics MAP of tractor under different working conditions. (a) Normal road driving conditions. (b) Transportation conditions. (c) Plough conditions.
Agriculture 12 00161 g010
Table 1. The level number and value of each influencing factor in full factor tests.
FactorsOil Pressure
(Opening of Valve Core/%)
Rotational Speed of Engine
(rpm)
Flow Rate
(Opening of Valve Core/%)
Load
(Nm)
Test 19 levels (20–100%)7 levels (1040–1640 rpm)3 levels (50–100%)-
Test 25 levels (20–100%)--5 levels (100–500 Nm)
Table 2. Parameters of tractors studied in this paper.
Mass of the Whole Vehicle/kgRadius of Driving Wheel/mCoefficient of Air ResistanceFrontal Area/m2Maximum Trailer Mass/kgCoefficient of Rolling ResistanceSpeed Ratio of Variable Speed SystemSoil Specific Resistance/kPaWidth of a Single Plough/cm
16350.640.93.13530000.0595025
Table 3. Comparison of parameter identification results of three models based on I-SA.
Modela0a1a2a3a4a5R2MAPE (%)
1−1.3681.4190.0000132−0.01950.00144-0.91226.2806
22.2990.00809−0.00655−0.0000231−0.000008920.000008270.95454.1938
30.90684.497−0.926---0.91644.5929
Publisher’s Note: MDPI stays neutral with regard to jurisdictional claims in published maps and institutional affiliations.

