Article

Organic Manure Increases Carbon Sequestration Far beyond the “4 per 1000 Initiative” Goal on a Sandy Soil in the Thyrow Long-Term Field Experiment DIV.2

1
Albrecht Daniel Thaer-Institute of Agricultural and Horticultural Sciences, Faculty of Life Sciences, Berlin Humboldt University, Invalidenstraße 42, 10115 Berlin, Germany
2
Lehr-und Forschungsstation Pflanzenbauwissenschaften, Faculty of Life Sciences, Berlin Humboldt University, Thyrower Dorfstraße 9, 14959 Thyrow, Germany
*
Author to whom correspondence should be addressed.
Agriculture 2022, 12(2), 170; https://doi.org/10.3390/agriculture12020170
Submission received: 16 December 2021 / Revised: 7 January 2022 / Accepted: 20 January 2022 / Published: 25 January 2022
(This article belongs to the Special Issue Soil Carbon and Nitrogen in Agricultural Systems)

Abstract

:
Carbon sequestration has been proposed as a way to mitigate the impact of CO2 on the climate. At the COP21, the ‘4 per 1000 Soils for Food Security and Climate’ initiative was launched with the goal to increase global soil organic carbon (SOC) stocks by 4‰ per year. The Thyrow long-term field experiment DIV.2 was chosen to determine the feasibility of this 4 per 1000 goal under the dry and sandy conditions in Eastern Germany. The effects of different fertilizing regimes on SOC contents and winter rye yields were investigated. Winter rye is a representative crop for the region and grown as a monoculture in the experiment. The 4 per 1000 goal was achieved in all treatments including the unfertilized control, although ploughing takes place and straw is removed every year. The highest carbon sequestration of up to 0.5 t ha−1 a−1 was provided by a combination of mineral and manure fertilization. In three out of four years, no yield difference was observed between mineral-only fertilization (120 kg ha−1 N) and a combination of mineral and organic N (97.4 kg ha−1 plant available N) fertilization. Yields increased over the years in the treatment with pure organic N and decreased in all other treatments.

1. Introduction

Soil organic carbon (SOC) content, as the measurable component of soil organic matter, is one of the most important indicators for the health, fertility and usability of a soil [1]. It both consists of and binds plant nutrients and is responsible for a large portion of the cation exchange capacity of soils [2,3]. It also functions as habitat for soil organisms and binds soil particles into stable aggregates, thus improving soil structure and water balance [4]. Its degradation is associated with increased risk for erosion and flooding, release of climate gases, disturbed nutrient cycles and an elevated risk for soil-borne plant pests [5,6]. Its preservation and propagation is one of the key factors in agricultural sustainability [7]. In recent years, carbon sequestration in agricultural soils has gained further importance due to its potential to mitigate climate change [8,9]. In 2015, the ‘4 per 1000 Soils for Food Security and Climate’ initiative was launched at the COP21. The intention of this initiative is to increase global soil organic matter stocks by 4‰ per year, and thus compensate for the anthropogenic greenhouse gas emissions. There are, however, doubts if this is feasible. Powlson, et al. [10] and Poulton, et al. [11] analyzed data from the long-term experiments in Rothamsted and came to the conclusion that the 4‰ annual rate of SOC increase is unachievable in most agricultural situations and cannot be regarded as a major contributor to climate change mitigation. Their main argument is that effective C sequestration requires uneconomical practices like stopping crop production completely or introducing rotations comprising 8 years of pasture followed by only 2 years of arable crops. Researchers from Austria concluded that the required amount of C sequestration can only be achieved by either applying amounts of compost that exceed all applicable regulations or by applying biochar in amounts that are uneconomical and technically hard to produce in the first place [12]. Riggers, et al. [13] used different SOC models and climate projections to project SOC stocks in German croplands and calculated that an SOC build up would require unrealistically high carbon inputs and drastic changes in agricultural management. They concluded that climate change-induced carbon losses can at best be balanced by improved carbon sequestration strategies. In other studies, however, an annual 4‰ increase of SOC contents appeared realistic with reasonable changes in cultivation (e.g., compost application in reasonable amounts, the adoption of cover crops or reduced tillage) [14,15].
So far, the existing data about the feasibility of the 4 per 1000 initiative is patchy and based on separate and small areas. More investigations in different global regions are necessary to close the gaps and develop adequate land use strategies for different regions and environmental conditions. The present study aims to deliver an additional piece of the puzzle by investigating if SOC contents can be increased by 4‰ per year under the conditions in Eastern Germany, which are characterized by comparatively low precipitation and sandy soils with low fertility.
Changes in SOC contents usually take a long time to manifest and to be detected with certainty among the seasonal fluctuation caused by weather, crop and management practices. Smith [16] calculated that even under the best sampling and laboratory conditions, SOC changes could be detected at the earliest after 6–10 years with a confidence of 90%. Before that, external and random effects could not be separated with certainty from treatment effects. Long-term experiments are needed to evaluate the potential of certain farming practices to increase SOC contents.
Because of this, one such long-term field experiment was chosen for the present study to investigate the influence of different fertilizing regimes, including treatments with and without organic fertilization, on SOC contents under a winter rye monoculture. Winter rye is one of the crops able to produce satisfactory yields with an economically reasonable input under the conditions of the region.
In theory, management practices that increase biomass production should lead to increased SOC storage because of the increase in carbon inputs [6,8]. This includes fertilization. Organic amendments such as straw, green or cattle manure are often used to balance carbon losses induced by cultivation [17]. However, it is still necessary to better understand how nutrient management strategies impact soil carbon stocks [18]. Especially, the role of nitrogen fertilizers in SOC variability is often debated. They are generally perceived to accumulate soil organic C by increasing the input of crop residues [19]. They are also known to promote the decomposition of crop residues and soil organic matter [20], especially of easily degradable carbon fractions [21].
The field trial consists of treatments with different mineral and/or organic fertilization including those with nitrogen amounts according to good management practice for the region and with nitrogen amounts below or above this. Harvest residues were removed, and the soil is ploughed every year. Three hypotheses were developed based on these initial conditions: (1) The fertilization regime will strongly influence the soil organic carbon stocks in the soil, with manure application producing significantly higher SOC contents than mineral fertilization. (2) Reaching the 4 per 1000 goal will be difficult under the given circumstances in the experiment, which include straw removal and ploughing, but lack further carbon-producing factors like cover crops or diversification of crop species. (3) If at all, the 4‰ per year threshold will only be reached by manure application, while mineral fertilization might even decrease carbon stocks due to accelerated microbial turnover.

2. Materials and Methods

2.1. Field Experiment

The investigations were carried out within the long-term field trial “Static Nutrient Deficiency Experiment” (“Static Nutrient Deficiency Experiment = Statischer Nährstoffmangelversuch”) DIV.2 at the agricultural research station of the Berlin Humboldt University. The station is located in Thyrow, 30 km southwest of Berlin, Germany, and is representative for the dry-warm climate conditions and diluvial soils of the East German lowlands. The dominant soil type at the site is a pallid brown earth of sand over deep loam with low humus contents and a usable field capacity in the effective root zone (60–80 cm depth) between 60 and 150 mm. The mean temperature at the site is 9.2 °C with yearly rainfall of 509.8 mm (average of the period 1981–2020). Further soil and climate parameters are given in Table 1 and Figure 1.
The field trial was first established in 1937 as a nutrient-deficiency experiment. It consists of a block design with different fertilizing treatments in four replications. Treatments are randomized within each complete block. The plots’ size is 7.2 × 10 m, from which a core of 4 × 5 m is harvested. In total, there are 8 treatments (=32 plots), from which 5 treatments were chosen for the present investigation (Table 2) based on their relevance for the topic. The general idea of the field trial as established in 1937 was to demonstrate the effect of long-term deficiency of certain nutrients. Fertilizing treatments back then lacked one macronutrient or lime each. In 1949 and 1971, all plots were fertilized with P, K and lime until a normal nutrient supply and pH value were reestablished, followed both times by a renewed deficiency of certain nutrients. With the fertilization in 1971, new treatments were established, which have been continued until today. Today, the All treatment supplies N, P, K and lime in amounts according to the agricultural standard of the region. All2Nmin provides all nutrients in the same way, but the amount of mineral N is doubled. In all other treatments, either one of the macronutrients N, P or K or lime is missing (P- and K-deficiency treatments were not included in this study) or N is provided by either a combination of mineral and organic fertilization or by organic fertilization only. Since 1998, winter rye has been grown in a continuous single crop rotation without catch crops. The straw is completely removed.
The main properties of the applied cattle manure are given in Table 3.
Soil cultivation includes stubble clearing with a disc harrow, ploughing to a depth of about 20–25 cm and seedbed preparation with a reciprocating harrow.
The winter rye variety was changed from “Borellus” (Saatzucht Steinach GmbH und Co KG, Steinhagen, Germany) to “Conduct” (KWS SAAT SE & Co. KGaA, Einbeck, Germany) in 2014 in order to keep in touch with variety development and use in practice. Both are population varieties and recommended by their respective breeder for dry conditions and light soils. No sudden difference in grain or straw yield was detected after the change.

2.2. Sampling, Analyzing and Calculation Methods

Rye was harvested with a plot combine. Samples of straw and grain were dried for 24 h at 105 °C to determine dry matter content.
Soil samples were taken with a boring rod from the top 20 cm as mixed samples per plot in October of each year according to DIN ISO 10381-1:2003-08 [23]. They were sieved to 2 mm and analyzed for Ct by an elemental analyzer (Vario MAX Cube, Elementar Analysensysteme GmbH, Hanau, Germany) according to DIN ISO 10694:1996-08 [24]. Carbon sequestration was calculated based on the measured C content in mg 100 g soil−1, a mean bulk density of 1.481 g cm−3 and a sampling depth of 20 cm.
Climatic water balance was calculated based on precipitation measured on site and real evaporation over grass. Data for evaporation were provided by the German Meteorological Service (DWD). Evaporation is calculated by the DWD with the AMBAV agrometeorological model and refers to grass over sandy loam [25].

2.3. Statistics

Data were prepared with Microsoft Excel and statistically analyzed with SPSS Statistics Desktop 20.0 for Windows (IBM, Armonk, NY, USA). Checking for outliers was done via the IQR Method (using IQR * 1.5). If not stated otherwise, data are given as the mean of four replications. C-Sequestration was analyzed with one-way ANOVA followed by Tukey’s post hoc test (at p ≤ 0.05) to analyze the significance of differences between the treatments.

3. Results and Discussion

Straw and grain yields are given in Table 4. On average over the years, All2Nmin and All + Manure had the highest grain yields with 49.3 and 48.7 dt ha−1, respectively. The maximum grain yield of 80.4 dt ha−1 was produced by All2Nmin in 2009.
All + Manure treatment resulted in the highest straw yield of 69.5 dt ha−1 with a maximum of 91.7 dt ha−1 in 2010. This yield benefit is due to the higher inputs of nitrogen and thus is not surprising. It is, however, remarkable that no difference in grain yield was observed between All2Nmin and All + Manure in 9 out of 12 years, even though All2Nmin received twice the amount of nitrogen via mineral fertilization. Doubling the amount of mineral nitrogen from 60 to 120 kg ha−1 without organic compensation, as demonstrated through the treatments All and All2Nmin, also increased the average grain yield by only 8.6 dt ha−1 or 22%. At maximum, this yield benefit amounted to almost 20 dt ha−1 in 2009, but was also reversed once in 2010, when All2Nmin produced 5 dt ha−1 less grain yield than All. The average grain yield difference between All + Manure and All was 8.1 dt ha−1, or around 21%. According to German fertilization regulations for cattle manure, only 25% of the nitrogen applicated per year plus 10% of last year’s nitrogen are chargeable as plant-available nitrogen [26]. Following this, All + Manure received on average 37.4 kg ha−1 more plant-available nitrogen than All (in form of 107 kg ha−1 a−1 total N provided by manure, compare Table 3). However, All + Manure produced almost the same yield benefit as All2Nmin, which received 60 kg ha−1 a−1 more mineral N than All.
The lowest grain yields of all fertilized treatments were achieved by NoNmin + Manure with a mean of 36.5 dt ha−1. The lowest overall results were produced in the unfertilized control treatment with a mean straw and grain yield of 14.0 and 11.5 dt ha−1, respectively.
A decrease of grain yields is derivable for all fertilized treatments over the years except for the one without mineral fertilization (NoNmin + Manure), which demonstrates an increasing tendency. The yield gap between treatments with and without mineral nitrogen fertilization does not only get smaller over the years, but even disappears completely in 2018. This year was marked by very little rainfall and high temperatures overall and especially during the vulnerable flowering and grain-filling period in April and May ([27], compare Figure 1).
Due to the unfavorable weather conditions in 2018, major yield losses were observed throughout Germany in all cereal crops. In NoNmin + Manure, however, grain yields were even slightly higher than the 12-year average of this treatment, a result achieved by no other treatment.
N fertilization can help alleviate drought stress due to increased root development. However, under severe drought conditions, mineral nitrogen can also increase water stress due to the excessive transpirational demand of the resulting larger leaf area and vegetative mass [28]. Furthermore, N uptake is often reduced under drought conditions because mineral fertilizers do not dissolve in the soil solution, because microbial mineralization is reduced and because decreased transpiration rates results in less N transport from roots to shoots within plants [29]. This would explain why there is no significant yield difference detectable between fertilized treatments in dry years like 2018, but not why average yields continue to increase in the treatment NoNmin + Manure. One explanation for this effect is probably found below ground with regard to SOC contents.
Soil organic carbon contents are strongly influenced by environmental factors like precipitation and cultivation and show a high temporal and spatial variability [30,31]. To account for this, SOC contents are not only given as mean of four replicates per sampling date, but also as a gliding mean of four years (Figure 2). Due to the different history of fertilization on the plots, the treatments started from different levels of SOC contents. Nevertheless, an increase of SOC content was observed in all treatments over this study’s period of 12 years. Tiefenbacher, et al. [32] recently synthesized the newest scientific literature regarding the impact of agricultural management practices on SOC stocks. They found that NPK, N, P and K fertilization can enhance the SOC storage of the upper soil layer (0–20 cm) by 10%, 5%, 5% and 2%, respectively. Compared to these average values, the increases of SOC contents found in the present study are rather high. The increase between the first and the last 4-year period was 5.8% in the unfertilized control and 13.3% in the treatment All, which received full N, P, K and lime fertilization. This highest increase was observed for the two treatments with manure, where the SOC content was raised by 24.0% (NoNmin + Manure) and 27.6% (All + Manure) during the observation period, followed by the treatment All2Nmin with an increase of 22.2%. This is in accordance with the recent study of another long-term field experiment by Börjesson, et al. [33], who found that SOC stocks increased significantly in a cereal monoculture if nitrogen fertilizer was applied. The increases in soil carbon were generally associated with increases in soil nitrogen (data not shown). We therefore assume that even treatments with high nitrogen load (All2Nmin, All + Manure) did not result in considerable nitrogen losses. According to Martin, et al. [34], it is usually necessary to increase biomass production significantly in order to increase soil carbon contents. In the present study, however, SOC contents increased also in the unfertilized control, where biomass productivity is very low.
It must, however, be noted that SOC content development was divided into two phases: from 2007 to 2012, SOC increased reliably only in the two treatments with manure and in All2Nmin.
In the treatment All, SOC did increase only on a very low level, which might very well fall within the measurements’ error margin, and in the unfertilized control, it even decreased noticeably. From 2013 to 2018, SOC contents increased remarkably steeply in all treatments. This division might be due to climatic influences. During the first 6 years (2007–2012), mean temperature and CBW between September and July were 8.9 °C and 134.7 mm and mean temperature and rainfall in May were 14.4 °C and 67.2 mm, respectively. During the second period (2012–2018), mean temperature between September and July increased to 9.6 °C and mean temperature in May to 15.1 °C, while CWB between September and July decreased to 95.6 mm and rainfall in May decreased to 44.9 mm (compare Figure 1).
Especially spring and summer months might become too dry to allow for microbial degradation of fresh plant-derived carbon, while precipitation during autumn and winter is still high enough to allow for carbon production via plant growth, resulting in increased carbon sequestration in the soil. This would also explain the increase in the unfertilized control during the second half of the studied period. More years of observation are needed to see if the apparent trend will manifest itself further in the future, and a detailed investigation into the carbon fractions might help to understand whether carbon in the soil is stable humus carbon or part of not yet degraded or only partly degraded plant litter.
It must also be noted that the change in carbon sequestration steepness occurred at the same time as the change of the rye cultivar. While no changes were observed aboveground after the cultivar change in 2013 (compare Table 4), there might be a difference regarding carbon disposition via root and stubble of the two cultivars. Due to the complex and time intensive nature of root research, very little is known about the below ground carbon deposition of specific cereal cultivars. This, however, is of major significance for the carbon sequestration and humus reproduction potential of a specific site. Standardized root/shoot ratios do not suffice for the correct estimation of root biomass [35] due to major differences between species and cultivars. Bakhshandeh, et al. [36], for example, demonstrated that differences between root/shoot ratios of wheat genotypes are an indicator for differences in below-ground carbon disposition. Furthermore, below-ground carbon inputs are not only driven by root and stubble biomass, but also by rhizodeposition [37], which can account for more than 50% of plant-derived soil carbon inputs of cereals [38]. The amount, chemical composition and associated microbial turnover of the rhizodeposition varies between cultivars just as root biomass does [39,40]. Far more knowledge about below-ground biomass production and rhizodeposition is needed to evaluate agricultural measures intended to store carbon in soils. Existing studies suggest that cereal cultivars with high root/shoot ratios allocate more carbon to the soil than those with low root/shoot ratios, but do so at the expense of producing higher yields [36]. This might represent a conflict of objectives between maximum carbon storage and yield optimization. Moreover, root/shoot ratios are strongly influenced by fertilization intensity [41] and farming system, e.g., conventional vs. organic farming [9]. It is therefore necessary to develop carbon sequestration strategies that include recommendations for a specific, site-adapted combinations of cultivar and fertilization and to include allocation coefficients and root-derived carbon inputs as parameters in breeding.
The high amount of organic carbon in treatment All + Manure could explain the lack of yield differences between this treatment and All2Nmin in most years. Xia, et al. [42] conducted a global meta-analysis and found that substituting livestock manure for synthetic N fertilizer (with equivalent N rate) significantly increased crop yields and carbon sequestration and decreased N losses via NH3 emissions and leaching. The treatment NoNmin + Manure, on the other hand, demonstrates both chances and limits of organic fertilization and high SOC with regard to yield. With no other nutrient being limited, the lack of 60 kg ha−1 mineral nitrogen leads to an average yield gap of 12.2 dt ha−1, compared to All + Manure, even though NoNmin + Manure has the second highest SOC of all treatments (compare Figure 2). Compared to the control, however, the provision of lime, mineral P and K and 150 dt ha−1 cattle manure produces 25.1 dt ha−1 more grain yield. Depending on mineral nitrogen fertilizer prices and regarding the high energy demand of fertilizer production, this treatment is probably not only the most environmentally friendly one, but could also be the most economically favorable. Garratt, et al. [5] came to the same conclusion in a study with winter wheat on 84 fields in five countries. They found that greater SOC contents reduced pest pressure and increased yields by 10%, which did not compensate for a 30% yield increase achievable by mineral nitrogen fertilization, but which could be acceptable in a wider environmental context. This would become even truer if the trends shown in Figure 2 would become steady. In that case, the yield benefit achieved by additional mineral fertilization compared to a manure-only regime would further decrease and mineral nitrogen fertilization might become economically and ecologically obsolete.
The control, which did not receive any fertilization for many years before nor during the observed 12 years, had the lowest SOC content of all treatments with less than 400 mg 100 g soil−1. However, SOC was increased in this treatment as well, albeit only by 5.8%. Among the treatments without manure fertilization, All2Nmin had the highest SOC contents (up to 570 mg 100 g soil−1) and demonstrated the highest increase over the 12 years (22.2%). In the treatment All, which received no manure and only half of the mineral nitrogen compared to All2Nmin, SOC contents were increased only by 13.3% and reached a mean maximum of only 451 mg 100 g soil−1 for the last period.
The amount of C that was sequestered in the soil over 12 years is presented in Figure 3 in t ha−1. In All + Manure and NoNmin + Manure 6.0 and 5.1 t ha−1 of carbon were added to the soil between the first and the last 4-year period. The lowest amount was sequestered in the control (0.5 t ha−1). No significant difference was observed between All and All2Nmin, nor between All and the control.
With 6 t ha−1 of carbon sequestered in 12 years, the treatment All + Manure fulfills the prediction of McBratney, et al. [43] who calculated that on average, 0.5 t ha−1 a−1 of carbon could be sequestered globally under best management cropping practice. Compared to this benchmark, the treatments without organic fertilization fall significantly short. Even in All2Nmin, the treatment producing the highest amount of stable carbon among those without manure, only 3.2 t ha−1 of carbon were sequestered over 12 years (≈0.27 t ha−1 a−1). Surprisingly, this is still a lot more than the 0.19 t ha−1 a−1 that were stored under the most C-conserving treatment in a long-term field experiment in Wagga Wagga (Australia), which consisted of a wheat/subclover pasture with stubble retention and no-till practice [8]. In a direct comparison, any system without tillage and with fodder plants included in the rotation would be expected to retain more organic carbon in the soil than the monoculture with tillage and with straw removal investigated in this present study. However, the effectiveness of a particular management practice in increasing soil carbon is always site specific and dependent on climate, soil type, bulk density and initial carbon contents [8,44].
This becomes especially clear if the results are compared to the “4 per 1000 initiative” launched by France on 1 December 2015 at the COP 21. The initiative demands a yearly 4‰ (0.4%) increase in global agricultural soil organic carbon (SOC) stocks to slow down CO2-induced climate change [45]. Compared to this demand, all treatments in the present study do particularly well, regardless of whether the single year 2007 or the first 4-year period of 2007–2010 is taken as the calculation base (Table 5). Surprisingly, the 4‰ goal was reached with ease even without any fertilization. In the treatments with manure application, the actual C sequestration was up to 12 times higher than the requested 4‰ per year.
The results match quite well those of Minasny, et al. [46], who predicted that high carbon sequestration rates of up to 10‰ could be achieved for soils with low initial SOC stocks during the first 20 years after best management practices were implied. However, according to the same study, carbon sequestration would be limited to 4‰ a−1 after approximately 40 years, which remains to be seen at the Thyrow experiment. So far, no flattening of the SOC increase is apparent.
These findings are in stark contrast to Wiesmeier, et al. [47], who conducted an analysis of present soil management practices in Bavaria (Southern Germany) and concluded that the maximum annual sequestration potential corresponds to 1‰ of the present SOC stocks. Most Bavarian soils have a much higher initial level of SOC contents and higher contents of clay and silt and therefore probably also a higher amount of active soil organisms than soils in Eastern Germany including Thyrow [48]. The amount of carbon that corresponds to 0.4% is much higher than in the sandy soil of Thyrow, while at the same time, the turnover and mineralization rate is also higher. Therefore, the feasible carbon sequestration given as a percentage of initial levels is probably lower on soils with high fertility than on soils with low initial carbon contents and microbial activity. Börjesson, et al. [33] also found in their experiment that nitrogen fertilization influenced SOC contents in loam, but not in clay. The total amount of sequestered carbon, however, may still be greater in highly fertile soils, as has already been demonstrated by Körschens [49] in a study that compared the SOM increase potential on different soil types in Germany.
Further investigations are needed to understand how exactly the different fertilizer treatments and the resulting SOC contribute to soil fertility. In a Polish long-term field experiment, for example, the combined application of farmyard manure, mineral NPK-fertilizer and lime led to a significant decrease of aggregate stability of a sandy soil, even though the SOC content increased [50]. Li, et al. [18], on the other hand, reported that fertilization with manure decreased bulk density of a Chinese soil significantly compared to an untreated control and to mineral fertilization, but that the latter treatments had higher efficiencies of C retention from plant residues than those with manure. Furthermore, some authors also proclaim the existence of critical levels of SOC for each soil type. Beyond these levels, no further yield responses or microbial diversity are to be expected, whereas a significant loss of soil functions and productivity occurs if SOC drops below them [43].

4. Conclusions

  • Manure application stabilizes yields in years with drought and heat stress: Grain yields of the treatment with nitrogen coming from manure only tended to increase over the years, with above average yields (for this treatment) in the Europe-wide, climatically most difficult harvest year in 2018. Contrary to this, grain yields tended to decrease in all treatments with mineral nitrogen fertilization during the investigated period.
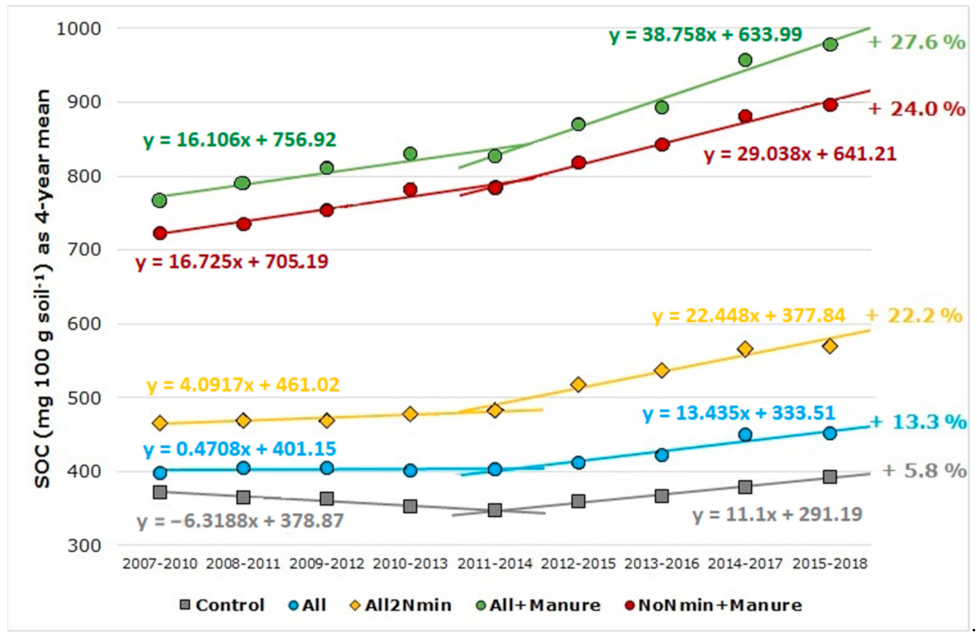
  • In light of changing environmental condition, the field trial is not in a steady-state condition regarding soil carbon contents even after multiple decades of experiment duration. Over the investigated 12-year period, SOC contents increased by 6% to 28%, with treatments receiving manure having both the highest overall SOC contents and the steepest increase over the investigation period.
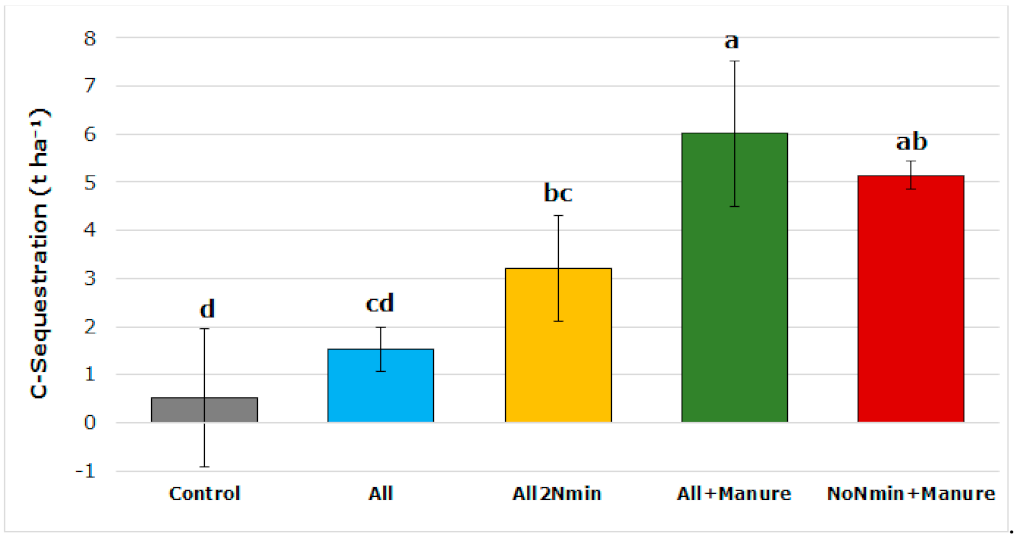
  • Reaching the 4‰ goal is achievable under the sandy soil conditions of the Thyrow site, even with soil tillage. Organic manuring can further enhance SOC contents.

Author Contributions

Conceptualization, C.-L.R., M.B. and T.K.; methodology, M.B. and F.E.; validation, C.-L.R., M.B., T.K. and F.E.; formal analysis, C.-L.R., M.B. and T.K.; investigation, M.B.; data curation, M.B.; writing—original draft preparation, C.-L.R.; writing—review and editing, M.B., T.K. and F.E.; visualization, C.-L.R.; supervision, T.K. and F.E. All authors have read and agreed to the published version of the manuscript.

Funding

This research received no external funding. The article processing charge was funded by the Deutsche Forschungsgemeinschaft (DFG, German Research Foundation)—491192747 and the Open Access Publication Fund of Humboldt-Universität zu Berlin.

Institutional Review Board Statement

Not applicable.

Informed Consent Statement

Not applicable.

Data Availability Statement

The data presented in this study are available on request from the corresponding author. The data are not publicly available due to restrictions of the responsible institution.

Conflicts of Interest

The authors declare no conflict of interest.

References

  1. Johns, T.J.; Angove, M.J.; Wilkens, S. Measuring soil organic carbon: Which technique and where to from here? Soil Res. 2015, 53, 717–736. [Google Scholar] [CrossRef]
  2. Seiter, S.; Horwath, W.R. Strategies for Managing Soil Organic Matter to Supply Plant Nutrients. In Soil Organic Matter in Sustainable Agriculture; Magdoff, F., Weil, R.R., Eds.; CRC Press: Boca Raton, FL, USA, 2004. [Google Scholar]
  3. Lehmann, J.; Kleber, M. The contentious nature of soil organic matter. Nature 2015, 528, 60–68. [Google Scholar] [CrossRef] [PubMed]
  4. Bot, A.; Benites, J. The Importance of Soil Organic Matter: Key to Drought-Resistant Soil and Sustained Food and Production; Food and Agriculture Organization of the United Nations: Roma, Italy, 2005; Volume FAO Soils Bulletin 80. [Google Scholar]
  5. Garratt, M.P.D.; Bommarco, R.; Kleijn, D.; Martin, E.; Mortimer, S.R.; Redlich, S.; Senapathi, D.; Steffan-Dewenter, I.; Świtek, S.; Takács, V.; et al. Enhancing Soil Organic Matter as a Route to the Ecological Intensification of European Arable Systems. Ecosystems 2018, 21, 1404–1415. [Google Scholar] [CrossRef] [Green Version]
  6. Jacobs, A.; Poeplau, C.; Weiser, C.; Fahrion-Nitschke, A.; Don, A. Exports and inputs of organic carbon on agricultural soils in Germany. Nutr. Cycl. Agroecosyst. 2020, 118, 249–271. [Google Scholar] [CrossRef]
  7. Travnikova, L.S.; Titova, N.A.; Kogut, B.M.; Schulz, E.; Körschens, M. Evaluation of the different soil organic matter (SOM) pools stability in long-term field experiments of germany by physical fractionation. Arch. Agron. Soil Sci. 2002, 48, 565–576. [Google Scholar] [CrossRef]
  8. Chan, Y. Increasing soil organic carbon of agricultural land. PrimeFacts 2008, 735, 1–5. [Google Scholar]
  9. Hirte, J.; Walder, F.; Hess, J.; Büchi, L.; Colombi, T.; van der Heijden, M.G.; Mayer, J. Enhanced root carbon allocation through organic farming is restricted to topsoils. Sci. Total Environ. 2021, 755, 143551. [Google Scholar] [CrossRef] [PubMed]
  10. Powlson, D.S.; Poulton, P.R.; Macdonald, A.J.; Johnston, A.E.; White, R.P.; Goulding, K.W.T. 4 per mille—Is it feasible to sequester soil carbon at this rate annually in agricultural soils? In Proceedings of the IFS Agronomic Conference, Cambridge, UK, 6–7 December 2018.
  11. Poulton, P.; Johnston, J.; Macdonald, A.; White, R.; Powlson, D. Major limitations to achieving “4 per 1000” increases in soil organic carbon stock in temperate regions: Evidence from long-term experiments at Rothamsted Research, United Kingdom. Glob. Chang. Biol. 2018, 24, 2563–2584. [Google Scholar] [CrossRef] [Green Version]
  12. Soja, G.; Mikula, K.; Pfeifer, C. Biochar as “negative emission technology” and as contribution to achieve the “4 per mille” objective in Austria. In Proceedings of the 21. Österreichischer Klimatag. Clash of Cultures? Klimaforschung Trifft Industrie! (21st Austrian Climate Day. Clash of Cultures? Climate Research Meets Industry!), Online, 12–13 April 2021. [Google Scholar]
  13. Riggers, C.; Poeplau, C.; Don, A.; Frühauf, C.; Dechow, R. How much carbon input is required to preserve or increase projected soil organic carbon stocks in German croplands under climate change? Plant Soil 2021, 460, 417–433. [Google Scholar] [CrossRef]
  14. Francaviglia, R.; Di Bene, C.; Farina, R.; Salvati, L.; Vicente-Vicente, J.L. Assessing “4 per 1000” soil organic carbon storage rates under Mediterranean climate: A comprehensive data analysis. Mitig. Adapt. Strateg. Glob. Chang. 2019, 24, 795–818. [Google Scholar] [CrossRef]
  15. Corbeels, M.; Cardinael, R.; Naudin, K.; Guibert, H.; Torquebiau, E. The 4 per 1000 goal and soil carbon storage under agroforestry and conservation agriculture systems in sub-Saharan Africa. Soil Tillage Res. 2019, 188, 16–26. [Google Scholar] [CrossRef] [Green Version]
  16. Smith, P. How long before a change in soil organic carbon can be detected? Glob. Chang. Biol. 2004, 10, 1878–1883. [Google Scholar] [CrossRef]
  17. Karhu, K.; Gärdenäs, A.I.; Heikkinen, J.; Vanhala, P.; Tuomi, M.; Liski, J. Impacts of organic amendments on carbon stocks of an agricultural soil—Comparison of model-simulations to measurements. Geoderma 2012, 189–190, 606–616. [Google Scholar] [CrossRef]
  18. Li, J.; Wen, Y.; Li, X.; Li, Y.; Yang, X.; Lin, Z.; Song, Z.; Cooper, J.M.; Zhao, B. Soil labile organic carbon fractions and soil organic carbon stocks as affected by long-term organic and mineral fertilization regimes in the North China Plain. Soil Tillage Res. 2018, 175, 281–290. [Google Scholar] [CrossRef] [Green Version]
  19. Tipping, E.; Davies, J.A.C.; Henrys, P.A.; Kirk, G.J.D.; Lilly, A.; Dragosits, U.; Carnell, E.J.; Dore, A.J.; Sutton, M.A.; Tomlinson, S.J. Long-term increases in soil carbon due to ecosystem fertilization by atmospheric nitrogen deposition demonstrated by regional-scale modelling and observations. Sci. Rep. 2017, 7, 1890. [Google Scholar] [CrossRef] [Green Version]
  20. Khan, S.A.; Mulvaney, R.L.; Ellsworth, T.R.; Boast, C.W. The Myth of Nitrogen Fertilization for Soil Carbon Sequestration. J. Environ. Qual. 2007, 36, 1821–1832. [Google Scholar] [CrossRef] [Green Version]
  21. Neff, J.C.; Townsend, A.R.; Gleixner, G.; Lehman, S.J.; Turnbull, J.; Bowman, W.D. Variable effects of nitrogen additions on the stability and turnover of soil carbon. Nature 2002, 419, 915–917. [Google Scholar] [CrossRef]
  22. DWD. (Deutscher Wetterdienst) Climate Data Center (CDC): Monatliche Raster der Summe der Realen Evapotranspiration über Gras für Deutschland (Monthly Grid of the Sum of Real Evapotranspiration over Grass for Germany), Version v19.3, Data Record-ID: urn:x-wmo:md:de.dwd.cdc::GRD_DEU_P1M_EVAPO-R. 2021. Available online: https://cdc.dwd.de/portal/202107291811/mapview (accessed on 1 December 2021).
  23. DIN ISO 10381-1:2003-08; Soil quality—Sampling—Part 1: Guidance on the Design of Sampling Programmes (ISO 10381-1:2002). German title: DIN ISO 10381-1:2003-08 Bodenbeschaffenheit—Probenahme—Teil 1: Anleitung zur Aufstellung von Probenahmeprogrammen (ISO 10381-1:2002); Beuth-Verlag: Berlin, Germany, 2003. [CrossRef]
  24. DIN ISO 10694:1996-08; Soil Quality—Determination of Organic and Total Carbon after Dry Combustion (Elementary Analysis) (ISO 10694:1995). German title: DIN ISO 10694:1996-08 Bodenbeschaffenheit—Bestimmung von organischem Kohlenstoff und Gesamtkohlenstoff nach trockener Verbrennung (Elementaranalyse) (ISO 10694:1995); Beuth-Verlag: Berlin, Germany, 1996.
  25. DWD. (Deutscher Wetterdienst). Datensatzbeschreibung: Monatliche Raster der Summe der Realen Evapotranspiration über Gras für Deutschland (Data Set Description: Monthly Grid of the Sum of Real Evapotranspiration over Grass for Germany). 2020. Available online: https://cdc.dwd.de/sdi/pid/GRD_DEU_P1M_EVAPO-R/BESCHREIBUNG_GRD_DEU_P1M_EVAPO-R_de.pdf (accessed on 1 December 2021).
  26. DÜV. Verordnung über die Anwendung von Düngemitteln, Bodenhilfsstoffen, Kultursubstraten und Pflanzenhilfsmitteln Nach den Grundsätzen der Guten Fachlichen Praxis beim Düngen (Düngeverordnung—DüV vom 26. Mai 2017 (BGBl. I S. 1305), Die Zuletzt Durch Artikel 97 des Gesetzes vom 10. August 2021 (BGBl. I S. 3436) Geändert Worden ist). (German Regulation on the Use of Fertilizers, Soil Additives, Growing Media and Plant Additives according to the Codes of Best Practice); German Federal Government: Berlin, Germany, 2021. [Google Scholar]
  27. BMEL. Ernte 2018—Mengen und Preise (Harvest 2018—Quantities and Prices); Bundesministerium für Ernährung und Landwirtschaft (Federal Ministry of Food and Agriculture): Berlin, Germany, 2018; Volume Bericht zur Erntelage (Stand: 22. August 2018), pp. 1–28. [Google Scholar]
  28. Nielsen, D.C.; Halvorson, A.D. Nitrogen Fertility Influence on Water Stress and Yield of Winter Wheat. Agron. J. 1991, 83, 1065–1070. [Google Scholar] [CrossRef] [Green Version]
  29. Hu, Y.; Schmidhalter, U. Drought and salinity: A comparison of their effects on mineral nutrition of plants. J. Plant Nutr. Soil Sci. 2005, 168, 541–549. [Google Scholar] [CrossRef]
  30. Ou, Y.; Rousseau, A.N.; Wang, L.; Yan, B. Spatio-temporal patterns of soil organic carbon and pH in relation to environmental factors—A case study of the Black Soil Region of Northeastern China. Agric. Ecosyst. Environ. 2017, 245, 22–31. [Google Scholar] [CrossRef]
  31. Eller, B.H.; Janzen, H.H.; VandenBygaart, A.J.; Bremer, E. Measuring Change in Soil Organic Carbon Storage. In Soil Sampling and Methods of Analysis, 2nd ed.; Carter, M.R., Gregorich, E.G., Eds.; Taylor & Francis Group: Boca Raton, FL, USA, 2006; pp. 41–61. [Google Scholar]
  32. Tiefenbacher, A.; Sandén, T.; Haslmayr, H.-P.; Miloczki, J.; Wenzel, W.; Spiegel, H. Optimizing Carbon Sequestration in Croplands: A Synthesis. Agronomy 2021, 11, 882. [Google Scholar] [CrossRef]
  33. Börjesson, G.; Bolinder, M.A.; Kirchmann, H.; Kätterer, T. Organic carbon stocks in topsoil and subsoil in long-term ley and cereal monoculture rotations. Biol. Fertil. Soils 2018, 54, 549–558. [Google Scholar] [CrossRef] [Green Version]
  34. Martin, M.P.; Dimassi, B.; Dobarco, M.R.; Guenet, B.; Arrouays, D.; Angers, D.A.; Blache, F.; Huard, F.; Soussana, J.-F.; Pellerin, S. Feasibility of the 4 per 1000 aspirational target for soil carbon: A case study for France. Glob. Chang. Biol. 2021, 27, 2458–2477. [Google Scholar] [CrossRef]
  35. Hu, T.; Sørensen, P.; Wahlström, E.M.; Chirinda, N.; Sharif, B.; Li, X.; Olesen, J.E. Root biomass in cereals, catch crops and weeds can be reliably estimated without considering aboveground biomass. Agric. Ecosyst. Environ. 2018, 251, 141–148. [Google Scholar] [CrossRef]
  36. Bakhshandeh, S.; Corneo, P.E.; Yin, L.; Dijkstra, F.A. Drought and heat stress reduce yield and alter carbon rhizodeposition of different wheat genotypes. J. Agron. Crop Sci. 2019, 205, 157–167. [Google Scholar] [CrossRef]
  37. Hütsch, B.W.; Augustin, J.; Merbach, W. Plant rhizodeposition—An important source for carbon turnover in soils. J. Plant Nutr. Soil Sci. 2002, 165, 397–407. [Google Scholar] [CrossRef]
  38. Hirte, J.; Leifeld, J.; Abiven, S.; Oberholzer, H.-R.; Mayer, J. Below ground carbon inputs to soil via root biomass and rhizodeposition of field-grown maize and wheat at harvest are independent of net primary productivity. Agric. Ecosyst. Environ. 2018, 265, 556–566. [Google Scholar] [CrossRef]
  39. Semchenko, M.; Xue, P.; Leigh, T. Functional diversity and identity of plant genotypes regulate rhizodeposition and soil microbial activity. New Phytol. 2021, 232, 776–787. [Google Scholar] [CrossRef]
  40. Mwafulirwa, L.; Baggs, E.M.; Russell, J.; George, T.; Morley, N.; Sim, A.; de la Fuente Cantó, C.; Paterson, E. Barley genotype influences stabilization of rhizodeposition-derived C and soil organic matter mineralization. Soil Biol. Biochem. 2016, 95, 60–69. [Google Scholar] [CrossRef]
  41. Hirte, J.; Leifeld, J.; Abiven, S.; Mayer, J. Maize and wheat root biomass, vertical distribution, and size class as affected by fertilization intensity in two long-term field trials. Field Crops Res. 2018, 216, 197–208. [Google Scholar] [CrossRef]
  42. Xia, L.; Lam, S.K.; Yan, X.; Chen, D. How Does Recycling of Livestock Manure in Agroecosystems Affect Crop Productivity, Reactive Nitrogen Losses, and Soil Carbon Balance? Environ. Sci. Technol. 2017, 51, 7450–7457. [Google Scholar] [CrossRef] [PubMed]
  43. McBratney, A.B.; Stockmann, U.; Angers, D.A.; Minasny, B.; Field, D.J. Challenges for Soil Organic Carbon Research. In Soil Carbon. Progress in Soil Science; Hartemink, A., McSweeney, K., Eds.; Springer: Cham, Switzerland, 2014; pp. 3–16. [Google Scholar] [CrossRef]
  44. Ren, F.; Misselbrook, T.H.; Sun, N.; Zhang, X.; Zhang, S.; Jiao, J.; Xu, M.; Wu, L. Spatial changes and driving variables of topsoil organic carbon stocks in Chinese croplands under different fertilization strategies. Sci. Total Environ. 2021, 767, 144350. [Google Scholar] [CrossRef] [PubMed]
  45. van Groenigen, J.W.; van Kessel, C.; Hungate, B.A.; Oenema, O.; Powlson, D.S.; van Groenigen, K.J. Sequestering Soil Organic Carbon: A Nitrogen Dilemma. Environ. Sci. Technol. 2017, 51, 4738–4739. [Google Scholar] [CrossRef] [PubMed] [Green Version]
  46. Minasny, B.; Malone, B.P.; McBratney, A.B.; Angers, D.A.; Arrouays, D.; Chambers, A.; Chaplot, V.; Chen, Z.-S.; Cheng, K.; Das, B.S.; et al. Soil carbon 4 per mille. Geoderma 2017, 292, 59–86. [Google Scholar] [CrossRef]
  47. Wiesmeier, M.; Mayer, S.; Burmeister, J.; Hübner, R.; Kögel-Knabner, I. Feasibility of the 4 per 1000 initiative in Bavaria: A reality check of agricultural soil management and carbon sequestration scenarios. Geoderma 2020, 369, 114333. [Google Scholar] [CrossRef]
  48. BGR. BGR-Geoviewer. Available online: https://geoviewer.bgr.de/mapapps4/resources/apps/geoviewer/index.html?lang=de (accessed on 13 November 2021).
  49. Körschens, M. Soil organic matter and environmental protection. Arch. Agron. Soil Sci. 2004, 50, 3–9. [Google Scholar] [CrossRef]
  50. Šimanský, V.; Juriga, M.; Jonczak, J.; Uzarowicz, Ł.; Stępień, W. How relationships between soil organic matter parameters and soil structure characteristics are affected by the long-term fertilization of a sandy soil. Geoderma 2019, 342, 75–84. [Google Scholar] [CrossRef]
Figure 1. Climatic water balance (CWB) and mean temperature during the growing season of winter rye (September to July) and mean temperature and rainfall in May, the month during which most of the grain filling usually occurs in the region. Precipitation and temperature were measured on site, evaporation data for CWB calculation were taken from DWD [22].
Agriculture 12 00170 g001
Figure 2. Soil organic carbon content (SOC) as a linear regression through gliding means of four years, based on the first five and last five periods, respectively. Change of cultivar took place in 2013; therefore, period five (2011–2014) consists of two years with each cultivar. Percentages at the end of each graph show the increase from period one (2007–2010) to period nine (2015–2018).
Agriculture 12 00170 g002
Figure 3. Carbon sequestration between period one (2007–2010) and period nine (2015–2018) with regard to the upper 20 cm and based on a bulk density of 1.48 g cm−3. Different letters mark significant differences between treatments (Tukey’s HSD test, p ≤ 0.05, n = 4, error bars = SD).
Agriculture 12 00170 g003
Table 1. General soil parameters at the research station Thyrow, taken from the soil profile next to the experiment field.
ParameterTopsoil (0–30 cm)Subsoil (30–60 cm)
Clay (%)<5<5–20
Silt (%)10–1410–27
Sand (%)>8050–80
Bulk Density (g cm−3)~1.6~1.7
Corg (%)0.4–0.8<0.02
CEC 1 (cmolc kg−1)<5<5–11
uFC 2 (mm)2420–66
1 Cation exchange capacity, 2 usable field capacity.
Table 2. Fertilizer treatments chosen for the experiment from the field trial. “✓” means that the amount of nutrient/fertilizer in this column is included in the treatment, “-“ means it is not.
DesignationFertilizer Amount per ha and Year
N 1
(60 kg)
N 1
(120 kg)
P 2
(24 kg)
K 3
(100 kg)
CattleManure (150 dt)Lime 4
Control------
All--
All2Nmin--
All + Manure-
NoNmin + Manure--
Mineral fertilizers used: 1 Calcium ammonium nitrate (CAN), 2 triple superphosphate (TSP), 3 Patentkali, 4 DOLOKORN, amount as needed to keep a soil pH of 5.5–5.8.
Table 3. Main properties of cattle manure (data given as mean of the years 2007–2018 ± SD).
Dry Matter (DM) in%N
(% DM)
C
(% DM)
Applied DM (dt ha−1 a−1)Applied N
(kg ha−1 a−1)
Applied C
(dt ha−1 a−1)
36.4 ± 10.82.1 ± 0.431.9 ± 7.1 54.6 ± 16.1106.9 ± 28.016.7 ± 6.6
Table 4. Grain and straw yield between 2007 and 2018 ± SD; both adjusted to 86% dry matter content. Different letters mark significant differences between treatments within a row (Tukey’s HSD test, p ≤ 0.05).
ControlAllAll2NminAll + ManureNoNmin +
Manure
Grain Yield (dt ha−1)
mean11.5 ± 1.1 a40.6 ± 8.3 bc49.3 ± 11.6 c48.7 ± 9.5 c36.5 ± 6.3 b
200710.8 ± 0.7 a34.1 ± 2.8 b43.9 ± 2.7 c44.3 ± 2.4 c32.2 ± 2.1 b
200812.0 ± 1.4 a38.6 ± 1.1 c39.8 ± 1.1 c42.0 ± 2.3 c30.5 ± 1.9 b
200914.4 ± 1.1 a60.5 ± 5.9 c80.5 ± 2.7 d75.3 ± 1.6 d43.1 ± 2.5 b
201012.2 ± 0.9 a46.4 ± 0.2 d41.4 ± 1.7 c47.4 ± 2.5 d34.3 ± 0.6 b
201110.5 ± 1.0 a29.8 ± 0.6 b45.9 ± 2.8 d41.1 ± 2.6 c26.6 ± 1.1 b
201211.0 ± 0.9 a41.9 ± 4.7 b51.5 ± 0.9 c47.7 ± 4.2 bc43.0 ± 1.0 b
201311.4 ± 1.2 a46.9 ± 5.4 c48.1 ± 3.6 c51.7 ± 2.9 c33.2 ± 1.2 b
201411.9 ± 1.0 a44.4 ± 2.2 b56.7 ± 3.3 c55.4 ± 2.5 c44.4 ± 4.2 b
201511.6 ± 0.6 a43.6 ± 2.0 b57.1 ± 2.9 c47.6 ± 4.9 b46.5 ± 4.0 b
201610.7 ± 1.1 a38.5 ± 5.1 b47.1 ± 3.1 c48.7 ± 2.5 c34.7 ± 2.0 b
201710.1 ± 0.4 a33.1 ± 3.1 b40.6 ± 2.6 c41.0 ± 5.7 c31.9 ± 1.4 b
201811.1 ± 0.8 a32.1 ± 3.0 b38.9 ± 1.9 c42.7 ± 3.5 c37.8 ± 3.2 bc
Straw Yield (dt ha−1)
mean14.0 ± 2.2 a52.8 ± 8.8 b63.4 ± 9.2 bc69.5 ± 11.6 c53.8 ± 12.0 b
200715.6 ± 1.3 a46.0 ± 4.4 b58.5 ± 2.9 c58.6 ± 5.8 c56.5 ± 4.3 c
200815.0 ± 1.6 a58.7 ± 5.8 c65.8 ± 4.2 cd72.9 ± 3.3 d48.1 ± 1.1 b
200918.1 ± 2.5 a59.5 ± 4.9 b66.7 ± 4.2 bc72.1 ± 7.8 c56.3 ± 5.1 b
201015.7 ± 2.3 a69.4 ± 6.9 c84.3 ± 4.7 d91.7 ± 6.3 d51.7 ± 4.3 b
201110.1 ± 1.5 a39.6 ± 1.1 b50.6 ± 3.1 c47.4 ± 2.0 c33.4 ± 5.9 b
201213.6 ± 1.2 a56.6 ± 5.1 b67.8 ± 1.4 c77.7 ± 3.8 d65.7 ± 2.4 c
201314.5 ± 1.3 a52.1 ± 2.0 b61.1 ± 3.0 c67.8 ± 6.7 c47.6 ± 1.9 b
201410.1 ± 0.5 a49.6 ± 1.5 c64.7 ± 2.1 d66.8 ± 3.0 d45.1 ± 1.4 b
201513.6 ± 1.2 a57.1 ± 4.4 bc65.4 ± 3.8 cd65.7 ± 3.7 d56.0 ± 5.2 b
201615.1 ± 3.3 a47.4 ± 4.3 b54.1 ± 5.0 b70.1 ± 3.2 c52.0 ± 3.8 b
201710.5 ± 1.3 a42.8 ± 6.5 b55.6 ± 7.9 c60.9 ± 1.4 c37.5 ± 1.4 b
201819.0 ± 2.6 a57.4 ± 6.0 b69.4 ± 4.5 c82.7 ± 6.3 d61.0 ± 3.8 bc
Table 5. Measured vs. calculated C sequestration over 12 years in t ha−1.
TreatmentMeasured
(Difference between Period One (2007–2010) and Period Nine (2015–2018)
Calculated
(Based on an Increase of 0.4% per Year from 2007 to 2018)
Calculated
(Based on an Increase of 0.4% from Period One (2007–2010) to Period Nine (2015–2018))
Control0.520.370.41
All1.520.390.78
All2Nmin3.210.440.50
All + Manure6.010.730.83
NoNmin + Manure5.150.690.43
Publisher’s Note: MDPI stays neutral with regard to jurisdictional claims in published maps and institutional affiliations.

