Article

Response of Indian Dwarf Wheat and Persian Wheat to Sowing Density and Hydrothermal Conditions of the Growing Seasons

by
Małgorzata Szczepanek
1,*,
Grzegorz Lemańczyk
2,
Rafał Nowak
1 and
Radomir Graczyk
3
1
Department of Agronomy, Bydgoszcz University of Science and Technology, 85-796 Bydgoszcz, Poland
2
Department of Biology and Plant Protection, Bydgoszcz University of Science and Technology, 85-796 Bydgoszcz, Poland
3
Department of Biology and Animal Environment, Bydgoszcz University of Science and Technology, 85-039 Bydgoszcz, Poland
*
Author to whom correspondence should be addressed.
Agriculture 2022, 12(2), 205; https://doi.org/10.3390/agriculture12020205
Submission received: 15 January 2022 / Revised: 30 January 2022 / Accepted: 31 January 2022 / Published: 1 February 2022
(This article belongs to the Special Issue Integrated Crop Management in Sustainable Agriculture)

Abstract

:
The need for foods with high nutritional value has led to the rediscovery of ancient wheat species Triticum sphaerococcum and T. persicum as raw materials with valuable consumption properties, but their reintroduction requires assessment of their productivity under different agricultural practices. The field experiments were carried out for three years (2018–2020) to test the hypothesis that the sowing density of T. sphaerococcum and T. persicum (400, 500 and 600 no m−2) will affect their agronomic traits, yield and occurrence of diseases, but the response will depend on the hydrothermal conditions of the growing seasons. In this study, a significant correlation of the grain yield with the amount of precipitation in tillering, and from booting to the beginning of fruit development was demonstrated. The sowing density of T. sphaerococcum had an impact on the grain yield only under moderate drought stress during the growing season (2019), when the highest yield was obtained at a sowing density of 600 m−2. In 2019, the most favorable sowing density was also the highest for T. persicum. In the year with the lowest amount of rainfall during the growing season (2018), the yield of T. persicum was the highest in the lowest sowing density. At the shooting stage, a greater intensity of powdery mildew was observed on T. persicum, especially with higher sowing densities. Increasing the sowing density also increased the occurrence of root rot symptoms in both wheat species in the year that favored the occurrence of this disease (2018). It can be concluded that in the integrated low-input cultivation of T. sphaerococcum and T. persicum, it is justified to use a sowing density of 600 pcs. m−2, in an agroclimatic zone with moderate droughts during the growing season.

1. Introduction

One of the key objectives of long-term EU policy is to increase the production of foods with high nutritional value using low-input cultivation technologies [1]. Ancient wheat species characterized by an increased content of macro and micronutrients [2] and much higher (as compared to other cultivated wheat species) contents of phenolic acids and alkylresorcinols, with proven pro-health effects [2], may be useful for these purposes. Examples of ancient species of cereals with increased nutritional value are Indian dwarf wheat (Triticum sphaerococcum Perc. = T. aestivum L. ssp. sphaerococcum (Perc.) Mac Key) and Persian wheat (Triticum persicum Vav. = T. carthlicum Nevski) [3,4]. The grains of both genotypes are a rich source of phenolic acids and alkylresorcinols. Moreover, in these wheats, an enhanced share of ferulic acid was found, accompanied by higher quantitative and qualitative variability of homologues within sterols, tocols and carotenoids [3]. Indian dwarf wheat is an endemic plant in Pakistan and India. It is known to have been one of the main crops grown by ancient Indian cultures. However, its cultivation disappeared during the early twentieth century [5]. Indian dwarf wheat is a hexaploid species and has naked grains [6]. Persian wheat is a tetraploid, early-maturing spring wheat, and originates from the southern slopes of the Greater Caucasus in Georgia [6,7]. Reintroduction of ancient wheat species such as Indian dwarf wheat or Persian wheat requires the assessment of productivity under different agricultural practices. Among them, one basic measure is the sowing density, which influences the inter- and intra-plant competition for nutrients, light and water, which may significantly affect the yield components and grain yield [8]. The researchers’ opinions on the effect of sowing density on the yield of wheat grain are ambiguous. Poutala et al. [9] did not demonstrate the effect of sowing density (600 and 900 pcs. M−2) on the grain yield of nine common wheat cultivars in organic cultivation. Similarly, Auškalnienė and Auškalnis [10] found no effect on the grain yield of six spring wheat sowing densities (from 200 to 700 pcs. M−2) in conventional cultivation. Fisher et al. [11], summarizing a 30-year study of modern irrigated short wheat cultivars under favorable climatic conditions, found that grain yield was remarkably insensitive to planting density within the range of 80–400 plants m−2. In contrast, Silva et al. [12] showed an increase in the yield of common wheat grain with an increase in sowing density (75–375 pcs. m−2). Similar conclusions are presented by Hussain et al. [13], who compared the wheat response to seed rates of 50, 100, 150 and 200 kg ha−1. The increase in yield shown in this study resulted from the decreased weed pressure along with an increase in the sowing density of wheat. In the study by Olsen et al. [14], the weed biomass was 46% lower and the grain yield was 25% higher in the high-density uniform sowing pattern (721 pcs. m−2; treatment with the greatest weed suppression) than in the medium-density row sowing pattern (449 pcs. m−2). Cardoso et al. [15] report that an increase in sowing density favors the seed yield; however, it reduces the vigor of the seeds produced. Sowing density affects the morphological traits of plants, including those directly related to the yield (yield components). The number of generative shoots usually increases with an increase in sowing density [12,16], but the number of grains per spike may decrease [8,17], as well as 1000-grain weight [8,9]. However, another study has shown no effect of density on the number of grains per spike or 1000-grain weight [13]. The relationship between plant density and yield is not directly proportional due to the plasticity of the wheat plant (the ability of the crop to sustain yield by changing yield components) [16].
Morphological traits and yield of wheat are severely affected by different weather stresses, such as drought, cold, and heat [18]. Wheat yield can be reduced by 65% after heat stress [19]. For every 1 °C increase in average temperature from 23 °C, the wheat yield can decrease by about 10% [20]. Heat stress increases evapotranspiration, leading to drought stress in plants. A combined effect of drought and heat stress is more detrimental than individual stresses [21]. Wheat shows the highest susceptibility under water stress from tillering to maturity [22]. Zhang et al. [23] report that the reductions in common wheat yield under mild, moderate, and severe stress were 21.0%, 25.8%, and 32.0%, respectively. Filled grain percentage or seed setting rate, grain number per spike, spike number per plant or m2, and 1000-grain weight show significantly larger reductions under severe stress than under mild stress [23]. In study of primary wheat (Triticum beoticum) lack of water significantly affected morphological parameters such as the number of fertile spikes per plant, number of spikelets per spike, 1000-grain weight, leaf area index, relative water content, main root length and volume, as well as root dry weight and area [24]. A comparison of the stress resistance of di-, tetra- and hexaploid wheat shows that hexaploid wheat held the productive and adaptive advantage as it combined higher yield and stability when compared to the tetraploid and diploid groups [25]. Moreover, the number of spikes per m2 was found to be more important than grain number per spike in determining grain yield under heat stress in hexaploid and tetraploid wheat species, while the grain number per spike was more important in diploids.
The incidence of fungal diseases is also a known factor significantly affecting the size of wheat crops [26,27,28]. Among them, the ones most often observed on the leaves of wheat plants are powdery mildew (caused by Blumeria graminis), Septoria leaf spot (caused by Zymoseptoria tritici, synonym Septoria tritici) and wheat leaf rust (caused by Puccinia recondita). Foot and root rot diseases, in properly cultivated spring forms of wheat, do not pose a great threat. However, the symptoms of root rot (caused by Gaeumannomyces graminis, Fusarium spp., Rhizoctonia spp.), Fusarium foot rot (caused by Fusarium spp.) and eyespot (caused by Oculimacula acuformis, and Oculimacula yallundae) can be observed during the growing season [29,30]. Diseases such as powdery mildew, Fusarium foot rot and root rot are of particular importance in the cultivation of Persian wheat and Indian dwarf wheat [31]. The incidence of disease symptoms in wheat significantly depends on weather conditions. Rainfall, not only the total, but also the frequency, distribution in particular stages of plant development, and moisture in the canopy play a special role here [32]. For pathogens whose spores are easily spread by raindrops splashing from the lower infected parts of the plant to the upper leaves, the closer the leaves are to each other, the easier the spores are spread to the upper parts [33]. The incidence of disease symptoms in wheat crops also depends on various agrotechnical practices, including the date and density of sowing [28,34]. This effect may be direct, but often the sowing method indirectly influences the incidence of diseases on plants [35].
The aim of the research was to evaluate the response of yield, biometric traits and incidence of diseases on the ancient wheat species, Indian dwarf and Persian wheat, using integrated, low-input (limited N rate and pesticide consumption) technology depending on the sowing density under varied hydrothermal conditions of the growing seasons. It was assumed that (1) increasing the sowing density would increase the number of production shoots per area unit and increase the grain yield, but at the same time would contribute to greater disease pressure; (2) the response of yield, plant biometric traits and the incidence of diseases will depend on the hydrothermal conditions during the growing season.

2. Materials and Methods

2.1. Site Description and Crop Management

Field experiments were located in Mochełek, Kuyavian-Pomeranian voivodeship (53°13′ N; 17°51′ E), Poland. The soils at experimental sites were characterized as Alfisol (USDA). The abundance of available macronutrients, pH and C-org content in the site of the research is presented in Table 1. The precipitation and thermal conditions in the subsequent years of field experiments were very diverse (Table 2). The year 2018 was warm (except March) with a large amount of rainfall in April and July. The hottest month in 2019 was June, with heavy rainfall only in May. 2020 was cool, with average rainfall in May and heavy rainfall in June and July.
At the beginning of August, immediately after harvesting of the previous crop (triticale), the catch crop of a pea was sown. This catch crop was plowed at the end of November, after the above-ground part had frozen over. At the beginning of March, in each year of the research, pre-sowing mineral fertilization was performed at the following rates: 30 P2O5 kg ha−1 (superphosphate), 50 K2O kg ha−1 (potassium salt) and 30 N kg ha−1 (ammonium sulphate) and additionally, 30 N kg ha−1 at the beginning of the shooting stage. In early spring (middle of march), the soil was cultivated with a tillage unit. Sowing of the wheat was performed 9 April 2018, 1 April 2019 and 23 March 2020 using OYORD plot seeder, in a row spacing of 16 cm. In determining the seeding rate, the 1000-grain weight and germination capacity as well as plant establishment (the ratio of seedlings vs. seeds), a value of 90% was set. Persian wheat was harvested at the end of July, and Indian dwarf wheat 10 days later, using a Wintersteiger plot harvester.
In our study, the cultivar ‘Trispa’ of Indian dwarf wheat was used [36]. This cultivar has long (65–80 cm), stiff shoots. The stems are covered with wax coating. The spike is short (5 cm) and awned. The spikelets are one- or two-grained. The grain of Indian dwarf wheat is rounded and relatively small (average 1000-grain weight is 30 g). For Persian wheat, the cultivar ‘Persa’ was used [36]. This cultivar develops thin and long stems (65–80 cm), which are susceptible to lodging. There is no wax coating on the leaves. The medium long spike (7–8 cm) is brownish, loose, and awned. The spikelets are two- or three-flowered, and one- or two-grained. The grain of Persian wheat is elongated and small (average 1000-grain weight is 28 g). Both Persian wheat and Indian dwarf wheat grains are naked.
Indian dwarf wheat (Triticum sphaerococcum Perc.), cv ‘Trispa’ and Persian wheat (Triticum persicum Vav.) cv ‘Persa’ were sown in three sowing densities: 400, 500, 600 grains m−2. The experiment was established in a split-plot design, in four replications. The area of the plot for harvest was 21 m2.
Pesticide treatments were applied using the same technology for both wheat species, adjusting the selection of preparations to the current threats from pests. Weed control was performed using florasulam 5 g a.i. ha−1, aminopyralid 10 g a.i. ha−1 +2,4-dichlorophenoxyacetic acid 180 g a.i. ha−1 (Mustang Forte 1 dm3 ha−1) at the end of the tillering stage (BBCH 29) and, after 7 days, fenoxaprop-P-ethyl 77 g a.i. ha−1 (Fenoxinn 0.7 dm3 ha−1). In order to reduce the pressure of disease, fenpropimorph 250 g a.i. ha−1 and epoxiconazole 84 g a.i. ha−1 (Tango Star 1 dm3 ha−1) were applied once, at the full-fledged flag leaf stage (BBCH 39). Plant growth regulators were applied: chlormequat chloride 720 g a.i. ha−1 (CCC 1 dm3 ha−1) with ethephon 225 g a.i. ha−1 (Kobra 0.5 dm3 ha−1), at the first node stage (BBCH 31). Pests were controlled with the use of chlorpyrifos 228 g a.i. ha−1 (Insodex 0.6 dm3 ha−1) and deltamethrin 5 g a.i. ha−1 (Delcaps 0.1 dm3 ha−1), to prevent the intensity of occurrence of cereal leaf beetles and aphids from exceeding the thresholds of economic harmfulness.

2.2. Measurements of Morphological and Agronomic Traits

At the heading stage, the number of generative and vegetative tillers per plant was determined on subsequent plants collected from 1 linear meter from each plot. At full maturity, the number of generative fertile tillers (with grains) and sterile generative tillers (with spikes without grains) was determined on test plots of 1 m2 on each plot. Moreover, 50 spikes were randomly collected from each plot, on which the number of grains per spike were measured. During harvest, the grain and straw yields as well as their moisture content were determined. Then, yields were converted into a constant humidity of 15%. The 1000-grain weight was determined based on 500 pcs, in four replications of each treatment.

2.3. Diseases Occurrence Assessment

The plant health assessment included an analysis of the severity of the most dangerous leaf diseases, the stem base and spring wheat roots, i.e., powdery mildew, Fusarium foot rot and root rot. The severity of disease symptoms caused by mildew was determined at stem elongation (Se) and at fruit development (Df). On the first assessment date, carried out prior to the fungicide application, the health of the lower leaves (L3 and L4) was assessed, and on the second date, the health of the flag leaf (L1), which was described as a percentage of the leaf area that was covered with Blumeria graminis mycelium or disease symptoms caused by this pathogen, was assessed. On the second assessment date, the severity of disease symptoms was also determined based on damage to wheat stalks caused by Fusarium fungi (Fusarium foot rot) and the severity of disease symptoms on the roots caused by a complex of pathogens, i.e., Gaeumannomyces graminis, Fusarium spp., Rhizoctonia spp. (root rot). The assessment of the severity of powdery mildew was performed directly on the experimental plots and the severity of Fusarium foot rot and root rot was determined in the laboratory. One hundred generative tillers of each combination were assessed for health status and the occurrence or severity of disease symptoms. In laboratory conditions, after separating of the tillers and removal of the leaf sheaths, the degree of infection of the stem base and roots was assessed on a scale of 0-4, where 0 meant no symptoms of a given disease, and 4 meant severe infection, when the symptoms of Fusarium foot rot covered the stem base around followed by its rot or symptoms of root rot were observed on more than 60% of the surface of the assessed roots. Infection rates were transferred to the disease index (DI) according to the Townsend and Heuberger formula and expressed as a percentage.

2.4. Statistical Analyses

The basic statistical descriptors included arithmetic mean ( x ¯ ) and standard deviation (SD). Analysis of the results was performed using statistical inference methods [37]. Normality was examined by the Kolmogorov-Smirnov test and homogeneity of variance with the Levene’s test. The data were analyzed by two-way analysis of variance (ANOVA), in which the sowing density and study years (temperature and precipitation were included as passive variables) were the main factors, and then to determine significant differences between the means, the Tukey test was used. Based on the same data set, the analysis of the structure of agronomic traits and disease occurrence, depending on the years of study and sowing density, was performed via Canonical Correspondence Analysis (CCA). Pearson’s correlation coefficient was used to measure the correlation between grain yield, biometric features of T. sphaerococcum and T. persicum and Sielianinov’s hydrothermal coefficient. Quadratic polynomial regression was used to relate the grain yield and sowing density of T. sphaerococcum and T. persicum in the study years 2018–2020. The analyses were performed using PAST 3.2 software, CANOCO 4.5, MS EXCEL 365 and STATISTICA 13.3 (Hammer UiO, 2018, Microcomputer Power, USA, Microsoft 2020, Statsoft 2019). The significance level for all analyses was assumed to be minimal, α = 0.05.

3. Results

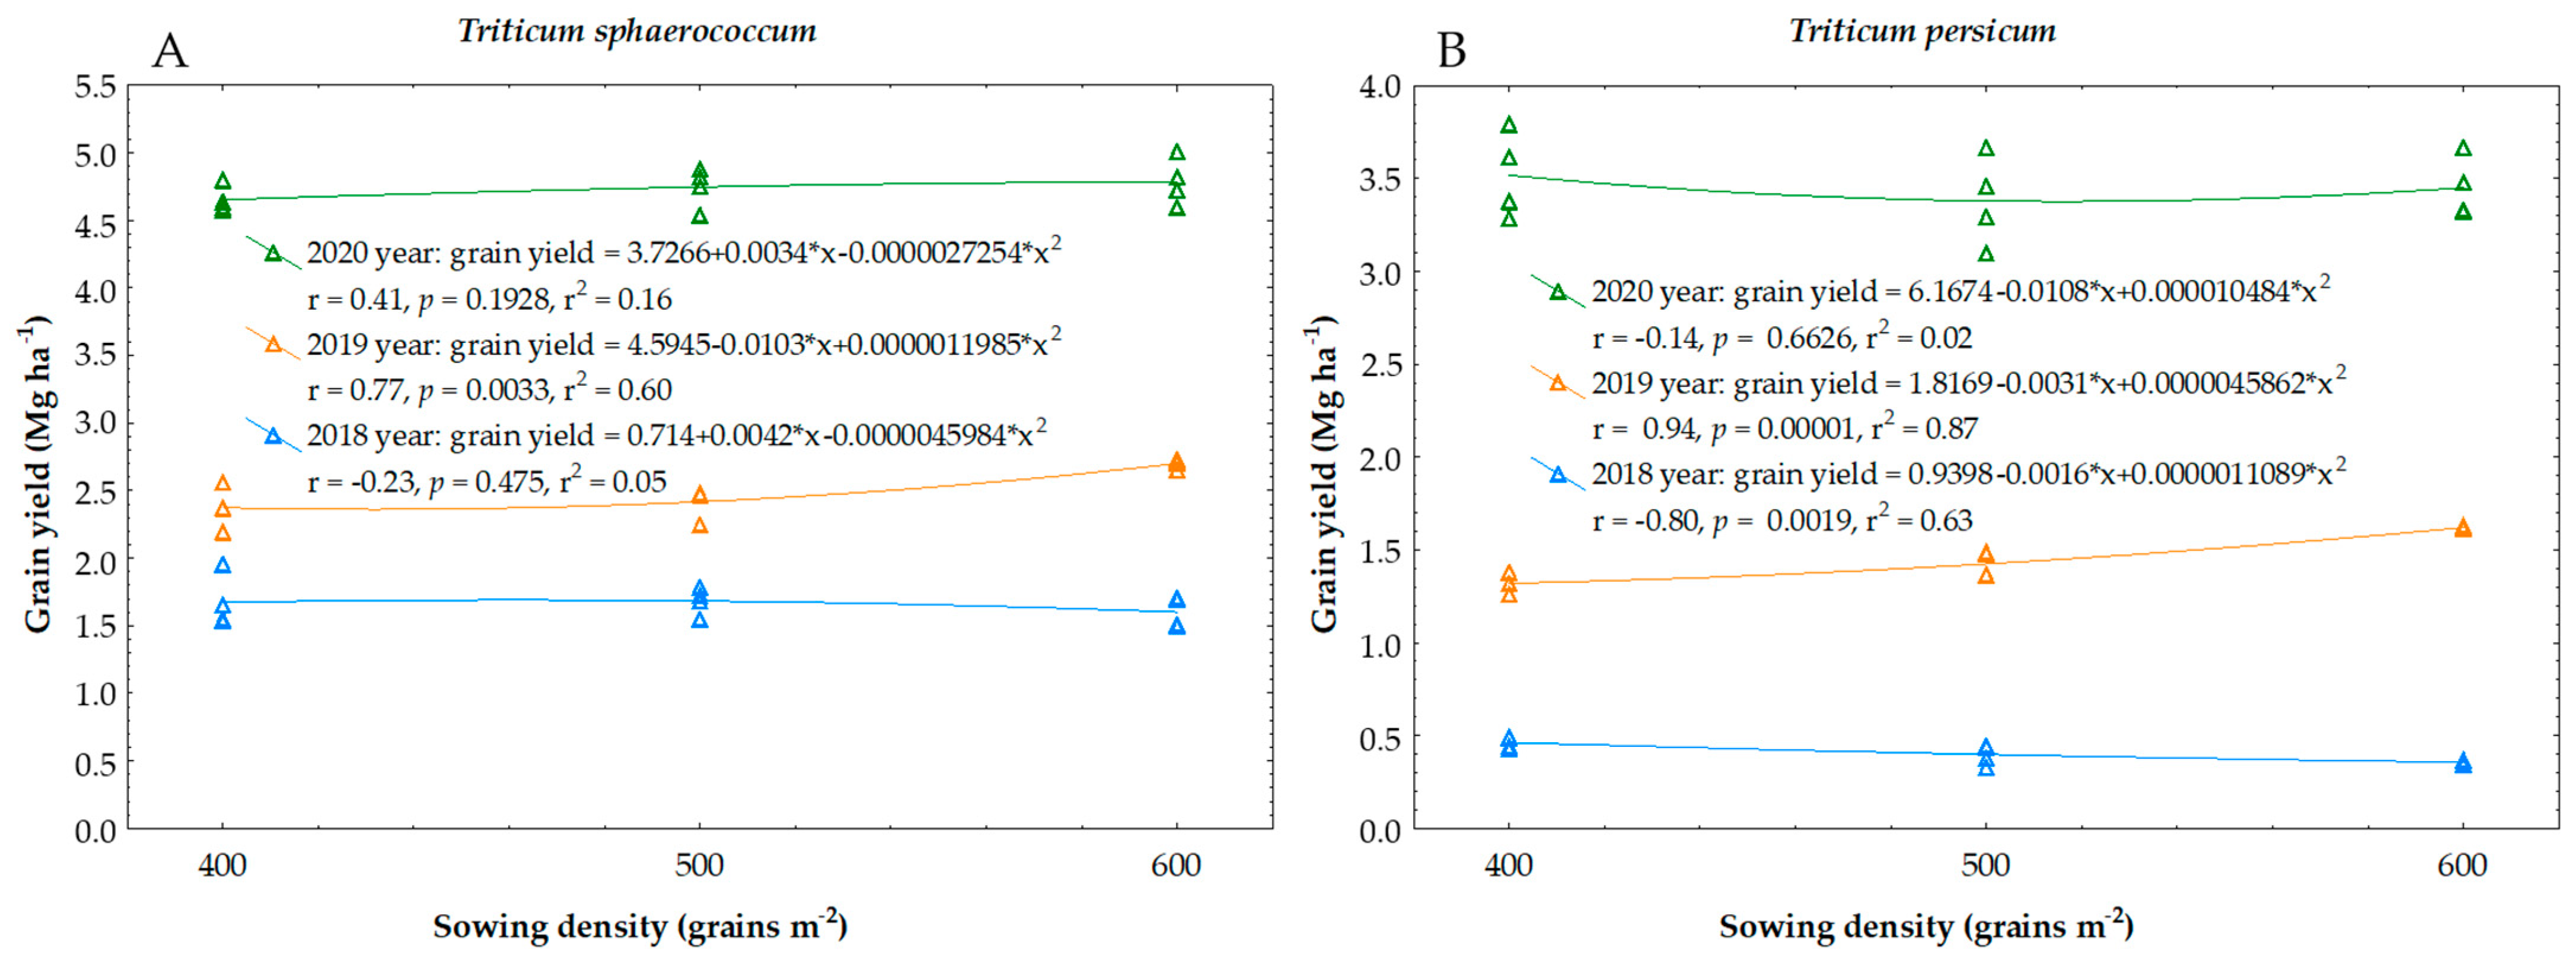
3.1. Yield and Biometric Features of Triticum sphaerococcum

The grain yield of Indian dwarf wheat varied over the years of the research and ranged from 1.60 to 4.79 Mg ha−1 (Table 3). The least favorable year for the growth and development of wheat was 2018, where low rainfall in May and June resulted in a strong reduction of the yield (Table 2). The most favorable, in turn, was 2020, where heavy rainfall in May and June was beneficial for the yield. In 2019, there was heavy rainfall only in May. Under these conditions, the grain yield was average (2.50 Mg ha−1). A significant effect of the sowing density on the grain yield of Indian dwarf wheat was demonstrated only in 2019. Increasing the sowing density from 400 or 500 pcs. m−2 to 600 resulted in a significant increase in the yield (Table 3, Figure 1A). There was no significant effect of sowing density on the number of grains per spike in any of the study years. In contrast, 1000-grain weight in 2019 was higher at the sowing density of 400 pcs. m−2 compared to the size of this parameter at the sowing density of 500 pcs. m−2. Indian dwarf wheat developed the lowest straw weight in 2018 and the highest in 2020. The straw weight was higher at the sowing density of 600 pcs. m−2 compared to the straw weight at other sowing densities only in 2019. The variation coefficients of the grain and straw yield and the number of grains per spike of Indian dwarf wheat were highest in 2018.
In 2018, Indian dwarf wheat developed the least generative tillers and the most vegetative tillers per plant (Table 4). In this unfavorable year for plant growth and development, the number of generative tillers per plant was higher at lower sowing densities (400 and 500 pcs. m−2). Only in 2019, at a sowing density of 600 pcs. m−2, the number of vegetative tillers per plant was lower compared to the number of such tillers at the sowing density of 400 pcs. m−2. Moreover, in 2019, the number of generative tillers per m2 and the number of total generative tillers were higher at the sowing density of 600 pcs. m−2 compared to that recorded in the sowing density of 400 pcs. M−2. In 2019, the number of sterile generative tillers per m−2 and their share in total generative tillers was the highest. Among the analyzed biometric features of Indian dwarf wheat, the number of sterile tillers per m2 was characterized by the highest variation coefficient.

3.2. Yield and Biometric Features of Triticum persicum

The highest grain yield of Persian wheat was obtained in 2020 (3.45 Mg ha−1) (Table 5). It was 2.4 times higher than the grain yield in 2019. In 2018, the most unfavorable for plant growth, the average grain yield of Persian wheat was only 0.41 Mg ha−1. In 2018, the grain yield was higher at the sowing density of 400 pcs. M−2 compared to that obtained in the density of 600 pcs. M−2. In contrast, in 2019, the highest grain yield was obtained at a density of 600 pcs. M−2, the yield was significantly lower at the sowing density of 500 pcs. M−2 and the lowest at a sowing density of 400 pcs. M−2 (Table 5, Figure 1B). The number of grains per spike was the highest in 2020 and the lowest in 2018. In 2019, increasing the sowing density from 500 to 600 pcs. M−2 had a positive effect on the number of grains per spike of Persian wheat. The Persian wheat grain obtained in 2018 had the highest 1000-grain weight. There was no significant effect of Persian wheat sowing density on 1000-grain weight or straw weight found in any of the study years.
In 2018, Persian wheat developed the least generative tillers and the most vegetative tillers per plant (Table 6). In the same year, the number of sterile generative tillers per m2 was higher at the sowing density of 600 pcs. m−2 compared with the number of such tillers at the sowing density of 400 pcs. m−2. In 2019, it was shown that the number of generative tillers per plant, as well as the number of such tillers per m2, was the highest at the highest sowing density of 600 pcs. m−2. The coefficients of variation of the grain yield and most of the analyzed biometric features were higher in 2018 compared to 2019 and 2020. Only the coefficients of variation of the number of vegetative tillers per plant and sterile generative tillers per m were the highest in 2020.

3.3. Occurrence of Diseases

On Indian dwarf wheat, the severity of powdery mildew varied over the years of the study and observation dates (Table 7). On the first assessment date, most symptoms of the disease on the lower leaves (L3 and L4) were found in 2019 (45.58–56.67% of the area of assessed leaves with symptoms of the disease), where the high total rainfall in May was conducive to the development of this disease (Table 2). However, the least were found in 2018 (1.0–1.75% of the leaf area), where rainfall in May was the lowest. On the second assessment date, the severity of powdery mildew symptoms on the flag leaf (L1) was small and was observed only in 2019 and 2020. The occurrence of powdery mildew did not depend on the sowing density. The large amount of rainfall in May, during the period of intensive growth and development of plants, limited the occurrence of roots and stem base diseases. Hence, the fewest symptoms of root rot were observed in 2019 and the most in 2018 (Table 7). The severity of these disease symptoms, with the exception of 2019, significantly depended on the sowing density. In the year with the greatest number of symptoms of root rot (2018), the severity of the disease increased with an increase in sowing density. In 2020, the lowest number of disease symptoms was recorded at the sowing density of 500 pcs. m−2, while at the sowing densities of 400 and 600 pcs. m−2 there was a significant increase in infection. Relatively few symptoms of Fusarium foot rot were recorded on Indian dwarf wheat, and in 2019 they were observed only sporadically. Only in 2020, a significant effect of the sowing density on the severity of the symptoms of Fusarium foot rot was demonstrated. Increasing the sowing density of Indian dwarf wheat from 400 or 500 pcs. m−2 to 600 pcs. m−2 resulted in a significant increase in the infestation of the stem base by fungi of the genus Fusarium.
Many symptoms of powdery mildew were observed on Persian wheat, especially before the fungicide was applied. Their intensity depended on the year of the study, the observation date and the sowing density (Table 8). At the first assessment date, on average, the greatest number of disease symptoms caused by B. graminis was found in 2019 (34.92–58.75%), which was characterized by the highest total rainfall in May. There were slightly fewer of them in 2020 (41.26–49.42%), and clearly the fewest in 2018 (2.75–7.50%). In all years of observation, the most symptoms of powdery mildew were found at the highest sowing density (600 pcs. m−2). In 2019, many symptoms of the disease were also found at the sowing density of 500 pcs. m−2. At the second assessment date, the severity of powdery mildew symptoms on Persian wheat plants was low. It was observed only in 2019 and 2020 and was not dependent on the sowing density. The large amount of rainfall in May 2019, during the period of intensive plant growth and development, limited the occurrence of symptoms of foot and root rot diseases on Persian wheat plants. Hence, the fewest symptoms of Fusarium foot rot were found in 2019, when they were observed only occasionally, and the most were observed in 2018. The incidence of this disease significantly depended on the sowing density. In 2019, the most symptoms of Fusarium foot rot were observed at the sowing density of 500 pcs. m−2, and in 2020, at the sowing density of 400 pcs. m−2. In general, the highest sowing density was not conducive to the occurrence of this disease. Furthermore, the symptoms of root rot were least observed in 2019 and the most in 2018, when the disease index value was high and ranged from 50.25 to 63.25% (Table 7). Despite such a high intensity of disease symptoms, there was no significant effect of sowing density on the severity of symptoms of root rot.

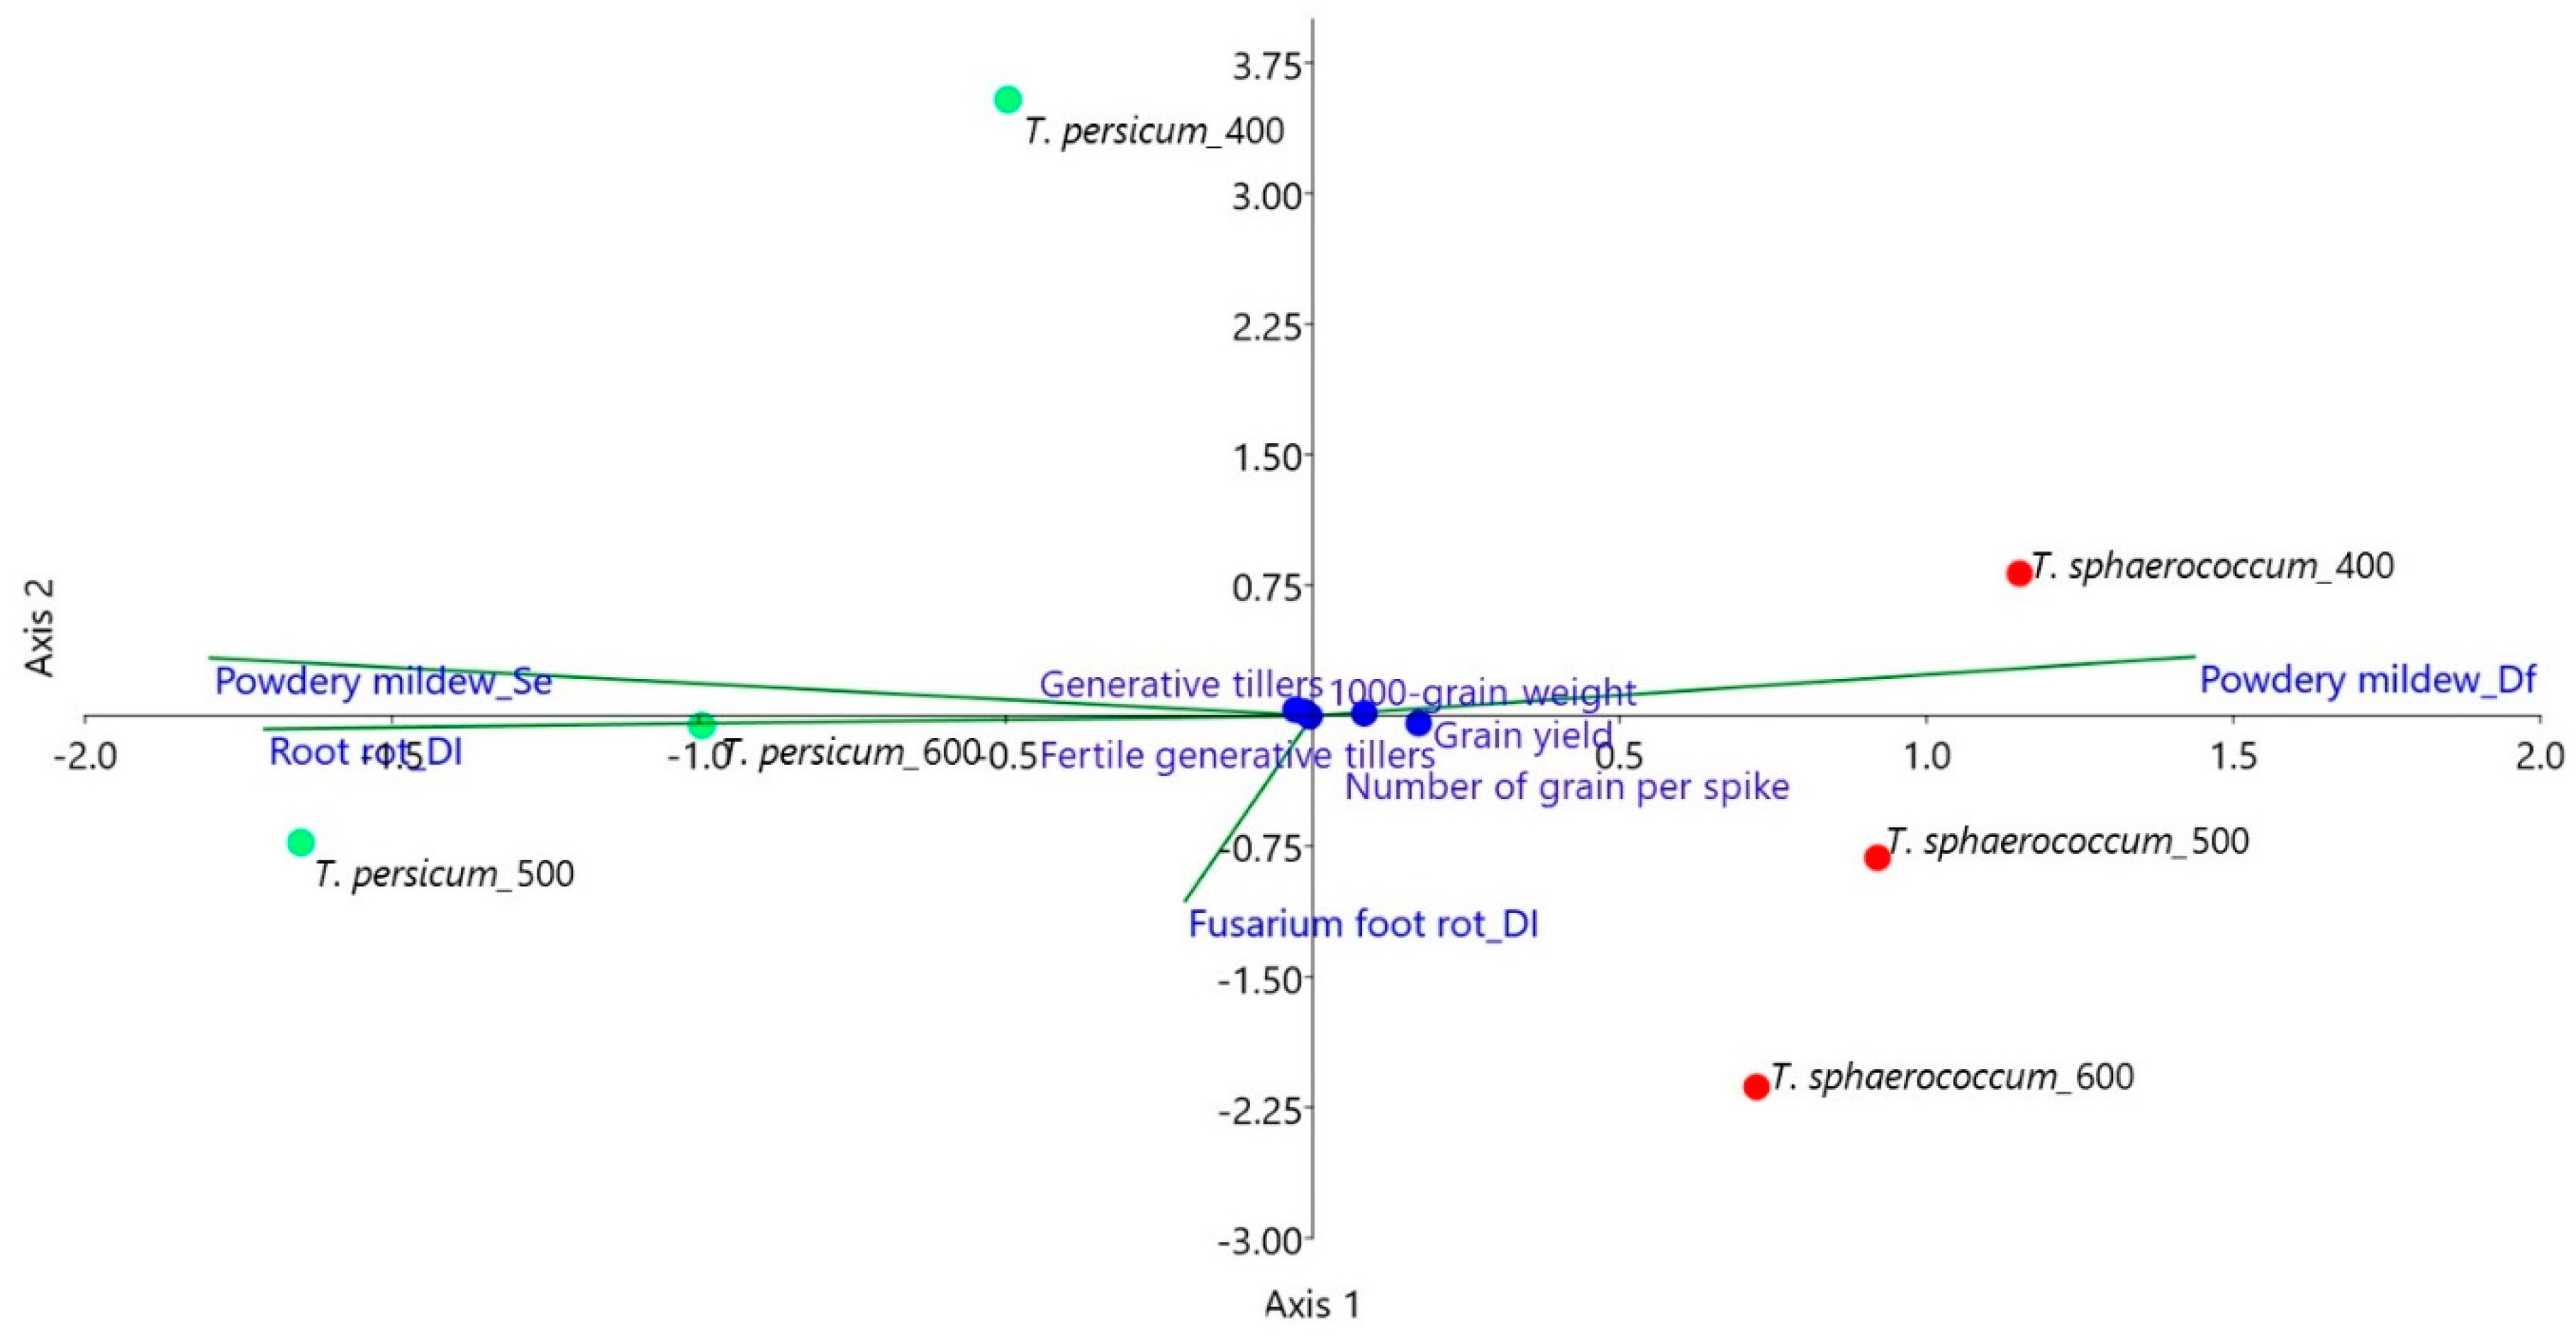
3.4. Variable Dependency Analysis

Among the grain yield structure components of Indian dwarf wheat and Persian wheat, biometric features such as the number of grains per spike and the number of fertile generative tillers per m2 were significantly positively correlated with the grain yield (Table 9). These yield components and the grain yield were significantly positively correlated with the Sielianinov’s hydrothermal coefficient in the first ten days of May, and with the values of this coefficient in June (Tables S1 and S2). The number of sterile generative tillers per m2 was negatively correlated with the grain yield and Sielianinov’s hydrothermal coefficient in June. Both studied wheat species showed a significant positive correlation between grain and straw yield. Canonical correspondence analysis (CCA) of variables from individual research years, including grain and straw yield, number of grains per spike, 1000-grain weight, number of generative tillers per plant, fertile generative tillers per m2 and the incidence of diseases (powdery mildew, root rot and Fusarium foot rot), clearly indicates a very strong relationship with the research year (weather conditions in the growing season) and, to a lesser extent, with the sowing density (Figure 2). Biometric features, yield of wheat and incidence of diseases are distributed horizontally, according to vectors: (longer) to the left—Year and (shorter) to the right—Sowing densities (the vectors—green lines—almost coincide with the line of the first axis). Axis 1 explains the system at 100% and is statistically significant, while the second axis is statistically insignificant. According to the conducted analysis, the significance of weather conditions (years of research) on shaping the analyzed features of the studied wheat species was highest in 2019, mainly at the lowest sowing density (400 pcs. m−2). A separate group is formed by 2018, where the effect of sowing density on the analyzed features is clearly visible, while the species is also important (Triticum sphaerococcum and T. persicum are grouped separately). In 2020, T. sphaerococcum also forms a separate group.
Canonical correspondence analysis of variables, on the average of three years of research, indicates that powdery mildew in flag leaf development significantly affects the formation of biometric features, more in the case of T. sphaerococcum, especially at the sowing densities of 400 and 500 pcs. m−2 (Figure 3). Powdery mildew in steam elongation, in turn, as well as root rot and Fusarium foot rot affect the biometric features of T. persicum to a greater extent, especially at the densities of 600 and 500 pcs. m−2. Axis 1 of the CCA analysis statistically significantly explains the system to a degree over 90%, while the second axis is statistically insignificant.

4. Discussion

4.1. Morphological and Agronomic Traits

Canonical correspondence analysis of grain yield and agronomical traits (number of grains per spike, 1000-grain weight, number of generative tillers per plant and fertile generative tillers per m2) of Indian dwarf wheat and Persian wheat indicates a significant relationship with the year of the study (weather conditions in the growing season) and, to a lesser extent, with the sowing density. Auškalnienė and Auškalnis [10] indicate the greater importance of weather conditions compared to the sowing density of common wheat. Tokatlidis [38] concludes that the optimal wheat population is primarily affected by the water regime, while sowing date, heat, terminal drought, frost and type of soil are also indicators.
The least favorable year for the growth and yield of Indian dwarf wheat and Persian wheat was 2018, with low rainfall at the end of April, in May and June (from the stem elongation stage to the beginning of the grain development stage). Under severe water deficit, both wheat species exhibited reduced fertile generative tillers per m2, number of grains per spike, and the number of generative tillers per plant, morphological traits significantly correlated with the grain yield. Moreover, the water deficit and high air temperatures in May limited tillering, which resulted in a reduction in the number of generative tillers per plant.
According to Zhang et al. [23], drought decreases wheat grain yield the most during the complete growth cycle, which is achieved from a combination of decreases during the tillering stage (−27.4%), the stem elongation stage (−21.4%), the heading stage (−16.8%), the flowering stage (−17.7%), and the development of grain stage (−16.3%). In the study of Triticum aestivum it was proven that water stress affects morpho-physiological traits such as plant height, number of tillers per plant, number of spikelets per spike, number of grains per spike, 1000-grain weight, flag leaf area, relative water content, and chlorophyll content (d). Moreover, drought or heat stress enhances enzymatic antioxidant activity (catalase, dismutase, peroxidase), and proline content. These chemicals help to stabilize membranes, sub-cellular structures and cellular redox potential by destroying the free radicals [21]. In a study of the ancient wheat Triticum boeoticum, some proteins (MICP, in the group of lipid metabolism proteins) were found [24]. These proteins may play an important role in the metabolic pathways of wheat and its drought tolerance [24].
In our study, the number of generative tillers per plant of Indian dwarf wheat in 2018 was significantly higher at lower sowing densities (400 and 500 pcs. M−2). Similarly, Silva et al. [12], in the study of the response of common wheat cultivars to sowing density (75, 150, 225, 300, 375 pcs. m−2), showed an increase in the number of generative tillers per plant along with a decrease in sowing density. In the study by Beavers at al. [16] the number of spikes per plant was significantly larger at a sowing density of 330 pcs. m−2 compared to the number found at densities of 412 and 495, and the smallest at a sowing density of 660 pcs. m−2. In 2018, the grain yield of Persian wheat was higher at the lowest sowing density (400 pcs. m−2) compared to that obtained in the sowing density of 600 pcs. m−2. At the lowest sowing density, the number of sterile generative tillers per m−2 was significantly lower and the number of fertile generative tillers per m2 was slightly higher, compared to the number of such tillers at a sowing density of 600 pcs. m−2. It is worth noting that, at the lowest sowing density, the share of sterile generative tillers in the total of generative tillers was lower (12%) compared to the share of such tillers at sowing densities of 500 and 600 pcs. m−2 (20 and 21%, respectively). The reason for the increase in the number of sterile spikes at higher sowing densities was the increased competition for water under conditions of heavy shortage, which started in May and deepened in June. The study by Pinheiro et al. [39] clearly shows an increase in the number of non-productive tillers as the sowing density of wheat increases. Marinho et al. [40] prove that competition between plants and tillers can increase the incidence of infertile tillers, especially at high sowing densities.
The year 2019 was characterized by a moderate water deficit. Heavy rainfall occurred in the second half of May (at the stem elongation stage), while a rainfall deficit and high air temperatures were recorded in June (from the booting to the beginning of the grain development stage). According to Sattar et al. [21], heat stress along with low water availability at the reproductive stage are major contributing factors towards lower wheat production. In 2019, increasing the sowing density from 400 or 500 pcs. m−2 to 600 pcs. m−2 resulted in a significant increase in the grain yield of Indian dwarf wheat. Similarly, in Persian wheat, the highest grain yield was obtained at the highest sowing density (600 pcs. m−2), while it was significantly lower at a density of 500 pcs. m−2 and was lowest at the density of 400 pcs. m−2. The increase in grain yield at the highest sowing density was mostly due to the increased number of fertile generative tillers per m2, the most important yield component. Moreover, there was an increase in generative tillers per plant in Persian wheat and a reduction in number of vegetative tillers per plant in Indian dwarf wheat. In the study by Hussain et al. [13] among the yield components, only the number of generative tillers per m−2 increased in proportion to the increase in the grain yield at higher seed rates. According to Wu et al. [41], high sowing density as a purposeful agricultural practice increases yields, reduces weed infestation and increases sustainability by increasing biomass and soil cover during the growing season of the plants, which reduces nutrient loss and erosion. In 2019, there was a significant increase in the straw weight of Indian dwarf wheat at the sowing density of 600 pcs. m−2. This weight consists mainly of generative tillers, hence the significant correlation of the straw yield with the grain yield. Furthermore, we have noted that the 1000-grain weight was higher at the lowest sowing density of 400 pcs. m−2 compared to the size of this parameter at a sowing density of 500 pcs. M−2. Poutala et al. [9] showed a reduction in the 1000-grain weight of common wheat due to an increase in sowing density. In the study by Tahir et al. [8], a higher grain weight in common wheat was found at seed rates of 100 kg ha−1 and lower at 175 kg ha−1.
In Persian wheat grown in 2019, despite the increase in the number of fertile generative tillers per m2 at the sowing density of 600 pcs. m−2, the number of grains per spike in this treatment was higher compared to wheat in a sowing density of 500 pcs. m−2. Opposite relationships are presented by Tahir et al. [8], who showed a reduction in the number of grains per spike as a result of increasing the density of common wheat sowing from 125 to 175 kg ha−1. The different response of the compared wheat species could result from a different structure of the spike. Common wheat in the studies by Tahir et al. [8] had a number of spikelets per spike twice as high as Persian wheat in 2019, which was significantly influenced by drought stress during flowering, heading and the beginning of grain development stages.
In the present study, the most favorable year for the growth of Indian dwarf wheat and Persian wheat was 2020, where heavy rainfalls in May and June favored the yield. The distribution of rainfall favored the development of numerous fertile generative tillers per m2 and grains per spike—yield components significantly correlated with the grain yield. It is noteworthy that under these weather conditions, almost all generative tillers of Indian dwarf wheat and Persian wheat remained fertile (the shares of fertile generative tillers as a percentage of total generative tillers per m2 were 99% and 98%, respectively). In that year, no significant effect of the sowing density on any of yield components or the grain yield of both studied wheat species was demonstrated. The obtained results confirm the conclusion of Fisher et al. [11] on the lack of response of common wheat grain yield to the sowing density under favorable weather conditions.
Our study did not show a significant effect of sowing density on the number of grains per spike of Indian dwarf wheat in any of the study years. However, a correlation was observed between the number of generative tillers per m2 and the number of grains per spike. If, in a given year, the number of generative tillers per m2 was low, the number of grains per spike was also low. Therefore, there was no compensation of the yield components. The opposite conclusions were formulated by Lloveras et al. [42] who claimed that common wheat can compensate for low populations by modifying the number of grains per spike. However, in our research, the number of grains per spike in 2018 and 2019 was mostly limited by drought from the booting stage to the beginning of the grain development stage, which made it impossible to compensate for the limited density of generative shoots in the canopy.

4.2. Occurrence of Diseases

The analyzed Indian dwarf wheat and Persian wheat plants showed a similar intensity of disease symptoms as in previous studies on those wheat species conducted in organic farming crops, in which powdery mildew, Fusarium foot rot and root rot were also mainly observed [31]. On the first observation date, a high intensity of powdery mildew symptoms was observed on the assessed lower leaves of both wheat species, and its incidence was significantly correlated with the total rainfall. According to Te Beest et al. [43], the disease is favored by warm and humid conditions, but even under favorable conditions for the development of the disease, appropriate chemical protection can significantly reduce the disease’s severity. Hence, on the first observation date, the fewest symptoms were observed in 2018, with low rainfall at the end of April and in May (Table 2). The lesser severity of powdery mildew symptoms on the second observation date, found on the analyzed flag leaves of wheat, was influenced by the use of the Tango Star fungicide at the fully developed flag leaf stage. According to Semaškienė et al. [44], a mixture of fenpropimorph and epoxiconazole, active substances contained in this preparation, are highly effective in limiting the development of powdery mildew on spring wheat.
In the present authors’ research, the occurrence of powdery mildew on Persian wheat also depended on the sowing density, which was observed only at the stem elongation stage. Generally, with increasing sowing density, the severity of the symptoms of this disease increased. This is consistent with the observations made on the form of winter common wheat, as an increase in plant density strongly contributed to the increased occurrence of powdery mildew symptoms [34,45]. It is known that dense sowing brings the leaves closer to each other, which facilitates the spread of pathogen spores. In addition, the sowing density may also indirectly affect the occurrence of pathogens and severity of diseases by changing the microclimate inside the canopy. In dense crops, the temperature tends to be more uniform, the air humidity is higher, and water remains on the leaves for longer, favoring infection by B. graminis [32,35]. Moreover, the distance between the infected and healthy tissues is also of great importance. The closer the leaves are to each other, the easier it is for the fungus spores to splash, and thus for pathogens to spread through the canopy [33]. On the other hand, Finckh et al. [46] found that, in the case of susceptible wheat cultivars, the severity of powdery mildew symptoms increased with the decrease in sowing density. They did not observe such an effect for resistant wheat genotypes. Such relationships were also not observed in previous studies conducted in organic crops, where in both Persian wheat and Indian dwarf wheat the sowing density had no effect on the severity of powdery mildew [31].
In the present authors’ research, the severity of the symptoms of foot and root rot diseases significantly depended on the sowing density. On Indian dwarf wheat, the most symptoms of root rot and Fusarium foot rot were found in the highest sowing density of 600 pcs. m−2. The sowing density of Persian wheat, however, had an ambiguous effect on the occurrence of Fusarium foot rot, and usually the fewest disease symptoms were found at the highest sowing density. Moreover, in this wheat, there was no significant effect of sowing density on the severity of root rot disease. Other authors, studying the winter forms of common wheat, also observed an increase in the severity of the symptoms of diseases observed on the roots and stem base at a higher sowing density [47,48], which was especially noticeable at the early development stages of the analyzed plants. They found that in the case of foot and root rot diseases, an increased plant density means a shorter distance between the host plant and the inoculum source, which increases the probability of the pathogen reaching the adjacent plant through the spores or mycelium and infecting it. In previous studies, when Indian dwarf wheat or Persian wheat were grown on organic farms, no significant influence of their sowing density on the severity of foot and root rot diseases, including the severity of Fusarium foot rot and root rot, was found [31]. In addition, Eken et al. [49] found that there was no significant effect of the sowing density on the severity of root and crown rot caused by Fusarium fungi in common wheat. In organic crops, due to the lower intensity of cultivation, the growth and development of plants is less intense, the canopy architecture is different, and thus the influence of factors on the development of pathogens is different as well [26,32].

5. Conclusions

Our research presents, for the first time, the characteristics of morphological and agronomic features and the intensity of disease symptoms in Indian dwarf wheat and Persian ancient wheat species depending on the sowing density under cultivation using low-input technology. The three-year field experiments demonstrated that the grain yield and occurrence of diseases depended primarily on the weather conditions in the growing season and to a lesser extent on sowing density. Increasing the sowing density to 600 pcs. m−2 increased the number of fertile generative tillers per m−2 and the grain yield in the year in which moderate drought stress occurred during the growing season. However, the increased sowing density also contributed to greater disease pressure. In low-input integrated cultivation, Indian dwarf wheat and Persian wheat sowing should be performed at a sowing density of 600 pcs. m−2, in an agroclimatic zone with moderate droughts during the growing season. Further research is needed on the physiological and biochemical responses of ancient species of cereals such as Indian dwarf wheat and Persian wheat on sowing density under various agroclimatic conditions.

Supplementary Materials

The following are available online at https://www.mdpi.com/article/10.3390/agriculture12020205/s1, Table S1: Significant correlation coefficients (p ≤ 0.05) between Sielianinov’s hydrothermal coefficient and grain yield, and biometric features of Triticum sphaerococcum, Table S2: Significant correlation coefficients (p ≤ 0.05) between Sielianinov’s hydrothermal coefficient and grain yield, and biometric features of Triticum persicum.

Author Contributions

Conceptualization, M.S.; methodology, M.S., G.L. and R.G.; software, R.G.; validation, M.S., G.L. and R.G.; formal analysis, M.S.; investigation, M.S. and G.L.; resources, M.S.; data curation, M.S. and G.L.; writing—original draft preparation, M.S., G.L., R.G. and R.N.; writing—review and editing, M.S., G.L., R.G. and R.N.; visualization, M.S. and R.G.; supervision, M.S.; project administration, M.S.; funding acquisition, M.S. All authors have read and agreed to the published version of the manuscript.

Funding

“European Agricultural Fund for Rural Development: Europe investing in rural areas”. The publication co-financed from the European Union funds under the COOPERATION of the Rural Development Programme for 2014–2020. The Managing Authority of the Rural Development Programme for 2014–2020—the Minister of Agriculture and Rural Development.

Institutional Review Board Statement

Not applicable.

Informed Consent Statement

Not applicable.

Data Availability Statement

Data sharing not applicable.

Conflicts of Interest

The authors declare no conflict of interest.

References

  1. European Commission. Available online: https://ec.europa.eu/ (accessed on 1 September 2021).
  2. Suchowilska, E.; Wiwart, M.; Kandler, W.; Krska, R.A. Comparison of macro- and microelement concentrations in the whole grain of four Triticum species. Plant Soil Environ. 2012, 58, 141–147. [Google Scholar] [CrossRef] [Green Version]
  3. Skrajda-Brdak, M.; Konopka, I.; Tańska, M.; Szczepanek, M.; Sadowski, S.; Rychcik, B. Low molecular phytochemicals of Indian dwarf (Triticum sphaerococcum Percival) and Persian wheat (T. carthlicum Nevski) grain. J. Cereal Sci. 2020, 91, 102887. [Google Scholar] [CrossRef]
  4. Josekutty, P.C. Defining the Genetic and Physiological Basis of Triticum sphaerococcum Perc. Master’s Thesis, University of Canterbury, Christchurch, New Zealand, 2008. [Google Scholar]
  5. Mori, N.; Ohta, S.; Chiba, H.; Takagi, T.; Niimi, Y.; Shinde, V.; Kajale, M.D.; Osada, T. Rediscovery of Indian dwarf wheat (Triticum aestivum L. ssp. sphaerococcum (Perc.) MK.) an ancient crop of the Indian subcontinent. Genet. Resour. Crop. Evol. 2013, 60, 1771–1775. [Google Scholar] [CrossRef]
  6. Matsuoka, Y. Evolution of polyploid Triticum wheats under cultivation: The role of domestication, natural hybridization and allopolyploid speciation in their diversification. Plant Cell Physiol. 2011, 52, 750–764. [Google Scholar] [CrossRef] [Green Version]
  7. Mosulishvili, M.; Bedoshvili, D.; Maisaia, I. A consolidated list of Triticum species and varieties of Georgia to promote repatriation of local diversity from foreign genebanks. Ann. Agrar. Sci. 2017, 5, 61–70. [Google Scholar] [CrossRef]
  8. Tahir, S.A.; Khaliq, A.T.; Cheema, M.J.M. Evaluating the impact of seed rate and sowing dates on wheat productivity in semi-arid environment. Int. Agric. Biol. 2019, 22, 57–64. [Google Scholar] [CrossRef]
  9. Poutala, R.; Korva, J.; Varis, E. Spring wheat cultivar performance in ecological and conventional cropping systems. J. Sustain. Agric. 1993, 3, 63–84. [Google Scholar] [CrossRef]
  10. Auškalnienė, O.; Auškalnis, A. The influence of spring wheat plant density on weed suppression and grain yield. Zemdirbyste 2008, 95, 5–12. [Google Scholar]
  11. Fischer, R.A.; Moreno-Ramos, O.H.; Monasterio-Ortiz, I.; Sayre, K.D. Yield response to plant density, row spacing and raised beds in low latitude spring wheat with ample soil resources. Field Crops Res. 2019, 22, 95–105. [Google Scholar] [CrossRef]
  12. Silva, F.L.; Carvalho, I.R.; Barbosa, M.H.; Conte, G.G.; Hutra, D.; Moura, N.B.; Souza, V.Q. Sowing density and clipping management: Effects on the architecture and yield of dual-purpose wheat. Biosci. J. 2020, 36, 2060–2067. [Google Scholar]
  13. Hussain, I.; Khan, E.A.; Hassan, G.; Gul, J.; Ozturk, M.; Alharby, H.; Hakeem, K.R.; Alamri, S. Integration of high seeding densities and criss cross row planting pattern suppresses weeds and increases grain yield of spring wheat. J. Environ. Biol. 2017, 38, 1139–1145. [Google Scholar] [CrossRef]
  14. Olsen, J.; Kristensen, L.; Weiner, J. Influence of sowing density and spatial pattern of spring wheat (Triticum aestivum) on the suppression of different weed species. Weed Biol. Manag. 2006, 6, 165–173. [Google Scholar] [CrossRef]
  15. Cardoso, C.P.; Bazzo, J.H.; Marinho, J.L.; Zucareli, C. Effect of seed vigor and sowing densities on the yield and physiological potential of wheat seeds. J. Seed Sci. 2021, 43, 1–11. [Google Scholar] [CrossRef]
  16. Beavers, R.L.; Hammermeister, A.M.; Frick, B.; Astatkie, T.; Martin, R.C. Spring wheat yield response to variable seeding rates in organic farming systems at different fertility regimes. Can. J. Plant. Sci. 2008, 88, 43–52. [Google Scholar] [CrossRef]
  17. Turner, N.C.; Prasertsak, P.; Setter, T.L. Plant spacing, density, and yield of wheat subjected to postanthesis water deficits. Crop Sci. 1994, 34, 741–748. [Google Scholar] [CrossRef]
  18. Jeyasri, R.; Muthuramalingam, P.; Satish, L.; Pandian, S.K.; Chen, J.-T.; Ahmar, S.; Wang, X.; Mora-Poblete, F.; Ramesh, M. An overview of abiotic stress in cereal crops: Negative impacts, regulation, biotechnology and integrated omics. Plants 2021, 10, 1472. [Google Scholar] [CrossRef]
  19. Altaf, A.; Zhu, X.; Zhu, M.; Quan, M.; Irshad, S.; Xu, D.; Aleem, M.; Zhang, X.; Gull, S.; Li, F.; et al. Effects of environmental stresses (heat, salt, waterlogging) on grain yield and associated traits of wheat under application of sulfur-coated urea. Agronomy 2021, 11, 2340. [Google Scholar] [CrossRef]
  20. Prasad, P.V.; Pisipati, S.; Ristic, Z.; Bukovnik, U.; Fritz, A. Impact of nighttime temperature on physiology and growth of spring wheat. Crop. Sci. 2008, 48, 2372–2380. [Google Scholar] [CrossRef]
  21. Sattar, A.; Sher, A.; Ijaz, M.; Ul-Allah, S.; Rizwan, M.S.; Hussain, M.; Jabran, K.; Cheem, M.A. Terminal drought and heat stress alter physiological and biochemical attributes in flag leaf of bread wheat. PLoS ONE 2020, 15, e0232974. [Google Scholar] [CrossRef]
  22. Panhwar, N.A.; Mierzwa-Hersztek, M.; Baloch, G.M.; Soomro, Z.A.; Sial, M.A.; Demiraj, E.; Panhwar, S.A.; Afzal, A.; Lahori, A.H. Water stress affects the some morpho-physiological traits of twenty wheat (Triticum aestivum L.) genotypes under field condition. Sustainability 2021, 13, 13736. [Google Scholar] [CrossRef]
  23. Zhang, J.; Zhang, S.; Cheng, M.; Jiang, H.; Zhang, X.; Peng, C.; Lu, X.; Zhang, M.; Jin, J. Effect of drought on agronomic traits of rice and wheat: A meta-analysis. Int. J. Environ. Res. Public Health 2018, 15, 839. [Google Scholar] [CrossRef] [Green Version]
  24. Moosavi, S.S.; Abdi, F.; Abdollahi, M.R.; Enferadi, S.T.; Maleki, M. Phenological, morpho-physiological and proteomic responses of Triticum boeoticum to drought stress. Plant Physiol. Biochem. 2020, 156, 95–104. [Google Scholar] [CrossRef]
  25. Khanna-Chopra, R.; Viswanathan, C. Evaluation of heat stress tolerance in irrigated environment of T. aestivum and related species. I. Stability in yield and yield components. Euphytica 1999, 106, 169–180. [Google Scholar] [CrossRef]
  26. Brandsæter, L.O.; Mangerud, K.; Andersson, L.; Børresen, T.; Brodal, G.; Melander, B. Influence of mechanical weeding and fertilisation on perennial weeds, fungal diseases, soil structure and crop yield in organic spring cereals. Acta Agric Scand 2020, B, 1–15. [Google Scholar] [CrossRef]
  27. Simón, M.R.; Börner, A.; Struik, P.C. Editorial: Fungal wheat diseases: Etiology, breeding, and integrated management. Front. Plant Sci. 2021, 12, 671060. [Google Scholar] [CrossRef]
  28. Turner, J.A.; Chantry, T.; Taylor, M.C.; Kennedy, M.C. Changes in agronomic practices and incidence and severity of diseases in winter wheat in England and Wales between 1999 and 2019. Plant Pathol. 2021, 70, 1759–1778. [Google Scholar] [CrossRef]
  29. Figueroa, M.; Hammond-Kosack, K.E.; Solomon, P.S. A review of wheat diseases—A field perspective. Mol. Plant Pathol. 2018, 19, 1523–1536. [Google Scholar] [CrossRef]
  30. Khan, M.S.; Ullah, M.; Ahmad, W.; Shah, S.U.A. The use of modern technologies to combat stripe rust in wheat. Rom. Biotech. Lett. 2020, 25, 1281–1288. [Google Scholar] [CrossRef]
  31. Szczepanek, M.; Lemańczyk, G.; Lamparski, R.; Wilczewski, E.; Graczyk, R.; Nowak, R.; Prus, P. Ancient wheat species (Triticum sphaerococcum Perc. and T. persicum Vav.) in organic farming: Influence of sowing density on agronomic traits, pests and diseases occurrence, and weed infestation. Agriculture 2020, 10, 556. [Google Scholar] [CrossRef]
  32. Baccar, R.; Fournier, C.; Dornbusch, T.; Andrieu, B.; Gouache, D.; Robert, C. Modelling the effect of wheat canopy architecture as affected by sowing density on Septoria tritici epidemics using a coupled epidemic–virtual plant model. Ann. Bot. 2011, 108, 1179–1194. [Google Scholar] [CrossRef] [Green Version]
  33. Robert, C.; Garin, G.; Abichou, M.; Houlès, V.; Pradal, C.; Fournier, C. Plant architecture and foliar senescence impact the race between wheat growth and Zymoseptoria tritici epidemics. Ann. Bot. 2018, 121, 975–989. [Google Scholar] [CrossRef] [PubMed]
  34. Beres, B.L.; Turkington, T.K.; Kutcher, H.R.; Irvine, B.; Johnson, E.N.; O’Donovan, J.T.; Harker, K.N.; Holzapfel, C.B.; Mohr, R.; Peng, G.; et al. Winter wheat cropping system response to seed treatments, seed size, and sowing density. J. Agron. 2016, 108, 1101–1111. [Google Scholar] [CrossRef] [Green Version]
  35. Walters, D. Disease Control in Crops: Biological and Environmentally Friendly Approaches; John Wiley & Sons: Edinburgh, UK, 2009; pp. 1–226. [Google Scholar]
  36. Pradawne Ziarno. Available online: http://www.pradawneziarno.pl/ (accessed on 1 September 2021).
  37. McDonald, J.H. Handbook of Biological Statistics, 2nd ed.; Sparky House Publishing: Baltimore, MD, USA, 2009; pp. 1–319. [Google Scholar]
  38. Tokatlidis, I.S. Addressing the yield by density interaction is prerequisite to bridge the yield gap of rain-fed wheat. Ann. Appl. Biol. 2014, 65, 27–42. [Google Scholar] [CrossRef]
  39. Pinheiro, M.G.; Souza, C.A.; Fioreze, S.L.; Sangoi, L.; Carneiro, J.F.; Bisato, M.M. Cultivar, sowing density, or time of emission: What influences mortality and performance of wheat tillers the most? Rev. Ciênc. Agrovet. 2021, 20, 19–31. [Google Scholar] [CrossRef]
  40. Marinho, J.L.; Silva, S.R.; Nascimento-Souza, D.; Fonseca-Batista, I.C.; Bazzo-Bizzarri, J.H. Wheat yield and seed physiological quality affected by initial seed vigor, sowing density, and environmental conditions. Semin. Ciênc. Agrá. 2021, 42, 1595–1614. [Google Scholar] [CrossRef]
  41. Wu, Y.; Xi, N.; Weiner, J.; Zhang, D.Y. Differences in weed suppression between two modern and two old wheat cultivars at different sowing densities. Agronomy 2021, 11, 253. [Google Scholar] [CrossRef]
  42. Lloveras, J.; Manent, J.; Viudas, J.; Lopez, A.; Santiveri, P. Seeding rate influence on yield and yield components of irrigated winter wheat in a Mediterranean climate. Agron. J. 2004, 96, 1258–1265. [Google Scholar] [CrossRef]
  43. Te Beest, D.E.; Paveley, N.D.; Shaw, M.W.; Van Den Bosch, F. Disease–weather relationships for powdery mildew and yellow rust on winter wheat. Phytopathology 2008, 98, 609–617. [Google Scholar] [CrossRef] [Green Version]
  44. Semaškienė, R.; Tamošiūnas, K.; Dabkevičius, Z. Control of powdery mildew, Blumeria graminis (DC), in spring and winter wheat with decision support system based on assessments and weather data. Plant Prot. Sci. 2002, 38, 667–669. [Google Scholar]
  45. Lemańczyk, G.; Piekarczyk, M. Effect of fertilization, chemical crop protection and sowing density on health status of winter wheat grown in short-time monoculture on light soil. Prog. Plant Prot. 2013, 53, 487–493. [Google Scholar]
  46. Finckh, M.R.; Gacek, E.S.; Czembor, H.J.; Wolfe, M.S. Host frequency and density effects on powdery mildew and yield in mixtures of barley cultivars. Plant Pathol. 1999, 48, 807–816. [Google Scholar] [CrossRef]
  47. Colbach, N.; Lucas, P.; Meynard, J.M. Influence of crop management on take-all development and disease cycles on winter wheat. Phytopathology 1997, 7, 26–32. [Google Scholar] [CrossRef] [Green Version]
  48. Lemańczyk, G. Effects of farming system, chemical control, fertilizer and sowing density on sharp eyespot and Rhizoctonia spp. in winter wheat. J. Plant Prot. Res. 2012, 52, 381–396. [Google Scholar] [CrossRef]
  49. Eken, C.; Bulut, S.; Genc, T.; Öztürk, A. Effects of different fertilizer sources and sowing density on root and crown rot disease agents of organic wheat. Gaziosmanpașa Üniversitesi Ziraat Fakültesi Derg. 2014, 31, 12–19. [Google Scholar]
Figure 1. Relationships between sowing density and grain yield of Triticum sphaerococcum (A)and Triticum persicum (B).
Agriculture 12 00205 g001
Figure 2. Canonical correspondence analysis (CCA) for grain and straw yield, biometric features (number of grains per spike, 1000-grain weight, number of generative tillers per plant, number of fertile generative tillers per m2) and occurrence of diseases (powdery mildew at stem elongation Se and at fruit development Df, root rot and Fusarium foot rot) on Triticum sphaerococcum and T. persicum at different sowing densities. Variables from three consecutive study years (2018, 2019, 2020) were analyzed. Eigenvalues for axis 1 = 0.04 (100%), for axis 2 = <0.001 (<0.001%), significance of first axis: Monte Carlo-permutation test: (F-ratio = 6.30, p = 0.001).
Agriculture 12 00205 g002
Figure 3. Canonical correspondence analysis (CCA) for grain and straw yield, generative tiller number, and leaf and foot and root rot diseases of Triticum sphaerococcum and T. persicum at different sowing densities. Mean values of variables from three years of research were considered. Eigenvalues for axis 1 = 0.02 (94.41%), for axis 2 = 0.007 (3.71%), significance of first axis: Monte Carlo-permutation test: (F-ratio = 4.46, p = 0.031), significance of second axis: Monte Carlo-permutation test: (F-ratio = 0.94, p = 0.614).
Agriculture 12 00205 g003
Table 1. Results of soil analysis before sowing.
N-NO3N-NH4pH (KCl)PKMgC-org.
g kg−1 of Soilg kg−1 of Soil
0.00420.00447.00.1120.1530.05611.0
Table 2. Mean air temperature and precipitation in the growing seasons at experimental site.
YearDaysMarchAprilMayJuneJulyMarchAprilMayJuneJuly
Temperature °CPrecipitation mm
20181–103.59.214.819.818.75.718.27.67.22.0
11–201.213.716.318.919.58.212.84.50.074.9
20–30/311.713.219.516.623.02.79.42.119.29.1
Mean/Sum2.112.016.918.420.516.640.414.226.486.0
20191–104.67.68.821.416.012.10.09.30.014.7
11–204.56.512.322.818.011.70.056.416.22.0
21–30/316.813.715.021.621.65.01.523.51.55.7
Mean/Sum5.49.312.121.918.628.81.589.217.722.4
20201–104.27.311.214.917.913.10.016.463.032.5
11–205.57.09.619.517.813.00.011.033.547.1
21–30/312.110.412.019.418.30.00.77.257.45.5
Mean/Sum3.98.210.917.918.026.10.734.6153.985.1
Table 3. Grain and straw yield, number of grains per spike, and 1000-grain weight of Triticum sphaerococcum at different sowing density in study years 2018–2020.
YearSowing
Density
(Grains m−2)
Grain Yield
(Mg ha−1)
Number of Grain Per Spike1000-Grain Weight (g)Straw Yield
(Mg ha−1)
20184001.67 ± 0.20 a 119.0 ±3.3 a32.1 ± 1.4 a1.40 ± 0.18 a
5001.68 ± 0.10 a19.7± 4.0 a32.6 ± 0.8 a1.64 ± 0.25 a
6001.60 ± 0.11 a18.9 ± 2.3 a31.1 ± 0.7 a1.52 ± 0.11 a
CV%8.1415.463.5713.27
20194002.37 ± 0.15 b 25.2 ± 1.9 a28.3 ± 0.5 a4.39 ± 0.08 b
5002.42 ± 0.11 b23.6 ± 1.9 a26.7 ± 0.4 b4.26 ± 0.11 b
6002.70 ± 0.03 a23.4 ± 3.1 a27.0 ± 1.0 ab4.74 ± 0.11 a
CV%7.259.513.615.10
20204004.65 ± 0.10 a28.9 ± 1.6 a32.1 ± 0.3 a9.25 ± 0.32 a
5004.75 ± 0.15 a28.8 ± 1.2 a31.3 ± 0.9 a9.26 ± 0.95 a
6004.79 ± 0.17 a29.8 ± 2.1 a32.2 ± 0.8 a9.52 ± 0.56 a
CV%3.035.372.466.58
1 Mean values ± standard deviation (SD) in column followed by different letters indicate significant differences between treatments at p ≤ 0.05.
Table 4. Number of generative and vegetative tillers of Triticum sphaerococcum at different sowing densities in study years 2018–2020.
YearSowing
Density
(Grains m−2)
Generative Tillers
(No Plant−1)
Vegetative Tillers
(No Plant−1)
Fertile Generative Tillers
(No m−2)
Sterile Generative Tillers
(No m−2)
Total Generative Tillers
(No m−2)
20184000.96 ± 0.07 a 11.56 ± 0.24 a273 ± 20 a11.3 ± 0.9 a285 ± 19 a
5000.88 ± 0.08 a1.44 ± 0.16 a275 ± 20 a14.7 ± 9.6 a589 ± 21 a
6000.72 ± 0.03 b1.56 ± 0.28 a280 ± 10 a20.0 ±11.8 a300 ± 4 a
CV%13.9614.395.7657.205.63
20194001.04 ± 0.03 a1.43 ± 0.26 a313 ± 21 b18.5 ± 4.1 a331 ± 20 b
5001.05 ± 0.06 a1.06 ± 0.19 ab351 ± 12 ab23.0 ± 5.3 a374 ± 14 ab
6001.05 ± 0.06 a0.69 ± 0.06 b378 ± 34 a38.0 ± 18.7 a416 ± 35 a
CV%4.3933.7110.1951.1011.36
20204001.07 ± 0.17 a1.47 ± 0.38 a601 ± 67 a3.5 ± 1.9 a605 ± 68 a
5001.06 ± 0.07 a1.23 ± 0.28 a590 ± 82 a5.0 ± 4.8 a595 ± 84 a
6001.09 ± 0.08 a1.27 ± 0.35 a596 ± 14 a3.3 ± 1.0 a599 ± 13 a
CV%9.8224.469.3872.596.51
1 Mean values ± standard deviation (SD) in column followed by different letters indicate significant differences between treatments at p ≤ 0.05.
Table 5. Grain and straw yield, number of grains per spike, and 1000-grain weight of Triticum persicum at different sowing density in study years 2018–2020.
YearSowing
Density
(Grains m−2)
Grain Yield
(Mg ha−1)
Number of Grain per Spike1000-Grain Weight (g)Straw Yield
(Mg ha−1)
20184000.46 ± 0.03 a 110.7 ± 2.8 a32.4 ± 0.3 a1.02 ± 0.12 a
5000.40 ± 0.06 ab9.3 ± 1.9 a33.3 ± 2.8 a1.05 ± 0.16 a
6000.36 ± 0.01 b9.8 ± 2.0 a34.5 ± 4.1 a1.00 ± 0.08 a
CV%13.9721.588.3110.91
20194001.32 ± 0.05 c17.9 ± 2.0 ab25.2 ± 0.8 a3.27 ± 0.66 a
5001.42 ± 0.07 b15.6 ± 1.5 b24.8 ± 1.7 a3.44 ± 0.07 a
6001.62 ± 0.01 a19.1 ± 1.5 a26.6 ± 1.3 a3.55 ± 0.17 a
CV%9.4712.265.5510.99
20204003.52 ± 0.23 a25.9 ± 2.6 a27.7 ± 1.8 a6.77 ± 1.35 a
5003.38 ± 0.24 a25.4 ± 2.3 a25.9 ± 2.1 a6.36 ± 1.17 a
6003.45 ± 0.16 a29.7 ± 2.6 a26.7 ± 0.93 a6.56 ± 0.43 a
CV%5.8711.226.3314.87
1 Mean values ± standard deviation (SD) in column followed by different letters indicate significant differences between treatments at p ≤ 0.05.
Table 6. Number of generative and vegetative tillers of Triticum persicum at different sowing density in study years 2018–2020.
YearSowing
Density
(Grains m−2)
Generative Tillers
(No Plant−1)
Vegetative Tillers
(No Plant−1)
Fertile Generative Tillers
(No m−2)
Sterile Generative Tillers
(No m−2)
Total Generative Tillers
(No m−2)
20184000.42 ± 0.08 a 12.08 ± 0.24 a168 ± 36 a22.7 ± 4.1 b191 ± 37 a
5000.57 ± 0.16 a1.76 ± 0.09 a120 ± 12 a30.7 ± 5.0 ab151 ± 14 a
6000.34 ± 0.11 a1.86 ± 0.14 a146 ± 29 a38.0 ± 10.2 a184 ± 22 a
CV%33.8210.9422.1929.8417.02
20194001.09 ± 0.11 b1.40 ± 0.30 a273 ± 13 b20.0 ± 2.8 a293 ± 10 b
5001.19 ± 0.16 b1.37 ± 0.23 a298 ± 31 b21.5 ± 1.0 a319 ± 32 b
6001.48 ± 0.11 a1.61 ± 0.28 a401± 54 a23.0 ± 5.3 a424 ± 54 a
CV%16.4618.5020.6315.9319.65
20204001.14 ± 0.10 a1.48 ± 0.42 a551 ± 86 a14.0 ± 10.8 a565 ± 96 a
5001.15 ± 0.06 a1.43 ± 0.21 a667 ± 83 a12.5 ± 6.6 a679 ± 86 a
6001.20 ± 0.14 a1.56 ± 0.37 a602 ± 68 a13.5 ± 4.7 a615 ± 71 a
CV%10.1721.1714.3953.2614.74
1 Mean values ± standard deviation (SD) in column followed by different letters indicate significant differences between treatments at p ≤ 0.05.
Table 7. Occurrence of diseases on Triticum sphaerococcum at different sowing density in study years 2018–2020.
YearSowing Density
(Grains m−2)
Powdery Mildew SePowdery Mildew DfRoot RotFusarium Foot Rot
Leaf or Spike Area with Disease Symptoms (%)
20184001.00 ± 0.00 a 10.00 ± 0.00 a34.25 ± 5.12 b10.25 ± 2.87 a
5001.50 ± 0.58 a0.00 ± 0.00 a46.00 ± 3.5 ab16.25 ± 3.77 a
6001.75 ± 0.96 a0.00 ± 0.00 a51.75 ± 9.91 a12.25 ± 2.50 a
CV%47.190.0022.1829.61
201940045.58 ± 6.23 a0.38 ± 0.47 a5.50 ± 2.08 a0.50 ± 0.58 a
50056.67 ± 0.20 a0.20 ± 0.15 a6.50 ± 1.75 a0.00 ± 0.00 a
60049.58 ± 5.99 a0.07 ± 0.06 a4.75 ± 2.22 a0.00 ± 0.00 a
CV%15.47133.1335.38180.91
20204007.75 ± 1.59 a0.26 ± 0.09 a22.71 ± 1.72 a9.38 ± 1.58 b
5005.92 ± 1.66 a0.25 ± 0.14 a13.54 ± 2.67 b11.04 ± 1.85 b
6005.25 ± 1.45 a0.14 ± 0.06 a22.92 ± 6.89 a17.29 ± 2.29 a
CV%28.5520.0130.6531.54
1 Mean values ± standard deviation (SD) in column followed by different letters indicate significant differences between treatments at p ≤ 0.05.
Table 8. Occurrence of diseases on Triticum persicum at different sowing densities in study years 2018–2020.
YearSowing Density
(Grains m−2)
Powdery Mildew SePowdery Mildew DfRoot RotFusarium Foot Rot
Leaf or Spike Area with Disease Symptoms (%)
20184002.75 ± 0.96 b 10.00 ± 0.00 a50.25 ± 4.57 a10.25 ± 1.89 b
5004.50 ± 0.58 b0.00 ± 0.00 a56.25 ± 9.03 a35.25 ± 5.12 a
6007.50 ± 1.73 a0.00 ± 0.00 a63.25 ± 6.45 a9.00 ± 1.83 b
CV%47.070.0014.8071.46
201940034.92 ± 11.18 b0.11 ± 0.07 a6.25 ± 1.50 a0.50 ± 1.00 a
50052.67 ± 4.12 a0.07 ± 0.00 a7.00 ± 2.83 a0.00 ± 0.00 a
60058.75 ± 3.70 a0.06 ± 0.01 a6.50 ± 0.58 a0.00 ± 0.00 a
CV%25.4454.6926.28346.41
202040045.00 ± 3.04 ab0.18 ± 0.07 a23.96 ± 1.72 a7.50 ± 1.18 a
50041.26 ± 2.84 b0.13 ± 0.00 a23.33 ± 2.45 a2.92 ± 1.08 b
60049.42 ± 2.77 a0.13 ± 0.01 a24.38 ± 2.75 a2.92 ± 0.48 b
CV%9.6329.559.0954.42
1 Mean values ± standard deviation (SD) in column followed by different letters indicate significant differences between treatments at p ≤ 0.05.
Table 9. Significant correlation coefficients (p ≤ 0.05) between grain yield and biometric features.
Biometric FeaturesTriticum sphaerococcumTriticum persicum
Number of grains per spike0.860.94
1000-grain weightn.s.−0.58
Straw yield0.990.98
Generative tillers (plants −1)0.590.62
Vegetative tillers (plants−1)n.s.−0.44
Fertile generative tillers (m−2)0.960.95
Sterile generative tillers (m−2)-0.47−0.69
n.s.—not significant.
Publisher’s Note: MDPI stays neutral with regard to jurisdictional claims in published maps and institutional affiliations.

