Article

Device and Method Suitable for Matching and Adjusting Reel Speed and Forward Speed of Multi-Crop Harvesting

Key Laboratory of Modern Agricultural Equipment and Technology, Ministry of Education, Jiangsu University, Zhenjiang 212013, China
*
Author to whom correspondence should be addressed.
Agriculture 2022, 12(2), 213; https://doi.org/10.3390/agriculture12020213
Submission received: 21 December 2021 / Revised: 19 January 2022 / Accepted: 26 January 2022 / Published: 1 February 2022
(This article belongs to the Section Agricultural Technology)

Abstract

:
In order to meet the requirements of multi-crop harvesting, reduce the loss of harvesting, and improve the quality of harvesting, the device and method of matching and adjusting the rotation speed and forward speed of the pulling reel were designed. On the premise of satisfying the matching regulation, the parameters of the rotary wheel and the cutting table were adjusted so that the rotational speed ratio λ of the harvest crop was in the suitable range of the rotational speed ratio of the crop. The speed ratio was designed as a suitable interval of different crops by experiments and experience, and, in order to meet the requirements, it was designed to optimize the wheel speed. The speed-matching was designed, and through the experiments on the wheel-speed-adjustment error, which was less than 2%, it was designed to meet the design requirements. Crop-harvesting experiments were carried out under rotational speed-matching and a random speed, and the experimental results showed that the loss rate under rotational speed-matching was significantly lower than that under random speeds; the tests showed that the wheel speed designed with speed-matching can effectively reduce the loss rate.

1. Introduction

Foreign combined harvesters have the advantages of high intelligence and good efficiency. Compared with the advanced combined harvesters abroad, the working parameters such as the cutting-table height, the rotary speed, and the forward speed of most combined harvesters in China need manual adjustment, and the accuracy of manual adjustment is difficult to guarantee. Due to the uncertainty of field operation conditions, the combined harvester cannot adjust its operating parameters according to the current harvest conditions, and the operation quality of the combined harvester is difficult to be guaranteed [1,2].
The wheel is designed as an important part of the combine, and the harvesting machine first came into contact with crop stalks components; its main role is to put the harvested crop stalks into the cutter support and facilitate cutting crops. Field trials found that harvesting crops in the field, while the reel speed is designed too high, can increase the impact on grain. With a speed that is too slow, the plant will be a cutter and increase grain loss. At present, some researchers have studied the influence of the rotary reel on the loss of the cutting table. Wu Wenjie et al. adopted the method of a three-factor, three-level quadratic-regression orthogonal test and a single-factor test and concluded that the rotational speed and the vertical position and the horizontal position of the rotary reel all had a certain influence on the loss rate of the cutting table [3]. Xu Huquan et al. optimized the design of the main working parameters of the joint harvester’s rotary reel in view of the parameters affecting the loss of the cutting table, including the rotational speed of the rotary reel, the installation height of the rotary reel, the number and structure of the spring teeth of the rotary reel, and the horizontal distance [4]. In foreign countries, Oduori, M.F.; Mbuya, T.O.; Sakai, J.; et al. analyzed the loss factors of the table of the combined harvester and built the model-function relationship between the characteristics of the crop and the parameters of the reel on the basis of a theoretical mechanical analysis. A kind of crushing-particle-loss model based on a linear statistical model was proposed. and the cutting table loss was collected through a field experiment, which verified the good data-fitting degree of the model [5,6]. Fadlelseed, F.E. carried out field tests on the loss of the cutting table by matching the forward speed of the combined harvester with the rotational speed of the rotary reel. The combined tests were carried out with the previous forward speed of the test data (6 km/h, 5 km/h, 4 km/h, and the rotational speed of the rotary wheel (30 r/min, 25 r/min, 20 r/min)). It was concluded that the forward speed and the rotation speed of the rotary wheel has a significant influence on the loss of the cutting table [7]. Hobson, R.N. and Bruce, D.M. used two cutting tables to harvest rapeseed, adjusted different parameters of cutting tables, measured the loss rate of harvesting at different cutting tables, and compared them to obtain the best parameter combination [8].
In addition, the ratio between the rotation speed of the combined harvester and the forward speed of the whole machine when harvesting different crops is the key factor affecting the movement track of the rotary reel. Therefore, it is an effective measure to reduce the loss of the cutting table to study the optimal ratio range of the rotation speed of the rotary reel and the forward speed of the whole machine when harvesting different crops.
In the control of rotational speed Tan, L.N., Pham, and T.C. proposed an augmented feedforward control input, which transformed the speed and current tracking control of the traditional cascade structure into the optimal control of the new structure, realizing the precise control of the speed by the motor [9]. Therefore, this study also wanted to achieve an accurate control of the rotary speed of the harvester.
The research status at home and abroad shows that the parameters of the cutting table have a significant impact on the loss rate, especially the rotational speed of the rotary reel. According to the previous harvest experiment conducted at random speed, the loss caused by the mismatch between the rotational speed of the rotary reel and the forward speed can reach up to 2.5% [10]. Therefore, this study designed a set of wheels designed with a forwarding-speed-intelligent control system. The cutting machine was designed to with a reel speed adjustment, and the speed adjustment driven part was modified. The original hydraulic valve driving the wheel speed was designed for the electro-hydraulic proportional valve drive hydraulic motor adjusting the wheel speed. The harvester forward speed driven by the stepping motor drives the gear tooth fan for step-less speed regulation. The two were matched according to the mathematical model and adjusted according to the suitable range of the speed ratio of each crop and transformed into a manual self-integrated intelligent harvester, which lays the foundation for the stability control of the combine harvester, reduces the failure rate of the combine harvester, and significantly reduces the loss of the cutting table.

2. Materials and Methods

2.1. Mechanism Design of Matching Adjusting Device between the Rotation Speed and the Forward Speed of the Pulling Reel

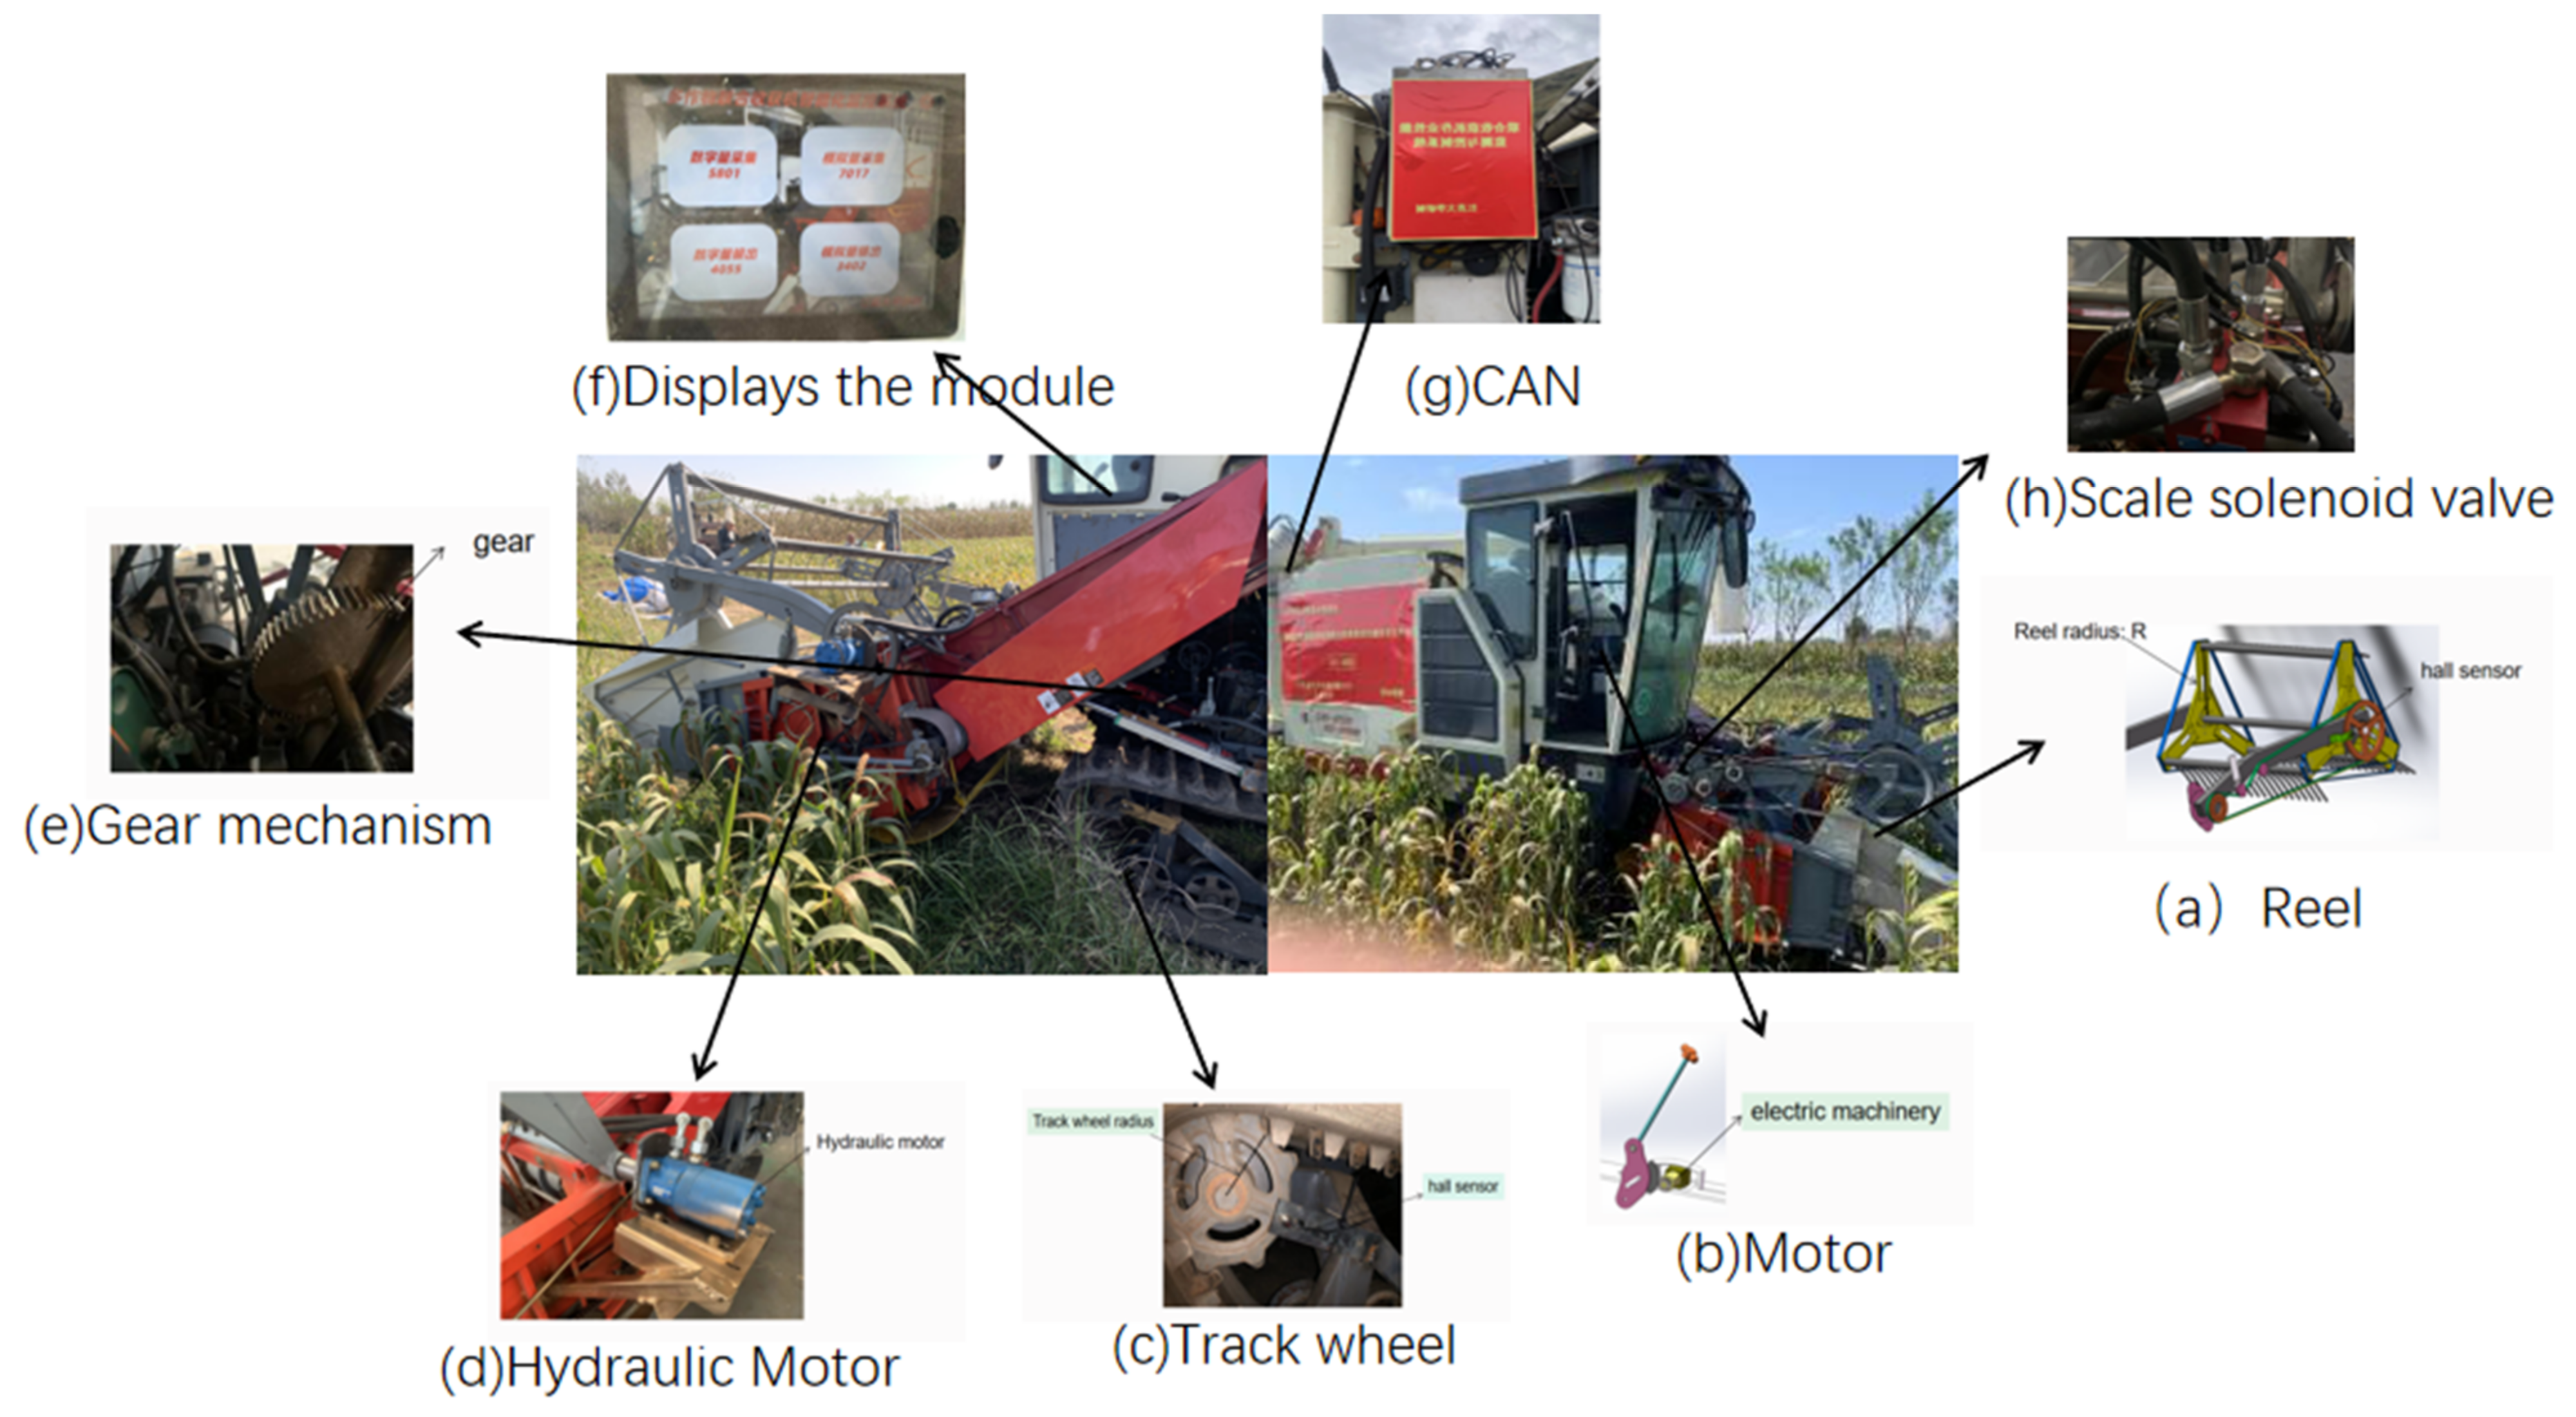
2.1.1. Driving-Machine Modification

Traditional harvesting machines control the hydraulic valve opening extent in a manual way to control the hydraulic oil flow, after which the speed of reel rotation can be adjusted. Additionally, the forward speed is adjusted and controlled by manual operation. In order to meet the demand of intelligent harvesting, the traditional hydraulic valve was changed to an electro-hydraulic proportional valve to control the hydraulic motor for regulating the wheel speed, which used a stepper motor to drive the HST to keep the forward speed and to achieve the match of the former and the latter. The 3D transformation diagram and the physical diagram are illustrated in Figure 1.

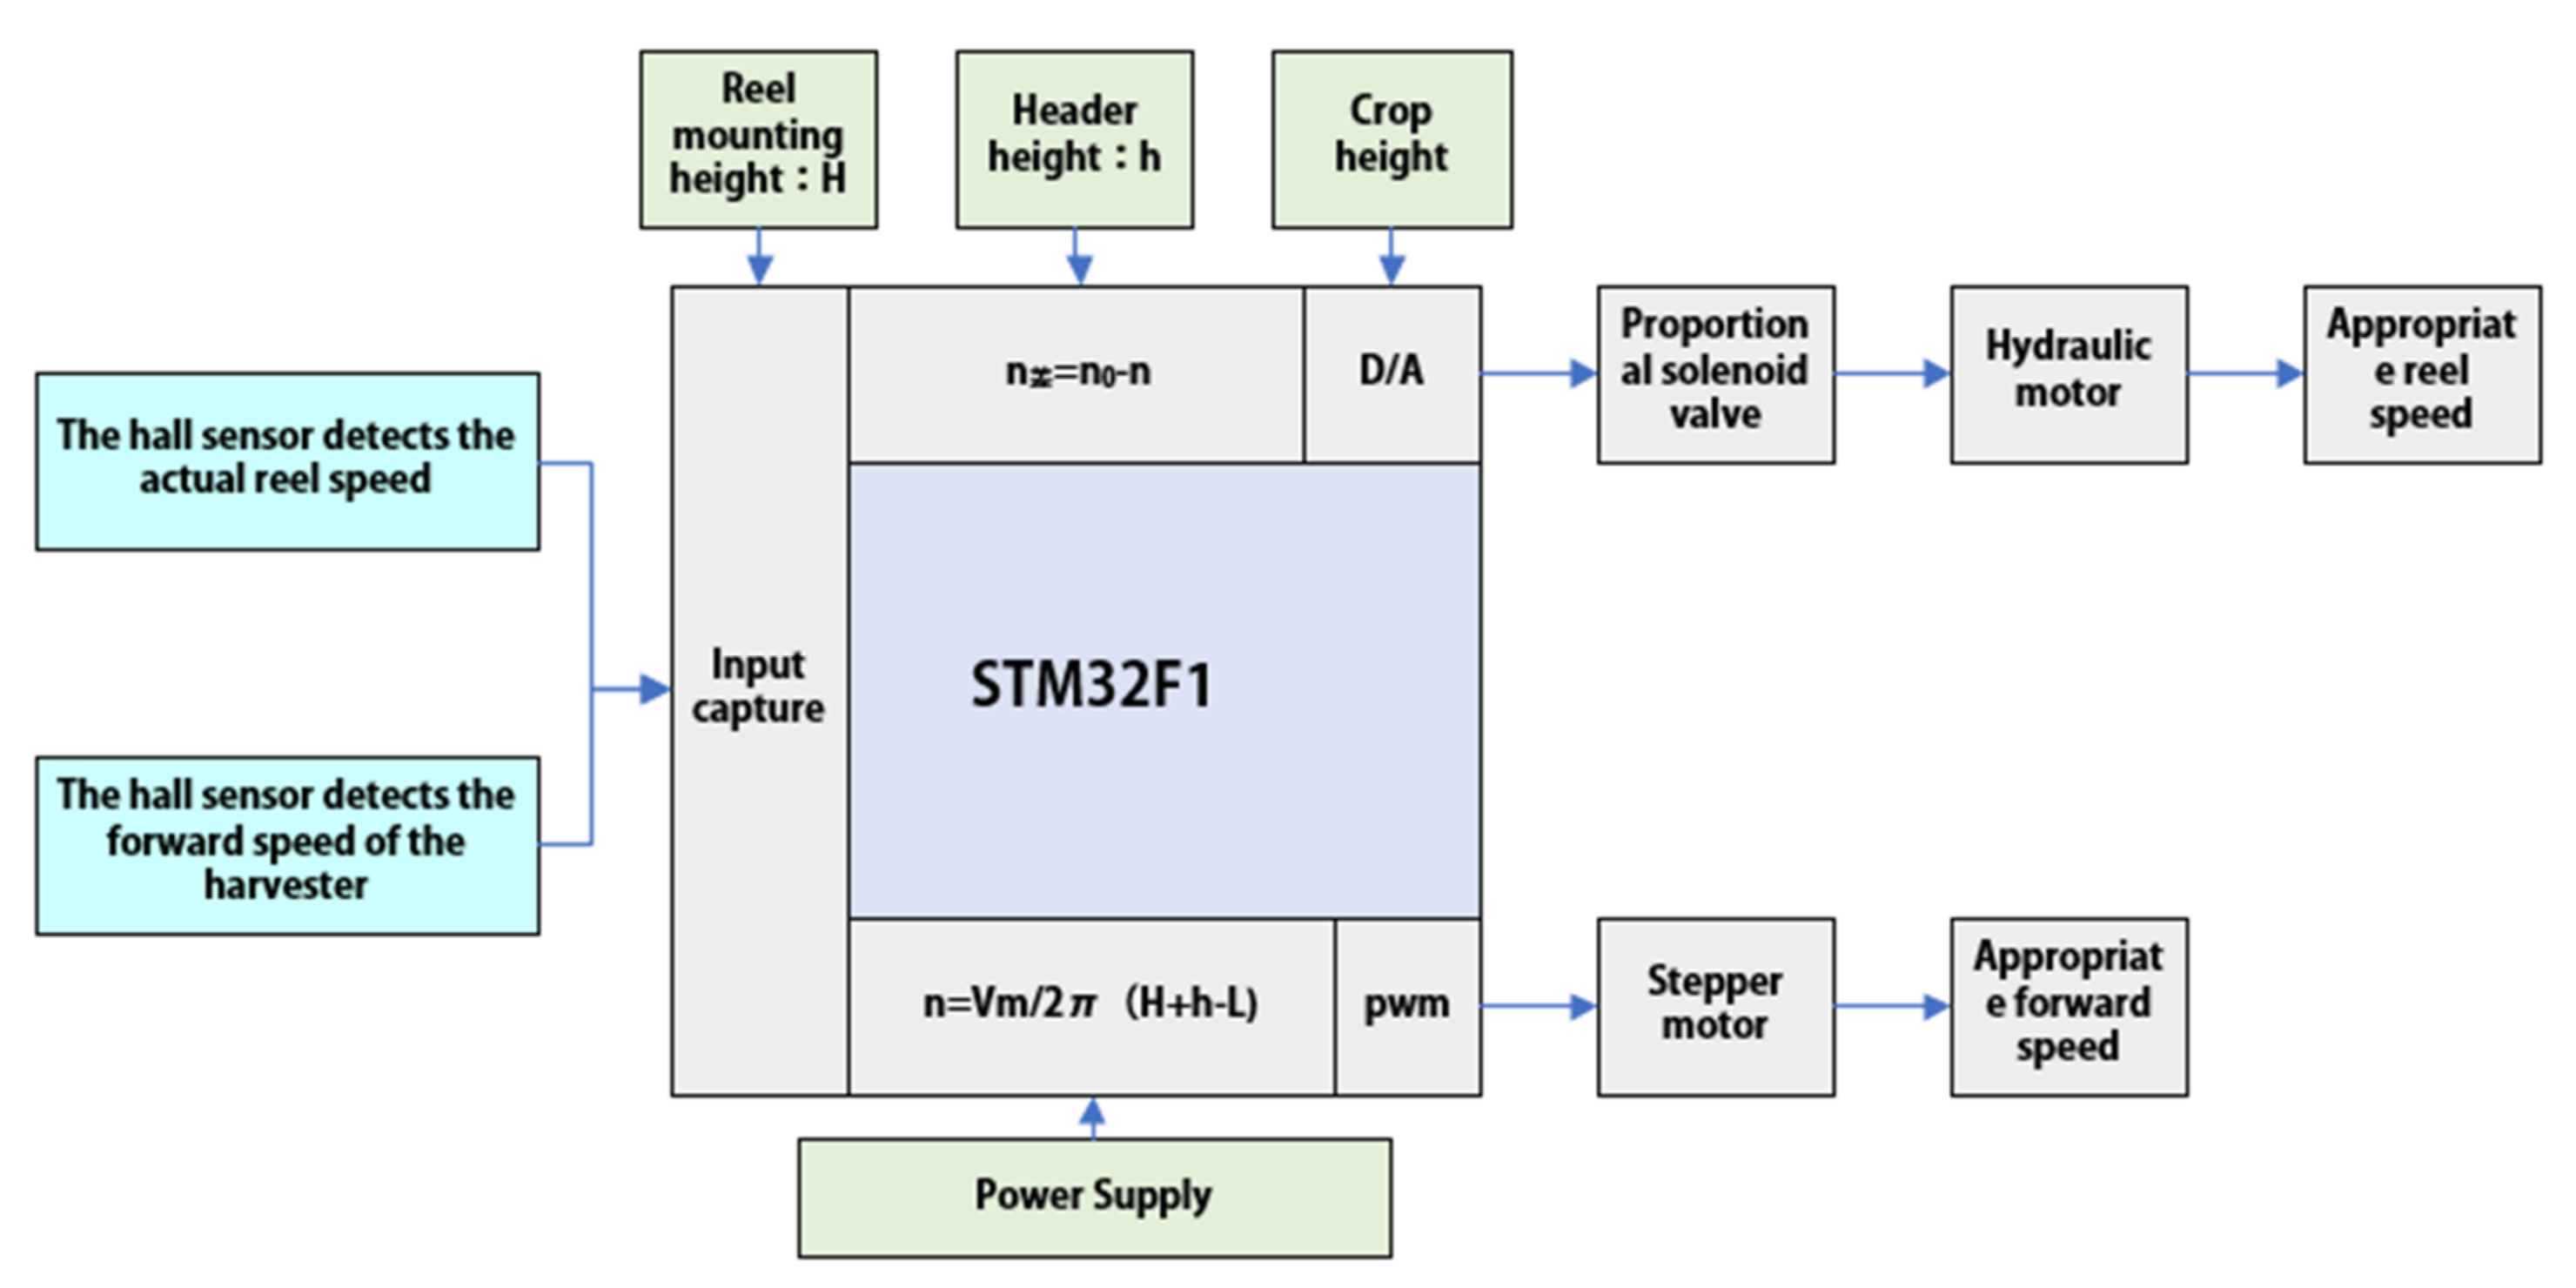
2.1.2. Data Collection, Calculation, and Output Control Section

Use a demo board to collect data from the Hall sensor, which was mounted on the pulling reel and the Harvester crawler driving wheel, the collected signals shifted into a digital quantity within the demo board. Finally, they output a precisely controlled quantity through the fuzzy PID algorithm, via the D/A channel. Then, they passed through the proportional amplifier to drive the electro-hydraulic proportional valve to adjust the opening degree before rotating the hydraulic motor, to achieve the purpose of speed regulation. In another channel, altering the duty cycle of the PWM wave drove the stepping motor to adjust the forward speed of the harvester. The control flow chart is shown in Figure 2.

2.1.3. Signal Acquisition

Data acquisition and processing utilized the STM32F1 demo board. The STM32F1 demo board has the advantages of a fast response speed, low depletion, and high precision. There was an NPN Hall sensor to collect the data of the wheel rotation speed and the harvester forward speed. The low-level input signal was effective. Magnetic steel was installed on the wheel turntable and the harvester track wheel. The sensor enters a low-level signal during each pass of the magnetic steel, according to the interval t between adjacent low-level signals, which were calculated by a timer. The time t taken by the wheel and by the track wheel can be computed. A wheel-driving wheel radius was established as R0, while the track wheel driving wheel radius was R1. So, we can calculate the speed of the pulling reel and the forward speed:
v b = 2 π t R 0 v m = 2 π t R 1  

2.1.4. Actuator Drive

The electro-hydraulic proportional valve needs to be controlled and driven by a proportional amplifier, which is the basic electronic control unit of the proportional solenoid valve. It can process, calculate, and amplify the power signal depending on the needs of controlling the proportional solenoid valve. The input ground wire and the input signal line of the proportional amplifier are connected with the COM end and the output end of the STM32F1D/A module, respectively [11,12,13]. The signal output of the proportional amplifier is switched on the electro-hydraulic proportional valve. An adjusting device combined with the proportional amplifier and the electro-hydraulic proportional valve change the opening extent of the electro-hydraulic proportional valve through controlling the signal voltage, and the hydraulic motor output the rotary speed to drive the pulling reel in order to adjust the rotary speed. The forward speed is regulated by the stepper motor. Its basic principle is to detect the rotor-position information from the motor rotor in the position sensor, and the control drive circuit outputs a PWM wave to turn on the inverter bridge in sequence according to the rotor position signal, before generating a rotating magnetic field to drive the rotation of the permanent magnet rotor, thus adjusting the speed [14,15].

2.2. Selection of a Suitable Speed Ratio Range for Different Crops

When adjusting and matching the reel rotation speed and the forward speed, according to the mathematical model, the reel rotary speed is matched with the forward speed of the harvester. The reel rotary speed changes in real time accompanied with the forward speed, but the increase in the forward speed and the reel rotary speed cannot be infinite or reduced significantly, so not just the condition that both are matched is met but also a preferable harvest need to be ensured. In order to reduce the loss of the harvest, the speed ratio λ is one of the factors to measure the quality of the harvest, λ = Vb/Vm, and the track of grain entry for the grain turning reel is shown in Figure 3.
It can be seen from the simulation analysis that only when λ > 1 can the standing grain be supported by the reel [16], because when λ < 1 and λ = 1, the track of the pulling reel has not formed a loop or the loop is very small, which is not enough to support crops. Only when λ > 1, the loop is larger, and the reel is able to support crops.
Under normal circumstances, crops can be harvested when the speed ratio is between 1–2. However, in order to ensure lower harvest loss, harvest tests are carried out under different harvesters’ forward speeds and rotation speeds of the pulling reel, and harvest loss is measured by the method of the tray to find out the best range of the speed ratio that is suitable for different crops [17]. The following is the header loss rate of rice, rape, and millet harvested at different speed ratios. For each set of data, the harvester advanced 10 m as a sample, and the loss rate was calculated by dividing the lost weight within the sample by the total harvest mass.
S g = 1 1 + w 0 w , 100 w = i = 1 n w i n L B 0
  • S g —lost rate of header, %;
  • w ,—total mass loss of grains in the 10 m test area, kg;
  • w 0 —total grain weight at grain outlet, kg; for the convenience of calculation, the cleaning loss and entrainment loss are ignored.
  • n —here take 3;
  • L —length of measure area, here take 10 m;
  • B 0 —width of sample slot, here take 20 cm;
  • w i —the quality of the grain received by the I—slot, kg;
  • Vb—forward speed of harvester, m/s;
  • Vm—line speed of the pulling reel, m/s.
In the rice-harvesting experiment in Shandong, the forward speed of the harvester was set as Vm = 1.5 m/s, and the line speed of the pulling reel was changed to Vb. The table of the rice loss rate measured under different reel speed ratios λ is shown in Table 1, and the broken line chart of the rice loss rate is shown in Figure 4.
In the experiment of the harvesting millet in Hebei, the forward speed of the harvester was set to Vm = 1.5 m/s, and the linear speed Vb of the reel was changed. The table of measured millet loss rate is shown in Table 2, and the line chart of millet loss rate is shown in Figure 5.
In the rape-harvesting experiment in Qinghai, the forward speed of the harvester was set as Vm = 1.5 m/s, and the line speed of the rotation wheel was changed Vb. The rape loss rate measured under different rotation speed ratio λ is shown in Table 3, and the rape loss rate us shown in Figure 6.
According to the analysis of the test results, in the rice-harvesting experiment, the loss-rate fluctuation was the smallest when the weeding speed ratio λ was between 1.4 and 1.8; so, in general, when the weeding speed ratio λ is between 1.4 and 1.8, a preferable harvesting effect can be achieved with a lower loss, and 1.6 is the best. Similarly, according to the above figure, the best weeding speed ratio for millet harvesting is between 1.2 and 1.7, and 1.4 is the best. The optimal range of the weeding speed ratio suitable for rape harvesting is 1.2–1.6, and 1.3 is the best. It can also be seen from the figure that when the weeding speed ratio is close to 1 or 2, the effect will not be ideal in every kind of crop. Therefore, the optimization of the weeding speed ratio range has a great influence on the harvesting effect, which also lays a foundation for the matching adjustment for the following pulling reel speed and the forward speed of the harvester. In the follow-up process, we can also do harvesting experiments of sorghum, wheat, and other crops to find out the optimal weeding-speed ratio range value.

2.3. Matching Adjustment and Control Process of the Rotary Speed of the Pulling Reel and the Forward Speed of the Harvester

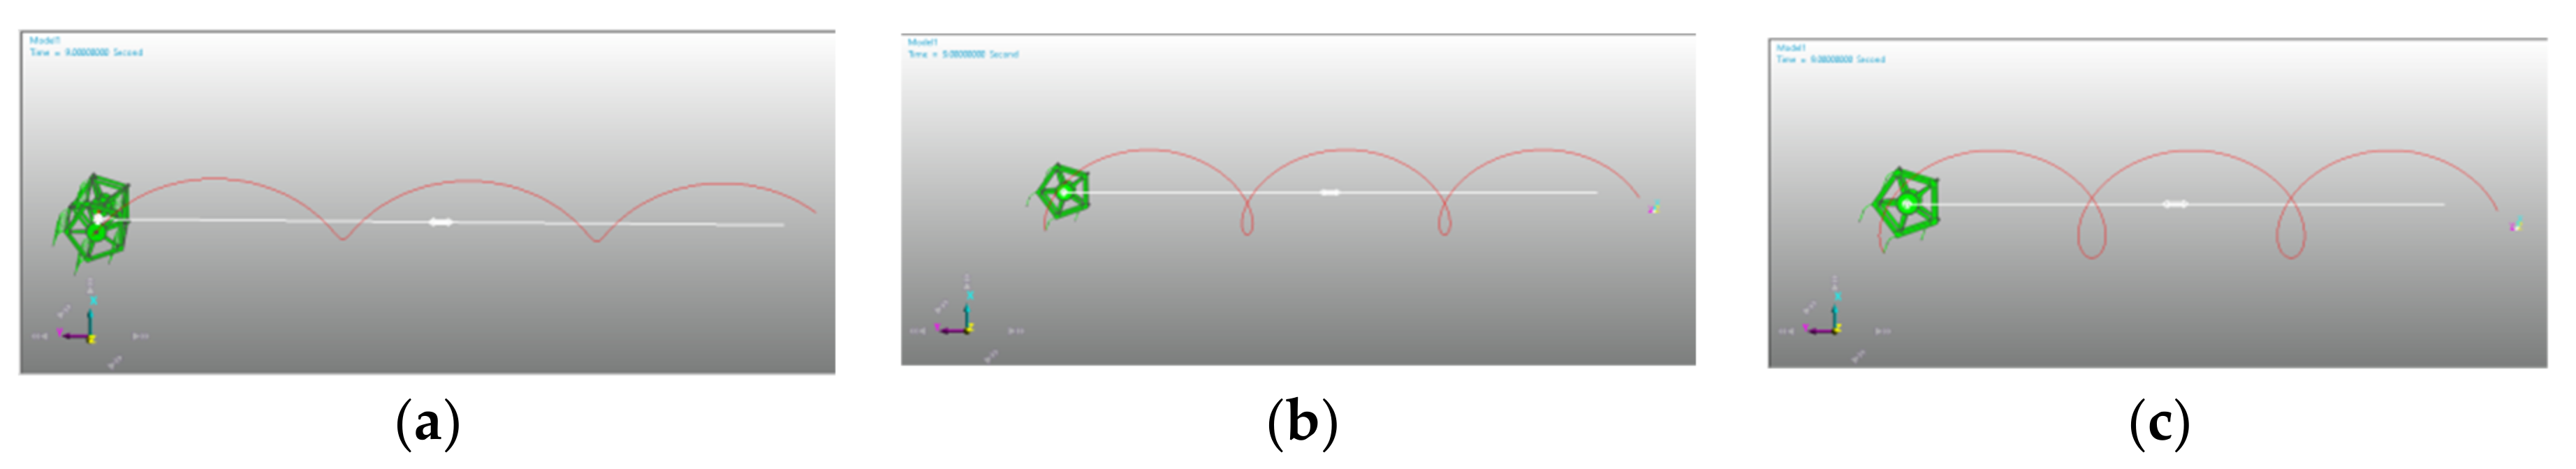
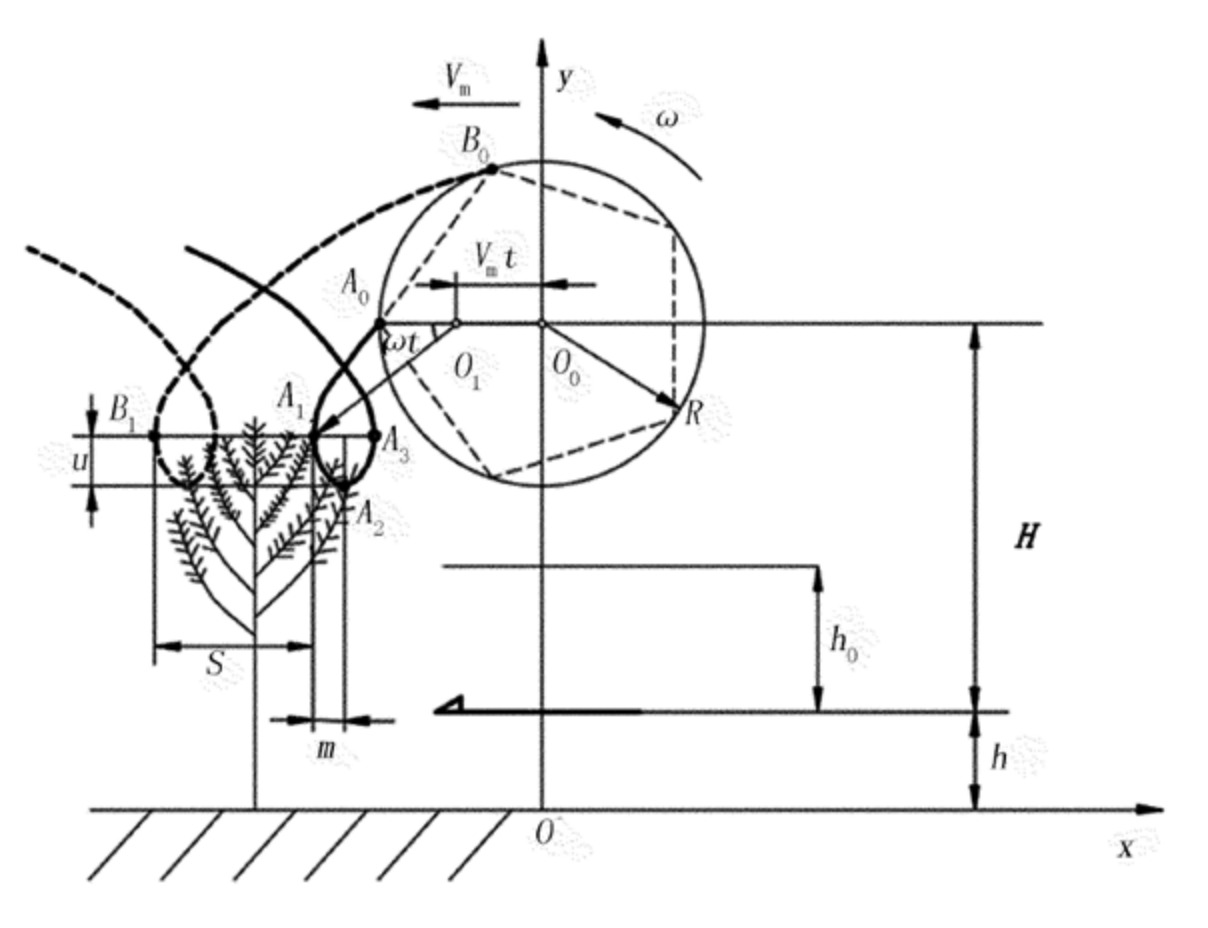
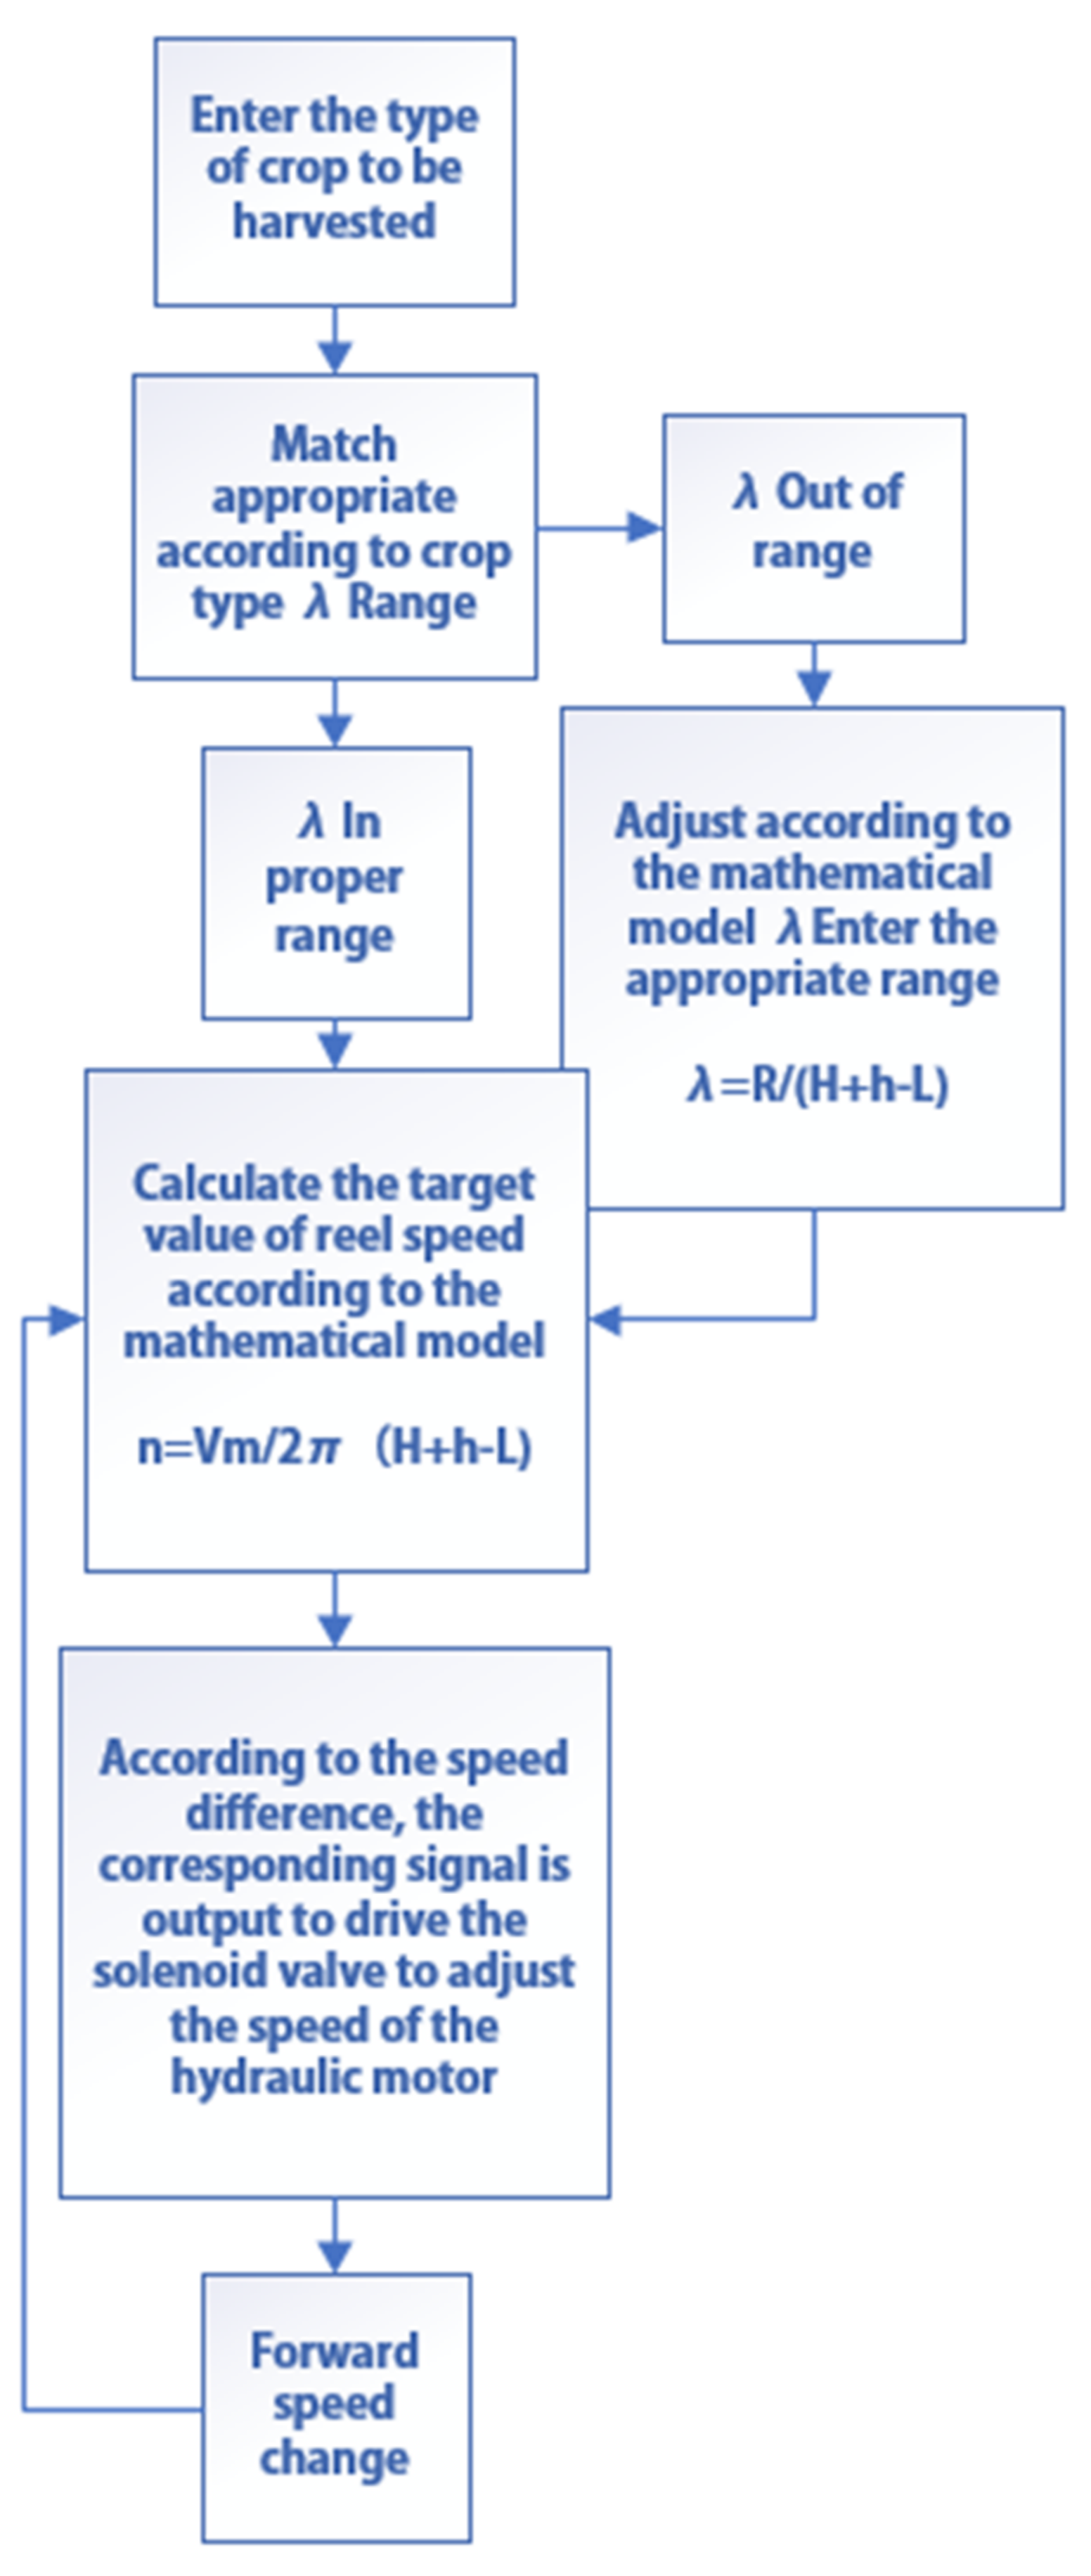
2.3.1. The Mathematical Model of Matching the Weeding Speed Ratio λ and the Rotational Speed of the Reel with the Forward Speed

Firstly, input the type of crop to be harvested on the display screen, such as selecting rice, and the system automatically matches the range of the straw ratio suitable for the harvest of the crop; λ is between 1.4 and 1.8. The control system calculates the current straw ratio value in real time, and the known straw ratio is:
λ = v b v m
Firstly, input the type of crop to be harvested on the display screen, such as selecting rice, and the system automatically matches the range of the straw ratio suitable for the harvest of the crop; λ is between 1.4 and 1.8. The control system calculates the current straw ratio value in real time and the known straw ratio. The reel of the movement is shown in Figure 7.
Combined with the motion track of the wheel in the figure above, the mathematical model equation of the reel in the working process can be established. The mathematical model is [18]:
  X = V m t + R cos ω t y = h R sin ω t + h
It is known that when the pulling reel is doing weeding, the horizontal dividing speed is zero; the following equation can be obtained:
V x   = 0 = d X d t = V m R ω sin ω t
Simultaneously, (4) and (5) can obtain:
y = H V m ω + h
It is known that ω = 2 π n , y L . Therefore, the mathematical model [13] of the matching relationship between the rotation speed of the pulling reel and the forward speed of the harvester is:
n = V m 2 π H + h L
Simultaneously, (3) and (7) get
λ = R H + h L
In the equation
  • R —pulling reel radius;
  • ω —angular velocity during the movement of crop harvesting by turning the reel;
  • V m —combined harvester machine forward speed;
  • t —the time the reel runs in the horizontal direction;
  • H —the installation height of the pulling reel at combined harvester;
  • h —crop height at harvest;
  • L —height of crop wait to be harvested.
According to Equation (8), under the condition of matching the rotation speed and the forward speed of the pulling reel, the rotary speed ratio is only related to the pulling reel radius R, the pulling reel installation height H, the header height H, and the crop height L. If the speed-ratio value is in the appropriate range, then perform the match of the rotary speed and the forward speed, and if not in the appropriate range, adjust the radius R of the wheel, the wheel installation height H, and the header height H to make the weeding speed ratio into the appropriate range. For example, when λ > 1.8, the λ value can be reduced by slightly increasing the installation height of the wheel or the header, when λ < 1.4. By reducing the installation height of the rotary wheel or increasing the radius of the pulling reel to increase the λ value, the mathematical model shows that the parameters of the rotary wheel and the height of the header can be changed to obtain an appropriate λ value.
Matching control flow chart of the rotary speed of the pulling reel and the forward speed of the harvester is shown in the Figure 8 below.

2.3.2. Matching of the Rotation Speed and the Forward Speed of the Pulling Reel

By the preceding part of the text, after meeting the harvest in the proper weeding speed ratio, the rotary speed and the forward speed can be matched; Hall sensors detect the forward speed value and actual value of the rotary speed, through the calculation of a timer twice the time interval between low-level t, while the Hall sensor uses NPN and the low-level effectively. The Hall sensor and the principle is shown in Figure 9. When the magnetic steel rotates with the rotary wheel and the forward speed track wheel, every time the Hall sensor contacts the magnetic steel, the low-level signal will be generated. When the low-level signal is generated twice, it will rotate once. The corresponding speed value can be calculated according to the following formula.
v b = 2 π t R 0 v m = 2 π t R 1
Simultaneously, (7) gets
n = 2 π t R 1 H + h L
The actual speed n0 = 1/t, so the speed difference nce = n0n, if nce > 0; then, the pulling reel needs to reduce the speed, and, if nce < 0, the pulling reel needs to increase the speed; the hydraulic motor change leads to a speed change.
Figure 9. Hall sensor and principle. (a) Hall effect sensor;(b) Schematic diagram
Agriculture 12 00213 g009

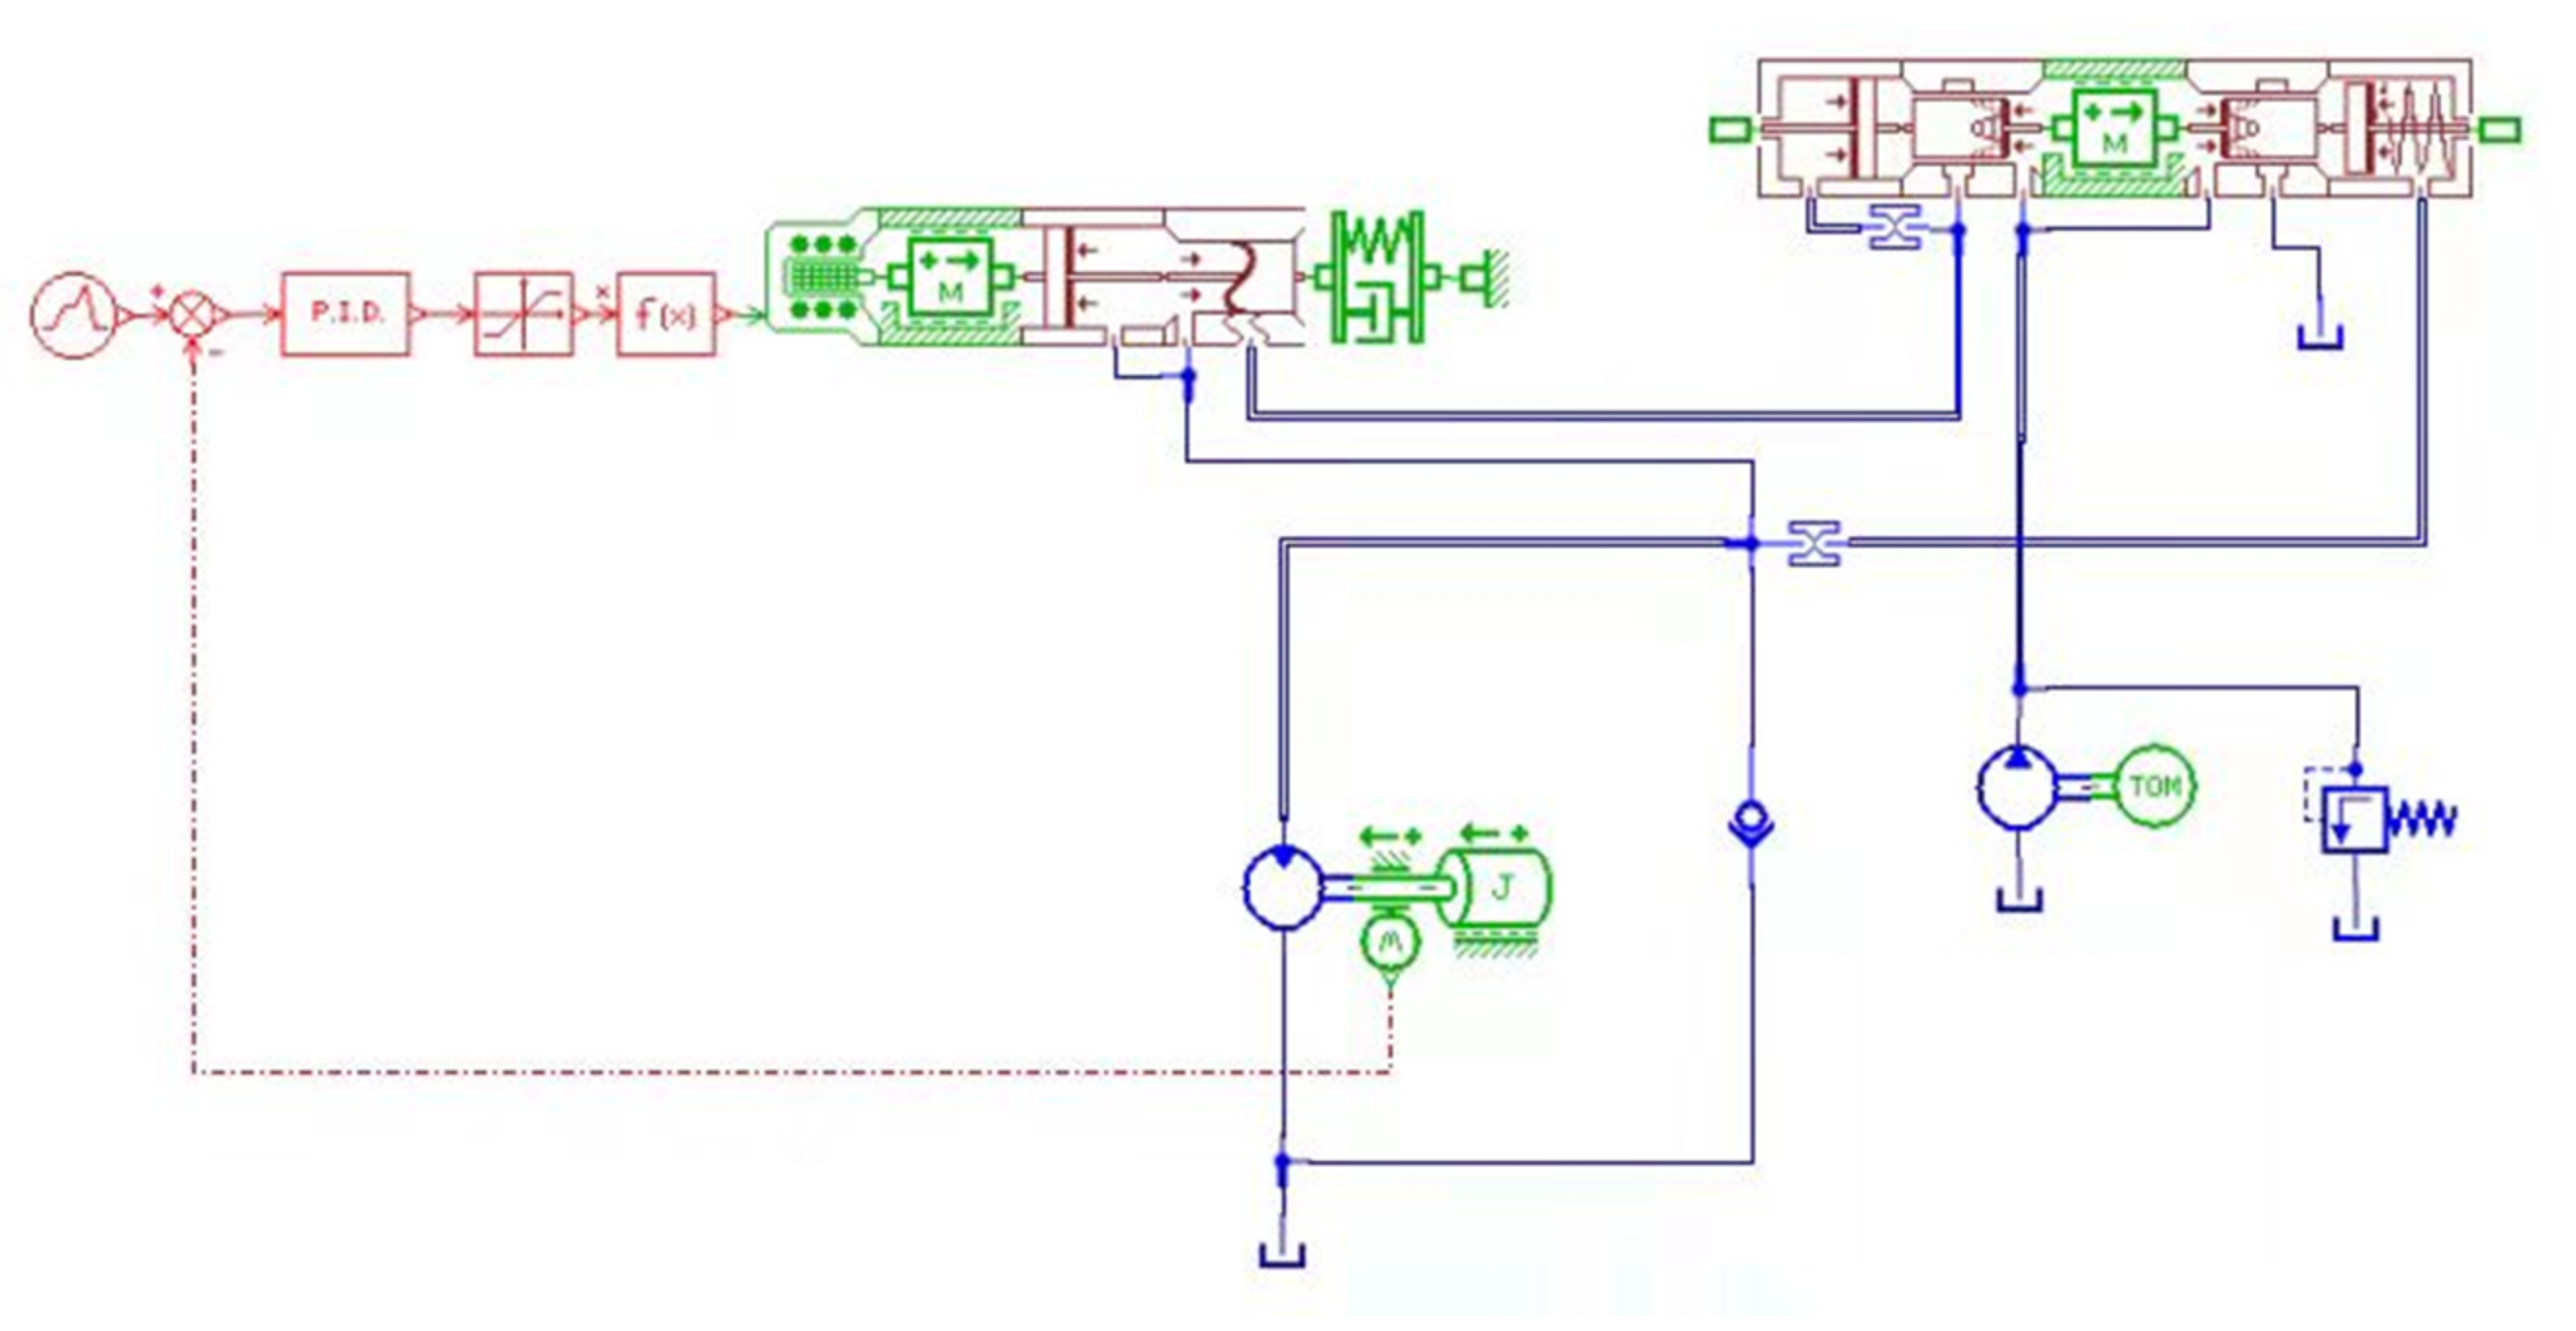
2.3.3. Solenoid Valve Drives the Hydraulic Motor to Adjust the Speed of the Hydraulic Motor

The executive device of the whole control system drives the proportional solenoid valve to adjust the opening through the voltage signal to be output by the D/A channel in STM32F1 to control the amount of hydraulic oil in order to drive the hydraulic motor to rotate so the rotation speed of the reel can be adjusted. The maximum voltage that the STM 32 chip port can output is only 3.3 V. In order to drive the proportional solenoid valve, the L298N chip makes it that amplification of the actual power ratio holds true and controls the 24 V power supply of the harvester to drive the proportional solenoid valve. The motor adopts the BMR series, which is economical, efficient, compact in structure, small in size, and powerful. It can be controlled smoothly and accurately. The Hydraulic Motor Selection BMR-500 series proportional solenoid valve drive hydraulic motor schematic diagram is shown in Figure 10:
The main components of the proportional solenoid valve servo system are the servo hydraulic valve and the servo hydraulic cylinder. The proportional solenoid valve can be simplified as a second-order oscillation link. After reasonable simplification of the working conditions of the proportional solenoid valve, the proportional electromagnet and the proportional amplifier can be regarded as a proportional link in the low-frequency area of the system [19,20,21], equivalent to:
ω = k p k i / R a
In the equation, KP is the electro-hydraulic proportional amplification factor; Ki is the proportional electromagnet current increment; and Ra is the proportional amplifier and coil internal resistance. The transfer function of the main slide valve can be simplified as:
ω 1 = ( k q / A v ) / ( s 2 W n 2 + 2 ξ n W n s + 1 )
Kq is the flow gain; Wn is the natural frequency of the main slide valve; ξ n is the damping ratio of the main slide valve; and A v is the effective area of the spool of the main slide valve subjected to the hydraulic force.
Ignoring the secondary link and considering the gain of the pilot valve, the following formula is obtained:
ω 2 = k p k i R a × k q A v k b s ( s 2 w n 2 + 2 ξ n w n s + 1 ) + k q A v k b k 0
In the formula, Kb represents the gain of the ignored link.
Transfer function of the hydraulic motor:
Determining the mathematical model of the proportional solenoid valve control hydraulic motor is an important link in the whole control process. Three dynamic equations of hydraulic motor can be set up according to an idealization:
(1)
Linearized flow equation for electro-hydraulic ratio:
q L = k q χ v + k c p L
(2)
Flow continuity equation of hydraulic motor:
q L = D m d θ m d t + C tm P L + V t 4 β e × d P t d t
(3)
Torque-balance equation on the motor shaft.
According to Newton’s second law, the torque-balance equation between the motor and the load can be obtained by ignoring various friction factors, other nonlinear factors, and the quality of hydraulic oil:
D m P L = j t d 2 θ m d t 2 + B m d θ d t + G θ m + T L
The total output displacement angle of the spool displacement and the external load acting on the motor simultaneously can be simplified as:
θ m ( s ) = k q D m X v ( s ) k c e D m ( 1 + v t 4 β e k c e S ) t L S ( S 2 W h 2 + 2 ξ h W h S + 1 )
In the equation: kce = Kc + Ctm, m5(NS). Wh is the natural frequency of the undamped hydraulic pressure; ξ h Is the hydraulic damping ratio. The hydraulic motor and proportional solenoid valve parameters were selected as shown in Table 4 below:
The transfer function of the hydraulic motor controlled by an electrohydraulic proportional valve is shown below:
G ( S )   = 3.78 × 10 3 S S 2 90.25 + 13.16 9.5 S + 1
Finally, Amesim software was used to model and simulate the hydraulic part of the control system. The system is shown in Figure 11. The control system was simulated, and the result is shown in Figure 12:
According to the simulation results Figure 12a,c, it is shown that the flow rate of the motor increased with the increase in time; the flow rate of the motor can be increased to the rated value; and the rotational speed can also be increased. Figure 12b shows that the speed of the motor can be changed from 0 to 128 r/min, which proves the feasibility of the proportional solenoid valve controlling the hydraulic motor to adjust the speed of the reel.

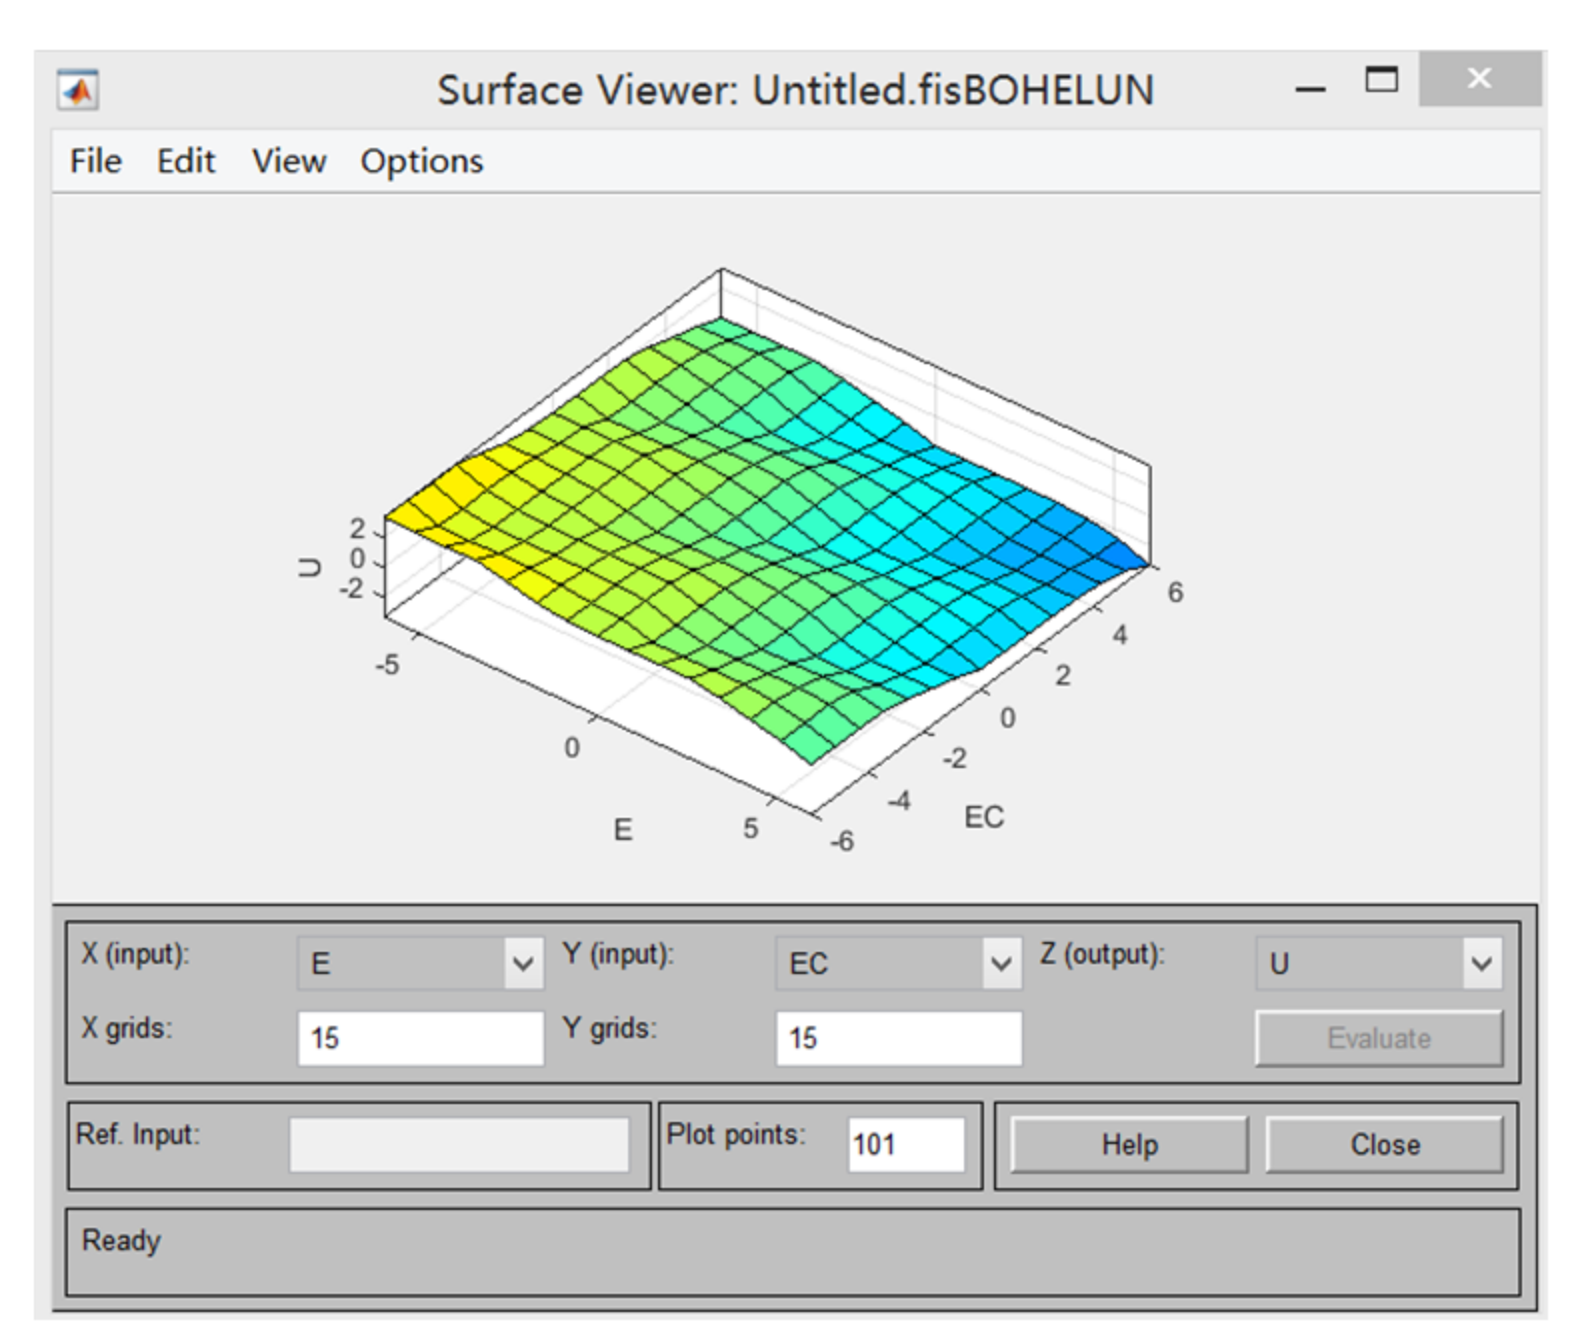
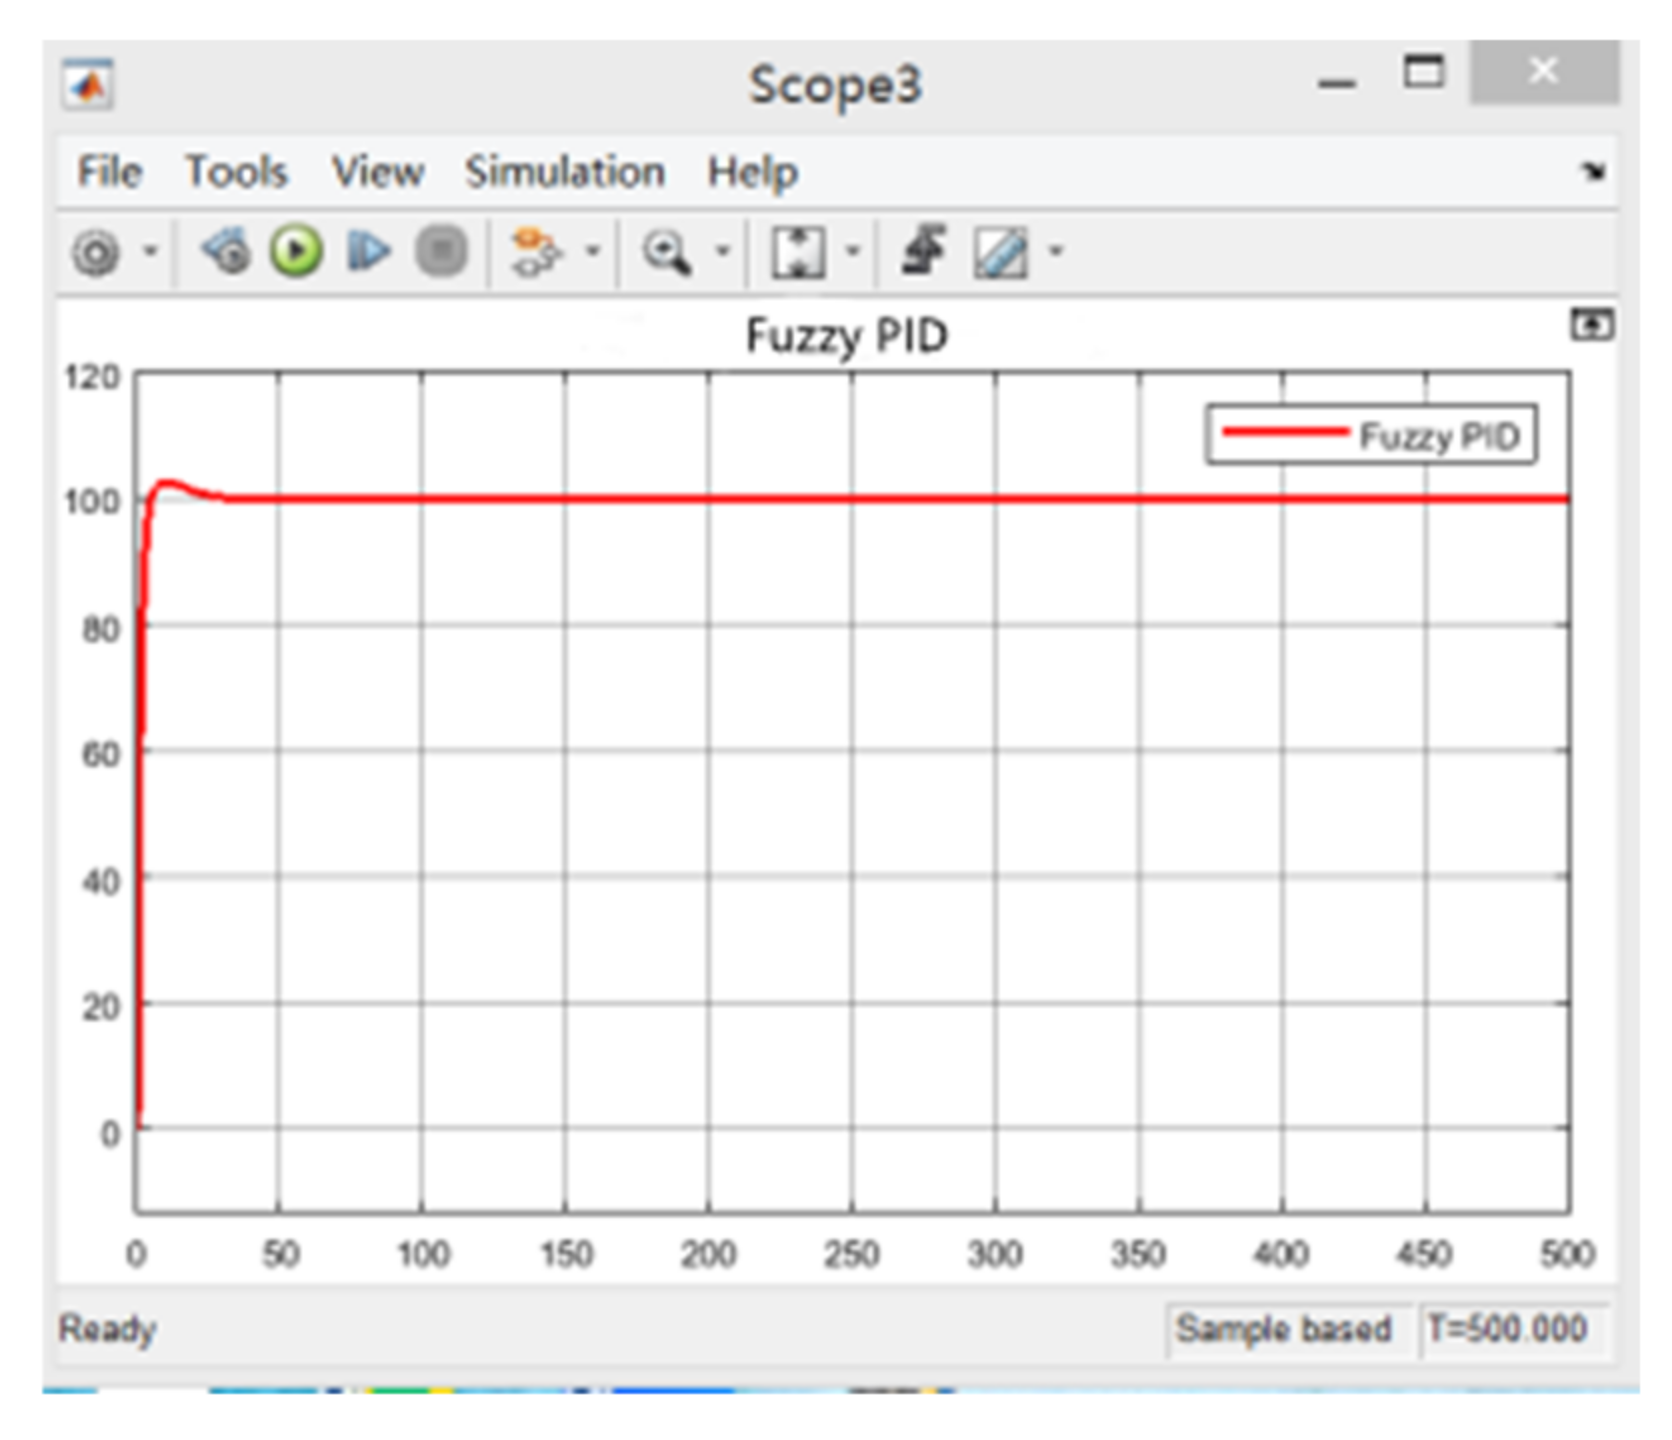
2.3.4. Fuzzy PID Control of the Rotary Speed of the Pulling Reel

The conventional PID control has the advantages of good stability and high control precision, but because of the fixed parameter values, it is hard to meet the requirements of nonlinear and time-varying control systems, while the fuzzy PID control can reduce system errors, reduce system overshoot, improve the corresponding speed, and have good robustness [22]. Taking the reel speed difference E and the difference-change rate EC as inputs, the control quantity u(t) is output after logical reasoning and defuzzification by fuzzy rules, and then the accurate control quantity is obtained by linear tuning of kp, ki, and kd [23,24].
u ( t ) = k p E ( t ) + k i t i = 1 t E ( t ) + k d [ E ( t i ) E ( t i 1 ) ]
Generally, when harvesting crops such as rice, rape, millet, etc., the minimum and maximum suitable speed ratios are taken as the upper and lower limits, respectively, and the rotation speed of the reel is usually calculated as 43–61 r/min; the adjustable range of the rotation speed of the reel by the hydraulic motor is 0–100 r/min, taking 52 r/min as the reference rotation speed, and the adjustable range of the rotation speed is [−52 48] r/min. After quantitative processing, we obtained the following: E basic universe of deviation [−6 6], EC basic universe of deviation change rate [−6 6], output basic universe of output [−5 5], and a fuzzy subset of input and output variables {PB, PS, ZR, NS, NB}. In order to simplify the calculation process, the membership functions of input distance deviation E and input distance change rate EC are all trigonometric functions. The fuzzy control rule table is shown in Table 5.
During control, the STM32F1 demo board collects the values of the reel speed and the forward speed and then calculates the difference between the current speed and the target speed; E and EC can be quantified, outputting U and combining proportion, integration, and differentiation to output accurately the control quantity to adjust the reel speed. By calling the surface observer, the designed fuzzy system is shown in Figure 13.
By analyzing the characteristics of the graph, we can see that it has an obvious gradient distribution, which shows that the fuzzy mapping from error and error variation to the output of the designed fuzzy system matches well with the theoretical design. Therefore, the designed fuzzy controller is qualified [25]. The simulation model of the fuzzy controller of the control system was built in MATLAB/Simulink software, as shown in Figure 14.
We ran the established simulation and set the simulation time to 10 s to simulate the control system. When the proportional factor of rotation speed deviation E (Ke = 0.8) and the proportional factor of height change rate (EC) (Kec = 0.2), the steady-state value of PID controller output was 100, and the PID controller achieved stability in 5 s with a fast response speed, which can meet the design requirements of the automatic rotation speed control system of the pulling reel. The analysis results are shown in Figure 15.

3. Result and Discussion

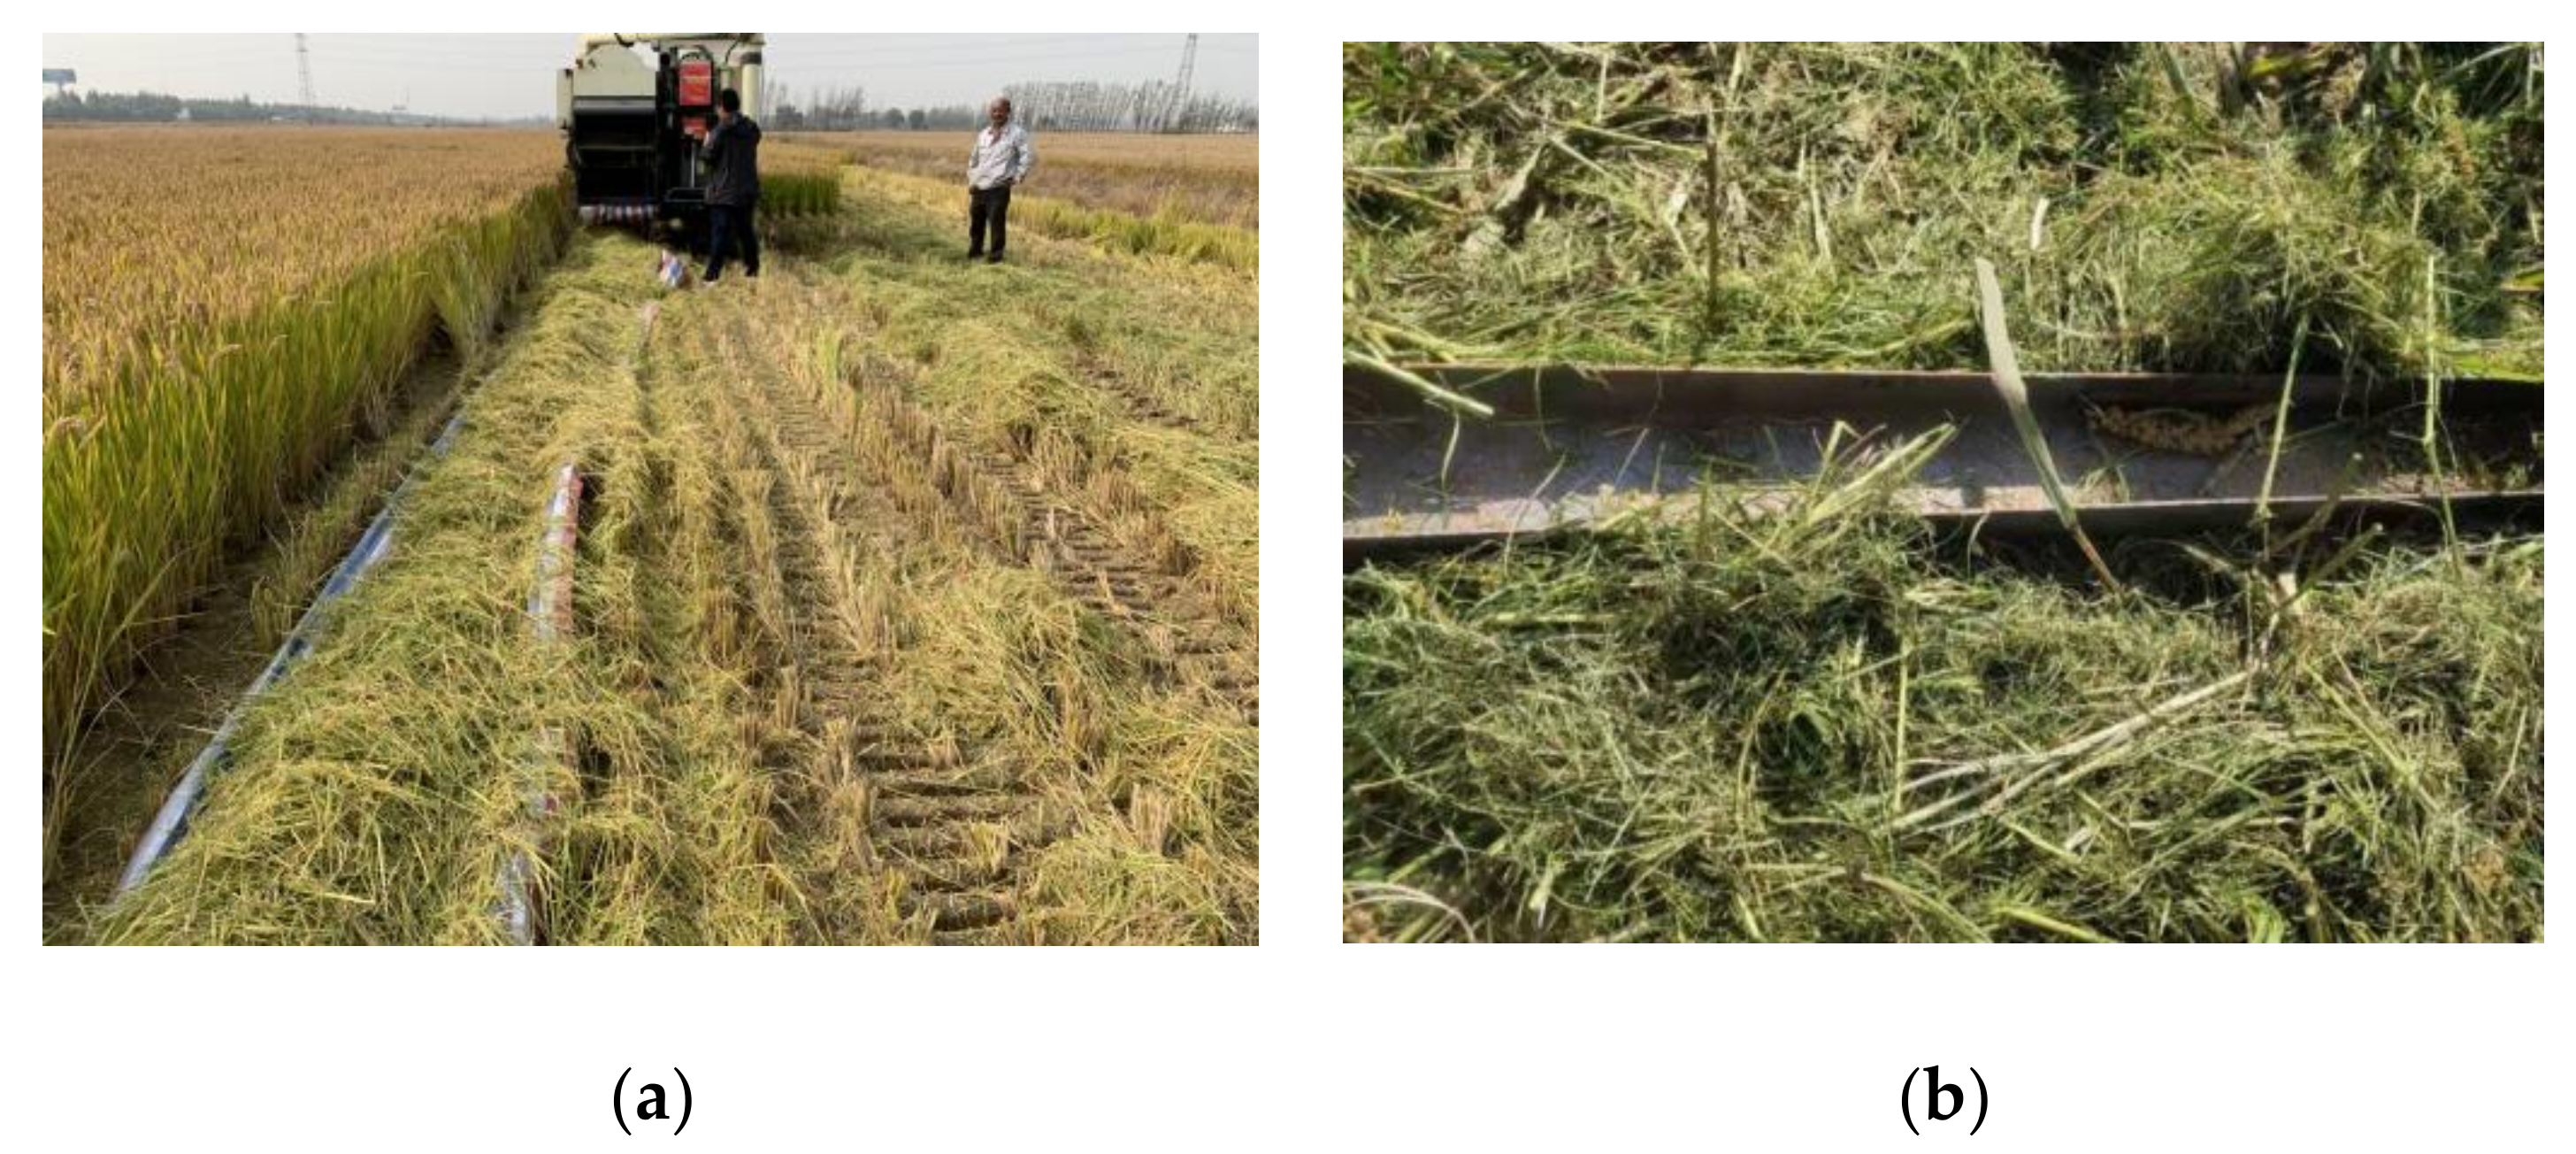
3.1. Test and Results of the Matching Adjustment of the Rotary Speed of the Pulling Reel

The designed device and its control method were tested and debugged. The test model was a 4LZ-5B multi-crop combined harvester. Taking the rice-harvest experiment in Shandong Province as an example, according to the control process, the height of rice, L, was first measured, which was between 0.9 and 1.1, and took L = 1. Then, we judged whether the speed ratio value of the tilting grain was in the appropriate range. The initial measurements were R = 0.45, H = 1.1, and h= 0.2, and we calculated λ = 1.5 by substituting it into Equation (8). The parameters of the header can also be changed, and the installation height of the tilting grain wheel H can be appropriately reduced so that λ = 1.6 was the best value suitable for harvesting rice, ensuring that the speed ratio value of the tilting grain was between 1.4 and 1.8. The forward speed of the harvester was adjusted by changing the duty ratio of PWM. At different forward speeds, the difference and error between the actual speed and the theoretical speed of the pulling reel were measured, as shown in Table 6.
In the first test, in order to verify the feasibility of the matching device between the rotational speed and the forward speed of the wheel designed in this study, we set the forward speed of the wheel Vm, the theoretical rotational speed of the wheel nTheory, and the actual rotational speed of the reel nActual as the test factors. In order to verify the matching effect of the rotational speed of the wheel at different forward speeds, we selected the harvester forward speed as 1 m/s, 1.2 m/s, 1.4 m/s, 1.6 m/s, 1.8 m/s, and 2 m/s under different harvesting-machine speeds. The theoretical values of the grain-wheel rotation speed were 47.5 r/min, 58.2 r/min, 65.7 r/min, 77.0 r/min, 88.6 r/min, and 96.6 r/min, and the actual speeds were 48.0 r/min, 57.3 r/min, 66.8 r/min, 76.4 r/min, 90.0 r/min, and 95.5 r/min. As can be seen in Figure 6, the error between the theoretical speed and the actual speed was between 0.44–1.65%, and the maximum of that was no more than 2%.
Combined with Figure 15, we can also see that when the fuzzy PID-control wheel speed was adopted, the response speed of the control process and the precision will be improved compared with the traditional PID control, and the adjustment time can be shortened by about 25%, with stronger robustness and stability. This experiment also proved that the designed device can perform quickly and efficiently when working in the field [26,27].

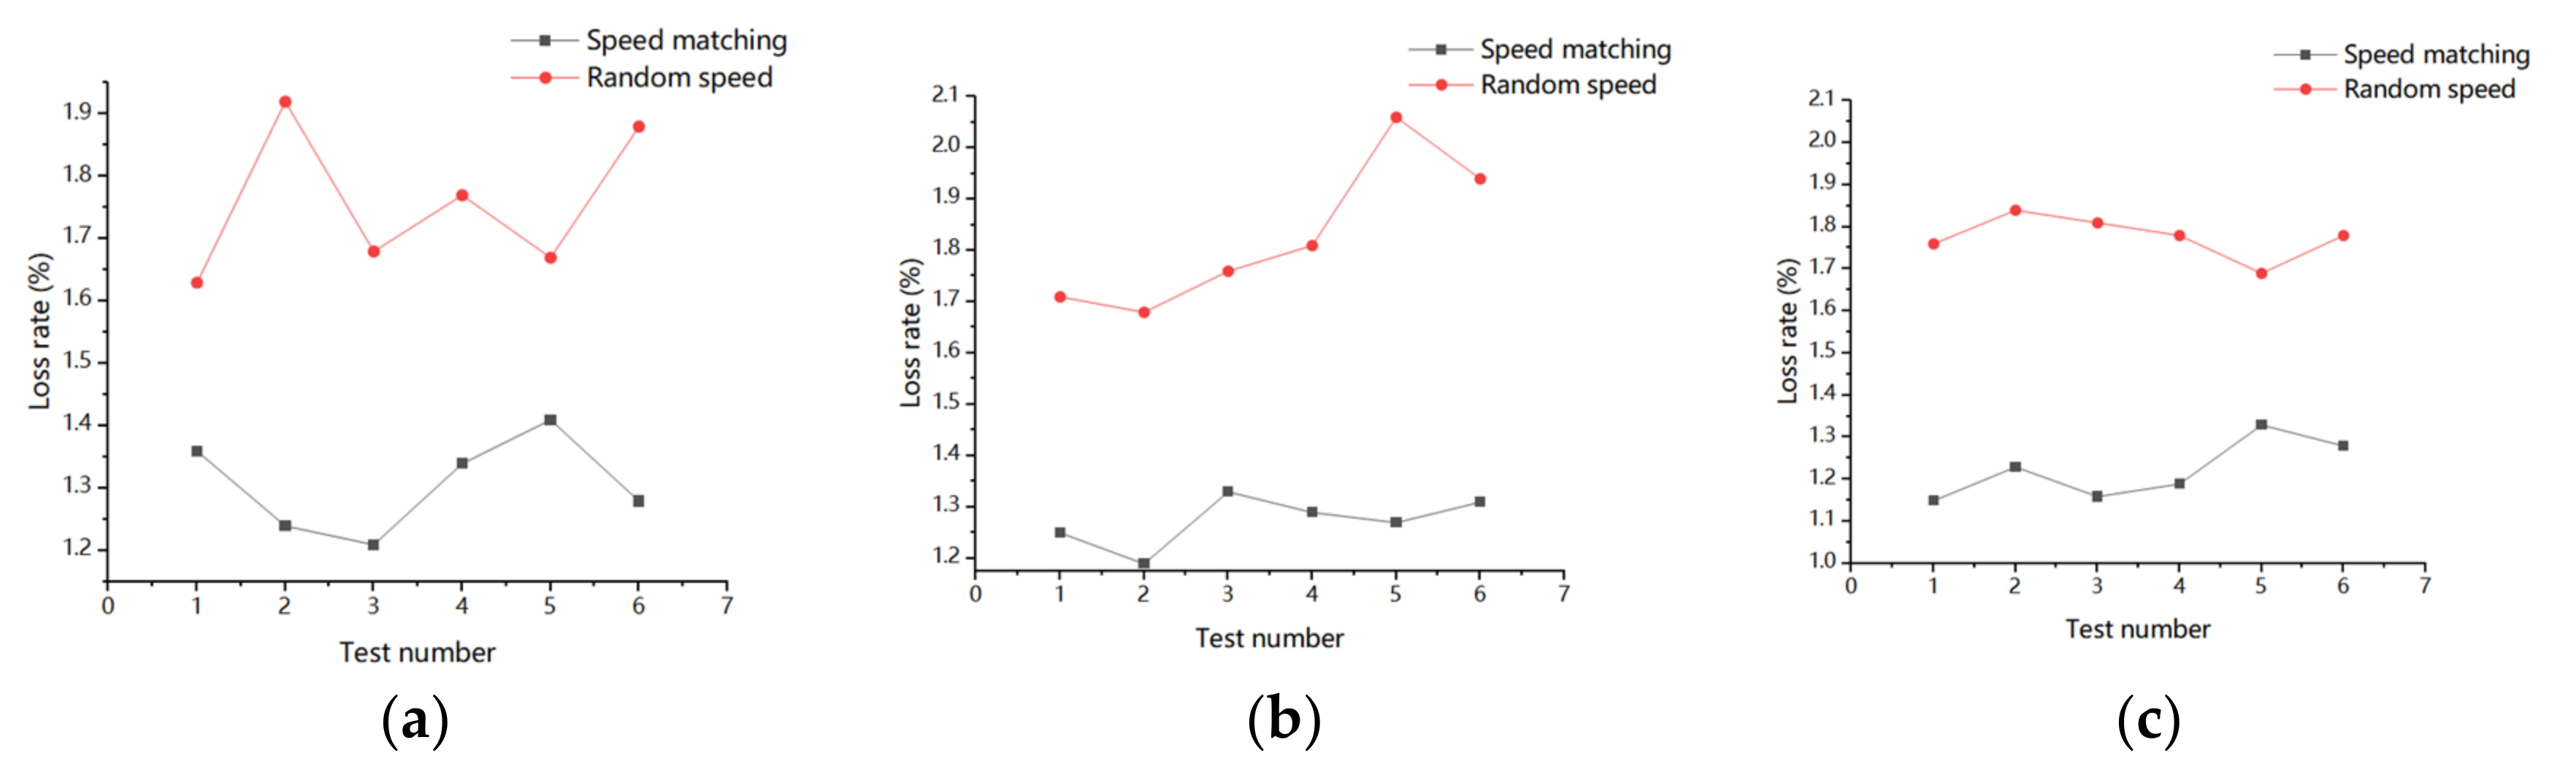
3.2. Comparison Test of Rotary Loss under Speed-Matching and Random Speeds

The wheel speed and speed-matching were designed before the next harvest crops, and measurement of the loss rate, the random wheel speed, and the speed were designed under the harvested crop loss of contrast, rice, rapeseed, and millet. The speed-matching table and the loss rate of the random loss ratio of the wheel speed and the forward speed was designed as table, both of which are shown in Table 7, Table 8 and Table 9. Part of the experimental diagram of harvesting rice, rape, and millet is shown in Figure 16 and Figure 17, which show the comparison of the loss rates of the three crops in two states, and Figure 18 shows the parameter-acquisition interface of the control system.
As can be seen from Table 7, we carried out the harvest test on rice and measured the loss rate of the experiment. A total of six groups of experiments were conducted. When rice was harvested at the speed-matching the forward speed of the rotation wheel, the loss rate ranged from 1.21% to 1.36%, while at the random speed of the rotation wheel, the loss rate ranged from 1.63% to 1.92%. The lowest loss rate at the random speed was greater than the highest loss rate at speed-matching. As shown in Figure 17a, it can be clearly seen that the loss rate of the harvested rice at the random speed was significantly higher than that at speed-matching.
As can be seen from Table 8, we carried out the harvest test on rape and measured the loss rate of the experiment. A total of six groups of experiments were conducted. When the speed of the rotation wheel was matched with the forward speed, the loss rate of the rape harvest ranged from 1.19–1.33%, while when the speed of the rotation wheel was random, the loss rate of the rape harvest ranged from 1.68–2.06%. The lowest loss rate at the random speed was greater than the highest loss rate at speed-matching. As shown in Figure 17b, it can be clearly seen that the loss rate of rapeseed harvested at the random speed was significantly higher than that harvested at speed-matching.
As can be seen from Table 9, we carried out a millet harvest test and measured the loss rate of the experiment. A total of six groups of experiments were carried out. When millet was harvested at the matching speed of the rotating grain wheel and the forward speed, the range of the loss rate was 1.15–1.33%, while under the random speed of the rotating grain wheel, the range of the loss rate of the rapeseed harvest was 1.69–1.84%. The lowest loss rate at the random speed was greater than the highest loss rate at speed-matching. As shown in Figure 17c, it was clear that the loss rate of the harvested millet at the random speed was significantly higher than that at speed-matching.
Based on the past harvest experiment, we did as well as the harvested crop-loss experiments that the domestic and foreign scholars have done. We also found that the wheel speed and the speed mismatch was designed, that the rape of the loss rate can reach 2.3% [3], and that the highest rice loss rate can reach 2.7% [4]. So, this experimental method was adopted to decrease the loss rate in the process of the crop at harvest.
From the two test results we can see, in this study, that the design of device and the method about the wheel speed and the matching speed regulating the device and the method can complete the collection of the harvester forward speed, the wheel speed, and the real-time matching of the wheel speed and the forward speed. Regulating the time and the precision of the control system and the test results of the loss all met the design requirements. The automatic control of the rotary speed under the optimum rotary speed ratio λ was realized, which also lays the foundation for the subsequent realization of an unmanned harvester [28,29].

4. Conclusions

  • In this study, the matching-adjustment method of the rotational speed and the forward speed of the rotary wheel was proposed, and in the matching-adjustment process, the range of the rotational-speed ratio suitable for harvesting different crops was satisfied, so as to reduce the loss of the harvest.
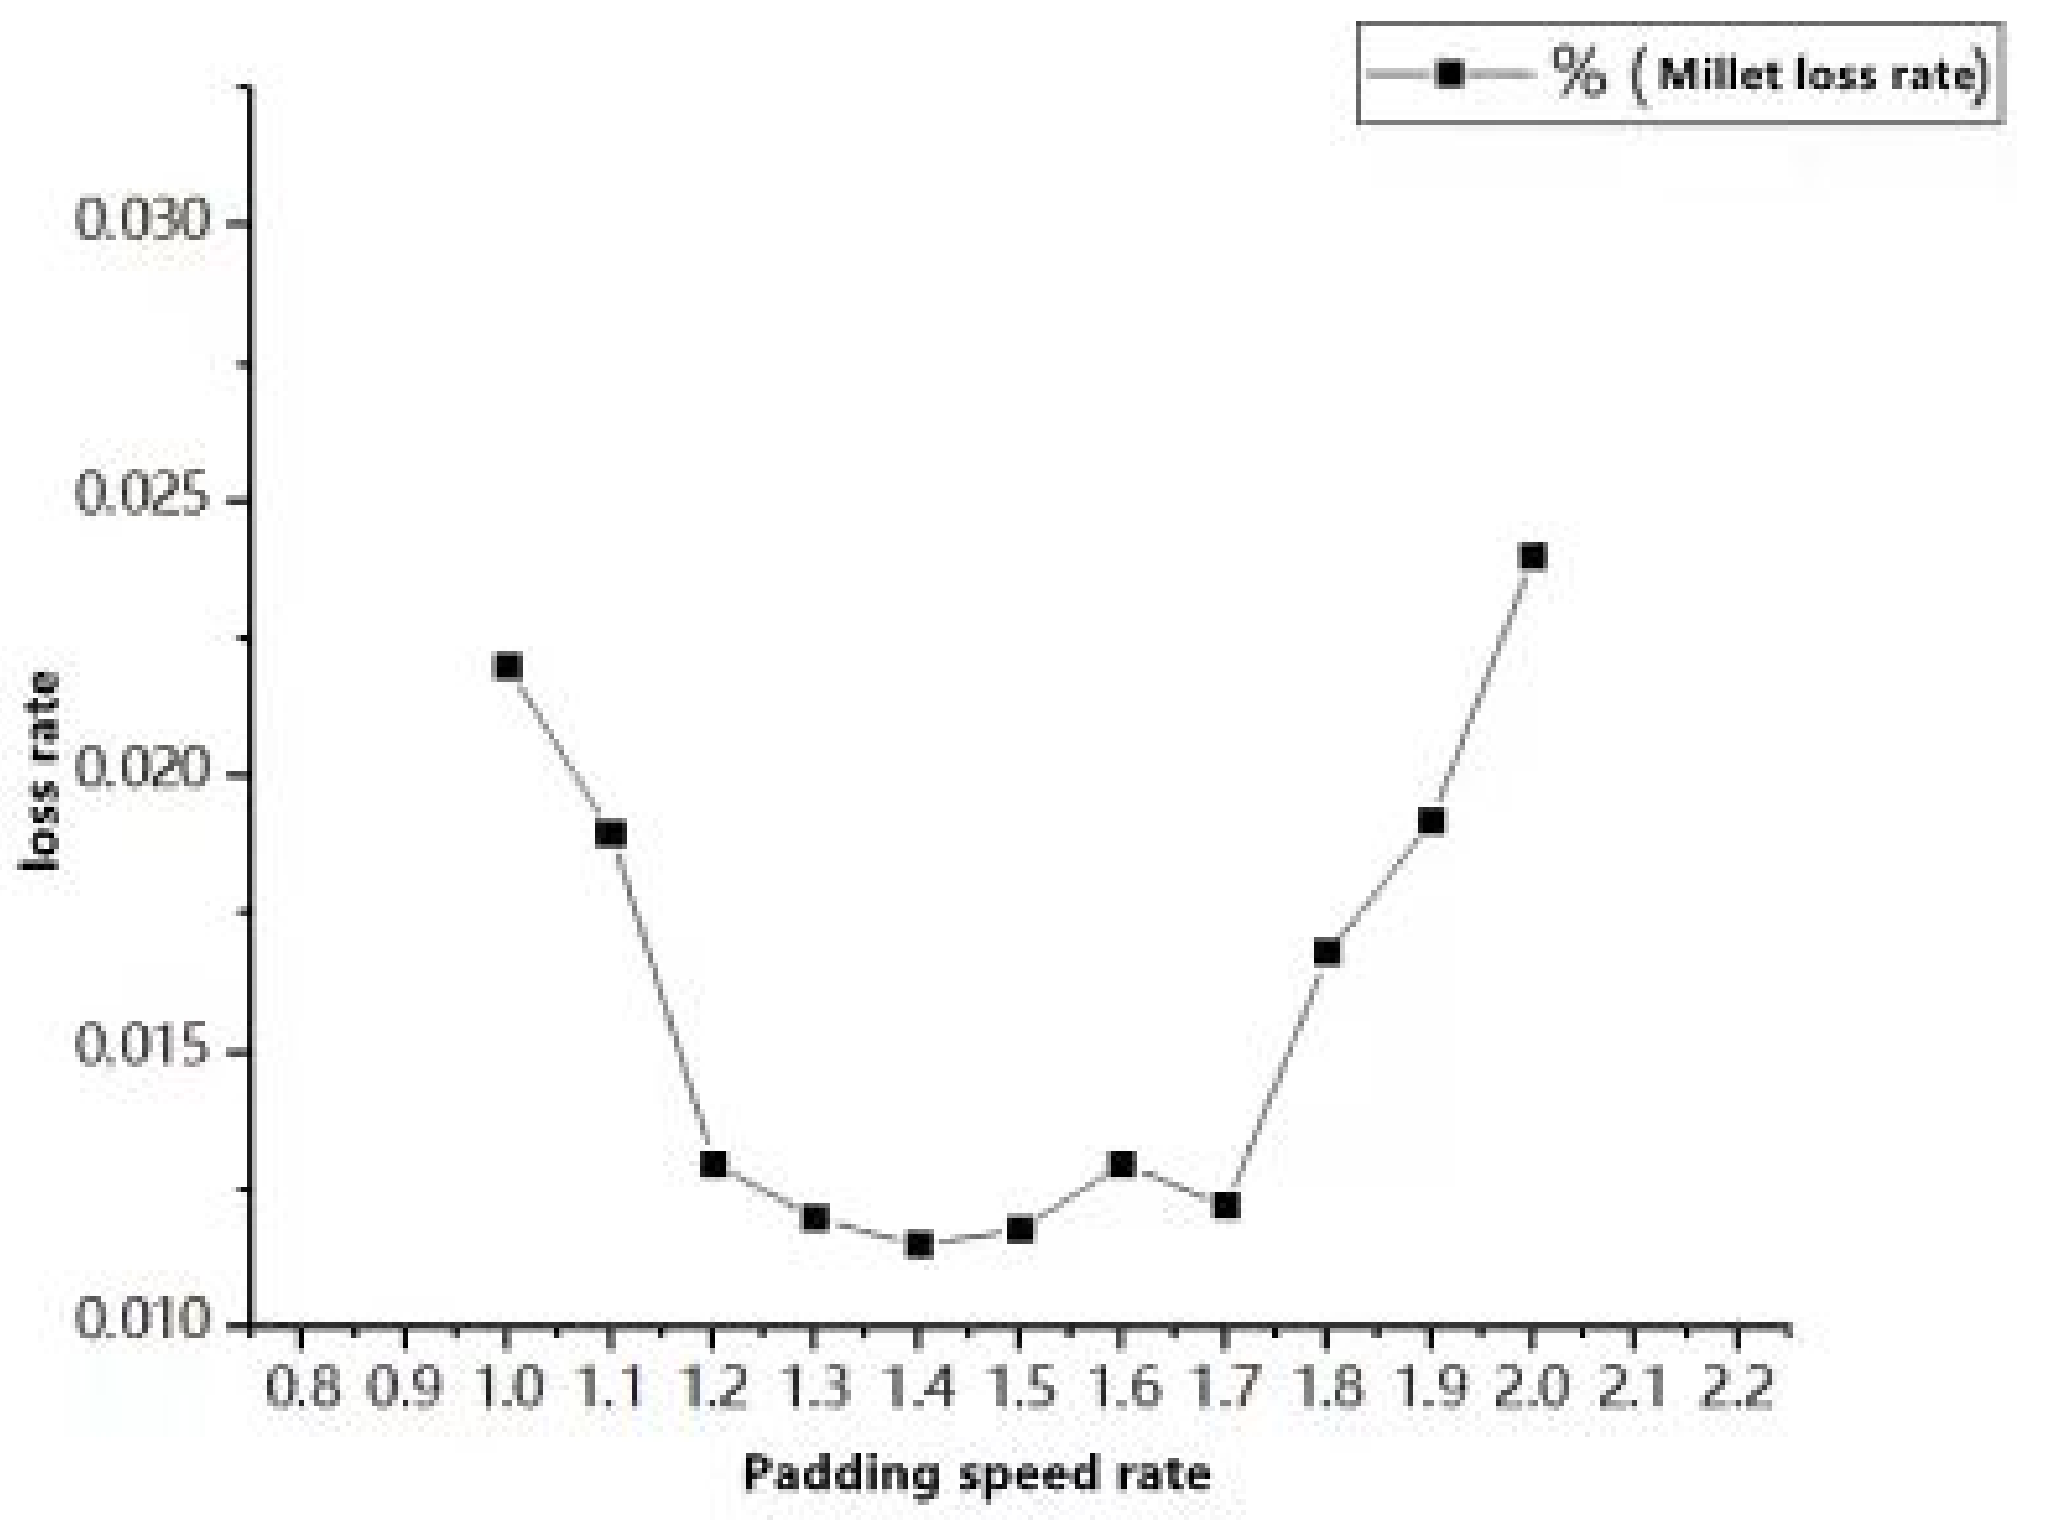
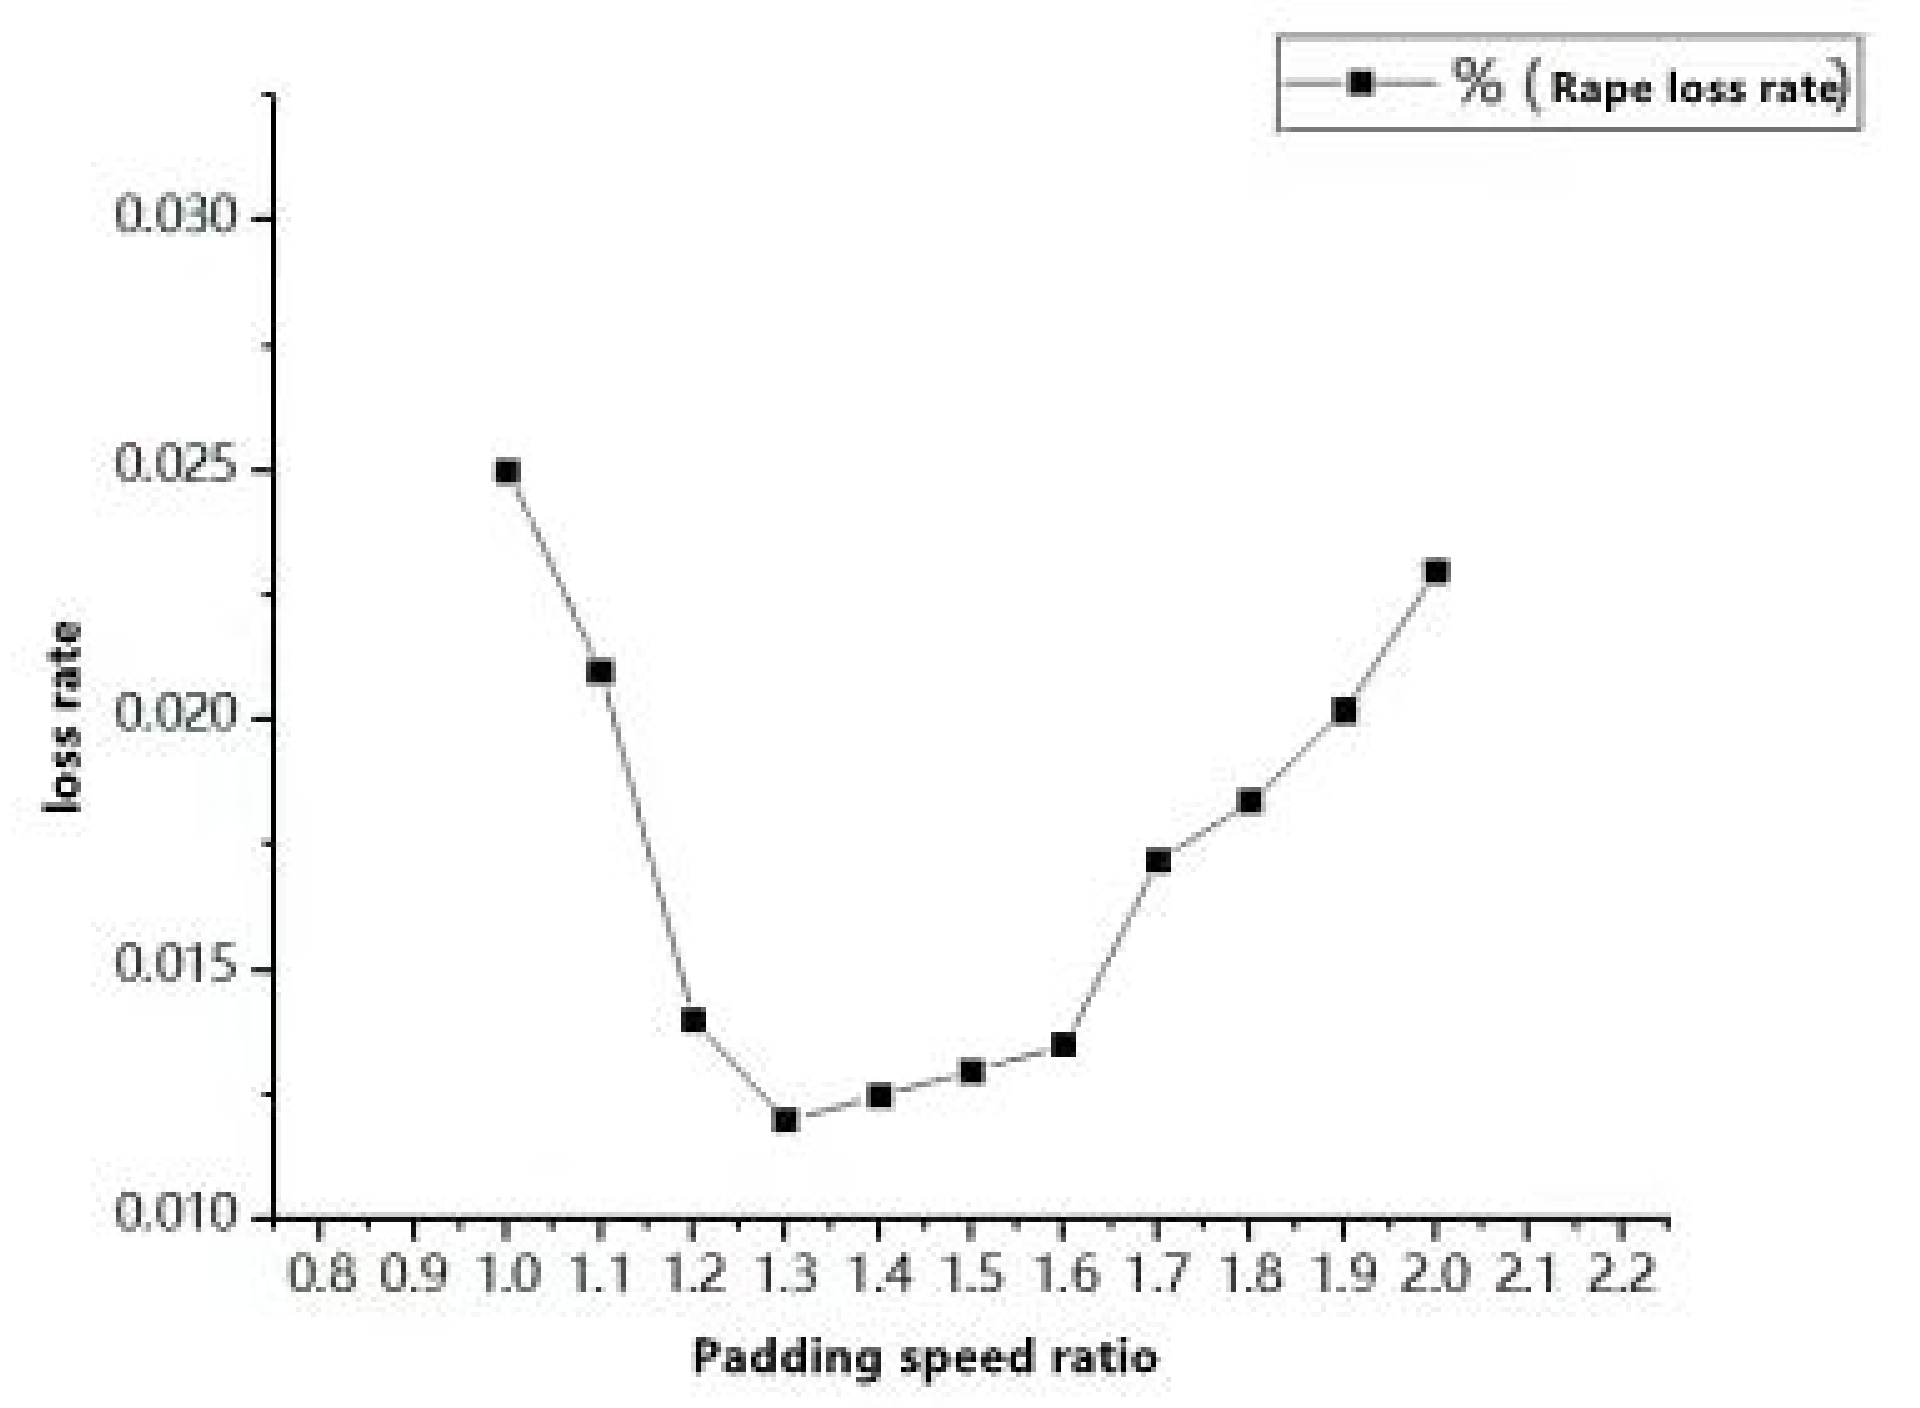
  • When harvesting different crops, harvest crops under different ratios λ and measure the loss rate of different crops under different ratios λ. The test results show that in the rice-harvest test, the loss-rate fluctuation between 1.4–1.8 was the least. So, in general, when the ratio of rice to grain is between 1.4 and 1.8, it can have a better harvest effect and a lower loss. A ratio of 1.6 was the best. The range of the ratio of rice to grain was between 1.2 and 1.7, and 1.4 was the best. The range of the ratio of rice to grain was between 1.2 and 1.6, and 1.3 was the best. Additionally, the chart illustrates the speed ratio that was designed between close to 1 and 2 regardless of what kind of crop-harvest effect is not ideal; so, the optimization of the speed-ratio value range was designed to influence the effect of the larger harvest. The subsequent wheel speed was designed with the harvest-machine speed-matching to regulate the groundwork. A follow-up can test crops such as sorghum, and a wheat-harvest experiment exploring its optimum ratio range value can be designed.
  • According to the Shandong rice-harvest test, we can know that the wheel speed was designed and that the error of the matching-speed-regulating value does not exceed 2%. For meeting the design requirements, one can better achieve a wheel speed, and the speed-matching was designed in the control system to join the selection of the speed ratio, which was designed. To further optimize the match to not only meet the wheel speed but also to guarantee the harvest in the process, speed-matching was designed. The rate of loss was reduced, and the quality of the harvest was improved.
  • By comparing the loss rate of harvested crops under speed-matching and that under random speed-matching, it was found that the loss rate of harvested rice and rape was between 1.21% and 1.41% and 1.19% and 1.33%, respectively. The loss rate of harvested millet ranged from 1.15% to 1.33%, and the loss rate of any crop under the matching of rotation speed was lower than that under the random rotation speed. The experiment proved that the matching of the rotation speed and the forward speed could effectively reduce the loss rate.
  • The device and method designed in this study are suitable for harvesting multiple crops, including rice, rape, and millet. In the follow-up work, we will continue to increase the harvest experiment of wheat, sorghum, and other crops to achieve multiple crop harvests.

Author Contributions

During the writing of this manuscript, K.J. provided the formulation of ideas and overall research goals and objectives. At the same time, he applied statistics, mathematics, and calculation techniques to comprehensively research data. His main work was also the preparation, creation and/or display of published works, especially drafting. Y.L. (Yaoming Li) provided financial support and experimental guidance for the project of this publication. Z.L., H.W., and R.Z. conducted a research and investigation process, specifically performing the experiments and data collection. Y.L. (Yanbin Liu) and J.C. participated in the creation of the model. S.X. and G.Z. participated in the planning of research activities. All authors have read and agreed to the published version of the manuscript.

Funding

Major scientific and technological innovation projects in Shandong Province 2019JZZYO10729.

Institutional Review Board Statement

Not applicable.

Informed Consent Statement

Not applicable.

Data Availability Statement

Not applicable.

Conflicts of Interest

The authors declare no conflict of interest.

References

  1. Moses, F.O.; Thomas, O.M.; Jun, S. Kinematics of the tined combine harvester reel. Agric. Eng. Int. CIGR J. 2012, 14, 53–60. [Google Scholar]
  2. Wu, W.; Wu, C. Research status of Rape Combine Harvester cutting table. Jiangsu Agric. Sci. 2018, 46, 5–11. [Google Scholar]
  3. Wu, W.; Wu, C. Optimization of cutting table parameters for Rape Combine Harvester. J. Zhejiang Univ. 2018, 44, 481–489. [Google Scholar]
  4. Xu, H.; Peng, Z. Optimization design of main parameters of reel of new type Rape Harvester. Agric. Equip. Technol. 2007, 33, 58–59. [Google Scholar]
  5. Oduori, M.F.; Mbuya, T.O.; Sakai, J.; Inoue, E. Shattered rice grain loss attributable to the combine harvester reel: Model formulation and fitting to field data. Agric. Eng. Int. CIGR J. 2008, 10, 1–25. [Google Scholar]
  6. Oduori, M.F.; Mbuya, T.O.; Sakai, J.; Inoue, E. Shattered Grain Loss Attributable to the Combine Harvester Reel. 2006. Available online: http://erepository.uonbi.ac.ke:8080/xmlui/handle/123456789/15876 (accessed on 20 December 2021).
  7. Fadlelseed, F.E.A.E. Effect of Combine Harvester forward and reel Speeds the Harvesting Losses of Pearl Millet. Ph.D. Thesis, University of Khartoum, Khartoum, Sudan, 2015. [Google Scholar]
  8. Tan, L.N.; Pham, T.C. Optimal Tracking Control for PMSM with Partially Unknown Dynamics, Saturation Voltages, Torque, and Voltage Disturbances. IEEE Trans. Ind. Electron. 2021, 69, 3481–3491. [Google Scholar]
  9. Hobson, R.N.; Bruce, D.M. Seed loss when cutting a standing crop of oilseed rape with two types of combine harvester header. Biosyst. Eng. 2002, 81, 281–286. [Google Scholar] [CrossRef]
  10. Qing, Y.R.; Li, Y.M.; Xu, L.Z.; Ma, Z. Screen oilseed rape (Brassica napus L.) suitable for lowloss mechanized harvesting. Agriculture 2021, 11, 504. [Google Scholar] [CrossRef]
  11. Gao, X. Parameter Identification and Fuzzy PID Control Strategy Research of Electro-Hydraulic Proportional Valve Loading System; Chang’an University: Xi’an, China, 2014; (In Chinese with English abstract). [Google Scholar]
  12. Xu, B.; Su, Q.; Zhang, J.H.; Lu, Z.Y. Analysis for drive circuit and improved current controller for proportional amplifier. J. Zhejiang Univ. Eng. Sci. 2017, 51, 80–806, (in Chinese with English abstract). [Google Scholar]
  13. Kang, Y. Research and application of electro sydraulic proportional control system based on PWM technology. Colliery Mech. Electr. Technol. 2017, 2, 28–32, (In Chinese with English abstract). [Google Scholar]
  14. Man, K. PLC Programming Step by Step, Mitsubishi GX Works 2; China Electric Power Press: Beijing, China, 2013. [Google Scholar]
  15. Zhang, C. Brushless DC Electric Motor; China Machine Press: Beijing, China, 1996. [Google Scholar]
  16. Wang, J.; Wang, Z.; Jia, J. Research on the track motion of the reel of the low stalk cutting table of Feed Harvester. J. Agric. Mach. 2011, 42, 152–155. [Google Scholar]
  17. Li, M.L. Study on the method for determining the loss rate of cutting table in Rape Combine Harvester. Chinas Agric. Mech. 2012, 1, 4. [Google Scholar]
  18. Chen, J.; Wang, S.; Li, Y. Design and test of electric control device for cutting table parameters of rice-wheat combine. Agric. Eng. 2018, 34, 19–26. [Google Scholar]
  19. Chen, L.; Hong, J. Fuzzy PID controller design for electro hydraulic servo systems. Theor. Algorithms 2021, 11, 9. [Google Scholar]
  20. Zelenov, M.S.; Chernyshev, A.V. Research of the proportional valve effectivearea dependence on the control signal and the differential pressure. AIP Conf. Proc. 2021, 2318, 130012. [Google Scholar]
  21. Erzan Topçu, E.L.İ.F.; Bali, E. Modeling and analysis of an electro-pneumatic brake valve with on-off type solenoid driven by PWM technique. J. Fac. Eng. Archit. Gazi Univ. 2021, 36, 1418–1430. [Google Scholar]
  22. Li, W.; Liu, J.; Chai, B. Research and simulation of fuzzy-PID control system for energy-saving hydraulic pump. Control Eng. 2017, 24, 1347–1351. [Google Scholar]
  23. Liu, J.; Liu, Z.; Chen, J.; Wang, L. Research of vibration control on nonlinear rotor system with fuzzy-PID. J. Syst. Simul. 2017, 29, 200–205. [Google Scholar]
  24. Aftab, A.; Luan, X.C. A fuzzy-PID series feedback self-tuned adaptive control of reactor power using nonlinear multipoint kinetic model under reference tracking and disturbance rejection. Ann. Nucl. Energy 2021, 166, 108696. [Google Scholar] [CrossRef]
  25. Liu, J. Advanced PID Control and Its Matlab Simulation; Publishing House of Electronics Industry: Beijing, China, January 2003. [Google Scholar]
  26. Xiong, Z.; Liu, Z.; Wang, H.; Huo, J. Design of RBF Neural Network Incremental PID Automatic Steering Control System. Agric. Mech. Res. 2021, 43, 27–32. [Google Scholar]
  27. Zhao, Z.; Xu, Y.; Huang, K.; Li, X. Research on Fuzzy PID Governor Control of Diesel Generator under Pulse Load. Electr. Technol. 2021, 22, 1–6. [Google Scholar]
  28. Zhang, Y.; Du, Y.; Zhao, Y.; Xu, Z. The loss rate of rapeseed was higher than that of mechanical harvest. J. Qual. Superv. Agric. Mach. 2015, 9, 23–26. (In Chinese) [Google Scholar]
  29. Qu, X.; Huang, D.; Cao, F.; Wu, L.P. Did farm machinery reduce rice harvest losses? Acta Agric. Sin. 2019, 24, 165–172. (In Chinese) [Google Scholar]
Figure 1. The 3D transformation diagram and the physical diagram of pulling reel and forward speed.
Agriculture 12 00213 g001
Figure 2. Flow chart of matching adjustment between rotation speed and forward speed of pulling reel.
Agriculture 12 00213 g002
Figure 3. Simulation track diagram of pulling reel. (a) The λ < 1 movement trajectory; (b) The λ = 1 movement trajectory; (c) The λ > 1 movement trajectory
Agriculture 12 00213 g003
Figure 4. Line chart of rice loss rate.
Agriculture 12 00213 g004
Figure 5. The line chart of millet loss rate.
Agriculture 12 00213 g005
Figure 6. Rape-loss-rate line chart.
Agriculture 12 00213 g006
Figure 7. Motion track of the reel.
Agriculture 12 00213 g007
Figure 8. Control flow chart.
Agriculture 12 00213 g008
Figure 10. Proportional solenoid valve drive hydraulic motor schematic diagram.
Agriculture 12 00213 g010
Figure 11. Closed-loop system of hydraulic motor controlled by proportional solenoid valve.
Agriculture 12 00213 g011
Figure 12. Simulation results of closed-loop system of hydraulic motor controlled by proportional solenoid valve. (a) Time-dependent flow chart. (b) Variation diagram of rotational speed with electrical signal. (c) Time-dependent diagram of rotational speed.
Agriculture 12 00213 g012
Figure 13. Surface view.
Agriculture 12 00213 g013
Figure 14. Simulation model.
Agriculture 12 00213 g014
Figure 15. Response curve.
Agriculture 12 00213 g015
Figure 16. Test diagram. (a) Rice experiment; (b) Sampling slot method; (c) Rape experiment; (d) Millet experiment.
Agriculture 12 00213 g016aAgriculture 12 00213 g016b
Figure 17. Comparison of loss rates of three crops under two conditions. (a) Rice experiment; (b) Rape experiment; (c) Millet experiment.
Agriculture 12 00213 g017
Figure 18. Control-system parameter collection interface.
Agriculture 12 00213 g018
Table 1. Table of rice loss rate.
Test NumberWeeding Speed RatioTotal Loss Mass (kg)Total Harvest Mass (kg)Loss Ratio (%)
110.58819.63.0
21.10.48618.72.6
31.20.50420.12.51
41.30.36119.01.9
51.40.21517.91.2
61.50.24119.31.25
71.60.23820.51.16
81.70.21418.51.30
91.80.22618.71.21
101.90.38819.42.0
112.00.54520.22.70
Table 2. Table of millet loss rate.
Test NumberWeeding Speed RatioTotal Loss Mass (kg)Total Harvest Mass (kg)Loss Ratio %
110.27512.52.2
21.10.22611.91.9
31.20.15912.21.30
41.30.14211.81.20
51.40.15113.11.15
61.50.14912.61.18
71.60.10111.20.90
81.70.15412.61.22
91.80.21512.81.68
101.90.25013.01.92
112.00.29512.32.40
Table 3. Rape-loss-rate table.
Test NumberWeeding Speed RatioTotal Loss Mass (kg)Total Harvest Mass (kg)Loss Ratio (%)
110.26510.62.5
21.10.21810.42.10
31.20.1399.91.40
41.30.12210.21.20
51.40.13110.51.25
61.50.13410.31.30
71.60.1309.61.35
81.70.17410.11.72
91.80.19010.31.84
101.90.21010.42.02
112.00.24610.72.30
Table 4. Parameters of hydraulic motor and proportional solenoid valve.
kq8.66 × 10−4Wh9.5Displacement ml/r500
D m 10 × 10−6 ξ h 6.58Flow rate ml/r58
k c e 3.2 × 10⁻¹² β e 0.55Rotational speed r/min128
v t 1.5 × 2 × 3.14 × Dm t L 464Pressure mp9
X v 5.76 Torque N.m464
Table 5. Fuzzy control rules.
ECE
NBNSZRPSPB
NBPBPBPSPSZR
NSPBPSPSZRZR
ZRPSPSZRZRNS
PSPSZRZRNSNS
PBZRZRNSNSNB
Table 6. Value and error of actual and theoretical speed of rotary wheel.
Test NumberForward Speed Vm (m/s)nTheory(r) (min)nActual (r) (min)Error (%)
11.047.548.01.04
21.258.257.31.57
31.465.766.81.65
41.677.076.40.78
51.888.690.00.44
62.096.695.51.01
Table 7. The loss-rate table under matching rice rotation speed and the loss-rate table under random rotation speed and forward speed.
(Speed Match)
Test Number
Loss Ratio (%)(Random Speed)
Test Number
Loss Ratio (%)
11.3611.63
21.2421.92
31.2131.68
41.3441.77
51.4151.67
61.2861.88
Table 8. The loss-rate table under speed-matching of rape and the loss-rate table under speed and forward speed of random rotation wheel.
(Speed Match)
Test Number
Loss Ratio (%)(Random Speed)
Test Number
Loss Ratio (%)
11.2511.71
21.1921.68
31.3331.76
41.2941.81
51.2752.06
61.3161.94
Table 9. The loss-rate table under matching grain speed and the loss-rate table under random rotary speed and forward speed.
(Speed Match)
Test Number
Loss Ratio (%)(Random Speed)
Test Number
Loss Ratio (%)
11.1511.76
21.2321.84
31.1631.81
41.1941.78
51.3351.69
61.2861.78
Publisher’s Note: MDPI stays neutral with regard to jurisdictional claims in published maps and institutional affiliations.

