Article

Optimized Nitrogen Rate, Plant Density, and Regulated Irrigation Improved Grain, Biomass Yields, and Water Use Efficiency of Maize at the Oasis Irrigation Region of China

1
State Key Laboratory of Aridland Crop Science, Gansu Agricultural University, Lanzhou 730070, China
2
College of Agronomy, Gansu Agricultural University, Lanzhou 730070, China
3
Council for Scientific and Industrial Research—Savanna Agricultural Research Institute, Bawku P.O. Box 46, Ghana
*
Author to whom correspondence should be addressed.
Agriculture 2022, 12(2), 234; https://doi.org/10.3390/agriculture12020234
Submission received: 8 January 2022 / Revised: 3 February 2022 / Accepted: 4 February 2022 / Published: 6 February 2022
(This article belongs to the Section Crop Production)

Abstract

:
Nitrogen is a key factor in maize (Zea mays L.) grain and biomass production. Inappropriate application with sub-optimum plant density and irrigation can lead to low productivity and inefficient use. A two-year field experiment was conducted to determine which nitrogen rate, plant density, and irrigation level optimize grain, biomass yield, and water use efficiency. Three nitrogen rates of urea (46–0–0 of N–P2O5–K2O) (N0 = 0 kg N ha−1, N1 = 270 kg N ha−1, and N2 = 360 kg N ha−1), with three maize densities (D1 = 75,000 plants ha−1, D2 = 97,500 plants ha−1, and D3 = 120,000 plants ha−1), and two irrigation levels (W1 = 5250 m3/hm2 and W2 = 4740 m3/hm2) were investigated. The results show that both grain and biomass yields were affected by the main factors. The interaction between nitrogen rate and irrigation level significantly (p < 0.001) affected grain yield but not biomass. It was observed that the grain yield increased correspondingly with nitrogen rate and plant density, while it decreased as the irrigation level increased. Water use efficiency was significantly (p < 0.001) affected by the main factors and their interactions. Nevertheless, water use efficiency was highest at (5250 m3/hm2) × 270 kg N ha−1; × 360 kg N ha−1 × 120,000 plants ha−1 and increased from 62% to 68%. In addition, the highest biomass yield was recorded at 5250 m3/hm2 × 270 kg N ha−1; × 360 kg N ha−1 × 120,000 plants ha−1 while the interaction of either irrigation level with 0 and 270 kg ha−1 or 97,500 and 120,000 plants ha−1 yielded the lowest water use efficiency. Thus, optimized nitrogen rates, plant density, and alternate irrigation levels can support optimum grain and biomass yields. It can also improve nitrogen and water use efficiency in maize production.

Graphical Abstract

1. Introduction

Global crop yields are limited by the shortage of water resources and nutrient availability. In this regard, nitrogen (N) is the most limiting nutrient in agricultural production for optimum yield and biomass. It is the major element required for the continuous increase in food production to ensure food security [1]. Nitrogen facilitates biomass accumulation, increases nutrient uptake, balances dry matter production [2,3], and improves grain yield, quality, and the resistance of crops to environmental stress [4]. It has been noted that N deficiency can result in slow growth and development in crops, cause early leaf senescence, and subsequently decreases in both crop productivity and quality [5]. Although optimum N rate and use efficiency are affected by several factors, research suggests that N can be reduced and N use efficiency (NUE) increased without compromising yield [6,7].
High N fertilizer application results in economic losses and ecological hazards due to the extra consumption of resources, water eutrophication, soil acidification, and a high rate of greenhouse gas (GHG) emission [8,9]. Nitrogen losses are often too high and can increase up to 70% due to indiscriminate application, poor application methods, and low plant population [8]. This excessive and inefficient use of N fertilizer results in poor crop yield and an increase in production cost [8,10]. The overuse of N fertilizers in China has led to low NUE [11]. This implies that the low NUE is not only a waste of resources or a problem to environmental sustainability but also a setback for sustainable agriculture [12,13]. Thus, sustainable food production and environmental sustainability are urgent concerns that need to be addressed from an agricultural perspective.
Excessive N application by farmers is a common practice in many regions and it has been reported to prolong the vegetative growth period and delay maturity [5]. This means that sufficient water is needed for plants under such conditions to grow properly. Nowadays, great efforts have been made towards saving water in agriculture, especially in optimizing irrigation methods. Several effective patterns, including limited irrigation and regulated deficit irrigation, have been proposed [14,15]. Due to the scarcity of water resources, improvement in crop water use efficiency in drylands is necessary [16]. Due to population growth, there is an increasing scarcity of water resources needed for food production. Therefore, technologies for improving crop water use efficiency (WUE) are critical for sustainable crop production and food security [16].
Grain, biomass yield, and WUE are mainly limited by available water and deficit irrigation, and scheduling can affect them [14]. Studies on the effects of limited irrigation on crop yield and WUE reported that crop yield can be largely maintained and product quality improved while reducing irrigation volume [17,18]. According to [14], appropriately limited irrigation and controlled soil water content level could lead to higher grain and biomass yields. Alternatively, [19,20] suggested that increasing plant density has the potential to increase WUE in water-scarce environments. This option is better than the conventional method of N application in low plant populations where more N is lost, crop yield is decreased, and available N is low [8]. According to several studies, unfertilized N responses often provides greater yield than fertilizer N [21,22]. This suggests that N consumption by enhanced N fertilization may lead to higher N uptake by plants but not increase biomass production [23]. Moreover, plants grown under excessive N application are more susceptible to lodging (because of shoot overgrowth and tenderness), pest and disease damage, and degraded grain quality [24]. Therefore, best fertilization practices will improve NUE and decrease GHG emission [25], while agronomic principles and practices that utilize modern techniques to enhance NUE will reduce application rates without yield reduction [26].
Research has shown that improving NUE by decreasing the N rate may delay leaf senescence, which results in no yield loss, while late-season leaf senescence due to low N provides a relatively higher photosynthetic capacity to crops and increases yield [8]. A study by [27] demonstrated that N fertilizers can be minimized by 20% without yield loss in Australia, while [28] posit that N fertilizers in China have the potential for increased use efficiency at low rates through integrative management practices. Going by the reports from different regions and countries, it was inferred that NUE can be increased by decreasing N application rates [6,29]. In contrast, low N applications may produce high NUE but result in poor yield and inefficient use of land, water, and other production inputs [30,31]. Thus, we hypothesized that a moderate reduction in N rate under high plant density and deficit irrigation would not affect the grain and biomass yield in the Oasis irrigation region of China, but would increase NUE (grain and biomass yields) and WUE. Therefore, the objective of this study was to determine which N rate, plant density, and irrigation level result in the optimum grain and biomass yield of maize, and at the same time improve WUE in irrigated maize.

2. Materials and Methods

2.1. Experimental Site Description

The experiment was conducted at Gansu Agricultural University Experiment Station in 2018 and 2019, from April to September, on 37°96′ N, 102°64′ E altitude, and 1776 m above sea level. Soils in this area are classified as Aridisol [32]. Average annual sunshine duration, air temperature, precipitation, and potential evaporation in the location are 2945 h, 7.2 °C, 150 mm, and 2400 mm, respectively. Daily precipitation and air temperature data were obtained from the climate data sub-station of Wuwei, which is 100 m away from the experiment field.
During the experiment, soil samples were taken from each replicate (both fertilized and unfertilized plots) at soil depths of 0–30, 30–60, 60–90, 90–120, and 120–150 cm. Samples from each soil depth were bulked and mixed thoroughly. The samples were dried at room temperature in cardboard boxes, ground to fine silt and sieved through a 0.25 mm mesh wire sieve for chemical analysis at the State Key Laboratory of Aridland Crop Science, at Gansu Agricultural University. The analysis of NH4+-N and NO3-N was performed using a Discrete Auto analyzer—SMARTChem 450, USA. Soil total nitrogen (TN) was analyzed using the Kjeldahl digestion method described in [33], while soil bulk density was determined using a metal ring pressed into the soil (intact core), and the weight determined after drying, as described in [34]. The properties of the soil are listed in Table 1. The field for the experiment was cropped with maize the previous year before this experiment was carried out.

2.2. Experimental Layout

The experiment was a 3 × 3 × 2 factorial experiment in a randomized complete block design (RCBD) with three replicates. Each treatment had a plot measuring 7 × 5 m and was separated by a gap of 80 cm. A 50 cm ridge was built between blocks to reduce the potential of water movement between them. The treatment comprised three N rates of urea (46–0–0 of N–P2O5–K2O) (N0 = 0 kg N ha−1, N1 = 270 kg N ha−1, and N2 = 360 kg N ha−1), three densities of maize (D1 = 75,000 plants ha−1, D2 = 97,500 plants ha−1, and D3 = 120,000 plants ha−1), and spacings of 40 × 33 cm, 40 × 26 cm, and 40 × 21 cm, respectively. It was combined with two irrigation levels (W1 = 5250 m3hm2 and W2 = 4740 m3hm2). Drip irrigation lines with valves were connected to water meters to regulate and measure the amount of water irrigated.

2.3. Field Management

A moldboard plough was used to till the soil to a depth of 20 cm in April of both years, followed by a rotary tiller to loosen soil lumps. Nitrogen application was applied in triplicate, with 20% top-dressed and incorporated to 20 cm soil depth using a rotary tiller before maize seeding. The remaining was split into two portions. It was applied by deep placement into the soil at the nine-leaf collar stage and 15 days after flowering. A white plastic film of (120 cm wide and 0.01 mm thickness) was mulched on the plots before maize planting each year. Maize cultivar (Xianyu 335) was planted on 17 and 19 April in 2018 and 2019 using a hand-held pressure-inject planter. Irrigation was carried out at 90, 120, and 90 mm at the nine-leaf, fourteen-leaf, and grain-filling stages, respectively, using drip irrigation lines. Weeds were controlled by hand throughout the crop-growing period in both years. There was no chemical application for weed and pest control, and no diseases and pests were recorded during the experiment.

2.4. Grain and Biomass Yield Sampling

Grain yield was measured in the physiological maturity period of maize. Four rows of non-sampled maize plants with a 3 m length were harvested to determine the grain yield of maize in each treatment. These grains were sun-dried, cleaned, and weighed after threshing with a small grain sheller. Biomass weight of the harvested maize was also collected, as well as the WUE (kg m3), and calculated as described in Equation (1) [35]:
WUE = Y/ETc
where Y is the grain yield (kg ha−1), and ETc is the total actual evapotranspiration over the whole growing season (mm).
ETc = Pe + I + U − R − Dw − ∆S
where Pe is the effective precipitation (mm) as measured by the United States Department of Agriculture Soil Conservation Services [36], I is irrigation quota (mm), U is the upward capillary flow (mm), R is the runoff (mm), Dw is the downward drainage (mm), and ∆S is the change in the soil water stored in a soil layer of 0–150 cm (mm).

2.5. Statistical Analysis

The data were analyzed using a general linear model in GenStat (edition 12.1) for variations in means at a 5% significance level. Where differences were indicated (p ≤ 0.001), Duncan’s multiple comparison test was used to separate the means. Pearson correlation test was used to determine the associations between the grain, biomass yield, and WUE, also at a 5% significance level

3. Results

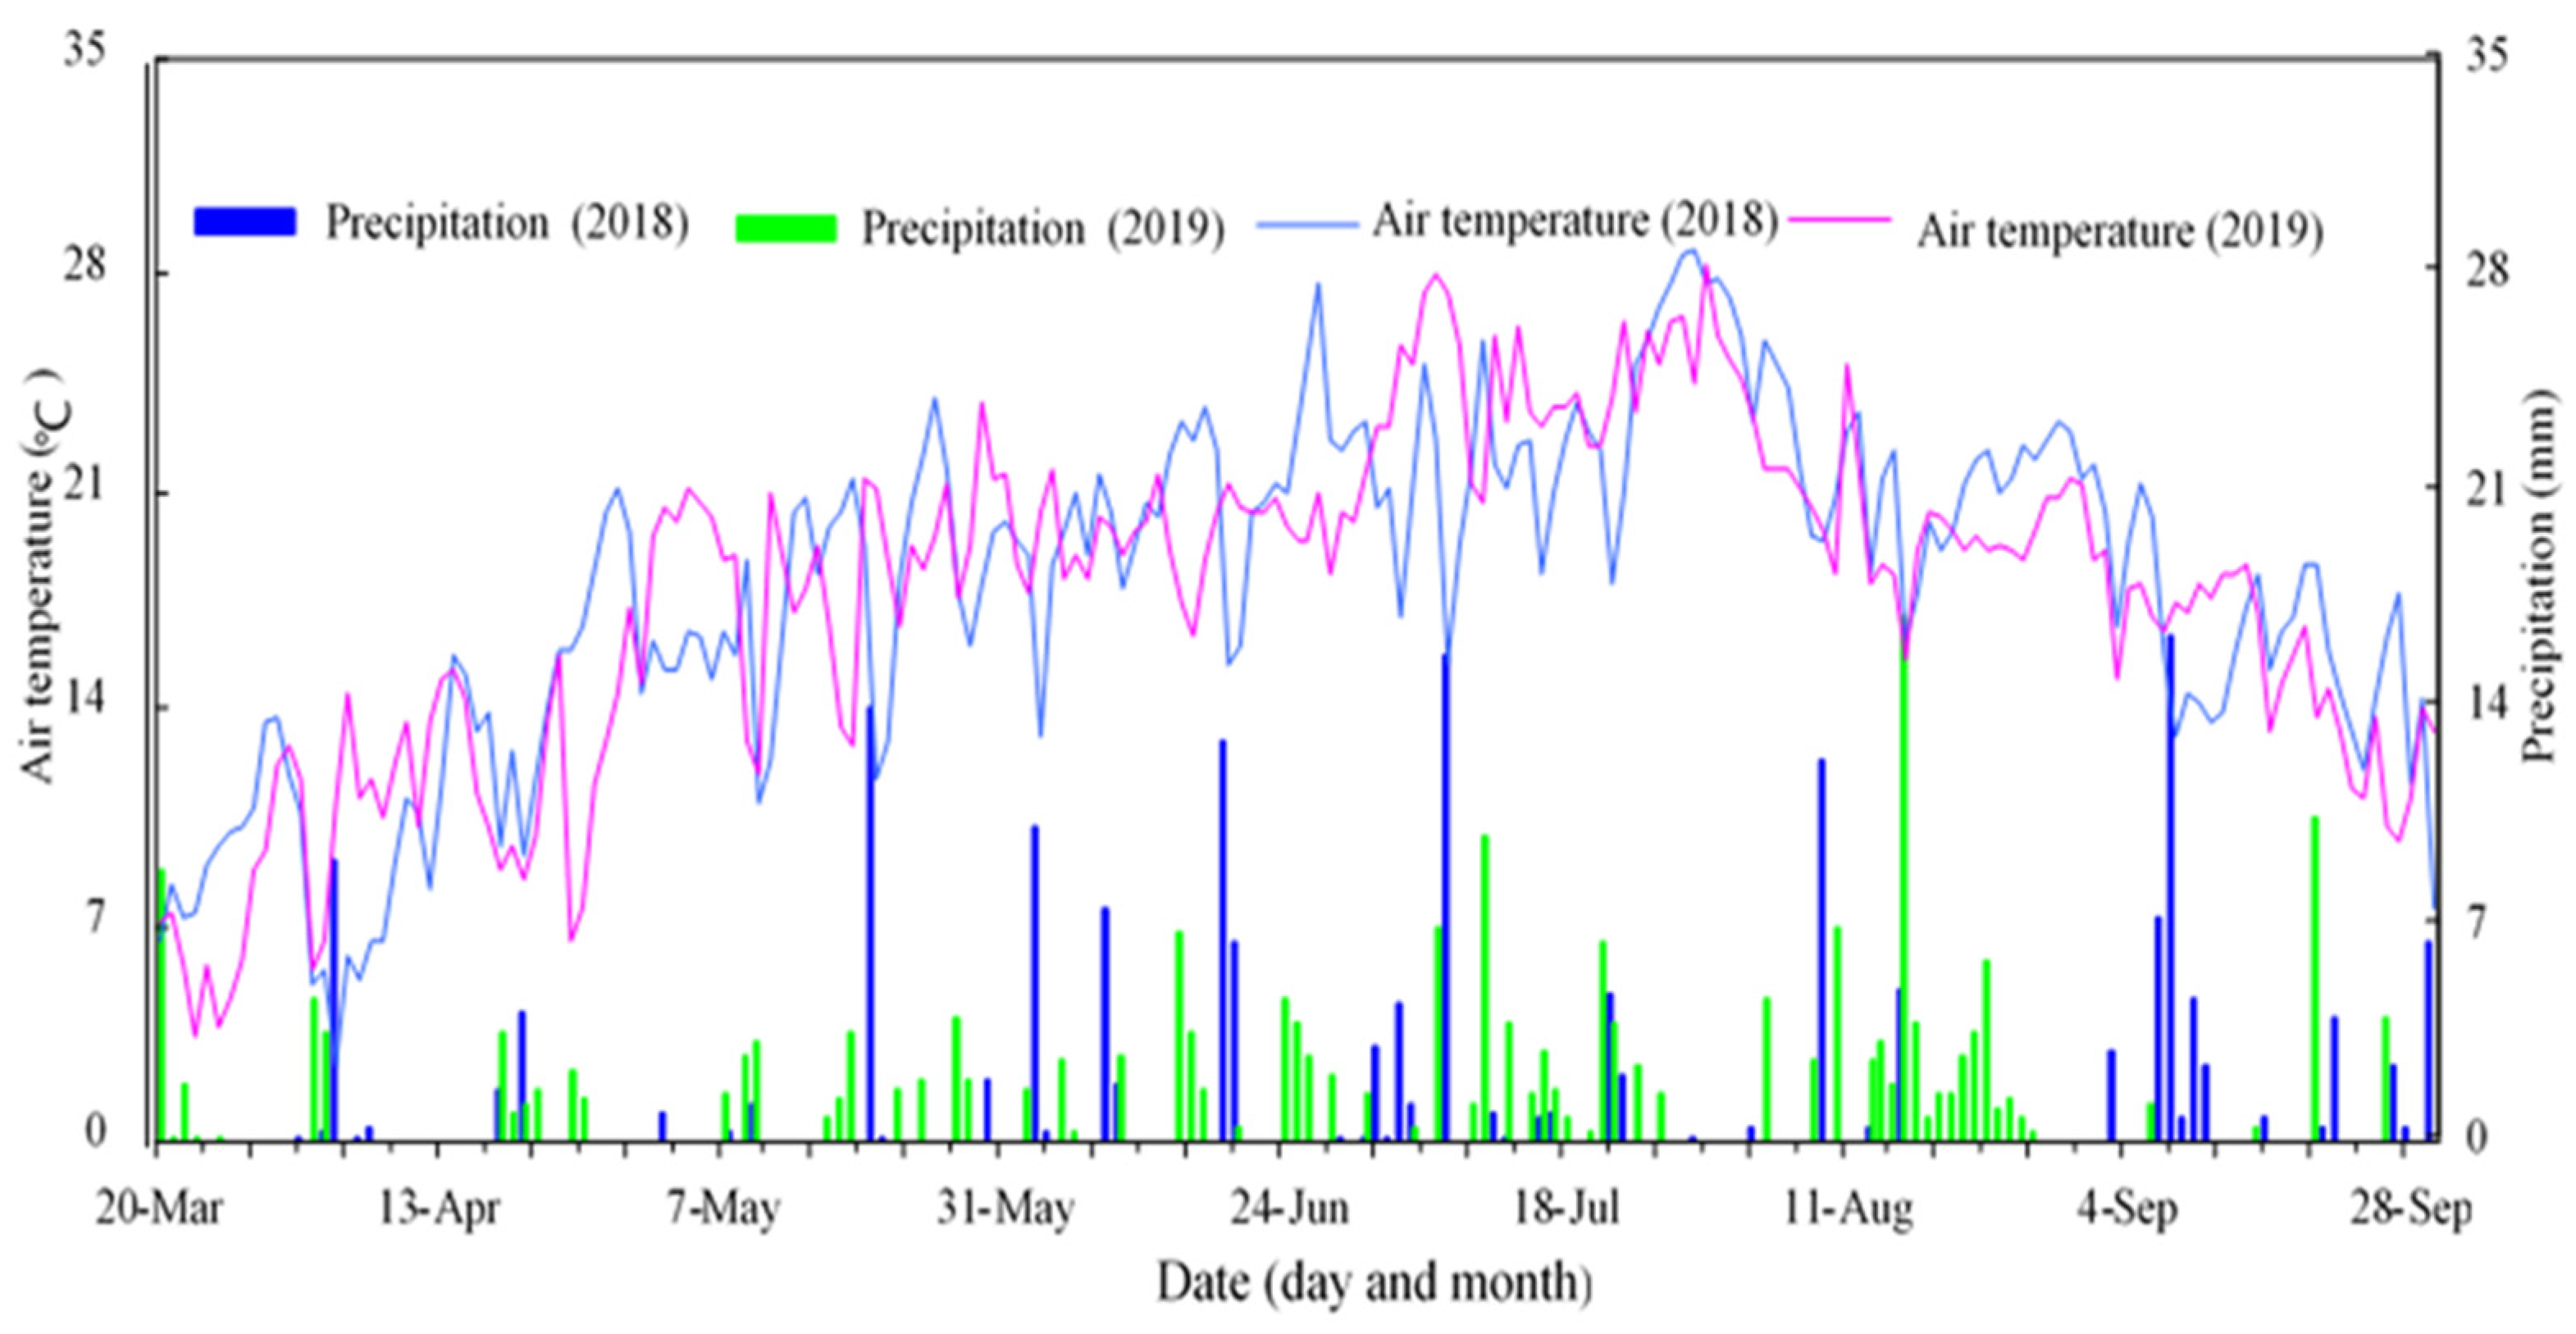
3.1. Physicochemical Properties of Soil and Key Weather Parameters during the Study Period

The contents of NH4+-N, NO3-N, total nitrogen (TN), and soil bulk density were taken from soil depths ranging from 0–30, 30–60, 60–90, 90–120, to 120–150 cm for both 2018 and 2019 (Table 1). In 2018, the content of NH4+-N showed a slight decrease as the sampling depth increased from 0 to 90 cm while it increased with sampling depth from 90 to 150 cm. In 2019, the NH4+-N content decreased with sampling depth from 0 to 60 cm, increased at 60 to 90 cm, and then decreased at 90–150 cm. Additionally, soil NO3-N was observed to increase from depths of 0 to 60 cm before decreasing thereafter, with increasing depth in 2018 (60–150 cm). In 2019, the content of NO3-N increased from a depth of 0 to 90 cm before decreasing further below ground (90 to 150 cm). Comparatively, the contents of NH4+-N and NO3-N in 2019 were higher than that in 2018, which suggests that the applied treatments can improve the different N forms required for plant growth. There were significant differences between NH4+-N and NO3-N in soil depths and by year (2018 and 2019). Additionally, soil TN decreased from 0 to 90 cm, increased from 90 to 120 cm, and decreased from 120 to 150 cm in 2018, while in 2019, the trend was increased from 0 to 60 cm and decreased from 60 to 150 cm. The soil bulk density generally decreased with sampling depth except at 60 to 90 cm, and little change was observed between the values of 2018 and 2019. This indicates that sustainable agronomic practices could significantly improve soil N content without disturbing the nature of the soil at the different depths.
Air temperature and precipitation were recorded in 2018 and 2019 during the experiment (Figure 1). They were recorded from March through to September each year till maize was harvested. In 2018 the highest precipitation was recorded in August (53.7 mm) while the highest in 2019 was recorded in June (41.6 mm). The highest temperature was recorded in July 28.3 and 23.9 °C in both 2018 and 2019, respectively. Additionally, the average rainfall and temperature were 0.99 mm and 15.2 °C in 2018 and 0.75 mm and 14.8 °C, respectively.

3.2. Effect of Irrigation Level, N Rate, and Plant Density on Grain Yield (kg ha−1) of Maize

The effect of irrigation level, N rate and plant density on the grain yield of maize is illustrated in Figure 2. Irrigation level did not have any significant (p = 0.522) effect on grain yield in 2018, hence the grain yields of both W1 (5250 m3/hm2) and W2 (4740 m3/hm2) were statistically similar even though the value for W2 was numerically higher. The grain yield in 2019 was significantly (p < 0.001) affected by the irrigation level, with W2 having a significantly higher yield than W1. Additionally, grain yield for W1 decreased significantly in 2019 when compared with the 2018 value, while that of W2 remained fairly similar (Figure 2A).
The rate of N applied had a significant (p < 0.001) positive effect on grain yield for both 2018 and 2019 (Figure 2B). The yield increased with an increase in N rate from 0 kg N ha−1 (N0) to 360 kg N ha−1 (N2) for both years. However, the yield for 2019 was generally lower compared with that of 2018, except for N0. The yields of N1 and N2 were statistically similar but differed significantly from that of N0 for the year 2018. The yields for the different N rates in 2019, on the other hand, all varied significantly from one another.
Plant density also significantly (p < 0.001) influenced grain yield in both 2018 and 2019 (Figure 2C), with respective p-values of 0.008 and 0.037. For the year 2018, the yields of D1 differed significantly from D2, while in 2019 they differed significantly from D3. Additionally, the grain yield corresponded positively with plant density from 75,000 plants ha−1 (D1) to 97,500 plants ha−1 (D2) but declined marginally at 120,000 plants ha−1 (D3) for 2018. However, there was a linear increase in grain yield with plant density for 2019. There was a general marginal reduction in grain yield for the year 2019 as compared with 2018.
In terms of interaction effects, only the interaction between irrigation level and N rate produced a significant (p = 0.043) variation (Table 2) in grain yield. The interactions between irrigation level and plant density (p = 0.398) (Table 3), N rate and plant density (p = 0.116) (Table 4), as well as the three-factor interaction (p = 0.384) (Table 5), did not have any marked consequence on grain yield. Notably, it was observed that decreasing the irrigation level while increasing N rate slightly increased grain yield irrespective of the year of cultivation, except for N1 and N2 in 2018, where the yields were higher at W1 as compared with W2. Though there was a general increase in grain yield as both N rate and plant density increased, except for a decline at N2D3 for 2018, there was no significant difference between treatments and between years. Nonetheless, the highest grain yield for 2018 (16,584 kg ha−1), which was recorded by W1N2D2, was about 62% higher than the lowest, recorded at W1N0D1. For 2019, the highest grain yield was recorded from W2N2D3, about 68% higher than the lowest, recorded from W1N0D1, though there were no significant differences between the years.

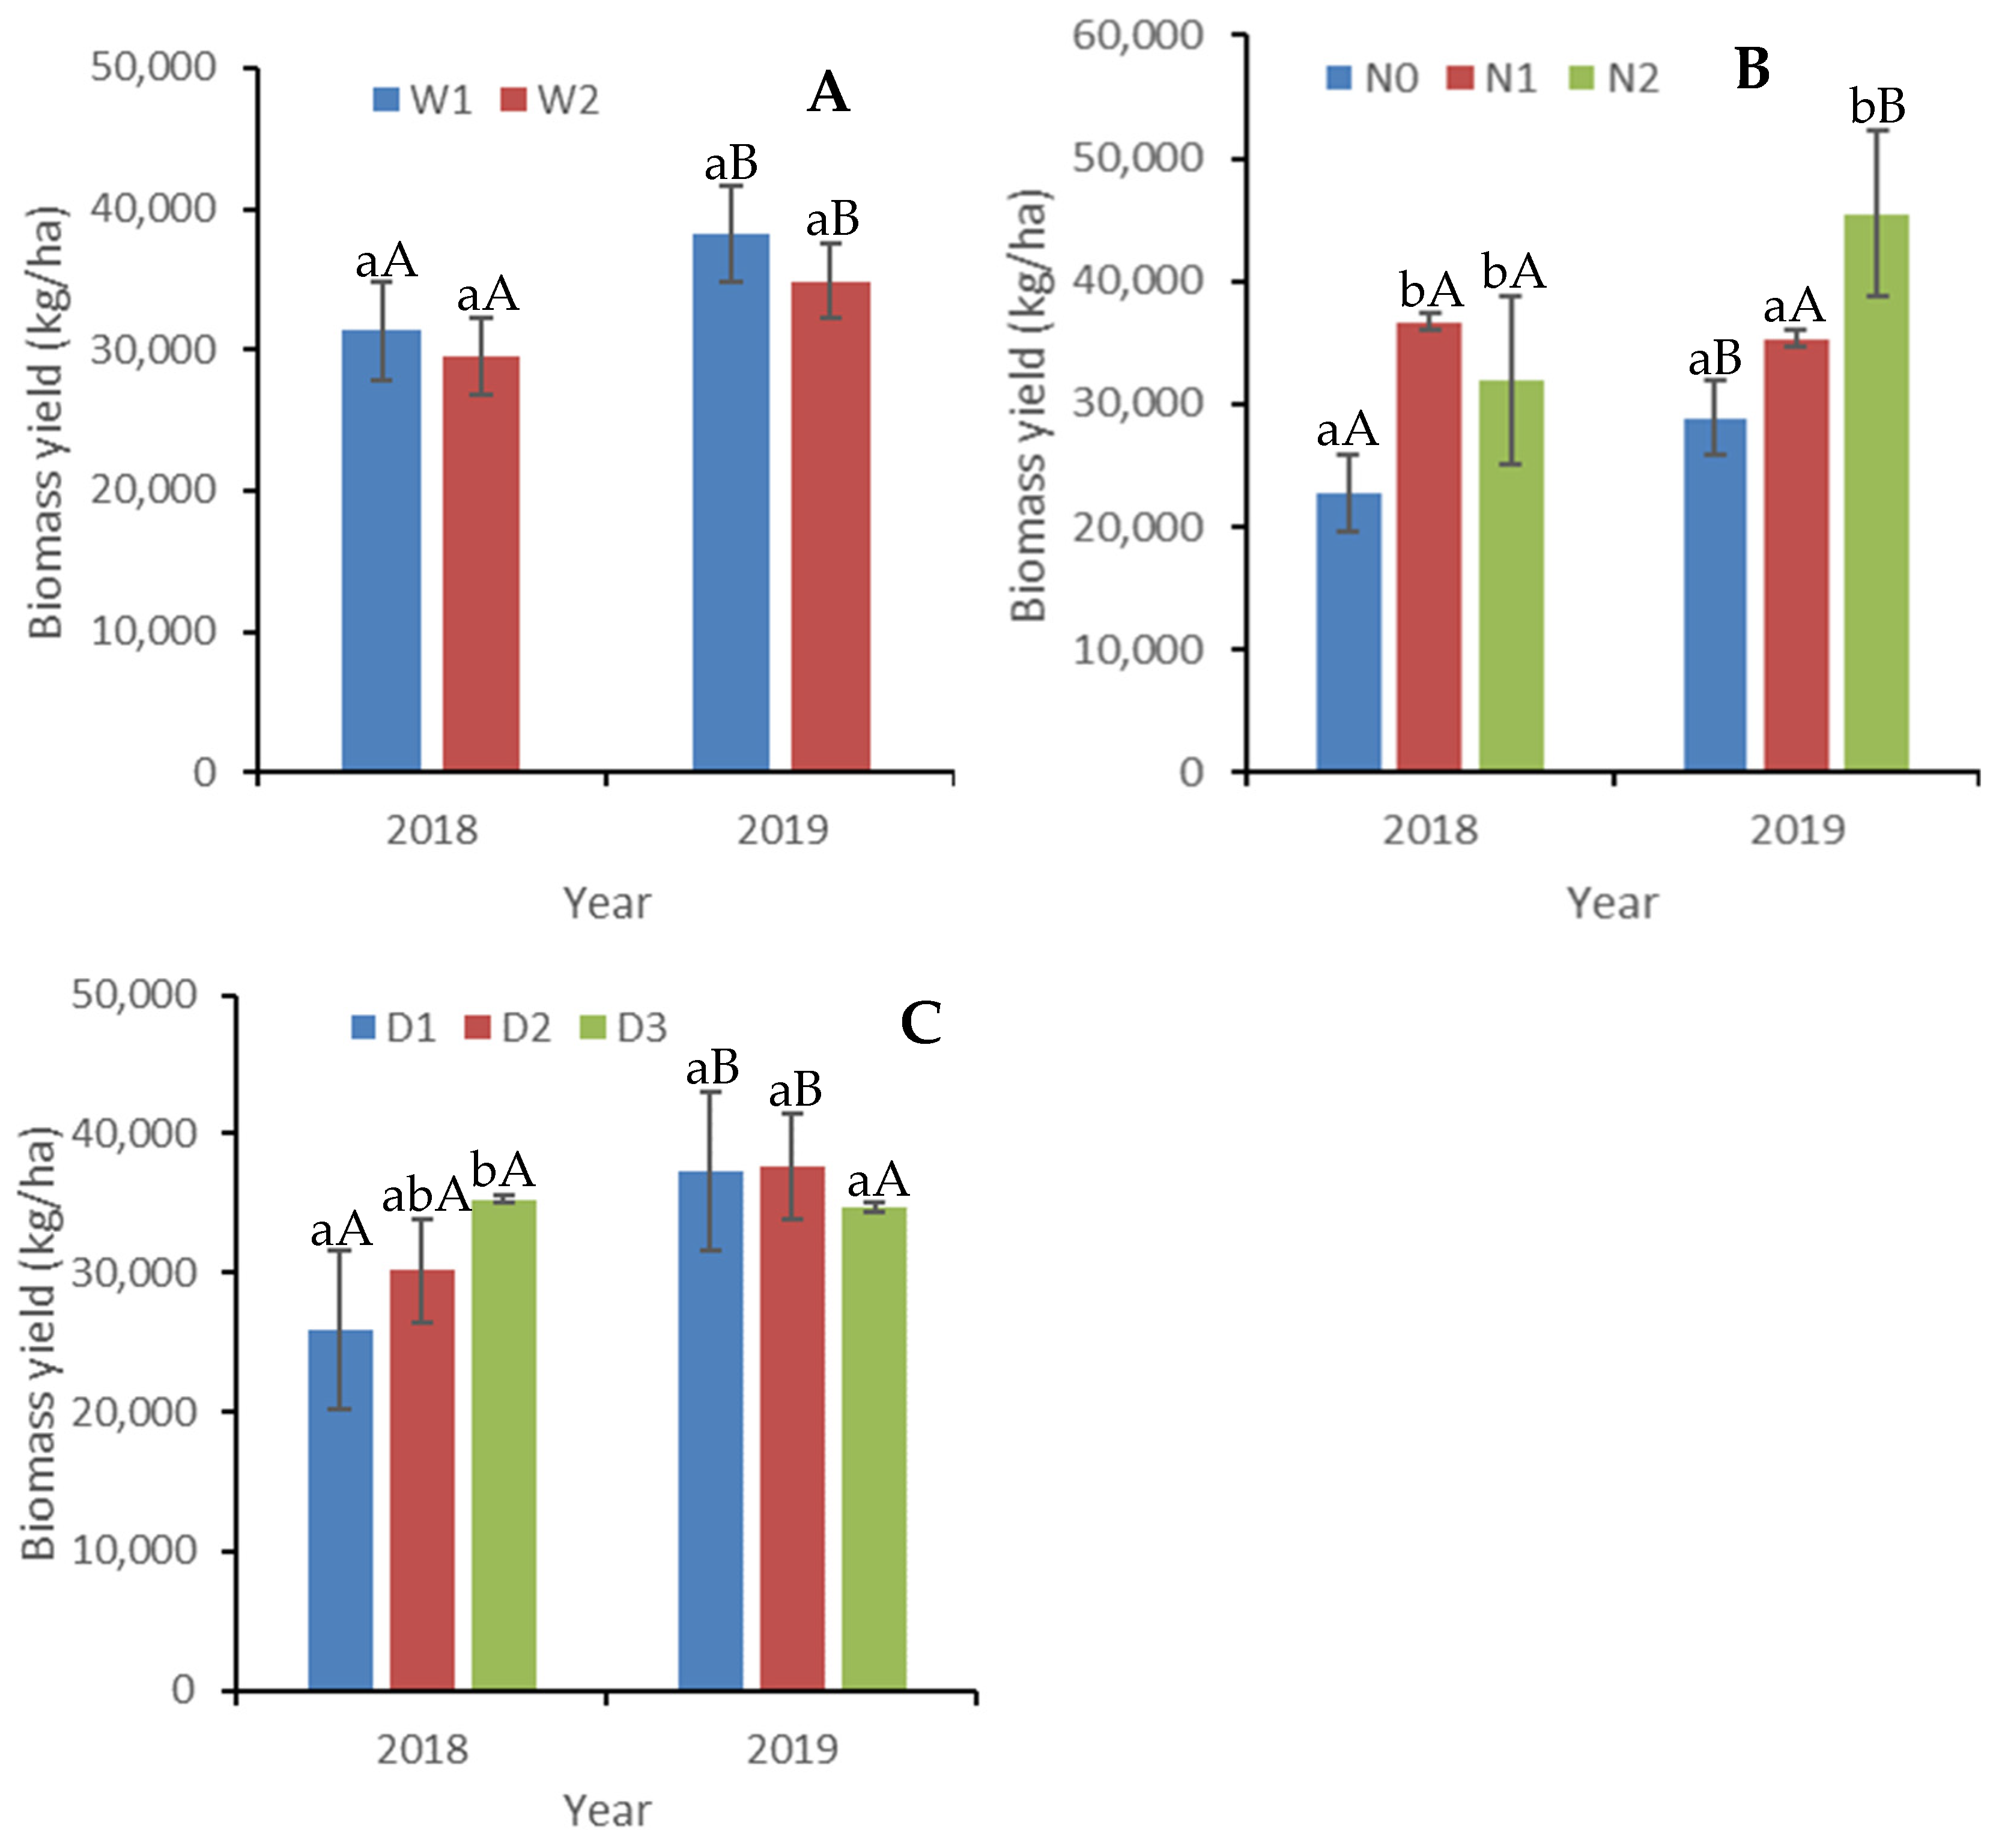
3.3. Effect of Irrigation Level, N Rate, and Plant Density on Biomass Yield (kg ha−1) of Maize

Figure 3 shows how irrigation level, N rate, and plant density influenced the biomass yield of maize. Figure 3A shows that irrigation level had no significant influence on biomass yields in 2018 (p = 0.421) and 2019 (p = 0.377). Nonetheless, biomass yields marginally increased with an increase in irrigation level for both years. The biomass recorded in 2019 was significantly higher compared with that recorded in 2018. Nitrogen rate had a marked effect (p < 0.001 and p = 0.004) individually on the biomass yield of maize for both 2018 and 2019. For the year 2018, it was discovered that N1 and N2 were statistically similar but differed positively from N0, with N1 nonetheless recording the highest value (Figure 3B). In 2019, the biomass yield corresponded with a change in N rate, with N2 differing significantly from N0 and N1. There was a marked increase in biomass yield in 2019 compared with 2018, with a slight exception for values of N1. Regarding the effect of plant density on biomass yield, a noticeable (p = 0.006) effect was only recorded in 2018, and not in 2019 (p = 0.782). The biomass yield increased as plant density increased, and a significant variation was only observed between D1 and D3. Biomass yield for 2019 was substantially higher as compared with that of 2018, except for D3 (Figure 3C).
In terms of combined effect (Table 2, Table 3, Table 4 and Table 5), there was no significant effect on the biomass yield of maize for both years, as their p-values were all above 0.05. The biomass generally increased as irrigation level and N rate increased for both years. A similar observation was made for the combination of irrigation level and plant density. There were also no special trends observed in the biomass yield in relation to the three-factor interactions. However, the highest (44,146 kg ha−1) biomass yield in 2018 was recorded in W1N1D3 and the lowest (16,195 kg ha−1) in W1N0D2. In 2019, W1N2D2, which recorded the highest (57,765 kg ha−1), was about 62% higher than the lowest, recorded in W1N0D3.

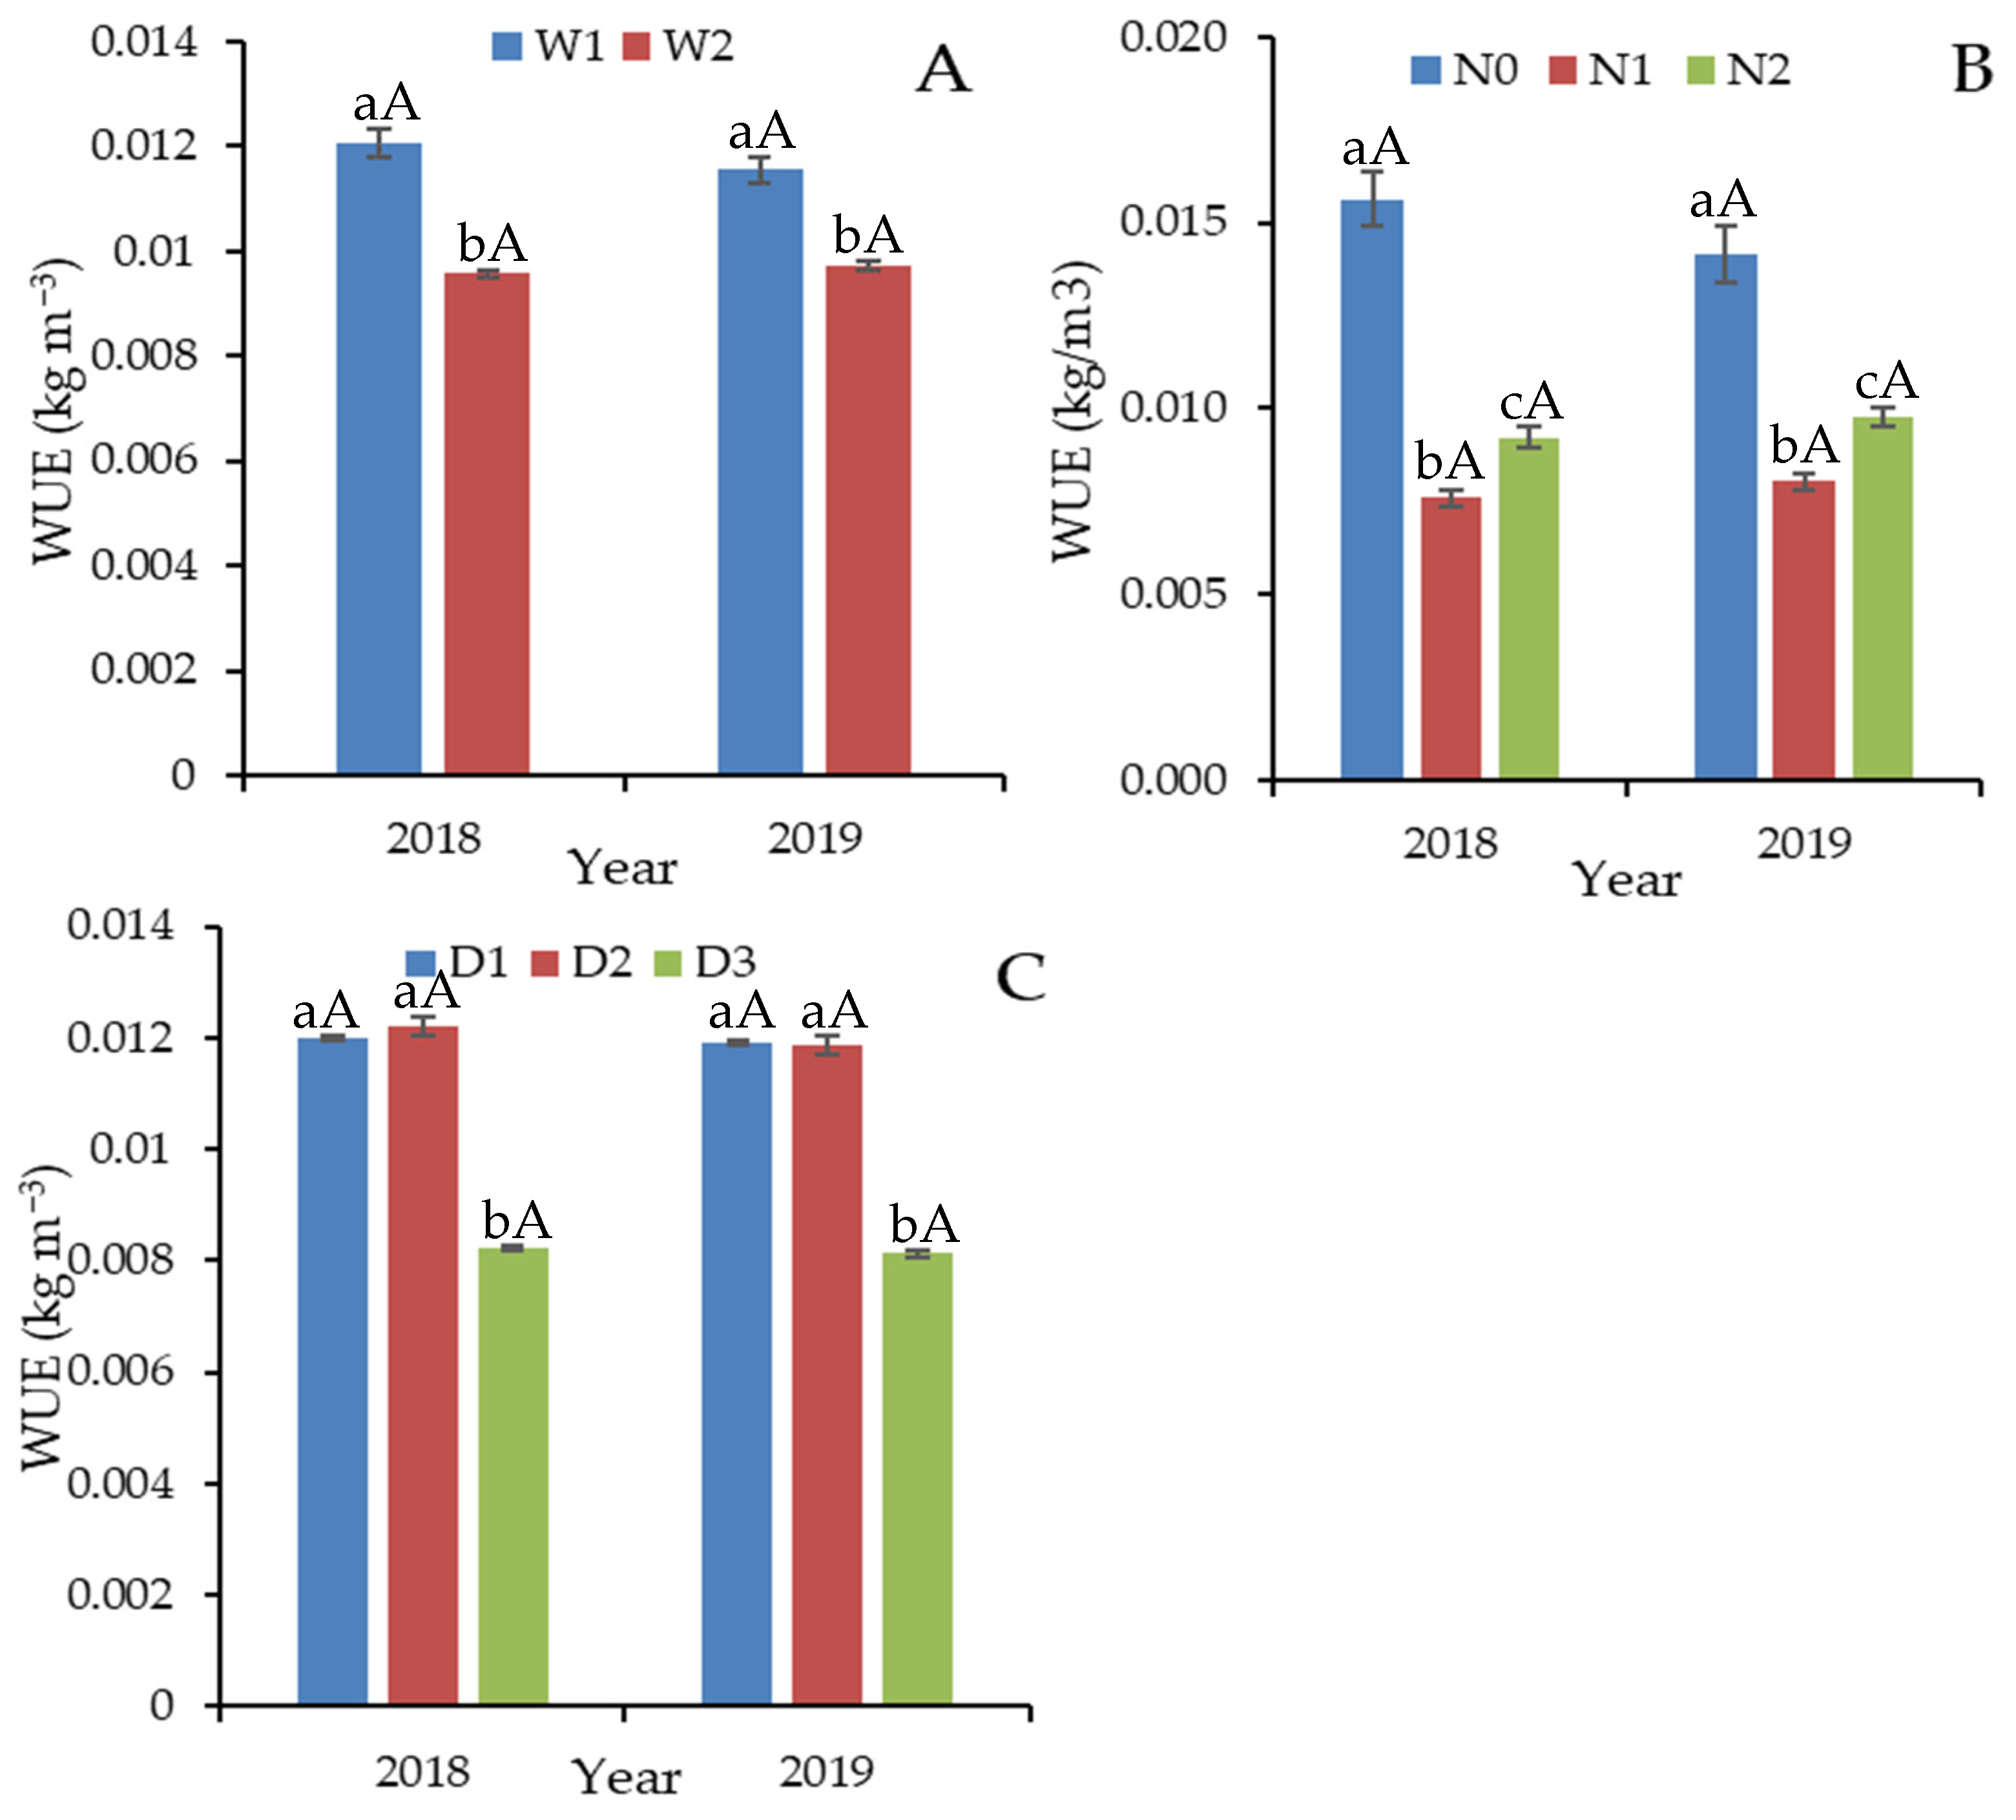
3.4. Effect of Irrigation Level, Nitrogen Rate, and Plant Density on WUE of Maize

Figure 4 shows that WUE was considerably (p < 0.001) influenced by the irrigation level, N rate, and plant density for both years. In terms of irrigation level (Figure 4A), WUE increased as the irrigation level increased, irrespective of the year. Nevertheless, the WUE for W1 was marginally higher in 2018 than in 2019, while that of W2 remained fairly similar for the two years. Generally, WUE values were not significantly (p > 0.001) different between the two years (2018 and 2019). Nitrogen rate generally decreased with the WUE, as values of N1 and N2 were significantly lower than that of N0 for the two years. Water use efficiency for N0, N1, and N2 rates varied significantly (p < 0.001) from one another (Figure 4B), with N0 recording the highest values in 2018 and 2019. Plant density showed a significant (p < 0.001) effect on WUE for both 2018 and 2019, with D3 registering significantly lower values than D1 and D2 in both years (Figure 4C). Plant density at 75,000 and 97,500 plants ha−1 did not significantly differ, but differed at 120,000 plants ha−1 in both years (2018 and 2019). However, WUE was higher in D2 for both years, while D3 remained lower and indifferent for 2018 and 2019.
Water use efficiency was significantly affected by all the interactions between/among the factors, as their p-values were far lower than 0.001. The combination of 5250 m3/hm2 with 0 kg N ha−1 levels was found to result in higher WUE as compared with 270 and 360 kg N ha−1 for both years (2018 and 2019). Water use efficiency values declined with an increase in plant density on 5250 m3/hm2 and 4740 m3/hm2 for both 2018 and 2019. However, plant density at 120,000 plants ha−1 with 0, 270, and 360 kg N ha−1 in both years resulted in a lower WUE. Combining all three factors, WUE was the lowest (0.006 kg/m3) at both W1N1D3 and W2N1D3, and the highest (0.026 kg/m3) at W1N0D2 in 2018. This means that alternating irrigation levels with lower nitrogen rate and higher plant density reduces water use efficiency, but increases grain and biomass yields in maize. In 2019, the lowest (0.006 kg/m3) and highest (0.023 kg/m3) WUE were also recorded on W2N1D3 and W1N0D2, respectively.
Table 6 shows how grain yield, biomass, and WUE are associated with each other. A strong positive significant relationship existed between grain yield and biomass yield. This shows that as the biomass yield increased, the grain yields also increased. Grain yield and WUE had a significant negative relationship, showing that as the WUE increased, the grain yields decreased. A significant negative link was observed between biomass and WUE.

4. Discussion

Sustainable agronomic practices aimed at enhancing N use are paramount. Farmers apply higher amounts of N fertilizers to arable lands, and overapplication and inappropriate management reduces NUE, escalates resource constraints, and increases N footprints. In this study, the grain yield increased as the N rate was increased (Figure 2B). This finding agrees with [37], where the increase in N application with higher plant density corresponded to higher grain yield. The higher yield can be attributed to higher kernel numbers. This clearly shows that the N content in the soil, without N application (N0 kg N ha−1 treatments) before and during the experiment (Table 1) was not enough to produce higher maize grain yields, as 0 kg N ha−1 recorded the lowest yield. Thus, 270 to 360 kg N ha−1 was needed to produce maximum yield. These findings are similar to the findings of [38], who observed an increase in grain yield when N rate was increased. Moreover, the findings in this study contradict [39], where grain yield was higher with increased plant density and lower N application. Elsewhere, [40] reported that grain yield was directly related to the applied N rate and the yield was higher for the second year of cultivation than the first year. Again, this disagrees with our findings, where grain yield for the second year was generally lower than the first year. Additionally, in their study, [41] showed that an increase in grain yield corresponded to a higher irrigation level and N rate. These findings partially agree with our results, where grain yield was higher in 2018 with higher irrigation, but was significantly affected in 2019. In other studies, contrary results have been reported which may be related to the difference in the values of the different parameters considered in our study. For instance, [42] found that N rate (0–240 kg N ha−1) and plant density (33,333, 44,444, and 55,555 plants ha−1) did not significantly influence grain yield, neither was there a linear trend observed. This does not entirely agree with our findings since there was a relationship between nitrogen rate and plant density. Higher nitrogen rate and higher plant density stimulated maize productivity.
Additionally, other researchers found that irrigation level, N rate, and their interaction had a significant effect on the yield of maize irrespective of the year of cultivation [43,44], where higher nitrogen rates and irrigation levels increased grain yield substantially. These findings partially differed from the findings of this study as irrigation level did not have much substantial influence on maize yield in both years. Notwithstanding, we think that the variation in N in the soil before the experiment could partly contribute, and supported grain and biomass yield variations in 2018 and 2019, since 0 kg N ha−1 recorded the lowest yields. Though soil N was lower in 2018 than in 2019, grain yield was lower in W2 in 2019. Yearly higher N and irrigation could affect soil N and hence grain yield. This indicates that soil N content can be significantly improved without disturbing the nature of the soil at the different depths.
Environmental factors such as soil properties, temperature and climate change, which vary from one geographical zone to another and from one year to another, have been reported to have a substantial influence on the grain yield of maize [42], as shown in Figure 1 and Table 1. This may best explain some of the variations between the findings of this study (between the different years) and previous studies. Excessive N input and water supply have been reported to adversely affect yield [45]; however, this was not entirely the case in this research, which recorded higher yields with higher N application and plant density with alternate irrigation. This suggests that N rates and irrigation applied in this study were not excessive beyond the amount required by the maize plants. This shows that the irrigation levels and N rates used in this study promoted N uptake to enhance yield. On the other hand, higher N rates in both years (2018 and 2019) with plant densities of up to 97,500 and 120,000 plants ha−1 with alternating irrigation gave higher yields and were most likely to give maximum grain yield depending on the year of cultivation.
Biomass yield was generally affected by irrigation level in 2018 and 2019. This means that higher irrigation level of 5250 m3hm2 generated higher biomass compared with the low irrigation of 4740 m3hm2. This relationship may not be entirely linear at irrigation levels beyond 5250 m3hm2, as excess water supply, which has been reported to prolong the growth and maturity of maize [45], may affect production negatively, as was observed in this study. The trend observed concerning the effect of irrigation level on biomass corroborates with the trends found in similar studies [43,44], which state that nitrogen rate and irrigation regime affect the yield and water use efficiency of crops. The effect of the N rate on biomass yield is similar in trend to that reported by [46], which states that higher N rates can result in higher biomass yield. However, the relatively higher biomass yields at a higher irrigation level (5250 m3hm2) for both years in terms of the main effect suggests that the total weight of maize plant increased as the amount of water applied increased, showing no signs of prolonged vegetative growth stage and maturity, as postulated by [45]. Three-factor interaction in both years (2018 and 2019) did not significantly affect biomass. Thus, the highest biomass yields shown by W1N1D3 and W1N2D2 for 2018 and 2019, respectively, show that higher irrigation at 5250 m3hm2, 270 to 360 kg N ha−1 and plant density between 97,500 to 120,000 plants ha−1 can lead to optimized biomass yield. This means that a lower nitrogen rate with higher plant density depletes soil nitrogen, and therefore more nitrogen with less plant density was needed to maintain a higher biomass yield in 2019.
Water use efficiency did not correspond to irrigation level but decreased with an increase in N rate and higher plant density. These findings are in tandem with the findings of [47], where WUE was more strongly increased under irrigation. This trend in irrigation levels is contrary to the findings of [48], who found the opposite. The findings on the effect of plant density on WUE in this study differ in trend from that is reported by [49] where WUE generally increased with an increase in plant density of up to (67,500 to 142,500 plants ha−1) irrespective of the year. The decrease in WUE with an increase in plant density observed in this study corroborates previous findings by [47]; this might have been due to high competition for water because of the high density. Nevertheless, the lowest WUE at both W1N1D3 and W2N1D3 shows that alternating irrigation levels with a N rate of 270 kg N ha−1 and 120,000 plants ha−1 may result in inefficient use of water irrespective of the year of cultivation. This suggests that higher plant density with lower nitrogen application might reduce the water use efficiency of crops.

5. Conclusions

Maize growth and yield were studied under varied conditions of irrigation, N rate, and plant density. It was observed that N rate, plant density, and the interaction with irrigation level had significant effects on grain and biomass yields. Increased N rate, alternate irrigation levels, and increased plant density increased grain yields irrespective of the year of cultivation. For the three-factor interaction effect (W1N1D3 and W1N2D3), applying 5250 m3hm2 and 270 kg N ha−1 to 120,000 plants ha−1 recorded the highest (44,146 kg ha−1) biomass yield in 2018, while the application of 5250 m3hm2 and 360 kg N ha−1 to 120,000 plants ha−1 yielded the topmost (57,765 kg ha−1) biomass yield in 2019. In this study, WUE markedly varied with changes in the different factors and all their interactions and increased with higher irrigation. Our results also show that WUE was lowest at the highest plant density and suggest that optimal WUE can be achieved at lower plant density. The interaction of higher plant density × lower nitrogen rate × higher irrigation might result in inefficient use of water, as observed in W1N0D2. A strong and positive relationship existed between grain and biomass yields. This illustrates that as biomass yield increased, the grain yields also increased. Grain yield and WUE had a significant negative relationship, indicating that as WUE increased, grain yield decreased. In conclusion, the interaction of nitrogen, irrigation, and plant density management can effectively reduce nitrogen and water losses, improve WUE and NUE, and consequently optimize the grain and biomass yields of maize.

Author Contributions

Conceptualization, A.E.A.; methodology, A.E.A. and Q.C.; software, A.E.A.; validation, A.E.A., F.H. and Z.F.; formal analysis, A.E.A.; investigation, A.E.A.; resources, F.H., Z.F. and Q.C.; data curation, A.E.A.; writing—original draft preparation, A.E.A.; writing—review and editing, A.E.A. and Q.C.; visualization, A.E.A.; supervision, F.H., Z.F. and Q.C.; project administration, F.H., Z.F. and Q.C.; funding acquisition, F.H., Z.F. and Q.C. All authors have read and agreed to the published version of the manuscript.

Funding

This research was funded by the ‘Double First-Class’ Key Scientific Research Project of Education Department in Gansu Province (GSSYLXM-02), the National Key Research and Development Program of China (2021YFD1700204), and the Joint funds for Regional Innovation and Development of the Natural Science Foundation of China (U21A20218).

Acknowledgments

We extend our sincere gratitude to the research team. We are particularly grateful to all those who in diverse ways supported this research, both in the field and laboratory. We also acknowledge the funding agencies for providing the funds for this research.

Conflicts of Interest

The authors declare no conflict of interest.

References

  1. Zhu, Z.; Chen, D. Nitrogen fertilizer use in China-Contributions to food production, impacts on the environment and best management strategies. Nutr Cycl. Agroecosyst. 2002, 63, 117–127. [Google Scholar] [CrossRef]
  2. Diaz, C.; Saliba-Colombani, V.; Loudet, O.; Belluomo, P.; Moreau, L.; Daniel-Vedele, F.; Morot-Gaudry, J.F.; Masclaux-Daubresse, C. Leaf yellowing and anthocyanin accumulation are two genetically independent strategies in response to nitrogen limitation in Arabidopsis thaliana. Plant. Cell Physiol. 2006, 47, 74–83. [Google Scholar] [CrossRef] [PubMed] [Green Version]
  3. Ding, L.; Wang, K.; Jiang, G.; Biswas, D.; Xu, H.; Li, L.; Li, Y. Effects of nitrogen deficiency on photosynthetic traits of maize hybrids released in different years. Ann. Bot. 2005, 96, 925–930. [Google Scholar] [CrossRef] [PubMed] [Green Version]
  4. Chen, W.; Hou, Z.; Wu, L.; Liang, Y.; Wei, C. Effects of salinity and nitrogen on cotton growth in arid environment. Plant. Soil. 2010, 326, 61–73. [Google Scholar] [CrossRef] [Green Version]
  5. Mao, S. Cotton Farming in China Shanghai; Shanghai Scientific and Technical Press: Shanghai, China, 2013. [Google Scholar]
  6. Clawson, E.L.; Cothren, J.T.; Blouin, D.C.; Satterwhite, J.L. Timing of maturity inultra-narrow and conventional row cotton as affected by nitrogen fertilizer rate. Agron. J. 2008, 100, 421–431. [Google Scholar] [CrossRef]
  7. Janat, M. Response of cotton to irrigation methods and nitrogen fertilization: Yield components water-use efficiency, nitrogen uptake, and recovery. Commun. Soil Sci. Plan. 2008, 39, 2282–2302. [Google Scholar] [CrossRef]
  8. Anas, M.; Liao, F.; Verma, K.K.; Sarwar, M.A.; Mahmood, A.; Chen, Z.L.; Li, Q.; Zeng, X.P.; Liu, Y.; Li, Y.R. Fate of nitrogen in agriculture and environment: Agronomic, eco-physiological and molecular approaches to improve nitrogen use efficiency. Biol. Res. 2020, 53, 1–20. [Google Scholar] [CrossRef]
  9. Shi, R.Y.; Ni, N.; Nkoh, J.N.; Li, J.Y.; Xu, R.K.; Qian, W. Beneficial dual role of biochars in inhibiting soil acidification resulting from nitrification. Chemosphere 2019, 234, 43–51. [Google Scholar] [CrossRef]
  10. Gao, H.; Yan, C.; Liu, Q.; Li, Z.; Yang, X.; Qi, R. Exploring optimal soil mulching to enhance yield and water use efficiency in maize cropping in China: A meta-analysis. Agric. Water Manag. 2019, 225, 105741. [Google Scholar] [CrossRef]
  11. Pan, X.Y.; Baquy, M.A.A.; Guan, P.; Yan, J.; Wang, R.H.; Xu, R.K.; Xie, L. Effect of soil acidification on the growth and nitrogen use efficiency of maize in Ultisols. J. Soils Sediments 2020, 20, 1435–1445. [Google Scholar] [CrossRef]
  12. Wang, X.; Deng, X.; Pu, T.; Song, C.; Yong, T.; Yang, F.; Sun, X.; Liu, W.; Yan, Y.; Du, J. Contribution of interspecific interactions and phosphorus application to increasing soil phosphorus availability in relay intercropping systems. Field Crops Res. 2017, 204, 12–22. [Google Scholar] [CrossRef]
  13. Xing, G.; Zhu, Z. Regional nitrogen budgets for China and its major watersheds. Biogeochemistry 2002, 57, 405–427. [Google Scholar] [CrossRef]
  14. Kang, S.Z.; Zhang, L.; Liang, Y.L.; Hu, X.T.; Cai, H.J.; Gu, B.J. Effects of limited irrigation on yield and water use efficiency of winter wheat in the loess plateau of China. Agric. Water Manag. 2002, 55, 203–216. [Google Scholar] [CrossRef]
  15. Fabeiro, C.; Martin de Santa Olalla, F.; de Juan, J.A. Production of muskmelon (Cucumis melo L.) under controlled deficit irrigation in a semi-arid climate. Agric. Water Manag. 2002, 54, 93–105. [Google Scholar] [CrossRef]
  16. Zhang, Y.; Li, S.; Fu, W.; Wen, H. Effects of nitrogen application on yield, photosynthetic characteristics and water use efficiency of hybrid millet. J. Plant. Nutr. Fertil. 2014, 20, 1119–1126. [Google Scholar]
  17. Zhang, H.; Oweis, T. Water-yield relations and optimal irrigation scheduling of wheat in the Mediterranean region. Agric. Water. Manag. 1999, 38, 195–211. [Google Scholar] [CrossRef]
  18. Zhang, H.; Wang, X.; You, M.; Liu, C. Water-yield relations and water use efficiency of winter wheat in the north China Plain. Irrigation Sci. 1999, 19, 37–45. [Google Scholar] [CrossRef]
  19. Lamm, F.R.; Aiken, R.M.; Kheira, A.A. Corn yield and water use characteristics as affected by tillage, plant density, and irrigation. Trans. ASABE 2009, 52, 133–143. [Google Scholar] [CrossRef] [Green Version]
  20. Al-Kaisi, M.M.; Yin, X. Effects of nitrogen rate, irrigation rate, and plant population on corn yield and water use efficiency. Agron. J. 2003, 95, 1475–1482. [Google Scholar] [CrossRef] [Green Version]
  21. Franco, H.C.; Trivelin, P.C.; Eduardo, F.C.; Vitti, A.C.; Otto, R. Stalk yield and technological attributes of planted cane as related to nitrogen fertilization. Sci. Agric. 2010, 67, 579–590. [Google Scholar] [CrossRef] [Green Version]
  22. Rossetto, R.; Dias, F.; Landell, M.; Cantarella, H.; Tavares, S.; Vitti, A.; Perecin, D. N and K fertilisation of sugarcane ratoons harvested without burning. Proc. Int. Soc. Sugar Cane Technol. 2010, 27, 1–8. [Google Scholar]
  23. Muchow, R.; Robertson, M. Relating crop nitrogen uptake to sugarcane yield. Proc. Int. Soc. Sugar Cane Technol. 1994, 16, 122–130. [Google Scholar]
  24. Zhang, Q. Strategies for developing green super rice. Proc. Natl. Acad. Sci. USA 2007, 104, 16402–16409. [Google Scholar] [CrossRef] [PubMed] [Green Version]
  25. Yan, G.; Zheng, X.; Cui, F.; Yao, Z.; Zhou, Z.; Deng, J.; Xu, Y. Two-year simultaneous records of N2O and NO fluxes from a farmed cropland in the northern China plain with a reduced nitrogen addition rate by one-third. Agr. Ecosyst. Environ. 2013, 178, 39–50. [Google Scholar] [CrossRef]
  26. Luo, Z.; Liu, H.; Li, W.; Zhao, Q.; Dai, J.; Tian, L.; Dong, H. Effects of reduced nitrogen rate on cotton yield and nitrogen use efficiency as mediated by application mode or plant density. Field Crops Res. 2018, 218, 150–157. [Google Scholar] [CrossRef]
  27. Rochester, I.; Ceeney, S.; Maas, S.; Gordon, R.; Hanna, L.; Hill, J. Monitoring nitrogen use efficiency in cotton crops. Austral. Cottongrow 2009, 30, 42. [Google Scholar]
  28. Dong, H.; Kong, X.; Li, W.; Tang, W.; Zhang, D. Effects of plant density and nitrogen and potassium fertilization on cotton yield and uptake of major nutrients in two fields with varying fertility. Field Crops Res. 2010, 119, 106–113. [Google Scholar] [CrossRef]
  29. Kumbhar, A.M.; Buriro, U.A.; Junejo, S.; Oad, F.C.; Jamro, G.H.; Kumbhar, B.A.; Kumbhar, S.A. Impact of different nitrogen levels on cotton growth, yield and N uptake planted in legume rotation. Pak. J. Bot. 2008, 40, 767–778. [Google Scholar]
  30. Ciampitti, I.A.; Vyn, T.J. A comprehensive study of plant density consequences on nitrogen uptake dynamics of maize plants from vegetative to reproductive stages. Field Crops Res. 2011, 121, 2–18. [Google Scholar] [CrossRef]
  31. Abbasi, M.K.; Tahir, M.M.; Sadiq, A.; Iqbal, M.; Zafar, M. Yield and nitrogen use efficiency of rainfed maize response to splitting and nitrogen rates in Kashmir, Pakistan. Agron. J. 2012, 104, 48–457. [Google Scholar] [CrossRef]
  32. Yang, J.S.; Chen, X.B.; Hu, S.J.; Liu, C.Q.; Li, H.; Liu, G.M. Analysis of soil-salt balance and its control in oasis irrigation area. J. Agro-Environ. Sci. 2007, 26, 1438–1443. [Google Scholar]
  33. Selassie, Y.G.; Anemut, F.; Addisu, S. The effects of land use types, management practices and slope classes on selected soil physicochemical properties in Zikre watershed, North-Western Ethiopia. Environ. Syst. Res. 2015, 4, 1–7. [Google Scholar] [CrossRef] [Green Version]
  34. Guo, L.; Zhang, H.; Shi, T.; Chen, Y.; Jiang, Q.; Linderman, M. Prediction of soil organic carbon stock by laboratory spectral data and airborne hyperspectral images. Geoderma 2019, 337, 32–41. [Google Scholar] [CrossRef]
  35. Zhang, J.Y.; Sun, J.S.; Duan, A.W.; Wang, J.L.; Shen, X.J.; Liu, X.F. Effects of different planting patterns on water use and yield performance of winter wheat in the Huang-Huai-Hai plain of China. Agric. Water Manag. 2007, 92, 41–47. [Google Scholar] [CrossRef]
  36. Kuo, S.F.; Ho, S.S.; Liu, C.W. Estimation irrigation water requirements with derived crop coefficients for upland and paddy crops in ChiaNan Irrigation Association, Taiwan. Agric. Water Manag. 2006, 82, 433–451. [Google Scholar] [CrossRef]
  37. ShrEStha, J.; YaDav, D.N.; Amgain, L.P.; SharMa, J.P. Effects of nitrogen and plant density on maize (Zea mays L.) phenology and grain yield. Curr. Agric. Res. J. 2018, 6, 175. [Google Scholar] [CrossRef]
  38. Biswas, D.K.; Ma, B. Effect of nitrogen rate and fertilizer nitrogen source on physiology, yield, grain quality, and nitrogen use efficiency in corn. Can. J. Plant Sci. 2016, 96, 392–403. [Google Scholar] [CrossRef] [Green Version]
  39. SHI, D.Y.; Li, Y.H.; Zhang, J.W.; Peng, L.I.U.; Bin, Z.; Dong, S.T. Increased plant density and reduced N rate lead to more grain yield and higher resource utilization in summer maize. J. Integr. Agric. 2016, 15, 2515–2528. [Google Scholar] [CrossRef] [Green Version]
  40. Belete, F.; Dechassa, N.; Molla, A.; Tana, T. Effect of nitrogen fertilizer rates on grain yield and nitrogen uptake and use efficiency of bread wheat (Triticum aestivum L.) varieties on the Vertisols of central highlands of Ethiopia. Agric. Food Sec. 2018, 7, 1–12. [Google Scholar] [CrossRef]
  41. Hammad, H.M.; Ahmad, A.; Abbas, F.; Farhad, W. Optimizing water and nitrogen use for maize production under semi-arid conditions. Turk. J. Agric. For. 2012, 36, 519–532. [Google Scholar]
  42. Adebayo, A.R.; Sebetha, E.T. Data on influence of different nitrogen fertilizer rates and plant density on grain yield and yield components of Water Efficient Maize (WEMA) variety. Data Br. 2020, 30, 105582. [Google Scholar] [CrossRef] [PubMed]
  43. Campelo, D.H.; Teixeira, A.S.; Moreira, L.C.J.; Lacerda, C.F.D. Growth, production and water and nitrogen use efficiency of maize under water depths and nitrogen fertilization. Rev. Bras. Eng. Agrícola Ambient. 2019, 23, 747–753. [Google Scholar] [CrossRef]
  44. Dong-liang, Q.I.; Tian-tian, H.U.; Xue, S. Effects of nitrogen application rates and irrigation regimes on grain yield and water use efficiency of maize under alternate partial root-zone irrigation. J. Integr. Agric. 2020, 19, 2792–2806. [Google Scholar]
  45. Li, Y.; Cui, S.; Zha, Z.; Zhuang, K.; Wang, Z. Determining effects of water and nitrogen input on maize (Zea mays L.) yield, water- and nitrogen-use efficiency: A global synthesis. Sci. Rep. 2020, 10, 1–12. [Google Scholar] [CrossRef]
  46. Su, W.; Ahmad, S.; Ahmad, I.; Han, Q. Nitrogen fertilization affects maize grain yield through regulating nitrogen uptake, radiation and water use efficiency, photosynthesis and root distribution. PeerJ 2020, 8, e10291. [Google Scholar] [CrossRef]
  47. Ogola, J.B.O.; Wheeler, T.R.; Harris, P.M. Water use of maize in response to planting density and irrigation. South. Afr. J. Tydskr Plant. Grond. 2005, 22, 116–121. [Google Scholar] [CrossRef] [Green Version]
  48. Zhang, G.; Ming, B.; Shen, D.; Xie, R.; Hou, P.; Xue, J.; Li, S. Optimizing grain yield and water use efficiency based on the relationship between leaf area index and evapotranspiration. Agriculture 2021, 11, 313. [Google Scholar] [CrossRef]
  49. Jiang, X.; Tong, L.; Kang, S.; Li, F.; Li, D.; Qin, Y.; Li, J. Planting density affected biomass and grain yield of maize for seed production in an arid region of Northwest China. J. Arid Land 2018, 10, 292–303. [Google Scholar] [CrossRef] [Green Version]
Figure 1. Air temperature and precipitation at the experimental site during the study period (2018 and 2019).
Agriculture 12 00234 g001
Figure 2. The main effects of irrigation level (A), N rate (B), and plant density (C) on the grain yield of maize. Lowercase letters on bars compare means within the same year while the uppercase letters compare means between the two years. Bars with different lowercase letters within the same year are significantly different while those with different uppercase letters across the two years indicate significant differences.
Agriculture 12 00234 g002
Figure 3. The effects of irrigation level (A), N rate (B), and plant density (C) on biomass yield of maize. Lowercase letters on bars compare means within the same year, while the uppercase letters compare means between the two years. Bars with different lowercase letters within the same year are significantly different, while those with different uppercase letters across the two years indicate significant differences.
Agriculture 12 00234 g003
Figure 4. The effects of irrigation level (A), nitrogen rate (B), and plant density (C) on water use efficiency (WUE) of maize. Lowercase letters on bars compare means within the same year, while the uppercase letters compare means between the two years. Bars with different lowercase letters within the same year are significantly different, while those with different uppercase letters across the two years indicate significant differences.
Agriculture 12 00234 g004
Table 1. Soil properties at the experimental site in 2018 and 2019.
20182019
Soil Depth (cm)NH4+-NNO3-NTNBulk DensityNH4+-NNO3-NTNBulk Density
mg kg−1g kg−1g cm−3mg kg−1g kg−1g cm−3
0–3011.0853.6651.5501.25915.9134.2421.6001.251
30–6011.0233.7471.5001.24015.7074.9931.7101.243
60–9011.0003.5751.0001.18016.0775.5671.5001.184
90–12011.9453.5581.4001.21015.5604.8201.4201.200
120–15011.3543.2321.2401.16011.8753.7731.2101.170
TN: total nitrogen.
Table 2. Interaction effect of irrigation level and nitrogen (N) rate on grain yield, biomass and water use efficiency (WUE) of maize.
Irrigation
Level
N RateGrain Yield
(kg/ha)
Biomass Yield
(kg/ha)
WUE
(kg/m3)
Grain Yield
(kg/ha)
Biomass Yield
(kg/ha)
WUE
(kg/m3)
20182019
N06596 ± 287 b22,637 ± 4427 a0.019 ± 0.00 a6225 ± 677 a24,450 ± 3559 a0.017 ± 0.00 a
W1N114,919 ± 298 a39,000 ± 3419 a0.008 ± 0.00 c12,196 ± 632 a37,632 ± 3110 a0.007 ± 0.00 e
N215,501 ± 431 a32,415 ± 2277 a0.009 ± 0.00 c13,143 ± 535 a52,663 ± 6781 a0.010 ± 0.00 c
N07786 ± 281 b22,768 ± 1307 a0.012 ± 0.00 b8332 ± 242 a33,269 ± 3659 a0.011 ± 0.00 b
W2N114,728 ± 447 a34,413 ± 2970 a0.007 ± 0.00 c13,231 ± 521 a32,970 ± 3487 a0.009 ± 0.00 d
N215,037 ± 489 a31,383 ± 2298 a0.009 ± 0.00 c15,768 ± 787 a38,378 ± 2831 a0.009 ± 0.00 c,d
p-value 0.0430.674<0.0010.4020.055<0.001
Values (mean ± standard error of mean) in the same column with different superscripts are significantly different.
Table 3. Interaction effect of irrigation level and plant density on grain yield, biomass and water use efficiency (WUE) of maize.
Irrigation
Level
Plant DensityGrain Yield
(kg/ha)
Biomass Yield
(kg/ha)
WUE
(kg/m3)
Grain Yield
(kg/ha)
Biomass Yield
(kg/ha)
WUE
(kg/m3)
20182019
D111,979 ± 1458 a26,735 ± 2692 a0.013 ± 0.00 a,b9721 ± 1176 a38,034 ± 7095 a0.012 ± 0.00 b
W1D212,636 ± 1588 a29,853 ± 4163 a0.015 ± 0.00 a10,490 ± 1125 a40,781 ± 5882 a0.013 ± 0.00 a
D312,401 ± 1374 a37,464 ± 4603 a0.009 ± 0.00 c,d11,352 ± 1359 a35,930 ± 5631 a0.009 ± 0.00 e
D111,680 ± 1043 a25,040 ± 1445 a0.011 ± 0.00 b,c12,015 ± 1094 a36,643 ± 2346 a0.011 ± 0.00 c
W2D213,265 ± 1414 a30,441 ± 2779 a0.010 ± 0.00 c,d11,902 ± 1064 a34,527 ± 3055 a0.010 ± 0.00 d
D312,606 ± 1215 a33,083 ± 3305 a0.008 ± 0.00 d13,415 ± 1419 a33,447 ± 4514 a0.007 ± 0.00 f
p-value0.3980.6670.0150.7450.859<0.001
Values (mean ± standard error of mean) in the same column with different superscripts are significantly different.
Table 4. Interaction effect of nitrogen (N) rate and plant density on grain yield, biomass and water use efficiency (WUE) of maize.
N RatePlant
Density
Grain Yield (kg/ha)Biomass Yield
(kg/ha)
WUE (kg/m3)Grain Yield
(kg/ha)
Biomass Yield
(kg/ha)
WUE
(kg/m3)
20182019
D16906 ± 354 a20,152 ± 1680 a0.017 ± 0.00 a6976 ± 889 a29,550 ± 3633 a0.015 ± 0.00 b
N0D27099 ± 560 a19,328 ± 2236 a0.020 ± 0.00 a7380 ± 583 a29,942 ± 5552 a0.018 ± 0.00 a
D37569 ± 339 a28,627 ± 5712 a0.010 ± 0.00 b7479 ± 867 a27,086 ± 5404 a0.009 ± 0.00 d
D113,882 ± 379 a30,344 ± 2497 a0.009 ± 0.00 b,c12,083 ± 701 a38,269 ± 3548 a0.009 ± 0.00 d
N1D215,426 ± 437 a36,499 ± 3763 a0.008 ± 0.00 b,c12,480 ± 786 a36,492 ± 3195 a0.008 ± 0.00 d
D315,162 ± 305 a43,276 ± 3905 a0.006 ± 0.00 c13,578 ± 648 a31,143 ± 5230 a0.006 ± 0.00 e
D114,700 ± 340 a27,166 ± 1703 a0.010 ± 0.00 b13,544 ± 969 a44,197 ± 9318 a0.011 ± 0.00 c
N2D216,327 ± 224 a34,613 ± 2358 a0.009 ± 0.00 b,c13,727 ± 757 a46,528 ± 6509 a0.009 ± 0.00 d
D314,779 ± 741 a33,917 ± 3171 a0.009 ± 0.00 b,c16,094 ± 941 a45,835 ± 5516 a0.009 ± 0.00 d
p-value0.1160.511<0.0010.5690.962<0.001
Values (mean ± standard error of mean) in the same column with different superscripts are significantly different.
Table 5. Interaction effect of irrigation level, nitrogen (N) rate, and plant density on grain yield, biomass and water use efficiency (WUE) of maize.
Irrigation
Level
N RatePlant
Density
Grain Yield
(kg/ha)
Biomass Yield
(kg/ha)
WUE
(kg/m3)
Grain Yield
(kg/ha)
Biomass Yield
(kg/ha)
WUE
(kg/m3)
20182019
D16229 ± 302 a17,974 ± 1481 a0.020 ± 0.00 a5539 ± 1325 a26,330 ± 7432 a0.018 ± 0.00 b
N0D26440 ± 732 a16,195 ± 2418 a0.026 ± 0.00 a6487 ± 608 a24,947 ± 7515 a0.023 ± 0.00 a
D37121 ± 382 a33,743 ± 11549 a0.011 ± 0.00 b,c6648 ± 1738 a22,072 ± 5964 a0.010 ± 0.00 e,f,g
D114,334 ± 462 a33,151 ± 4143 a0.008 ± 0.00 b,c11,377 ± 981 a39,764 ± 5268 a0.008 ± 0.00 g,h,I,j
W1N1D214,884 ± 423 a39,702 ± 6818 a0.009 ± 0.00 b,c12,523 ± 1544 a39,630 ± 5795 a0.007 ± 0.00 j,k
D315,538 ± 558 a44,146 ± 6785 a0.006 ± 0.00 c12,688 ± 965 a33,503 ± 6475 a0.007 ± 0.00 j,k
D115,375 ± 342 a29,079 ± 2430 a0.010 ± 0.00 b,c12,247 ± 749 a48,008 ± 20034 a0.011 ± 0.00 d,e,f
N2D216,584 ± 159 a33,662 ± 2582 a0.009 ± 0.00 b,c12,459 ± 643 a57,765 ± 7411 a0.010 ± 0.00 e,f,g,h
D314,544 ± 1017 a34,504 ± 6414 a0.009 ± 0.00 b,c14,722 ± 761 a52,215 ± 8452 a0.010 ± 0.00 f,g,h,i
D17584 ± 274 a22,330 ± 2679 a0.014 ± 0.00 b8414 ± 354 a32,769 ± 630 a0.012 ± 0.00 c,d
N0D27758 ± 774 a22,462 ± 3055 a0.014 ± 0.00 b8274 ± 727 a34,937 ± 8526 a0.013 ± 0.00 c
D38017 ± 478 a23,512 ± 1889 a0.009 ± 0.00 b,c8310 ± 203 a32,100 ± 9238 a0.008 ± 0.00 I,j
D113,430 ± 547 a27,537 ± 2476 a0.009 ± 0.00 b,c12,789 ± 1000 a36,773 ± 5741 a0.010 ± 0.00 e,f,g
W2N1D215,968 ± 693 a33,296 ± 3751 a0.008 ± 0.00 c12,436 ± 837 a33,354 ± 2756 a0.010 ± 0.00 f,g,h,i
D314,787 ± 107 a42,406 ± 5425 a0.006 ± 0.00 c14,469 ± 612 a28,784 ± 9450 a0.006 ± 0.00 k
D114,026 ± 73 a25,253 ± 2220 a0.010 ± 0.00 b,c14,842 ± 1566 a40,387 ± 4265 a0.012 ± 0.00 c,d,e
N2D216,070 ± 400 a35,565 ± 4499 a0.008 ± 0.00 b,c14,996 ± 919 a35,291 ± 5533 a0.008 ± 0.00 h,I,j
D315,014 ± 1287 a33,330 ± 2298 a0.009 ± 0.00 b,c17,467 ± 1403 a39,456 ± 6324 a0.008 ± 0.00 I,j
p-value 0.3840.5020.0230.9410.951<0.001
Values (mean ± standard error of mean) in the same column with different superscripts are significantly different.
Table 6. Correlations among grain, biomass yield, and WUE of maize.
Grain YieldBiomass YieldWUE
Grain yield10.611 **−0.685 **
Biomass Yield0.611 **1−0.511 **
WUE−0.685 **−0.511 **1
** denotes p < 0.001 and indicate a significant correlation.
Publisher’s Note: MDPI stays neutral with regard to jurisdictional claims in published maps and institutional affiliations.

