1. Introduction
A food system constitutes a series of actors performing activities and making decisions involved in bringing products from primary production, through processing and distribution to the final consumer [
1]. It is generally acknowledged that industrialised food systems are neither sustainable nor resilient and a major transformation is needed [
2,
3]. Pressures to address and implement measures within Food Value Chains (FVCs) to increase the sustainability of food systems have been mounting in recent years [
4,
5]. The European Green Deal [
6] and, in particular, the Farm to Fork strategy have been instrumental drivers of change for FVCs and have placed emphasis on sustainability and resilience as key priorities to address for European food systems [
7].
Food system transformation highly depends on the collaboration and cooperation of FVC actors which is where the issue of fairness plays an important role since actors are less likely to collaborate and coordinate activities when they perceive themselves to be impacted by unfair trading practices (UTPs) [
8]. Earlier findings have indicated that the negative impact of unfair trading practices on small and medium size enterprises (SMEs) in the EU food sector is affecting the competitiveness of the industry [
9]. Another topic of concern is the effect of EU competition law on collaborative practices which has been identified to be a barrier to collaborative sustainability initiatives in food value chains [
10].
The problem of interorganisational fairness in FVCs is associated with power asymmetries and fair value distribution among actors. In general, profit in a market driven system is a prerequisite for the continued operation of businesses and the price is one of the most important factors that will increase the fairness perceptions of FVC actors [
11]. However, the short-term vision to generate profit may have detrimental impact on supply chain relations if power asymmetries in the supply chain undermine the operational profitability of smaller agents in the chain [
11,
12]. Bargaining power in interorganisational relationships is a consequence of both the relative strategic significance of the partners (i.e., size of supplier or buyer) and the availability of alternatives (i.e., number of available suppliers/buyers and ease of switching supplier/buyer) [
13,
14]. Bargaining power is considered relevant to capture the behaviour of complex modern food value chains which are characterised by strategic coordination and horizontal concentration in retail and food manufacturing [
15,
16].
The organisation of food value chains as part of the overall food system entails various governance forms and structural characteristics. Strategic coordination through mergers and acquisitions in food manufacturing and retail and the formation of horizontal alliances has shifted the balance of power in food value chains [
12,
15,
17,
18]. The resulting weak position of farmers, in particular agricultural producers, has been of concern as they may be placed under pressure and have limited bargaining power in negotiations with larger buyers such as food manufactures and retail [
19,
20,
21]. In response to this concern, the EU Directive (2019/633) on unfair trading practices (UTP) aims at protecting weaker suppliers, primarily farmers, including their organisations (e.g., cooperatives) against their buyers, as well as suppliers of agri-food products which are further downstream [
22].
In an effort to assess the influence of policy measures to enhance fairness in FVCs, simulation modelling is of interest. Fairness is a complex issue and often defined along two main dimensions as distributive fairness and procedural fairness. Procedural fairness concerns the procedures leading to outcomes. The outcomes can be perceived as fair or unfair (i.e., distributive fairness) but the procedures leading to these outcomes can themselves also be considered fair or unfair (i.e., procedural fairness). The procedures in place certainly affect outcomes, although a high level of procedural fairness does not automatically lead to high levels of distributive fairness. Stakeholders’ views on fairness are focused on price setting and how pricing decisions are made. The perception of fairness is often subjective and highly influenced by where in the supply chain the actors are embedded [
8,
23]. Various factors can influence the outcome, such as different firm strategies related to, e.g., transaction costs, capacities, collaboration, entry barriers or equal power among partners to define prices, access to relevant information and the treatment of different partners in a supply chain on behalf of a powerful party [
11,
12]. Furthermore, the link between supplier fairness and relationship quality has been emphasised; and supplier dependence is another important factor that can affect the trust between suppliers and retailers [
24]. The uncertainty of prices linked to the volatility of commodity prices and various requirements set by the more powerful actor in buyer and supplier relations, including sustainability criteria, needs to be considered when assessing the outcome of price negotiations and distributive fairness.
With a focus on interfirm relations and modelling interorganisational fairness, quantitative indicators must take into account bargaining power and the importance of price for FVC agents, in their effort to maximise their profit or utility. Social concepts more qualitative in nature are excluded from the scope of this study. This paper builds on the conceptualisation and operationalisation of interorganisational fairness in [
25] where indicators for use in a quantitative model were proposed, e.g., profit margin as an indicator of distributive fairness and indicators for procedural fairness related to market power and bargaining power [
25]. The product flows can be simulated using system dynamics (SD) which is well suited for modelling such flows [
26,
27,
28]. The decisions controlling the product flow and pricing, which are the principal part of the model, can be modelled using agent-based modelling (ABM). The main advantage of ABM is its ability to model social interactions and so it can aid the study of subjects such as cooperation, competition, and collaboration in supply chains [
29]. The aim is not to determine an absolute measure of fairness using these indicators, but rather to ascertain transitions towards fairer outcomes. This approach is in keeping with the European Parliament’s depiction, which, rather than providing a strict value measure of UTPs, emphasises the presence of gross deviations away from good commercial conduct.
There seems to be a shortage in the literature of research that considers hybrid system dynamics & agent-based models of the whole food supply chain, from producers to consumers, thereby incorporating the full extent of interaction and feedback within the chain; one contribution of this paper is to address this gap in the literature.
The main research question to be addressed here is: Can simulation of food value chains be used to assess: (a) the effect of strategic interventions on power structure; and (b) the impact on price negotiations between actors in food value chains; where distributive fairness is assessed by profit margin received by value chain actors and power structure is assessed by a proxy for market power and bargaining power?
Hence, the objective of this paper is threefold:
To set an agenda for research into simulation models of FVCs which hybridise system dynamics (SD) and agent-based modelling (ABM) methods, and to communicate the benefits of this approach to an audience of experts in agriculture and FVCs.
To present how interorganisational fairness is related to governance and power asymmetries and thus identify potential sources of unfair marketing condition. This characterises the “real world problem” to be addressed by the simulation model.
To select the most important elements of the real-world problem using methods such as cognitive maps and so derive a conceptual model to address the interorganisational fairness problem.
The structure of the rest of this paper is as follows.
Section 2 introduces the main concepts of SD and ABM, and the use of a hybrid model is proposed and argued for the applicability to FVCs.
Section 3 provides the background of the study including an overview of the food system structure and aspects of the fairness problem and governance in FVC case studies. In
Section 4 the methodologies applied for the conceptualisation of the model are detailed. The results in
Section 5 present an outline on how this approach is conceptualised for a particular FVC case study by use of cognitive maps for the wheat to bread chain and we show at a high level how a conceptual hybrid of SD and ABM can model FVCs and the problem of fairness.
Section 6 is discussion and
Section 7 gives conclusions.
2. Simulation Modelling Background
For any business operating in a dynamic environment, such as agri-food businesses, optimisation and exact solution techniques cannot give a full and realistic picture of the business for a number of reasons, not least the underlying variability and complexity of the environment [
30]. In such complex applications, simulation approaches can give an understanding of how factors such as labour variability, shortages or obsolescence of materials, etc. can affect overall performance [
30]. Such simulation models are extensively used in the literature [
31,
32,
33] and specifically in the agri-food domain [
29]. Analytical closed-form solutions for multitier supply and value chains exist only in very simple cases, e.g., a two-tier supply chain; in other cases, the only practical approach to modelling is to simulate supply and value chains and so analyse the flow of money, information and material through the chain. There are several simulation approaches [
33], including system dynamics, agent-based modelling and discrete-event simulation. In this section, we give an overview of the main simulation modelling approaches extant and the reasoning for our choice of a hybrid approach involving system dynamics and agent-based modelling: namely, that distributive and procedural interorganisational fairness can be captured by the flows of money and information (distributive) and the relations between interacting agents (procedural).
The endogenous and exogenous characteristics of organisational and market complexity are a source of causal ambiguity, emergent behaviour and self-organisational dynamics [
34]; understanding of these is enhanced by general systems theory [
35,
36] and the system dynamics field of research [
27,
28,
37,
38,
39]. System dynamics (SD) is an approach to understanding the nonlinear behaviour of complex systems over time using stocks, flows, internal feedback loops, functions and time delays. It is a mathematical modelling technique and methodology to frame, understand, and discuss complex issues and problems. Its basis is the recognition that the structure of a system—the many circular, interacting, sometimes time-delayed relationships among its components—can be just as important in determining its behaviour as the individual components themselves. There have been some applications in agriculture, e.g., [
40] and food supply chains using system dynamics [
41,
42,
43,
44]. However, earlier studies rarely included the flow of money through the system; and, even when included its impact on decision making and the dynamics of the system were usually neglected. Financial factors greatly impact on decision making and therefore the physical flow of products and services; hence, our focus on value chains.
A more contemporary method for exploring complex adaptive systems is agent-based modelling and simulation (ABM or ABS) which, in contrast to the system dynamics top-down “macroscopic” perspective, takes a bottom-up “microscopic” view for explaining agent-specific emergent system behaviour (
Figure 1). ABM has several features that make it an appropriate approach for modelling complex characteristics of value chains such as actor behaviours and interactions [
45,
46]. An
agent is a model of a real-world actor. Agents in such systems act in parallel within an environment, interacting and competing for control over resources in an adaptive manner, subject to a condition/action rule pattern connected to a specific behavioural decision-making structure [
47,
48,
49,
50]. Agents may be intelligent, e.g., using ordering rules evolved by learning algorithms [
51]. The
environment represents all real-world factors not represented by agents. Agent-based simulation models are typically built from the bottom up by identifying agents in the system and defining their behaviours, including how they interact with other agents and their environment. The behaviour of the system as a whole emerges out of multiple concurrent individual agent behaviours. Each agent is:
self-contained (an identifiable, discrete individual with a set of characteristics or attributes, behaviours, and decision-making capability [
49]);
autonomous (controls its internal state and its own behaviour);
situated (in the environment); and
social (interact with other agents). Agents have:
attributes such as capacity, number of employees, production level;
behaviours: the agent senses the environment, decides and acts (within constraints): responds to actions of other agents, regulations, flows of goods, money, information;
goals that drive its behaviour (maybe to optimise, maybe to satisfy requirements);
memory and the ability to learn and/or adapt based on experience;
(possibly) resources or stocks.
Agent-based modelling, compared to traditional approaches to modelling economic systems, can be a more viable approach when there are reasons to think in terms of agents; for example, when the problem or research question to be explored is naturally represented by a large number of actors whose decisions and behaviours can be well-defined, which adapt and change, which learn, which engage in dynamic strategic interactions and relationships with other actors, and which can have spatial or temporal components to their behaviours and interactions [
52]. An ABM can capture the structure of a system which has endogenously emerging mechanisms affecting its future evolution. In the food value chain context, an agent could be a consumer, retailer, producer or indeed any chain actor: these are independent actors, each with its own motivations and agenda, but each influenced by the environment.
Discrete event simulation (DES) is a methodology for modelling the behaviour of a complex real-world system comprising a number of separate processes where stochastic variability is an important consideration. A DES models the real system as discrete entities (individual items, e.g., a FVC order) which move through a network of queues (places where entities wait for processing) and activities (processing of entities, e.g., food processing or packing). Thus, each process consists of a discrete time-ordered sequence of events (discrete changes in system state) considered important by the modeller, and each event occurs at a particular time (timestamp); for example, if modelling a bakery, the events studied could be baking and packing events. Time moves forward in discrete steps (the moments at which events occur), and in a general DES, not all time steps need have the same duration. Standard applications of DES include modelling of manufacturing systems and queuing systems with stochastic aspects. As this paper does not consider queueing in the system, but only uses a single system clock, the model developed has only minor elements of a DES; however, this description is included for completeness. For further details, see [
33] and the references therein. Hybrid simulation comprising ABM to capture the autonomous and interacting decision making behaviour of the supply chain actors, together with DES, has been used to model the production processes within a food value chain [
53].
Figure 1 illustrates the relative levels of abstraction of SD, DES and ABS.
In the process of developing a simulation model to capture behaviour of actors in a food system, a crucial stage is the initial conceptualisation. This involves analysis of the underlying feedback structure of the system to formulate hypotheses about the system’s dynamic behaviour. A system dynamics modelling approach is useful for studying changes over time in complex supply systems with the aim of building both the understanding of complexity needed to find effective policies, and the confidence to use that understanding to take action [
28].
A food supply system can be viewed as integrated downstream physical flows, upstream financial flows and decision chains that link these flows. Central to this idea is that supply systems are driven by profit and regulated by market dynamics [
54]. Using this approach, the qualitative conceptual VALUMICS model of the macroscopic structure of a generic food system was initially presented as a simplified causal loop diagram (CLD) based on supply, demand, and price. Each step in the supply chain (e.g., farming, processing, and retail) was captured as a part of a food supply chain feedback structure describing the relationship between a supplier and a customer: it is natural to model these as agents. Therefore, the chain of agents, each aiming at maximising profit and minimising cost, is in aggregate a reinforcing supply system. Studying the structure and dynamics of food chain systems in VALUMICS as integrated supply-, value- and decision chains underscores the complexity of such systems [
54]. Additionally, to use a model of a supply system to foresee policy implications, it is useful to consider not only the physical flow of products in the system but also the associated flow of funds and the effect it has on decision making. The dynamics of the systems being studied, with continuous and discrete elements, as well as the heterogeneity of the actors within them, motivates us to investigate a hybrid simulation methodology that can capture both system flows and actor behaviours in food value chains. The product flows can be simulated using SD, which is well suited for modelling such flows. The decisions controlling the product flow and pricing, which are the principal part of the model, were modelled using ABM. Since time passes in discrete steps, the model is also a DES. Hybrid models are of growing importance in operational research [
33] but seem to be less commonly used in the agri-food context, though there has been some recent work on short supply chains [
55].
A major aim of the VALUMICS project was to develop an integrated hybrid SD/ABM quantitative simulation model for use by policy makers and other stakeholders, and so contribute both academically and practically. The model developed is regarded as a laboratory for experiments and simulations to explore if and how regulatory interventions and changes in individual actor behaviour may drive overall system behaviour. It focusses on fairness issues, especially unfair trading practices in food value chains, and underpins other VALUMICS work on scenario development with a broader remit (e.g., resilience, sustainability, and integrity in general). The food systems studied comprise a large and complex system as discussed in
Section 3: these can only be interpreted from a limited viewpoint both because of the modellers’ need to select and simplify, and the lack of availability of complete and exhaustive information on the system: thus, many simplifications and assumptions are needed.
This paper derives a conceptual model giving a functional specification: what the hybrid simulation model will do. It highlights the main relevant decisions of each market actor in each FVC, and their explanations based on procedural and other aspects, including conditional factors and what-if questions. The conceptual modelling is addressed using qualitative techniques such as cognitive maps, agent interaction and agent behaviour rule maps. These also aid the modeller in reframing the main research question in terms of the model, exploring the model boundary, and generating dynamic hypotheses for simulation testing. The description of this conceptualisation stage is exemplified only by the French wheat to bread case study, which is the focus of the modelling work presented in this paper. Other case studies investigated are presented in the following section to provide an overview of real-world issues concerning fairness in FVCs.
All modelling approaches assume certain properties of the real-world situation being modelled, that is, represent it in a simplified way for reasons of economy of description, mathematical tractability or computational cost). The hybrid SD/ABM approach can capture flows of money, materiel and information in the FVC (SD) and choices/decisions/actions of individual actors based on what they see around them (ABM). The level of detail of the model constrains what can be studied and so what questions can be addressed. Computational cost considerations and available hardware constrain the number of agents modelled to a fraction of the number of real-world actors (though careful adherence to real-world proportions may mitigate this provided the numbers of agents can give statistically significant conclusions). Furthermore, we as modellers select for inclusion in the model what we regard as important; and we may potentially exclude important aspects of the real world from the model. In this case, the agent attributes and behaviours chosen are those relevant to interorganisational fairness as measured by our chosen metrics; attributes and behaviours not connected to this (e.g., to do with cultural aspects or sustainability) have not been captured and so questions involving those attributes and behaviours cannot be answered by this paper’s approach. For example, such important real-world concepts as community resilience, long-term sustainability, and cultural diversity have been excluded from the scope of the model. The attributes and behaviours could also be extended to address other questions, which would make the model more complex and indeed cumbersome, if not computationally intractable. By the same token, other simpler approaches (e.g., a pure SD model with no modelling of actors as agents) could address some questions—if to a lesser extent of richness—at a lower computational cost.
All models are simplifications but can be useful when populated with reliable data. Conversely, data gaps can limit the quality of a model. Lack of data turned out to be a major limiting factor in the later building of this model, and high-impact assumptions needed to be made when data gaps were encountered, especially concerning firm level data and particularly for non-farmer actors. Secondary data from different European level data, national level data and regional level data was available on e.g., Eurostat, FAOSTAT, Euromonitor databases and national databases, while FADN and Amadeus databases were used for micro data respectively at farm and company level:
Secondary data from different databases have different structures caused by divergent product classifications, time periods covered, commodity aggregations, and geographical reach. At the farm level the FADN data was detailed and possible to reconstruct to meet the modelling and analysis needs. However, at the processing industry level, the data available does not provide physical volumes passing through the processing industries; thus, it is difficult to link biophysical flows and socio-economic outcomes.
Other limitations constraining the research and development of the model were the facts that data is aggregated at the national level and that no data is available regarding the share of differentiated vs. commodified/standardised production.
Data is available at the firm level for specific firms; however, it is often incomplete (e.g., few data on business expenses) and big firms are often over-represented in the sample.
Another factor causing difficulties is that firms are classified based on their sector of activity. For firms operating in more than one sector, all data values are assigned to the dominant sector. Also, some of the food processing is also realised by retailers (e.g., cutting and packing meat) so it is difficult to separate their main business from the processing activities.
3. Food System Background—Case Studies
In a conceptual modelling exercise, it is crucial to examine as much of the context of the problem as possible to avoid the possibility of omitting some vital concept or data. This is done here, to convey the richness of the real-world system being modelled and the compromises necessary to arrive at a simplified yet requisite model. This research is part of the EU H2020 VALUMICS project which aims at improved understanding of the dynamics of food value chains. The general objective is to provide tools and approaches to enable decision makers to evaluate the impact of strategic and operational policies aimed at enhancing fairness, integrity, and resilience in future scenarios of sustainable food value chains (FVCs). The VALUMICS project applied a systems approach and involved an interdisciplinary group of experts to perform analysis of food system related issues. This provided insights on the structure, material flows, governance, economics, environmental impacts, and consumer behaviour related to different food value chain [
56,
57]. The research activities were carried out through the following case studies: Dairy cows to milk, Beef cattle to steak, Wheat to bread, Farmed salmon to fillets and Tomato to processed tomato. The FVCs all have a similar structure as depicted in
Figure 2, showing the integration of flow charts of the selected case studies with the flow of products through similar stages of the supply chains.
It is generally understood that primary production, in particular intensive farming, cause the main environmental burden in the whole life cycle of agri-food, including meat, dairy, and aquaculture products, where the use of feed connects the challenges of the food supply chains (
Figure 2). The end market of products also matters, since the use of fuel during transport can also contribute considerable climate change impacts of exported products in distant markets and the waste generated throughout all stages [
58,
59].
Although most food value chains share many sustainability challenges, they differ in several aspects affecting the prevalence and extent of interorganisational fairness problems associated with profit distribution which is the focus of this paper and the scope of the simulation model described herein. Differences regarding interorganisational fairness can, to some extent, be attributed to the governance and the strategic coordination in terms of horizontal or vertical collaboration, and the rules for distributing value added [
60,
61,
62]. This was demonstrated in the governance analysis in case studies in the VALUMICS project [
8]. This section provides a summary of the main findings of governance analysis in terms of interfirm relations in four case study FVCs. Moreover, economic analysis in the selected case studies provide evidence to substantiate the findings. These include studies on market power, price formation and price transmission [
63], assessment of economies of scale and technical efficiency [
64], persistence of supply chain relations [
65], including also statistical analysis of agribusiness profitability [
66]. The economic analysis provided useful insights to the functioning of FVCs [
67] and further underpinned the conceptual modelling work described in
Section 4 and
Section 5. Considering the socio-economic impacts, the profitability and competitiveness of the enterprises constituting food value chains are key elements to ensure employment and livelihoods.
A snapshot of the key results of the governance analysis (
Figure 3) shows the most typical governance modes in these FVCs and, thus, possible sources of unfair market conditions. There is complexity in the governance modes, the size of firms has an impact, and various externalities have shaped the food value chains and motivated changes in the interfirm relations over time. Examples of factors which can influence decision making and contribute to procedural fairness in the food value chains are shown in
Figure 3 (top). These factors are related to laws and regulations, power, environmental stability, collaboration, civil society pressure which motivates for example the uptake of voluntary standards including third party certification. Also, there are common macroeconomic factors that affect commodities’ prices like global supply and demand, energy prices and trade agreements, including tariffs and quotas.
The governance modes in the FVCs were explored through the Global Value Chain (GVC) governance framework [
60] using the typologies of interfirm relations which are defined by the degree of strategic coordination ranging from; (i) free market exchanges where partners can easily switch between buyers; (ii) modular where products are customised and the seller takes responsibility of investment needed to provide technology used; (iii) relational implies mutual dependence where trust and reputations are key elements but there is complexity in transactions, (iv) captive refers to strict monitoring from the lead firm and where switching to other partners is costly; and (v) hierarchies refers to vertically integrated firms where key actor has power over e.g., subsidiaries in the chain. In fact, there is complexity in these relations especially concerning large firms which is pointing to hybrid forms of governance. An example is when one firm can have different relations with their partners and may interact differently depending on e.g., markets, sales channels, and logistic priorities [
68]. Governance structures are complex and include international as well as national regulations, and public (i.e., government regulations), private (i.e., cooperatives), and social (i.e., non-governmental organisations) forms of governance, acting vertically (e.g., along the chain) or horizontally (e.g., within a single level of the chain) [
69]. In all the FVCs in
Figure 3, retail is the lead actor, with different relations with their suppliers often being captive ones (red arrows). Various types of interfirm relations are identified between actors in the different value chains; and strategic coordination (green broken lines) is evidently influencing the bargaining power of producers in the tomato and salmon chain. Various strategies and interventions such as interbranch organisations (IBO), producer organisations (PO), cooperatives, voluntary codes of practice, and mandatory legislation have been implemented to achieve fairer trading and working conditions, and greater transparency and information flow in food value chains. These interventions and mechanisms need to be suitable for each respective food sector and consider the overall food system [
8]. Cooperative and PO membership is one of the main mechanisms used by farmers to improve their bargaining position [
14] and research indicates that members are less likely to be subject to UTPs [
23]. The POs are recognised and regulated by the EU (Reg 1308/2013) as part of the European Common Agricultural Policy (CAP) [
70].
The interfirm relations in the wheat to bread chain in France point to a captive situation of farmers towards their cooperatives (red arrow in
Figure 3) who coordinate with large millers. The captive situation of traditional bakers towards millers is possibly a risk of unfair trading practices in price negotiations between these actors. Moreover, the retailer as lead firm has a strong position towards millers and industrial bakers. Indeed, market imperfections were detected within the output and input markets for both the milling and baking sectors in France and the UK when market power was assessed by ‘Mark-up’ and ‘Mark-down’, or ‘Lerner’ index [
71]. The French wheat market is integrated with the world market and leads the EU market concerning wheat price formation, but it is currently facing high competition from Black Sea grain exporters (i.e., Russia, Ukraine and Kazakhstan) [
72].
The dairy to milk chain is characterised by bipolar governance where raw milk producers are captive suppliers towards processors and dairy cooperatives, the ‘lead firms’. Modular or relational interfirm relations are identified where retailers are ‘lead firms’ and dairy cooperatives and private dairy processors are ‘turn-key’ suppliers or modular relations (
Figure 3). Milk producers in Germany, France and the UK face a negative price/cost ratio in the long run, indicating low bargaining power despite being a part of producer cooperatives. Support available for producers includes POs and provision for mandatory contracts (under the EU “milk package” of reforms). A legal change to the framework for setting contracts has been introduced in France, and the UK has experimented with a voluntary code of best practice on contractual relationships between producers and processors. Currently, the POs are beginning to negotiate over volume management as well as price in France [
73].
To substantiate further the governance analysis in the dairy chain in France, UK and Germany, economic analysis identified certain level of oligopsony and oligopoly power at the level of producers and processors [
63]. Similarly, in another study a certain level of oligopoly for dairy processors in France, Italy and Spain has been reported [
74]. Results from technical efficiency analysis in the European dairy industry indicate a certain degree of systematic failure, e.g., permanent managerial failures and structural problems in European dairy processing industry [
75]. Stakeholder concerns exist around setting of prices between the producers as sellers and the processor and or retailer as main buyer, and volumes of milk supply agreed upon. Price negotiation of milk between the farmers and cooperatives has been pointed out as a potential UTP, since some producers may have a vested interest by being part-owners of the cooperatives. Price dynamics from producer level are almost completely transmitted to the wholesale level of the dairy value chain [
63].
Contrary to the captive situation of producers in the dairy and wheat chains, the producers in the tomato and salmon chains have relational modes through contracts with their buyers. (
Figure 3). This demonstrates the effect of strategic coordination of upstream actors (as indicated by the green broken lines) through POs and Inter-Branch Organisations (IBOs) in the raw tomato to processed tomato chain in the Emilia-Romagna region of Northern Italy. The IBOs play a crucial role in price setup and balancing of power between producers and processors. The market power has switched towards producers after creation of the regional IBO, ensuring higher competitiveness and sustainability through mutual agreement on quality criteria and prices which benefits all. The governance between the producers (PO) and the processors is relational; but retailers, as lead firms in the chain, show aspects of both the modular and captive modes towards processors (
Figure 3). Processors face significant “pressure” on their selling price when it comes to dealing with retailers (not part of the IBOs). The economic analysis indicates that price dynamics present at the producer and processing levels are not reflected at the retail level. Most of the retail purchases go through auctions where processors usually need to squeeze their margins during the negotiation process. Indeed, the reverse auction of retailers has been identified as a potential UTP [
8,
63]. The small tomato producers have taken advantage to improve scale efficiency by increasing the scale of operations, resulting in growth of total factor productivity at the producer level [
76].
In the farmed salmon to fillet chain, the upstream consolidation of aquaculture companies through mergers and acquisition has reduced the number of farming companies; and has helped companies take advantage of scale and strengthened their position on global markets. The producers in the global aquaculture value chain benefit from favourable market conditions (e.g., demand far exceeding supply). The key players are large vertically-integrated aquaculture producers who have a strong bargaining position and a relational governance mode with the supermarket ‘lead firms’ (
Figure 3, green dotted line). Third-party assessment and certification schemes enable hybrid governance forms and inter-firm relationships can have a range of forms from free market exchange where products are sold on spot market, to long-term relational contracts between large integrated companies and retail or large secondary processors. Small secondary processors may be captive towards retail [
8,
77]. Economic studies on market power in the salmon chain identified a “low-level” of market imperfectness [
78], however, price transmission analysis shows that the salmon export price of Norway directly influences price development in the selected EU markets, France and Poland. Different value chain governance and interfirm relations directly define which actor of the value chain dominates price formation in the exporting country: retailers in France (having direct contractual relations with Norwegian exporters) and processors in Poland (directly owned by Norwegian companies) [
63]. There are potential risks of UTPs concerning the strong position of producers and the possibility of influencing prices at the stock market [
77].
4. Materials and Methods
4.1. Developing a Conceptual Hybrid System Dynamics/Agent-Based Model
In this section, the steps of the method for development of a conceptual hybrid simulation model are explained, showing how the defined problem and objectives are incorporated. In the VALUMICS project, this work was carried out iteratively using an agile approach, jointly by the modelling team and the food value chain case study subject matter experts. The conceptual modelling followed established practice to ensure the design and implementation of a valid and robust simulation model capable of providing means for virtual policy experimentation and decision analysis and optimisation. The modelling approach followed five general steps [
28]: problem definition (boundary selection), dynamic hypothesis generation, simulation model formulation, model testing and use in policy evaluation. A similar approach is given by Randers [
38], emphasising that modelers need to follow stages of conceptualisation (incorporating the first two of Sterman’s steps), formulation, testing and implementation. Similarly, Richardson & Pugh [
79] and Roberts [
80] propose the modelling stages as problem definition, system conceptualisation, model formulation/representation, model behaviour and analysis, evaluation and policy analysis and use. In
Figure 4, the stages used in the VALUMICS project for simulation modelling of food value chains are given.
This paper’s focus is the first
conceptualisation stage: this is the process of developing the modellers’ conceptual understanding of the components of the system and how these components influence each other’s behaviour [
38]. In system dynamics, the main components are resources, flows, variables, and feedback resource interrelations. In ABM, the main components are agents, their attributes and behavioural rules, and agent interrelations [
49].
Once the conceptualisation stage has identified the system and the agents, as well as their states, relationships, behaviours and interactions, the next step is to formalise these concepts. This is the formulation stage, which includes the quantitative model building. Formalisation is needed because even though the identified concepts may seem well-defined to the stakeholders, they may be far more context-dependent or situation-specific than the stakeholders realise—and models and computers cannot deal with ambiguity and context-dependency. That is, the model of the world needs to be made explicit, formal, and computer-understandable (as well as being human-understandable). Once formalised in pseudocode, this can then be implemented as a computer simulation. The idea is to design a simple enough, yet sufficient, SD/ABM architecture capable of capturing the system components common to all FVCs and agent levels and categories (in connection to the focus on fair value and fair contractual relations) and their interrelations, and then later to adjust and fine tune it to each specific FVC case study, including exploration of connections to anticipatory scenarios and transition pathways. Formalisation in SD comprises the stock and flow formal diagrams needed to account for the system structure and the proper mathematical interrelations among the model variables; whereas, in ABM it comprises the coding of agent behaviour in the model.
The subsequent testing stage covers model calibration and verification, with the purpose of proving the proper quantification of the simulation model. The final implementation stage involves the application of the simulation model to policy evaluation by carrying out “what-if” scenario simulations to test previously identified hypotheses and find how variation in key input variables influences the behaviour of the whole system. Future work will follow a research agenda completing these stages.
4.2. Sources of Domain Knowledge
To ensure a common understanding between the modelling team and the case study experts, joint practical workshops took place where the methodological approach was carried out, including the use of qualitative techniques such as cognitive maps according to cognitive mapping theory [
81,
82] as detailed by [
83] (see
Section 4.5). The team performed initial group modelling work on the conceptual model by using agent maps, decision tables and cognitive maps linked to the FVC case studies on tomato, wheat, salmon, and dairy. Following this, the expert teams worked together through online meetings and documentation of the problem structuring and problem definition, further using the cognitive maps to elucidate the agents’ behaviours and interactions. A crucial purpose was to increase understanding among the modellers and the expert team working on future scenario developments in the VALUMICS project and for this purpose to put forward relevant “what-if” questions which the model was to be designed to answer. This process was also vital for the modellers to frame the main research question, explore the model boundary and generate dynamic hypotheses for simulation testing.
The details of the functioning of the French wheat to bread chain, including the governance and functioning of the value chain, are based on background knowledge of the VALUMICS expert team gained through the various analysis and empirical findings in the case studies as reported in the project´s deliverables and published papers (see
Section 3). This includes findings from governance analysis through expert or élite interviews, analyzed in conjunction the documentary and secondary data sources [
8]. Furthermore, economic analysis on market power, price formation, technical efficiency and persistency of relations [
63,
64,
65] and specifically in the context of the wheat to bread case study [
71,
72] provided insights to the real world system being modelled. The documentation of the conceptual model development was through agent tables and cognitive maps in group modelling workshops.The validation of the simulation modelling conceptualisation was carried out through the process of iterative group conceptual model building workshops (application of cognitive and agent maps), based on expert and stakeholders’ opinion in relation to gaining agreement on the true representation of the system components and their interrelations. Where important information was missing, informed assumptions needed to be made based on documented expert opinion or published sources.
4.3. Fairness Metrics
The VALUMICS project considered two dimensions of fairness: procedural and distributive fairness. As mentioned in the introduction, interorganisational fairness can be measured by gross profit margin as a proxy for distributive fairness The choice of fairness metrics in this paper is based on the conceptualisation and operationalisation of interorganisational fairness in [
25]. When calculating gross profit margin, revenues were adjusted to include any subsidies and support, including environmental public financing (e.g., direct payments under CAP). The emergent pattern of interest is the observed distribution of adjusted gross profit: a desired emergent pattern is a fairer distribution of adjusted gross profit.
To measure procedural fairness, the VALUMICS project investigated the degree of market power by using as a proxy the Lerner Index for output market and relative mark-down index for input market. The Lerner Index
L is a very widely adopted metric that provides an estimate of market power in an industry, measuring the price-cost margin through the difference between the output price of a firm and the marginal cost divided by the output price [
84]. The index ranges from a high value of 1 to a low value of 0, with higher numbers implying greater market power. For a perfectly competitive firm,
L = 0 and such a firm does not exercise market power; equally, when
L = 1, a firm has monopolistic power. Analogously, one can define a mark-down index for the input market. Both indexes can be used as measures of the departure from perfect competition and so can be considered as good measures of fairness according to economic theory. Cechura and Jaghdani [
71] show that the Lerner Index,
for markdown or input market and
for markup or output market, respectively, can be calculated as
and
where
MRPx represents marginal revenue product of input
x,
wx is the price of input
x,
MC stand for marginal costs and
P is the price of product. The Lerner index was originally defined only for the output market [
85]. Cechura and Jaghdani [
71] redefined it for the input market as well, building on work in [
86].
4.4. Modelling Scope—Boundary and Hypothesis Generation
All modelling is about making informed choices of selection: what should be included in the model and what may be (reasonably) safely excluded without significant degradation of quality of results. In the “Conceptualisation” stage covered in this paper the focus is on problem definition and boundary selection (model scope), including relevant hypothesis generation. Scope is restricted according to the “Einstein’s razor” modelling maxim: “as simple as possible, but no simpler”. The boundary must not only be related to the main research question on distributive and procedural fairness in food value chains, but also to the choice of geographical location (country market) and number of agents involved. In VALUMICS, the wheat to bread chain was investigated in the context of the French market. This boundary selection is necessary for every simulation model due to technical (computational) and other constraints such as complexity, timing, access to and availability of relevant qualitative and quantitative data and resources for design and production. The purpose of the simulation modelling is not to produce an exact replica of the entire system and how it functions (impossible technically, and indeed unnecessary); but rather to capture the main factors and interrelations among system components with a reasonable trade-off between accuracy and simplicity, to ensure it can provide insights for the proper analysis of the system behaviour in relation to the main research questions, and exploration of options for solutions.
For reasons of available computational power, the number of tiers in the value chain was restricted to five (producer, collector, processor, retailer, consumer); and the number of actors (agents) at a given tier was restricted to a number for which simulations can be carried out in a reasonable time, at a reasonable computational cost. For each case study examined, this generic five-tier base FVC was then adapted to capture the attributes and characteristics of that case study FVC. This approach allowed for the greatest possible reuse of design and computer code, and minimised redundancy of effort.
At each tier, actors (agents) of three categories, small, medium, and large, were modelled, with the number of agents in each category informed by the real-world preponderance together with the technical feasibility of running a computer program instantiating that number of agents. This allowed modelling of the heterogeneity of real-world FVCs. Typically, there may be three to five large players at a given tier, with greater numbers of medium and/or small players. Since these limitations only become clear at the implementation stage, the exact numbers were to be decided at a later stage. The characteristics of the different categories of actors were also required, and the values of necessary parameters. In cases where the technical limitations did not allow modelling of the full population of actors in a given FVC, the approach taken was to model a proportion of them as agents.
To further constrain the simulation model scope, it was decided to focus on existing value chain structures, assuming that these will remain valid at least until 2030. Scenario development in subsequent VALUMICS work uses existing FVC structures (numbers of tiers and types of actors and interactions among them, though possibly changing numbers of actors at each tier) up to the year 2030. One reason for this was that it would be easier for stakeholders to relate to: there is a lot of uncertainty after 2030. It was decided that if a transition pathway to a future scenario envisaged specific changes to FVCs (e.g., certain actors join the chain, certain actors leave), that would be addressed in future work.
The focus on interorganisational fairness required the specification of one or more research questions related to the fairness problem definition. For that purpose, and to determine of the scope of the model, a cognitive mapping technique was applied to define agent decisions and interactions. While the model developed focussed on fairness, it had to do so while considering other constraints related to sustainability—that are not to be modelled per se, but that are considered as external constraints from the environment. Otherwise, it might well be the case that a way to make a FVC fairer is simply to continue depleting the environment or externalise the costs of social regulation to the environment (as is already the case in many FVCs, where farmers simply “pass on” to the environment the constraints they receive from downstream players).
4.5. Stages of Conceptual Modelling: Cognitive Maps and Related Techniques
The modelling effort applies techniques including cognitive mapping and agent behaviour mapping for system analysis and agent rules definition, to determine the model content including the physical and social elements of the system and the links between them. The VALUMICS conceptual model derived is described in the Results section. The goal of this qualitative agent modelling approach is to support the conceptual, functional, and technical specification for the quantitative modelling phase.
The behaviour of each agent can be captured in a story/narrative which explains which agent does what with whom and when. This requires detailed input from the subject matter experts of the case study teams, to define agents and their decisions, behaviours, and interactions. A useful high-level approach to this is to consider what actors there are in a particular value chain and, for each one, think of how that actor (modelled as an agent) will behave in practice:
What happens in “a day in the life” of this actor—what does this actor do?
What interactions has this actor with other actors, whether in the same tier or not (which agent rules affect which other agent rules)?
What interactions has this actor with the environment?
What decisions does this actor make (related to fairness, e.g., pricing decisions)?
What influences these decisions (prices, regulations, environmental factors)?
Cognitive maps are used to capture what system element influences what, and decision tables are used to identify the agent decisions together with what influences them and their other characteristics. In the VALUMICS hybrid model the behaviour of agents was defined in terms of decision rules executed upon special events and in interactions with other agents.
Cognitive mapping [
87,
88] is related to mapping individual and group mental models about a research question and to Cognition theory [
81,
82]. For example, Elsawah et al. [
83] use cognitive mapping to capture and analyse qualitative information from stakeholders on the issue of viticulture irrigation in Australia, and further to inform a better approach for capturing agents’ decision-making procedures. They demonstrate how cognitive mapping brings advantages for ABM design and parameterisation: ‘The action-oriented nature of concepts in the map makes it explicit about “what action is taken”, and “by whom”. Therefore, the structure and flow of decision making becomes explicitly represented in a cognitive map. Thus, the cognitive map allows for capturing behaviour rather than just attributes of agents, as well as the interactions between actors’ perceptions, states of their worlds, and choice states’ [
83].
Agent interaction mapping (AIM) and Agent behaviour mapping (ABM) are techniques, associated with the cognitive mapping technique but with a different aim, to analyse agents, agents’ rules and interrelations [
89]. The design purpose and theoretical framework of the cognitive and agent mapping techniques are presented in
Table 1. The results of the cognitive mapping are presented in detail in this paper using as an example the wheat to bread case study (
Section 5.3).
5. Results
In a conceptual modelling exercise, the “result” is the model derived. Initial work to lay the foundation for the modelling is to provide a depiction of the FVC structure. This is carried out in conjunction with subject matter experts. It entails (1) identifying the different tiers of agents which play a role in the supply chain, as well as (2) determining relevant categories of agents within each tier. Most food supply chains have the same basic structure (i.e., producers, collectors, processors, retailers, consumers). However, some of those categories may merge or, conversely, be divided into several tiers depending on the supply chain. Notwithstanding such variations among specific FVCs, we may reiterate that most FVCs have the same basic structure. This allows us to create a general hybrid SD/ABM simulation modelling architecture (prototype conceptualisation) applicable for all FVCs being studied. All the main system components relevant to the research focus (problem definition and boundary selection) are taken into consideration, including their interrelations (between financial resources and production resources and between agents and agents, and agents and resources).
For each case study, the physical and social elements of the food system are listed up. These elements can be agents (capable of independent decision making) or stocks, flows or controls (the SD elements). Having identified these elements, the problem definition then leads to “what-if” questions.
5.1. What-If Questions
“What-if” questions capture the hypotheses the model is intended to address and test. Here, the range of such questions for the VALUMICS case studies is discussed.
Procedural fairness can be addressed by the model as experimental factors using what-if questions. Such questions can address different procedural fairness issues, including unequal power among partners to define prices and unequal access to information resulting from the way in which the individual FVC is governed (e.g., producer organisations and price auctions). Examples of procedural fairness what-if questions to be addressed include the lists of prohibited practices in business-to-business relationships according to the Directive on UTPs. These include customs which may be considered of a procedural nature, e.g., relating to payment terms (such as late payments) and other elements of contractual relations (such as short-notice cancellations).
Further questions of interest to explore within the model include aspects of the link between the degree of market/bargaining power of FVC actors and the gross margin profit in terms of fair value distribution by exploring the impact of financial markets, reference price negotiation etc. By observing to what extent gross margins vary in different what-if experiments, it may be possible to indicate when the FVC is becoming fairer.
In general, what-if questions may be categorised as follows:
Changes in macroscopic environment parameter values
- (a)
Choices for production, consumption and other environment parameter values that will affect the macro-operation of the simulation model run, as they will prescribe values for supply and demand, e.g.,:
What happens to the FVC when levels of production/consumption change?
How do changes in supply/demand affect agents: do some agents cease trading?
What is the effect on fairness of these changes?
- (b)
Hypothetical interventions by introducing regulatory, competition structure, and technological related changes which have the purpose of improving fairness in the simulated FVC systems, e.g.,:
What if the level of CAP subsidies was changed?
What if the CAP subsidy were removed?
What if price controls came in?
Micro-level what-if questions that determine or affect the behaviour of an individual actor/agent’s decision making. For example, how easy is it to switch partners? These are elucidated by exploring that agent’s linkages in the cognitive map for the case study.
5.2. The French Wheat to Bread Case Study
Figure 5, derived from the joint modelling workshops described in
Section 4.2, gives more detail on the separation of the French wheat to bread FVC into tiers and sizes of actors than presented earlier in
Figure 2. In the wheat to bread supply chain, the “processing” stage is divided between the collectors (who collect and store wheat) and the millers (who transform the wheat into flour). Key actors are large millers, who are mostly large producer-owned cooperatives and control supply of flour mixes to traditional bakeries, putting bakeries in a relatively captive relationship as discussed before. The consumption of bread from traditional bakeries currently represents around 50% of national bread consumption in France [
8].
The agent-based model must distinguish among different “types” of actors within each tier (
Section 4.4). Capturing this diversity of actors is crucial to the ABM as it allows the factoring in of the diversity of responses/strategies that agents might have in the supply chain and therefore how the supply chain might evolve in different scenarios.
The main question then is how or on what basis to differentiate actors within each tier. Agents can be categorised according to different criteria e.g., size of the agent—which can reflect the number of employees, or the production volume, or value of production, etc.—type of production system, type of business model, etc.
For some tiers in the supply chain, the categorisation may be relatively straightforward. For example, this is the case for the wheat to bread FVC retailers, which can be clearly divided into traditional bakers, industrial bakers and in-store bakers: these have very different business models, economic productivity levels, etc. The topic of categorising certain specific actors (e.g., industrial bakers) according to size (e.g., medium and large) is a question in itself.
In other less straightforward cases, the objective of the model, i.e., what output variables are most important to the model, can drive out relevant agent distinctions. For the VALUMICS wheat to bread model, the key output variables include the number of workers, size of agents and value added. It is thus pertinent to make a distinction between agents characterised by very different levels of workers employed or productivity, as opposed to different levels of value-added or revenue (a variable which is potentially connected to the type of outlet the agents mainly have). For example, small millers have a lower material productivity than big millers but mainly sell their flour to traditional bakeries, at higher prices than those attained by an industrial bakery; while medium and large millers have a higher material productivity but sell a high share of their flour at lower prices to industrial bakers.
In addition, the distinction between FVC agents may be more generally bounded by constraints such as data availability. When looking for data to characterise the different agents, it may be that the available data only allows the distinguishing of actors in a very limited way (e.g., by size). One may thus choose to differentiate agents from a qualitative perspective (for example, based on the nature—private or cooperative—of the agent) rather than from a quantitative perspective. Such a distinction derived from more qualitative aspects must be based on the fact that these types of actors behave differently when facing a certain type of constraint.
It is also important to determine the unit/scale of the agent which is considered in the model. For example, processors may be considered at the processing unit level or at the company level. It is important to make an informed decision about whether to consider one or the other in the model. Again, one choice may be favoured by the data to hand. The case of retailers is a good example: the number of units might be high, but the number of groups is usually low (less than ten in most EU countries). In a model concerned with fairness, that considers the equity of value distribution, it may be more relevant to work at the group level, since even if different units are part of the group, only a few (or sometimes even one) central purchasing departments manage purchases for all units.
This initial modelling step starts the process of collecting quantitative data on the FVC, e.g., number of actors in each tier, type of actor, volumes handled, number of workers, productivity, etc. This data then feeds into the next quantitative formalisation step.
5.3. Cognitive Map for the French Wheat to Bread Chain
A cognitive map seeks to capture and display links or relationships among the previously listed elements of the FVC. The group modelling sessions mentioned in the previous
Section 4.2 led to the cognitive map for price negotiation in the French wheat to bread case study food value chain shown in
Figure 6 and subsequent explanatory notes.
The content of this map is now explained in more detail. All wheat to bread value chain actors depend on the international market because: (a) there are low trade barriers for imported wheat; (b) there are changing markets with different requirements; and (c) the domestic market is saturated.
5.3.1. Factors Influencing the Price Negotiation for Wheat between Farmers and Collectors
Collectors may be either cooperatives, which control 70% of the wheat market, or wholesalers, which control 30% [
8]. Producers tend to be captive suppliers towards cooperatives. The main factors influencing the price negotiation between farmers and collectors are the world price and the volumes/quality produced by French producers. This world price is based on
the volumes produced (mainly the volume produced in the Northern hemisphere in July, and to a lesser extent the volume produced in the Southern hemisphere in December/January),
the state of the world wheat stocks,
the state of the global demand for wheat (both for milling wheat and for feed wheat),
the production costs of the most efficient competitors on the world market (currently Russia) and
the extant trade policies (tariff barriers, import quotas).
The most influential publication on world prices is the “World Agricultural Supply and Demand Estimates” (WASDE) published every month [
97].
In terms of policies, cereal production is dominated by tariff barriers. This barrier can be lower for quotas negotiated for some countries. Trade agreements on these quotas therefore have a strong influence (e.g., future negotiations with Ukraine) on both the evolution of prices of wheat and volumes of wheat produced in France and the EU.
The policies of the importing countries, which may vary or even undergo significant changes (crisis, embargo, etc.), may also cause variations in the market. The price of oil, impacting both the price of farm inputs and transport, also has a strong impact on world prices. The euro/dollar exchange rate also influences the ability of EU countries to export.
The ability to reach the quality required for milling wheat (as measured by humidity, Hagberg index, baking strength and, in particular, protein content rate) depends on: (i) the evolution of requirements for these indicators (especially protein rate); (ii) the climate (which influences most aspects of wheat quality); and (iii) fertilisation conditions (which influence the protein rate). The fertilisation conditions are framed by the nitrate directive, which regulates the level of nitrogen input allowed. This directive can therefore influence the priorities of selection of wheat varieties, by motivating the favouring of varieties which optimise the use of nitrogen. For some years, there has been an obligation for collectors to state the protein content in contracts, in order to apply differential tariffs according to this protein level. The effect of the protein rate on the market is as follows:
if the protein rate is low: the price on the domestic market decreases and possibilities for export decrease, increasing the stocks of unsold wheat; and
if the protein rate is high: prices rise on the domestic market and the possibilities for export increase.
Pesticide residues, heavy metal, and mycotoxin levels are analysed for wholesale market allotments. When these sanitary controls are negative, the wheat is very rarely destroyed, but simply mixed with other healthier volumes.
Climate also influences the annual volume and quality of wheat produced. For example, if spring is too rainy in France, the wheat will be potentially inappropriate for milling (and will therefore partly be assigned to feed), which may raise the issue of supply for millers and the issue of proper valuation for producers.
The global supply of wheat and the quality of this wheat influence the way it is valorised. On the domestic market, wheat firstly is processed by millers (around 6MT/year), and then sold for feed, starch production or biofuels. On the international market, wheat is mainly used for bakery, if it reaches the protein rate requirements of buyers. The price differential between bread wheat and feed wheat depends on the world price of corn and feed barley. Two other important factors influencing the average price for wheat between farmers and collectors are the storage/sales policy and the use of hedging tools (futures markets). Finally, the price negotiation for wheat differs according to the production contracts negotiated before the campaign.
The premium value added to the average price of wheat is less for red label than it is for no pesticide residues chains. For organic wheat, the evolution of the price follows different market dynamics: most of the time, organic wheat is twice the price of conventional wheat, but the ratio between the two productions can evolve differently from year to year. The volumes of organic wheat are low at present, but the growth rate is substantial.
The question, as for any differentiation, is “will the premium be kept if the differentiated production becomes the norm”? And if not, at which level of differentiated production (compared to overall production) will the level of premium become negligible?
5.3.2. Factors Influencing the Price Negotiation for Wheat between Collectors and Millers
The price negotiation for grain between collectors (cooperatives or wholesalers) and millers mainly depends on the wheat prices (and therefore on average campaign prices). The premium prices are valorised all along the chain, involving different prices for wheat and different prices for the flour. Big mills may get cheaper prices for grain than medium and small mills, but to a small extent, as collectors try to keep their margins positive.
The milling industry in France is very concentrated and most wheat production for milling is collected by the biggest cooperatives, then processed through their own mills. More than 50% of flour production is ground by millers that belong to collectors. However, even in this integrated situation, millers negotiate prices for wheat allowing them to keep their margins at the mill level, so that they can generate profits to invest in modernisation of the mill. Mills are managed as if they were independent production units. In terms of strategies (of both sourcing and selling), one can distinguish small, medium, and large millers (4–5 millers grind around 50% of the production which is turned into flour) [
8].
Two different markets must be distinguished: (i) the traditional bakery market, with prices including both flour and services (financial, advisory and logistic) offered to bakers by millers; (ii) the industrial bakery and the retailer market, where prices of flour are about half those for the traditional bakery market. The contracts are fully indexed to the price of wheat. However, the market of flour is an over-the-counter market, meaning that it is not transparent at all compared to the wheat market. Medium size mills have the best economic conditions: they mainly—but not only—work with traditional bakeries (allowing them to better valorise flour) and specialise in specific kind of flour. Large mills have a weaker economic position, especially those which invested the most in flour export in the 1980’s, as export is now marginal, meaning that their structural expenses are somewhat too high. Small mills only work with traditional bakeries but cannot supply the industrial market, and so are unable to increase their activity, with fierce competition among them.
5.3.3. Factors Influencing the Price Negotiation for Wheat between Millers and Bakers/Retailers
Small and medium millers mainly sell their flour to traditional bakeries (medium bakers may also sell some volume to industry) while big millers mainly sell their flour to traditional bakeries within their franchise, industrial bakeries, and retailers. Traditional bakeries have low bargaining power and are considered as “price takers”. Industrial bakeries and retailers (which can purchase their flour from actors outside France, and in bigger quantities, follow the evolutions of the flour market) are usually able to purchase flour for lower prices (mainly influenced by EU competition on flour, as they less commonly purchase flour from outside EU, largely for quality reasons).
The ability of millers to control a flour mix (the mix between flour and additives) that is adapted to a bakery puts them in a rather dominant position in the negotiation of flour prices. However, the larger the volumes purchased by the industrial bakers and retailers (compared to the volumes purchased by traditional bakeries), the less dominant is the millers’ position in this negotiation.
5.3.4. Factors Influencing the Price Negotiation for Bread
The price of bread is influenced by several factors:
- (i)
the price at which flour was purchased (which depends on the quality of flour purchased). Wheat represents around 5% to 7% of the price of bread. Flour (including wheat) represents about 15% of the price of bread (this proportion is about 30% for organic bread). This means that raw materials play a small role in the price of bread, relative to personnel costs and other factors;
- (ii)
the quality of bread produced (which affects the level of labour force required);
- (iii)
the local competition on bread/food items locally sold. This refers to several dimensions: the ability to park easily to buy bread (especially in suburban areas), the diversity of baked products proposed, etc.;
- (iv)
the position/importance of bread in the overall market strategy of the actor selling bread. For example, in the case of retailers, data from the OFPM (the French Observatory of Price and Margins Formation for Food Products) shows that the sale of bread in supermarkets can be done without any margin at the scale of the bakery section, with the simple aim of being able to offer bread to customers within the entire shopping basket purchased.
5.4. Subsequent Steps in Developing the Hybrid SD and ABM Hybrid Model
The structure of the generic FVC model is based on the problem at hand (the fairness issue) and the objective of the modelling (test fairness improvement options with different experimental factors based on scenarios). Therefore, the agents that are part of the model and the agent decisions that are relevant for the modelling are selected based on the problem statement and the modelling objectives.
After developing the cognitive map, the agents are further defined in terms of the properties that define them (agent attributes), the behaviours that cause state changes (decisions) and the interactions resulting from these behaviours (activities). While this paper does not treat in detail the subsequent quantitative modelling steps in the modelling process, a brief overview is given here to provide a flavour of the work involved and help set an agenda for future research.
The main financial and production resources and variables for a generic FVC actor are shown in
Figure 7 as two interlinked modules on the left side (the system dynamics part), while the relevant ABM components such as agents’ decisions and agents’ parameters are presented on the right side.
This figure, which applies to each agent category in each FVC, shows: production inventory (in fact, there is one such module for each of conventional production, e.g., industrial baking or farming using pesticides, and alternative production, e.g., traditional baking or organic/ecological farming), at bottom left; financial resources balance, top left; and agents (attributes and behaviour), right.
The production inventory module is related to the quantities of products planned and supplied, and adjusted according to demand (orders), capacity to produce and average rates of utilisation, including time to produce and time to supply to buyer. The financial resources module is related to the financial balance for each agent and depends on revenues (a function of product price, quantity bought, time to obtain payment and public financing) and expenses for production (which depends on variable costs for production, and any additional expenses agreed or coming from unfair trading behaviour).
The production variable costs are connected to monetary values of production input resources, energy needed for production, labour needed for produced quantities and other costs such as production license costs or ecological standardisation taxes or equipment costs. To differentiate between conventional production and alternative production, we need to have monetary values for conventional and alternative input resources, traditional and renewable energy and payment rate per worker including social security and health care taxes.
To parameterise the production inventory and financial resources modules, the following information is needed: average or min to max values for product quantities produced every production period (once or more times per year), and euros received and spent per production volume per relevant time period (every month or three months or per year or other). For the agent module, it is necessary to clearly define the agent’s attributes (parameters such as name and number of agents in each category and values for the main variables in the production and financial resource modules), and the agent decision routines controlling or managing the variables from these modules.
The decisions are fleshed out in agent decision tables.
Table 2 illustrates the decisions of agents in a generic FVC. These tables are tools for collecting and organising qualitative and quantitative information of the main agent decision routines identified through the cognitive and agent mapping techniques.
For each agent decision routine, the following needs to be clearly explained:
Main goal (decision routine purpose),
Level and timing of the decision,
Detailed procedural description of each food value chain agent decision routine,
Any quantitative parameters associated with the decision routine,
Main related factors (endogenous and exogenous variables) conditioning the decision routine,
What if questions (hypothetical changes in the system) that can affect the agent decision routine.
The decision table then gives detailed information about each decision type for each agent in the food value chain being considered.
The particular agent behaviours and decisions chosen for quantitative formulation are those relevant to the what-if questions identified as important for the problem to be modelled. These questions will then drive out the agent decisions that need to be modelled to answer the questions. The relevant agent decisions will then be modelled quantitatively and used to derive fully specified algorithms, represented either as pseudocode or (as in
Figure 8) as formal flowcharts.
Agent-specific variables and decisions are taken as endogenous to the modelled system and will produce the emergent behaviour of the whole system. Other variables (factors) such as stock exchange prices, global supply and demand, relevant macroeconomic indicators, and market regulation are exogenous to the modelled system; a requirement for further work is to develop understanding of their influence on the system components (on agent decisions related to price setting and negotiation, UTP, production quantities etc.). Future papers will present details of this ongoing work.
6. Discussion
Major food systems need to contribute to the UN’s Sustainable Development Goals (SDGs) by increasing sustainable production efficiencies (more food with less impact), reducing food waste and loss, and shifting diets towards more plant-based food [
4,
5]. The Green Deal and the Farm to Fork strategy of the European Commission were launched with ambitious aims to tackle the challenges of the European food system and motivate transition to sustainable food system [
6,
7]. The simulation model described here is designed to assess the impact of intervention strategies e.g., for food value chain actors in future scenarios and how this may influence the gross profit margin and level of employment. An example is the implementation of regulations or policies set to influence transitions of the food system such as the Farm to Fork strategy to enhance the sustainability of European food systems.
As discussed earlier, food system transitions towards sustainability depend on fair procedures and outcomes. Exploration of the interorganisational fairness problem needs to account for interconnected effects between distributional fairness and procedural fairness, and effects of related and unrelated regulation: (a) how fair or unfair interrelations affect fair or unfair value distributions; (b) how bargaining power affects distributional and procedural fairness; and (c) how related and unrelated regulations affect the degree of fairness in value distribution and procedural interrelations. Gross margin can be used as a proxy indicator for fair value distribution, and for procedural fairness the Lerner index can give an estimate of the degree of market power, while the sizes and numbers of suppliers or buyers and the availability of alternatives can indicate bargaining power position [
13,
14,
25,
77].
The problem researched here (fair value distribution and fair procedural interrelations among food value chain agents) is not isolated but is connected to the overall global food system challenges of making food value chains economically, environmentally, and socially sustainable and resilient [
1,
3,
98,
99]. Simulation can help decision makers to assess the impact of interventions aimed at enhancing sustainability and resilience and how these interventions can subsequently impact fairness in food value chains. Fairness considerations are integral to the success of sustainability transitions since sustainable food consumption policies and intervention tools require the engagement and acceptance of key stakeholders including FVC actors [
100]. In addition, power asymmetries in FVCs may contribute to resistance to change by actors with more power in the system thus hampering more transformative change down the line [
101]. Given the complexity in the power structure of food value chains and the potential occurrence of unfair trading practices, there is value in exploring the problem of fairness using simulation models that can capture the FVC dynamics through operational indicators.
The result of the work is the conceptual model. It builds on key common features such as reference price, which influences trading prices and price negotiation; production seasonality and production inventory planning and adjustment according to orders and demand; financial resources management connected to sales revenues; public financing and product variable costs including additional costs related to unfair trading practices. Also, there are common macroeconomic factors that affect commodities prices such as global supply and demand, energy prices, trade tariffs and quotas which need to be considered. However, there are differences in connection to market competition structure and regulation in every FVC, and in connection to timing of production, supply, and demand, including differences in consumption patterns, which will need to be reflected in actors’ decisions. These distinctive aspects of different FVCs can then be added to the generic conceptual model to capture appropriately the specifics of the FVC being modelled.
The applicability and appropriateness of the hybrid SD/ABM modelling approach adopted for the other FVCs (see
Section 3) provides motivation for continuing the modelling exercise through the further stages of formulation, implementation and validation discussed in
Section 4 and outlined at the end of
Section 5; and extending this approach to other FVCs. This will allow users of the model to experiment on and test various what-if policy and market interventions and to inform the development of transition pathways towards more environmentally sustainable and socially fair food value chains. Examples of such experimental interventions include: (a) testing how a change in volumes produced/consumed may impact the whole of the food value chain in terms of (i) structure of the chain, (ii) total number of jobs and (iii) value-added distribution along the chain; (b) different “scenarios” connected to production, external financing, governance e.g., market led, or public/civil society led, changing level of CAP subsidies (“public financing”), and adjusting for fair value distribution.
In the context of the VALUMICS project, the future scenario development work considered contrasting paradigms to encapsulate, in essence, a set of “generic” hypotheses of how the overall governance of European food chains will evolve and plausible pathways on how to get there. This included scenario work to describe sustainable transitions of food systems while considering simultaneously socio-economic and environmental issues in a just transition perspective. A design of “just transition pathways” were elucidated through a methodological framework including quantification of employment until 2030 for the French Dairy Sector, using the decarbonation pathway for the agricultural sector issued from the French National Low-Carbon Strategy as reference [
102]. As mentioned earlier the needs of this work fed into the specifications of the conceptual modelling described in this paper. The lack of data turned out to be a limiting factor in the model formulation and high-impact assumptions needed to be made when data gaps were encountered, especially concerning firm level data and particularly for non-farmer actors. The formulation, implementation, and use of the quantitative model in the future scenario work will be the subject of a forthcoming stream of research.


 ,
, 


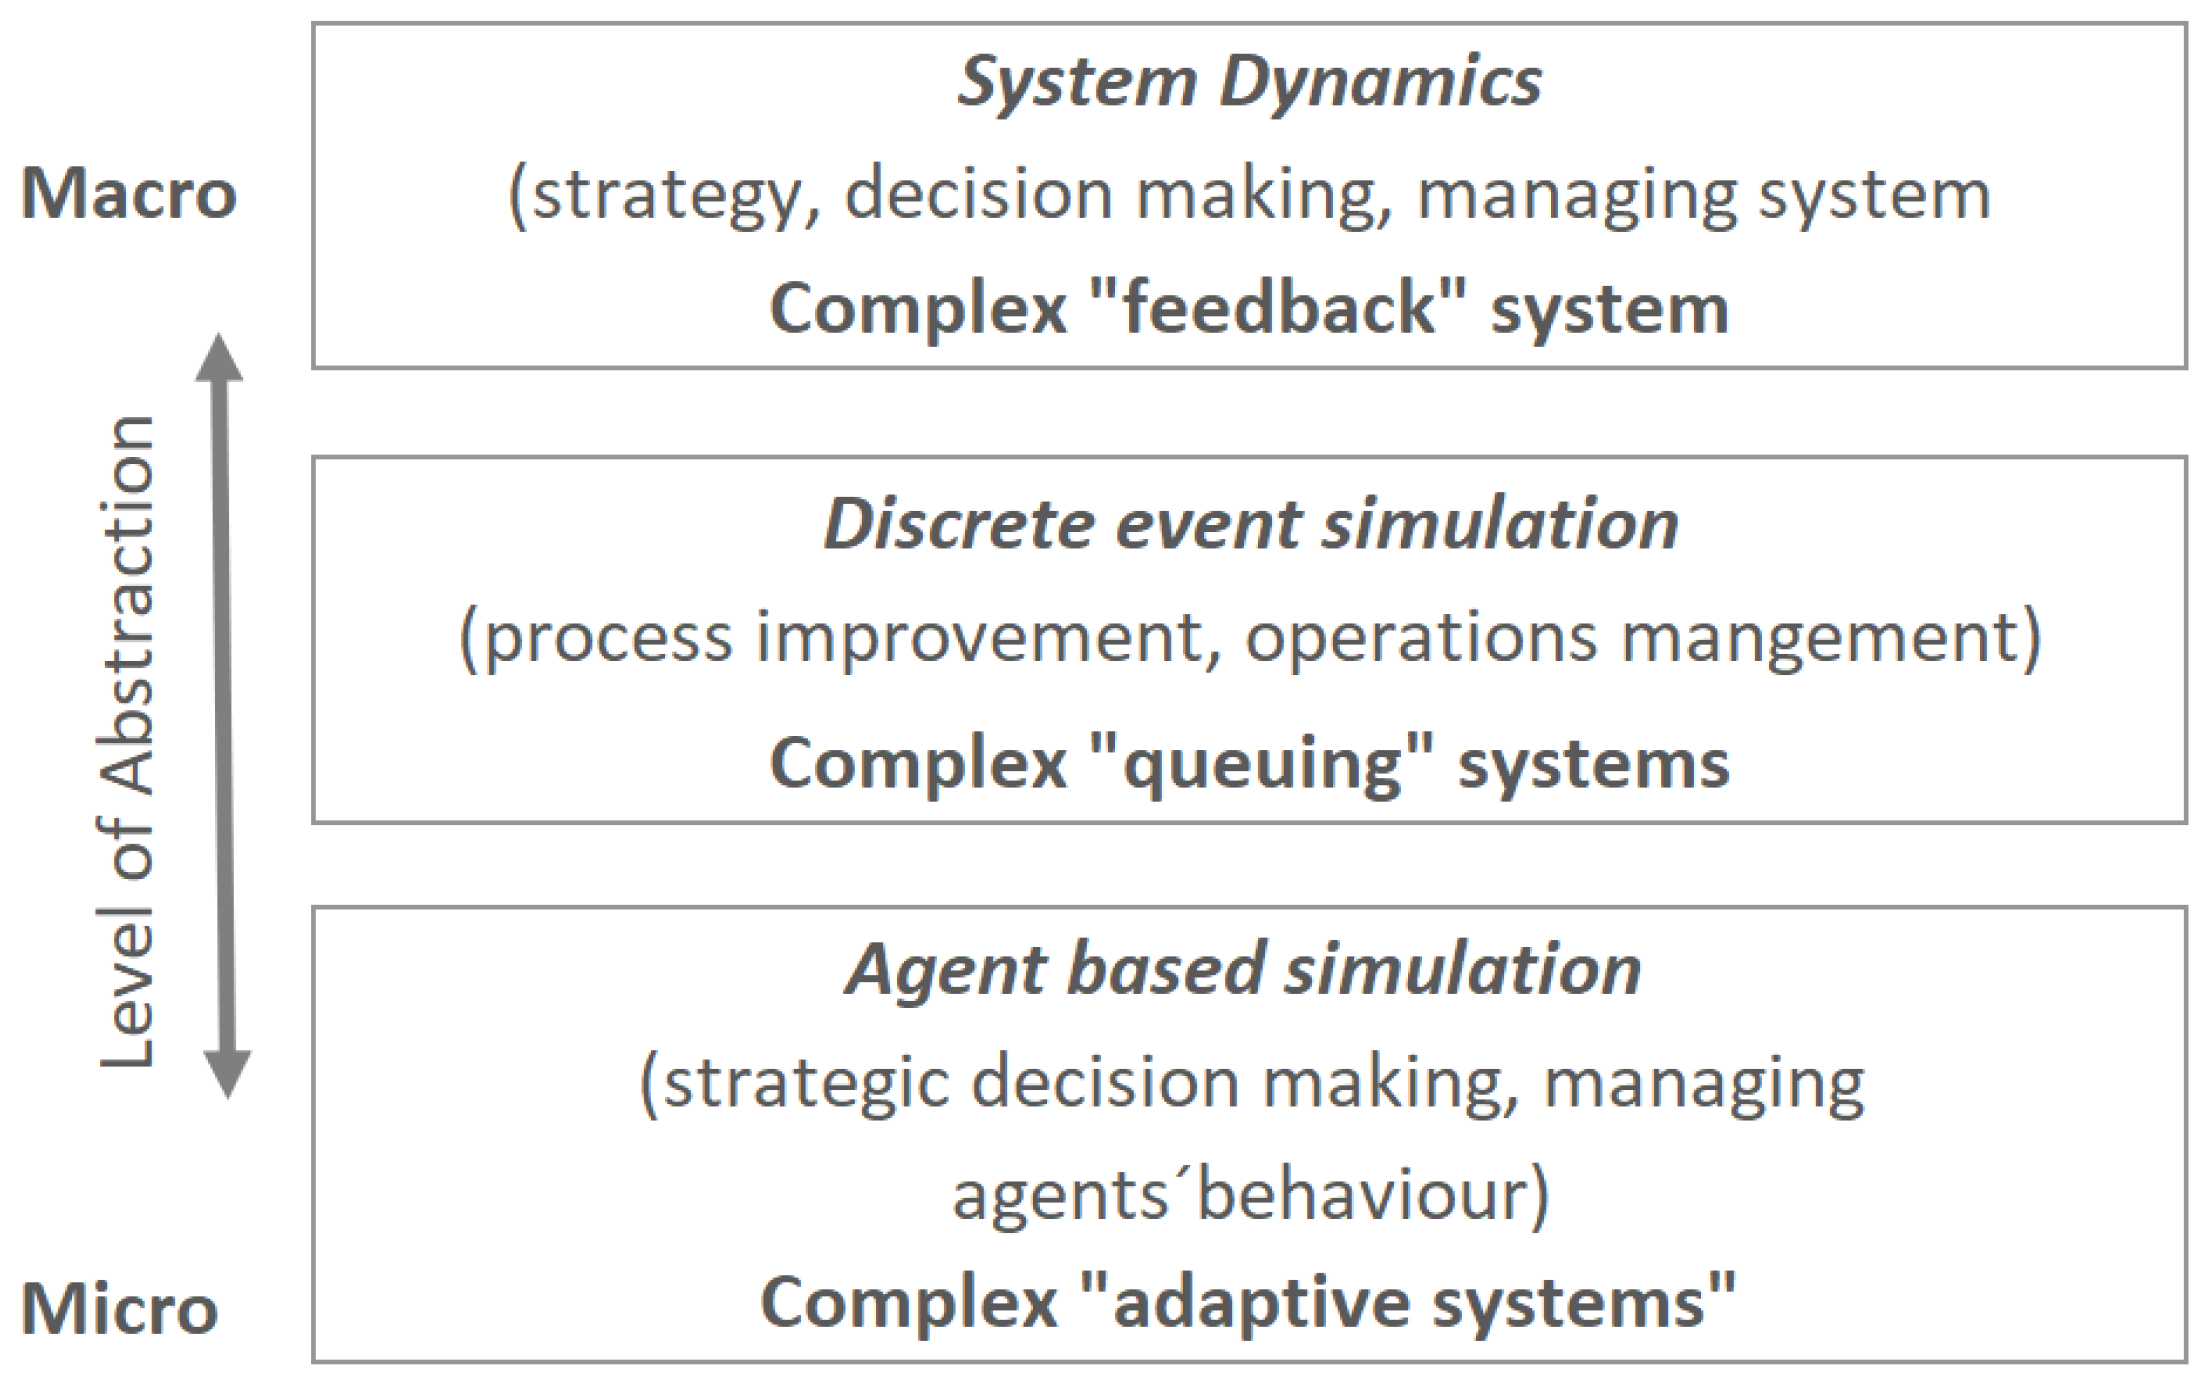