Article

Optimization of the Regulated Deficit Irrigation Strategy for Greenhouse Tomato Based on the Fuzzy Borda Model

1
Shangqiu Station of National Field Agro-Ecosystem Experimental Network, Shangqiu 476000, China
2
College of Water Resource Science and Engineering, Taiyuan University of Technology, Taiyuan 030024, China
*
Author to whom correspondence should be addressed.
Agriculture 2022, 12(3), 324; https://doi.org/10.3390/agriculture12030324
Submission received: 25 January 2022 / Revised: 18 February 2022 / Accepted: 21 February 2022 / Published: 24 February 2022
(This article belongs to the Section Agricultural Water Management)

Abstract

:
It is of great significance to explore the strategy of regulated deficit irrigation (RDI) under mulched drip irrigation to stabilize tomato yield and improve quality and efficiency. This experimental study was conducted on a drip-irrigated greenhouse in two consecutive years (2020 and 2021). Three deficit levels were set for the flowering and fruit development stage (Stage I), and three were set for the fruit-ripening stage (Stage II). As a combination evaluation method, the fuzzy Borda model was used to optimize the RDI strategy of greenhouse tomato. The results showed that the net photosynthetic rate, stomatal conductance, transpiration rate, and total shoot biomass of tomato decreased with an increase in the water deficit, while the intercellular CO2 concentration had an opposite trend. The mild and moderate water deficit at Stage I reduced tomato yield by 16–24% and 30–40% compared to full irrigation. The water deficit at Stage II was able to improve various quality parameters and the water-use efficiency of tomato; the irrigation water-use efficiency (32.8–33.9 kg/m3) and leaf water-use efficiency (3.2–3.6 μmol/mmol) were the highest when the soil water content was 70–90% θf (field capacity) at Stage I and 40–60% θf at Stage II (T3). Based on the fuzzy Borda combination evaluation model, T3 was determined as the treatment with stable yield, high quality, and efficient irrigation under the experimental conditions. The irrigation regime was as follows: irrigating 20–25 mm in the transplanting stage, no irrigation in the seedling stage, irrigating 193.2–220.8 mm at Stage I, and then irrigating 27.6 mm at Stage II.

1. Introduction

Water is an important factor affecting crop yield and quality [1]. With the improvement of people’s living standards, it is urgent for food production to shift from simply pursuing the improvement of yield to pursuing both yield and quality [2,3]. However, water shortages, high agricultural water consumption, and low utilization rates of irrigation water are the main factors restricting sustainable agricultural development [4,5]. In addition, crops have different water requirements at different growth stages [6,7]. On the basis of this background, regulated deficit irrigation (RDI) can produce appropriate water deficits in different growth stages of crops to improve crop quality and water-use efficiency without a significant yield reduction [8,9].
Tomato is one of the most common greenhouse crops [10]. The growth and physiological indexes of tomato were affected by RDI [11]. With the decrease in irrigation amount in each growth period, the dry matter mass of tomato decreased to different degrees [12,13]. In addition, crop photosynthesis also has a certain response to water deficits [14,15]. Studies have analyzed that RDI impacts photosynthesis mainly by affecting the stomatal closure of crops [16], and the degree of water deficit in different growth stages has different effects on the photosynthesis of crops [17]. At present, there are few reports on the responses of the physiological and growth indexes of greenhouse tomato to the upper and lower limits of irrigation at different growth stages. Thus, these aspects must be further investigated.
RDI can significantly improve the fruit quality and water-use efficiency of tomato [18,19,20,21]. Lu et al. [22] analyzed 561 experimental groups and 145 control groups and found that RDI could increase the WUE of tomato by 2.33 kg/m3 on average. Studies indicated that when irrigation was sufficient in other growth stages but halved in the seedling stage, there was no significant impact on tomato yield; however, water-use efficiency was significantly improved [23]. In addition, when the total irrigation amount was reduced by 40%, soluble sugar and VC increased by 20.26% and 16.10%, respectively [24]. The improvement of quality parameters such as the total soluble solids and VC of greenhouse tomatoes by deficit irrigation at the fruit-ripening stage was greater than that at other growth stages. Moreover, the yield, quality, and water-use efficiency of different soil types and tomato varieties responded differently to the degree of water deficits at different growth stages [22]. In combination with the existing research results and the soil entropy and water consumption of plants at the seedling stage, in this study, different degrees of water deficit tests were carried out at the flowering and fruit development stages (Stage I) and the fruit-ripening stage (Stage II) to investigate the effects of RDI on the growth indexes, physiology indexes, yield, quality, and water use of tomato.
When optimizing the RDI strategy of greenhouse tomato, the influence of water on a single index such as yield, quality, and utilization efficiency of irrigation water should be considered. It is more important to realize the multi-objective evaluation, which takes into account these three factors. At present, there are two commonly used multi-objective evaluation methods in the agricultural field: the single evaluation method and the combined evaluation model based on the single evaluation method. Common single evaluation methods include principal component analysis [25,26], grey relational degree analysis [27,28], membership function analysis [29,30], and TOPSIS [31,32]. In the same experiment, the results obtained by different single evaluation methods are often not completely consistent. For example, Li et al. [33] determined that the comprehensive ranking of the 50% E-pan irrigation level was better than that of the 70% E-pan level by principal component analysis and grey correlation analysis, while the results obtained by the TOPSIS method were opposite.
In order to further optimize the evaluation results, the researchers put forward a combination evaluation model based on a single set of evaluation methods. Under the guidance of the basic principles of comprehensive evaluation, a more effective combination was sought through the integration of methods to eliminate the random errors and system bias generated by using a single method. In this way, the inconsistency of multi-method evaluation results was solved [34]. Hu et al. [35] used four different combination evaluation models to comprehensively evaluate the yield and quality indexes of tomato under different water and nitrogen treatments. The results showed that the fuzzy Borda combination evaluation model was easy to calculate and offered the most obvious advantages. On the basis of this result, the fuzzy Borda combination evaluation model was used in the present study to comprehensively evaluate the yield, quality, and water use of greenhouse tomato under RDI in order to optimize the RDI strategy of greenhouse tomato.
Based on the different sensitivity levels of tomato to water deficits in different growth stages, this study set different water deficit degrees in the two water-sensitive stages (Stage I and Stage II) and carried out nine types of regulated deficit combination experiments on greenhouse tomato in two consecutive years. The objectives of this study were to (1) analyze the effects of RDI on the physiological and growth indexes, yield, quality, and water use of greenhouse tomato and (2) optimize the RDI strategy for greenhouse tomato through a fuzzy Borda combination evaluation model in order to improve the comprehensive quality and irrigation water-use efficiency as much as possible without a significant yield reduction.

2. Materials and Methods

2.1. Experimental Site Description

The experiment was conducted in the solar greenhouse of Liujiapu Tomato Industrial Park (37°64′ N, 112°48′ E), Taiyuan, Shanxi Province, China. The experimental area features a typical temperate continental monsoon arid climate, with an average annual temperature of 11 °C, rainfall of 520 mm and evaporation of 1812.7 mm, annual average sunshine duration of 2672 h, and a frost-free period of 202 days. The textural class of the experimental soil was sandy loam, and the basic physical and chemical properties in the 0–60 cm layer are shown in Table 1.
The total area of the greenhouse used for the experiment was 600 m2 (60 m × 10 m), and the area of each plot was 45 m2 (7.5 m × 6 m). Drip irrigation under plastic mulch was used in the experiments. Each ridge consisted of two rows of tomatoes and two rows of drip irrigation strips placed inside the tomato plants, with row spacing of 60 cm and plant spacing of 50 cm. The planting density was 33,333 plants/ha. Five to seven days after transplanting, the surface was covered with black plastic film with a width of 1.5 m and a thickness of 0.008 mm. In order to prevent the lateral exchange of soil water between plots, an impervious film with a depth of 60 cm was buried between two adjacent plots.

2.2. Experimental Design

The tomato variety “Shouyan PT326” was used in the experiment, which was transplanted at the three-leaf stage (10 May 2020; 12 May 2021). To ensure the survival rate of tomato after transplanting, the planting water was irrigated with 20 mm and 25 mm in 2020 and 2021, respectively. The growth period of tomato was divided into the seedling stage (10 May to 6 June 2020; 12 May to 15 June 2021), flowering and fruit development stage (7 June to 11 August 2020; 16 June to 23 August 2021), and fruit-ripening stage (12 August to 18 September 2020; 24 August to 22 September 2021).
According to the water sensitivity of tomato in combination with the upper and lower limits of irrigation, the RDI experiment was conducted at Stage I and Stage II. A total of nine treatments was used, and each treatment was set with three replicates. The specific irrigation scheme is shown in Table 2, where 70–90% θf indicates that the lower limit and upper limit of irrigation water were 70% and 90% of field capacity, respectively; the other levels were similar. From Stage I, the soil moisture content was measured every 7 days in vertical layers (0–60 cm), 15 cm away from the plant. When the average soil moisture content fell below the irrigation lower limit, the irrigation amount was calculated, and the soil was irrigated by a drip irrigation system.
Before transplanting, 3/5 of nitrogen fertilizer (300 kg/hm2) and potassium fertilizer (300 kg/hm2), as well as all phosphate fertilizer (200 kg/hm2) and organic fertilizer (20,000 kg/hm2), were applied evenly into the tillage layer. At the fruit development stages of the first and third ear, 1/5 of N and K fertilizer was applied, respectively. The topdressing fertilizer was dissolved in buckets and applied to the soil with water through a drip irrigation system. The nitrogen, phosphorus, and potassium fertilizer contained urea (WN ≥ 46.4% represents the content of nitrogen is greater than or equal to 46.4%, similarly hereinafter), calcium magnesium phosphate (WP2O5 ≥ 15.0%), and potassium chloride (WK2O ≥ 57.0%), respectively.

2.3. Measurements

2.3.1. Physiological and Growth Indexes of Tomato

The physiological and growth indexes of tomato were measured at two deficit growth periods. The net photosynthetic rate (Pn), stomatal conductance (Gs), transpiration rate (Tr), and intercellular CO2 concentration (Ci) of three evenly growing tomatoes were measured in each treatment. WUEL = Pn/Tr represents the water-use efficiency based on leaf level. The photosynthetic indexes were measured by a Li-6400 portable photosynthetic system. The measurement time was 09:00–12:00 in the morning, and the height and orientation of tomato leaves taken during measurements remained consistent. Next, the stem, leaf, and fruit of the tested plants were separated and immediately placed in an oven at 105 °C for 30 min and dried at 75 °C until they reached a constant weight. Then, the dry weight was measured using a balance with a precision of 0.01 g.

2.3.2. Yield and Irrigation Water Utilization Efficiency

For each tomato plant, we left 4 ears of fruit and then picked the core. An electronic balance with a precision of 0.05 kg was used to measure the yield of tomato in each treatment. The calculation formula for irrigation water utilization efficiency is as follows:
W U E Y = Y / I
where WUEY represents the irrigation water utilization efficiency (kg/m3), Y represents the yield (kg/hm2), and I represents the total irrigation amount (m3/hm2).

2.3.3. Fruit Quality Parameters

When the third ear of tomato was ripe, 9 fruits were randomly selected from the top, middle, and bottom parts of each treatment plant to determine the quality. The Fruit shape index (FSI) was taken as the ratio of the longitudinal diameter to the average transverse diameter of the tomato. Fruit firmness (Fn) was measured by using a fruit hardness tester (GY-4,Aipu, Quzhou, China) 3 times on the fruit body and shoulder and then taking the average value. The soluble sugar (SS) was determined by anthrone colorimetry [36] and organic acids (OA) titrated with 0.1 mol/L NaOH [3]. The sugar/acid content ratio (SAR) was calculated by the ratio of soluble sugar to organic acid. Vitamin C (VC) was determined by the 2, 6-dichlorophenol sodium indophenol titration [37].

2.4. Model Application and Methods

The yield, quality, irrigation water-use efficiency, and water-use efficiency based on the leaf level of the tomato were taken as evaluation indexes. The principal component analysis model (PCA) [38], grey relational degree analysis model (GRA) [39], TOPSIS model based on the analytic hierarchy process (TOPSIS-AHP) [40,41], and the membership function analysis model (MFA) [42] were used to evaluate the yield, quality, and water use of tomato. A Kendall Concorde coefficient test [43] was used to test the consistency of single evaluation methods to determine whether the four single evaluation methods were compatible. The fuzzy Borda combined evaluation model [44] was used to comprehensively evaluate the results of the various single evaluation methods. The specific calculation steps of this model are as follows:
(1) Calculate the membership degree of the single evaluation method μij:
μ i j = X i j min ( X i j ) max ( X i j ) min ( X i j ) × 0.9 + 0.1
where Xij represents the score of i treatment under the j method, and μij represents the membership degree of i treatment under the j evaluation method.
(2) Calculate the fuzzy frequency:
W h i = ρ h i h = 1 n ρ h i
where , ρ h i = j = 1 m δ i h × μ i j ,   h = 1 , 2 n ;   δ i h = { 0 , T r e a t m e n t   i   is   not   in   position h 1 , T r e a t m e n t   i   is   in   position   h
(3) Calculate the fuzzy Borda number:
F i = j = 1 4 W h i Q h i j ( i = 1 , 2 n ; j = 1 , 2 n )
where Qhi-j represents the score of i treatment in position h under the j evaluation method:
Q h i j = ( n h ) × ( n h + 1 ) 2
After being sorted according to Fi, a larger value indicates a higher overall score.

2.5. Statistical Analysis

IBM SPSS Statistics 26 was used for the correlation analysis, regression analysis, PCA, and analysis of variance, while the LSD method was used for significance analysis at a p ≤ 0.05 level. Excel was used to calculate the path coefficient, GRA, MFA, TOPSIS-AHP, prior inspection, and fuzzy Borda combination evaluation model.

3. Results

3.1. Photosynthetic Characteristics of Tomato

The results indicated that Pn, Gs, and Tr presented similar patterns under RDI (Figure 1). Pn, Gs, and Tr were 34.4–77.7%, 3.0–55.7%, and 40.6–64.1% more plentiful at Stage I than Stage II. Compared with full irrigation, mild and moderate deficit irrigation at Stage I reduced Pn, Gs, and Tr by 3.2–11.1% and 12.1–25.8%, 12.7–25.0% and 25.2–41.6%, and 16.9–25.5% and 27.9–44.1%, respectively. When the irrigation level was the same at Stage I, compared to mild deficit irrigation, moderate and severe deficit irrigation at Stage II reduced Pn, Gs, and Tr by 2.1–27.8% and 5.4–47.6%, 0.4–23.4% and 2.5–32.1%, and 0.6–19.1% and 2.1–25.4%, respectively. The effect of RDI on Ci was opposite to that on Pn, Gs, and Tr. When full irrigation and mild deficit irrigation were applied at Stage I, the water deficit at Stage II had no significant effect on other indexes except for Gs and Tr treated by T1 and Pn treated by T6. While moderate deficit irrigation was applied at Stage I, the water deficit at Stage II had more significant effects on Pn and Tr.

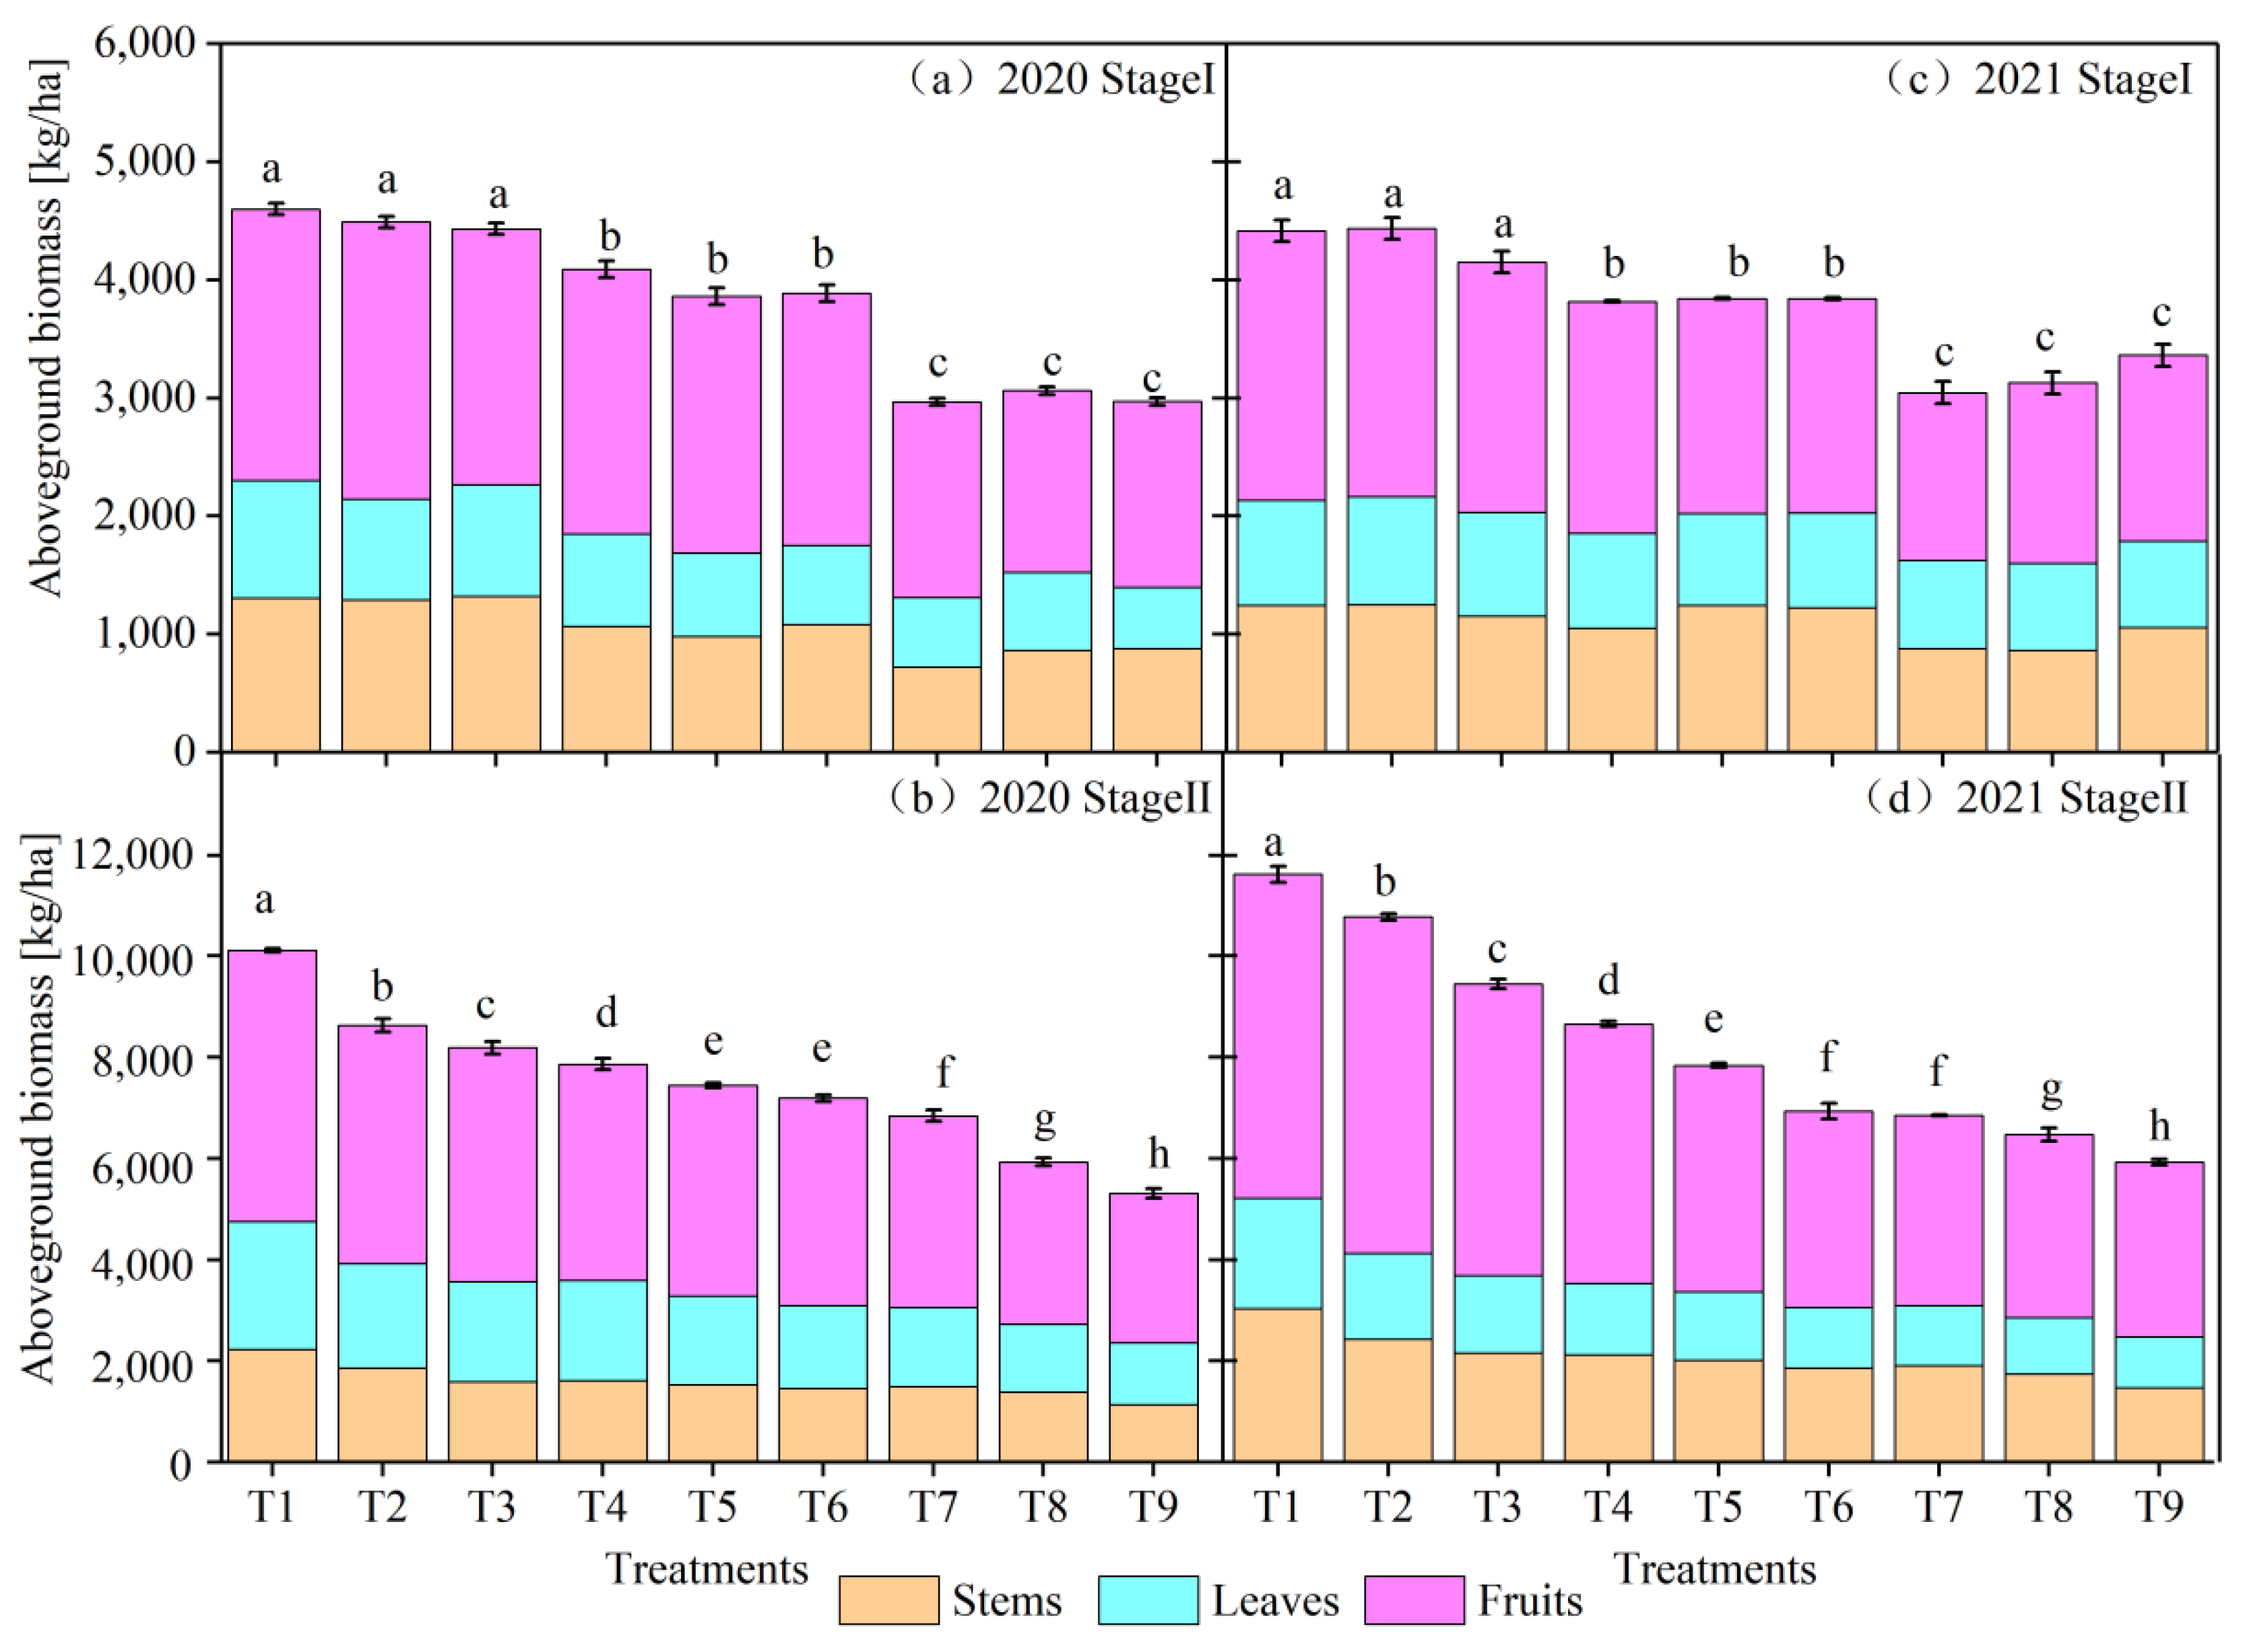
3.2. Aboveground Biomass Accumulation and Allocation

Figure 2 shows the effects of RDI on the aboveground biomass accumulation and allocation of tomato plants in the two consecutive years. At Stage I, the total biomass of the shoot under full irrigation was 7.5–14.0% and 19.0–35.5% higher, respectively, than that under mild and moderate water deficits. The average proportion of fruit weight at Stage I was 19.8–27.5% and 27.6–35.7% higher than that of the stem and leaf, respectively. The proportion of fruit weight in T4 and T7 was 3.0–4.1% and 1.6–2.6% higher than that in T1, respectively. Under the same irrigation level at Stage I, compared with the mild water deficit, the moderate and severe water deficit reduced the total biomass of the shoot by 5.3–14.7% and 8.6–22.5%, respectively, at Stage II. Except for T7 and T1, which were the same in 2021, T2–T9 accounted for 0.9% to 6.8% more fruit weight than T1 at Stage II.

3.3. Yield and Water-Use Efficiency

The results of two consecutive years showed that the water deficit at Stage I had a significant effect on tomato yield, while the water deficit at Stage II had no significant effect on tomato yield (Table 3). Compared with full irrigation, the yield of tomato decreased by 16–24% and 30–40%, respectively, due to mild and moderate water deficits at Stage I. Reducing the irrigation amount at Stage II helped improve the WUEY. Compared with the mild water deficit, the moderate and severe water deficits increased the WUEY by 2–10% and 11–21%, respectively. In addition, when the total irrigation amount was the same, the irrigation amount was 20–26% greater at Stage I than at Stage II, and the WUEY of the tomato was increased by 9–20%. A higher yield and lower irrigation amount led to the highest WUEY under T3, which was 24% higher in 2020 and 23% higher in 2021 than the lowest value (T4 and T7), respectively. As can be seen from Table 3, WUEL in T3 was the highest, which was, respectively, 48% and 37% higher than the lowest value (T9) in the two consecutive years.

3.4. Fruit Quality

Table 4 presents the data provided from the experiments on fruit appearance quality (FSI), nutritional quality (VC, OA), flavor quality (SS, SAR), and storage and transportation quality (Fn) of greenhouse tomato in the two consecutive years. It can be seen from the table that the improvement effect of the water deficit on the tomato quality indexes was more significant at Stage II than at Stage I. At the same irrigation level at Stage I, compared with the mild water deficit at Stage II, moderate and severe water deficits increased the FSI by 2.2–4.7% and 5.4–13.3%; the VC value increased by 7.9–35.0% and 22.8–62.0%; the OA value increased by 7.0–30.2% and 12.3–43.9%; the SS increased by 9.8–30.9% and 18.9–58.0%; and the SAR increased by 0.3–25.5% and 19.2–34.9% due to the increasing effect of the deficit water on soluble sugar was greater than that on organic acid. In addition, the fruit firmness of moderate and severe water deficit was 18.4–45.0% and 32.3–63.6% higher than that of mild water deficit, which was beneficial to fruit storage and transportation. In conclusion, severe water deficit at Stage II results in the best performance of tomato fruit quality parameters in the two consecutive years.

3.5. Fuzzy Borda Combination Evaluation

3.5.1. Evaluation Results of a Single Evaluation Method

Four single evaluation methods (PCA, GRA, MFA, and TOPSIS-AHP) were used to evaluate the tomato yield, quality parameters, WUEY, and WUEL (Table 5). It can be seen from the table that the standard deviation for the ranking of the four evaluation methods in 2020 and 2021 ranged from 0 to 1.63 and 0 to 1.26. In the two consecutive years, 6-7 of 9 treatments had a standard deviation of less than 1, while those of the other treatments were all greater than or equal to 1. Therefore, there are still some differences in the evaluation results of the four single evaluation methods. Moreover, the fuzzy Borda combined evaluation model can be used to carry out a combined evaluation of the four single evaluation methods, which can eliminate the differences between single evaluation methods.

3.5.2. Evaluation Results of Fuzzy Borda Combination Evaluation

Before using the fuzzy Borda combination evaluation, the single evaluation methods were tested in advance. The Kendall correlation coefficients of the order values for the four single evaluation models [45] are shown in Table 6. Here, the mean correlation coefficients between the evaluation values of each single method and other methods are between 0.67 and 0.87, and the comprehensive correlation between GRA and the other three methods is presented to be the strongest in the two consecutive years. A Kendall-W Concorde coefficient test was further used for the significance test [35,43]. The Kendall-W Concorde coefficients were calculated to be 0.91 and 0.95 (W), respectively, in the two consecutive years. And 29.00 and 30.27 for χ2 =M(N − 1)W, respectively, in the formula, M is the number of single evaluation methods is 4, and N is the number of treatments is 9. All χ2 values were greater than χ20.01/8 =17.54, indicating that the four methods were compatible and satisfied the prior consistency test.
The fuzzy Borda combination evaluation model was used to combine the results of the above single evaluation methods (Table 7). As can be seen from the table, there was strong consistency in the evaluation results between the two consecutive years. The comprehensive evaluation value reached its maximum under T3 (35.40 and 33.78, respectively), while the comprehensive evaluation score was the lowest under T4 and T7. The results indicated that the optimal irrigation scheme would involve a combination of soil moisture content of 70–90% θf and 40–60% θf at Stage I and Stage II, respectively.

4. Discussion

4.1. Effects of RDI on Photosynthesis and Its Relationship with Yield

Photosynthesis is an important physiological process of crops. The RDI affects the photosynthesis of plants through stomatal restriction and nonstomatal restriction [46]. In this paper, Ci values increased with an increase in the water deficit, indicating that the decrease in stomatal conductance was the result of a decrease in photosynthetic rate [47]. In addition, after the moderate water deficit at Stage I, the mild water deficit at Stage II was shown to have a certain compensation effect on Pn, Gs, and Tr, which is similar to the results of Yu et al. [48] and may be the result of stomatal resistance, mesophile conductivity, biochemistry, or other factors [49].
Correlation analysis was conducted between the photosynthetic indexes and yield in two growth periods (Figure 3). Except for Ci at Stage II, the correlation between photosynthetic indexes and yield in both growth stages reached a significant level (p ≤ 0.05). In addition, the correlation coefficients of Ci, Tr, and tomato yield at Stage I were higher than those at Stage II, possibly because Stage I is the key growth period for tomato yield, during which the tomato root produces abscisic acid and water losses through xylem transport to the plant leaves, thereby decreasing stomatal opening and inhibiting crop leaf transpiration [50,51]. The low correlation coefficients between Pn, Gs, and yield at Stage I may be caused by the large interannual difference of Pn and Gs.

4.2. Effects of RDI on the Yield, Quality, and Water Use of Tomato

The effect of RDI on crop yield is related to the intensity, duration, and growth stage of deficit irrigation [1,11,22]. Adequate or mild deficit irrigation at Stage I is critical for yield formation [52]. This study also concluded that the effect of the water deficit at Stage I on tomato yield was greater than that at Stage II. Liu et al. [53] obtained the following results from potted experiments in the tomato flowering and fruiting stages with different irrigation levels: the WUEY was the highest when the irrigation level was 80–90% θf at Stage I. In this study, the irrigation water-use efficiency was highest when the irrigation level was 70–90% θf at Stage I and 40–60% θf at Stage II (T3). When the total irrigation amount was the same, a greater irrigation amount at Stage I was beneficial to improve the utilization efficiency of the irrigation water.
In this study, RDI was carried out during two water-sensitive periods for tomato plants. The effect of a water deficit on the quality parameters at Stage II was greater than that at Stage I. With an increase in the water deficit at Stage II, the VC, OA, SS, and SAR improved. These results agree with those of Chen et al. [3] and may be because an increase in the water deficit reduced the fluid flow to the phloem, as well as fruit dilution, leading to an increase in the concentration of various fruit components [15,54]. In addition, with an increase in the water deficit, tomato fruit firmness gradually increased, possibly due to a decrease in the internal expansion of the fruit under conditions with insufficient water, leading to a decrease in the pressure of the cell wall, thereby improving the elasticity of the fruit epidermis [2].

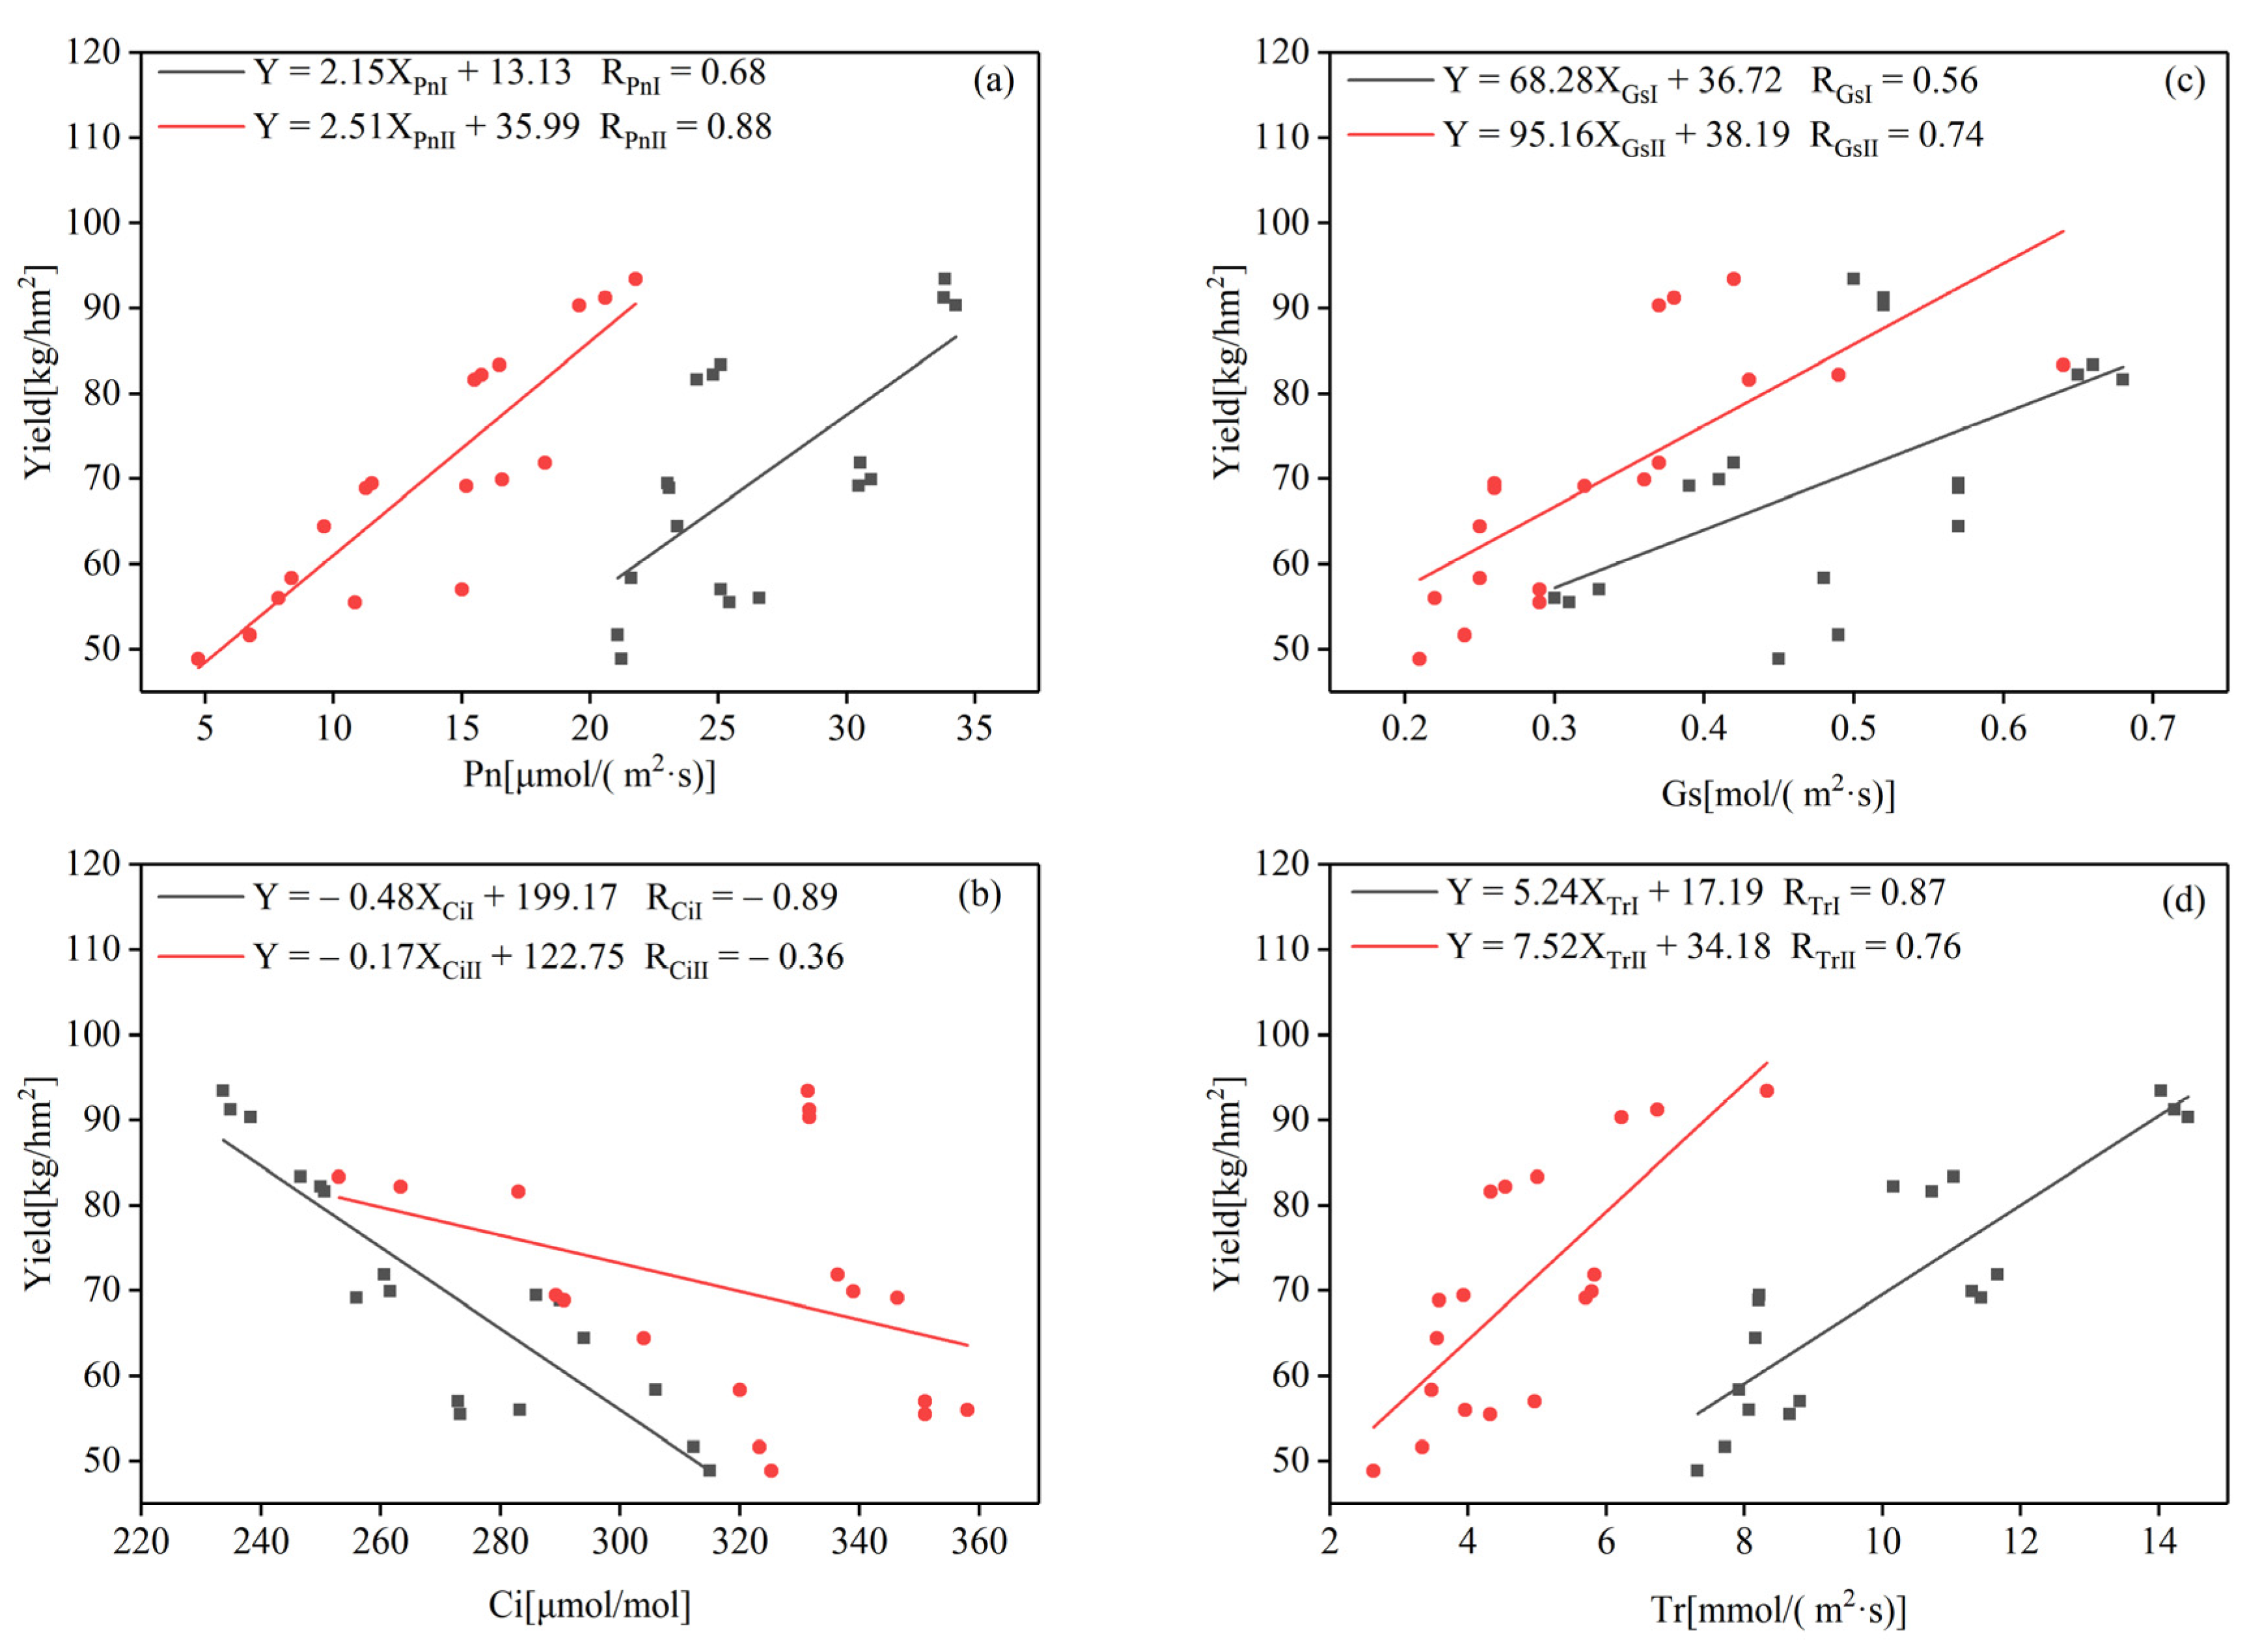
4.3. Relationship between Tomato Yield, Growth, and Physiology Indexes

Studies have analyzed that there is a positive correlation between the yield, biomass, and photosynthetic characteristics of tomato leaves [55,56,57,58]. With a decrease in the irrigation amount, all the photosynthetic indexes, root biomass, and yield of tomato decreased [59]. In this study, different deficit levels were set at Stage I and Stage II. The yield, biomass, and leaf photosynthetic indexes (Pn, Gs, Tr) of tomato in both years were all decreased by water deficits, which was consistent with previous research results.
Path analysis [60,61] was also applied, taking the irrigation amount, photosynthetic index (XPn, XGs, XCi, XTr), and dry weight of shoot organs (Xstem, Xleaf, and Xfruit) at Stage II of greenhouse tomato as independent variables and yield (Y) as dependent variables. The optimal regression equation was obtained by the stepwise regression method: Y = 57.853 + 1.022XPn − 0.112XCi + 0.008Xfruit. The maximum direct path coefficient of dry fruit weight on the yield was 0.571, the minimum direct path coefficient of Ci on the yield was −0.241, and the maximum indirect path coefficient of Pn through dry fruit weight on the yield was 0.512. Lu et al. [62] reached similar conclusions through a correlation analysis, showing that postanthesis dry matter accumulation and final aboveground biomass play key roles in the final yield of wheat.

4.4. Comprehensive Evaluation of Yield, Quality, and Water Use of Tomato

In this study, four single evaluation methods were used to evaluate the yield, quality, and water-use indexes of tomato. The standard deviation was greater than 0 for ranking 6–7 of the 9 treatments. This phenomenon emerged because the mechanism for each single evaluation method is different, with different angles and emphasis placed on the use of information, combined with the artificial factors that exist in the process of evaluation [63]. In addition, the grey correlation analysis method has the highest correlation with the other three evaluation methods, as well as low data requirements, a lower workload, and simpler calculations [64]. It is, therefore, recommended to use the grey correlation analysis method when selecting a single evaluation method.
In this study, the fuzzy Borda combination evaluation model was used to evaluate the yield, quality, and water use of tomato under RDI. The results of the experiments were largely consistent between the two years of the study. Further analysis of the correlation between the standardized yield, average value of each quality parameter, and irrigation quota (Figure 4). We concluded that under an irrigation quota of 266 mm, the tomato yield and comprehensive quality were balanced, the standardized yield and quality parameters were above 0.8, and the irrigation water-use efficiency was higher. These results were consistent with those of the fuzzy Borda model, which showed that this method can be used to optimize crop RDI strategies. In addition, the fuzzy Borda combination evaluation model overcame the disadvantage of extracting only the order-value information of a single evaluation method without the evaluation value information; moreover, the calculation process is relatively simple [35]. It is, therefore, suggested to use the fuzzy Borda model for the comprehensive evaluation of a single evaluation method.

5. Conclusions

The leaf Pn, Gs, Tr, aboveground biomass, and yield of greenhouse tomato decreased with an increase in the water deficit degree, while the Ci value increased with a decrease in the water deficit degree. The application of an appropriate water deficit (T2 and T3) facilitated the distribution of nutrients to fruit. Compared to full irrigation, the yield of tomato decreased by 16–24% and 30–40% under mild and moderate water deficits at Stage I. Controlling water content between 40% θf to 60% θf at Stage II improved the fruit quality parameters. When the total irrigation amount was the same, the irrigation amount was 20–26% greater at Stage I than at Stage II, and the WUEY of tomato increased by 9–20%. In the two consecutive years (2020 and 2021), the WUEL and WUEY of T3 were the highest at 3.2–3.6 μmol/mmol and 32.8–33.9 kg/m3, respectively. Using the fuzzy Borda combination evaluation model, the yield, quality, and water use of tomato in the two consecutive years were comprehensively evaluated. The results indicated that the optimal irrigation regime was as follows: irrigation of 20–25 mm in the transplanting stage, no irrigation in the seedling stage, irrigation of 193.2–220.8 mm at Stage I, and irrigation of 27.6 mm at Stage II. The optimal RDI strategy matches with the T3. The RDI may affect the growth physiology, yield, quality, and water-use indexes of crops by first affecting hormones and enzymes. However, this result needs further analysis.

Author Contributions

X.L. edited the original draft; J.M., L.Z., J.C., X.S. and X.G. reviewed and edited the draft; J.M. and L.Z. provided the funding. All authors have read and agreed to the published version of the manuscript.

Funding

This research was financially supported by the Shangqiu Station of National Field Agro-ecosystem Experimental Network Open Fund Project (FIRI202004-0102), the Scientific and Technologial Innovation Programs of Higher Education Institutions in Shanxi Province (2020L0093), the National Natural Science Foundation of China (52079085), and the Key Research and Development Projects of Shanxi Province (201903D211011).

Institutional Review Board Statement

Not applicable.

Informed Consent Statement

Not applicable.

Data Availability Statement

Not applicable.

Conflicts of Interest

The authors declare no conflict of interest.

References

  1. Khapte, P.S.; Kumar, P.; Burman, U.; Kumar, P. Deficit irrigation in tomato: Agronomical and physio-biochemical implications. Sci. Hortic. 2019, 248, 256–264. [Google Scholar] [CrossRef]
  2. Guichard, S.; Bertin, N.; Leonardi, C.; Gary, C. Tomato fruit quality in relation to water and carbon fluxes. Agronomie 2001, 21, 385–392. [Google Scholar] [CrossRef]
  3. Chen, J.L.; Kang, S.Z.; Du, T.S.; Guo, P.; Qiu, R.J.; Chen, R.Q.; Gu, F. Modeling relations of tomato yield and fruit quality with water deficit at different growth stages under greenhouse condition. Agric. Water Manag. 2014, 146, 131–148. [Google Scholar] [CrossRef]
  4. Buttaro, D.; Santamaria, P.; Signore, A.; Cantore, V.; Boari, F.; Montesano, F.F.; Parente, A. Irrigation management of greenhouse tomato and cucumber using tensiometer: Effects on yield, quality and water use. Agric. Agric. Sci. Procedia 2015, 4, 440–444. [Google Scholar] [CrossRef] [Green Version]
  5. FAO. Water for Sustainable Food and Agriculture a Report Produced for the G20 Presidency of Germany; FAO: Rome, Italy, 2017. [Google Scholar]
  6. Hooshmanda, M.; Albajia, M.; Boroomand, S.; Ansarib, N.A. The effect of deficit irrigation on yield and yield components of greenhouse tomato (Solanum lycopersicum) in hydroponic culture in Ahvaz region. Iran. Sci. Hortic. 2019, 254, 84–90. [Google Scholar] [CrossRef]
  7. Zhong, Y.; Fei, L.; Zeng, J.; Fu, Y.; Dai, Z. Effects of root-zone water deficit on yield, quality and water use efficiency of young apple trees under surge-root irrigation. Trans. Chin. Soc. Agric. Mach. 2019, 35, 78–87. [Google Scholar]
  8. Ruiz-Sánchez, M.C.; Domingo, R.; Castel, J.R. Review.Deficit irrigation in fruit trees and vines in Spain. Span. J. Agric. Res. 2010, 8, 5–20. [Google Scholar] [CrossRef] [Green Version]
  9. Zhou, H.; Chen, J.; Wang, F.; Li, X.; Génard, M.; Kang, S. An integrated irrigation strategy for water-saving and quality-improving of cash crops: Theory and practice in China. Agric. Water Manag. 2020, 241, 106331. [Google Scholar] [CrossRef]
  10. Erba, D.; Casiraghi, M.C.; Ribas-Agustí, A.; Caceres, R.; Marfa, O.; Castellari, M. Nutritional value of tomatoes (Solanum lycope rsicum L.) grown in greenhouse by different agronomic techniques. J. Food Compos. Anal. 2013, 31, 245–251. [Google Scholar] [CrossRef]
  11. Chand, J.B.; Hewa, G.; Hassanli, A.; Myers, B. Deficit Irrigation on Tomato Production in a Greenhouse Environment: A Review. J. Irrig. Drain. Eng. 2021, 147, 04020041. [Google Scholar] [CrossRef]
  12. Wang, C.; Gu, F.; Chen, J.; Yang, H.; Jiang, J.; Du, T.; Zhang, J. Assessing the response of yield and comprehensive fruit quality of tomato grown in greenhouse to deficit irrigation and nitrogen application strategies. Agric. Water Manag. 2015, 161, 9–19. [Google Scholar] [CrossRef]
  13. Wen, A.; Zhang, H. Plant growth of processing tomato (Solanum lycopersicum) subjected to water deficit regulated with mulched drip irrigation. Adv. Mater. Res. 2014, 838–841, 2366–2369. [Google Scholar] [CrossRef]
  14. Yang, H.; Du, T.; Qiu, R.; Chen, J.; Wang, F.; Li, Y.; Wang, C.; Gao, L.; Kang, S. Improved water use efficiency and fruit quality of greenhouse crops under regulated deficit irrigation in northwest China. Agric. Water Manag. 2017, 179, 193–204. [Google Scholar] [CrossRef]
  15. Du, Y.-D.; Cao, H.-X.; Liu, S.-Q.; Gu, X.; Cao, Y.-X. Response of yield, quality, water and nitrogen use efficiency of tomato to different levels of water and nitrogen under drip irrigation in Northwestern China. J. Integr. Agric. 2017, 16, 1153–1161. [Google Scholar] [CrossRef] [Green Version]
  16. Reddya, A.R.; Chaitanyaa, K.V.; Vivekanandan, M. Drought-induced responses of photosynthesis and antioxidant metabolism in higher plants. J. Plant. Physiol. 2004, 161, 1189–1202. [Google Scholar] [CrossRef]
  17. Zhang, X.; Fan, Y.; Jia, Y.; Cui, N.; Zhao, L.; Hu, X.; Gong, D. Effect of water deficit on photosynthetic characteristics, yield and water use efficiency in Shiranui citrus under drip irrigation. Trans. CSAE 2018, 34, 143–150. [Google Scholar]
  18. Agbna, G.H.D.; She, D.; Liu, Z.; Nazar, A.E.; Shao, G.; Luis, C. Effects of deficit irrigation and biochar addition on the growth, yield, and quality of tomato. Sci. Hortic. 2017, 222, 90–101. [Google Scholar] [CrossRef]
  19. Wu, Y.; Yan, S.; Fan, J.; Zhang, F.; Xiang, Y.; Zheng, J.; Guo, J. Responses of growth, fruit yield, quality and water productivity of greenhouse tomato to deficit drip irrigation. Sci. Hortic. 2021, 275, 109710. [Google Scholar] [CrossRef]
  20. Hao, S.; Cao, H.; Wang, H.; Pan, X. Effects of water stress at different growth stages on comprehensive fruit quality and yield in different bunches of tomatoes in greenhouses. Int. J. Agric. Biol. Eng. 2019, 12, 67–76. [Google Scholar] [CrossRef]
  21. Lovelli, S.; Potenza, G.; Castronuovo, D.; Perniola, M.; Candido, V. Yield, quality and water use efficiency of processing tomatoes produced under different irrigation regimes in Mediterranean environment. Ital. J. Agron. 2017, 12, 795. [Google Scholar] [CrossRef] [Green Version]
  22. Lu, J.; Shao, G.; Cui, J.; Wang, X.; Keabetswe, L. Yield, fruit quality and water use efficiency of tomato for processing under regulated deficit irrigation: A meta-analysis. Agric. Water Manag. 2019, 222, 301–312. [Google Scholar] [CrossRef]
  23. Li, X.; Ma, J.; Sun, X.; Shi, X.; Guo, X.; Lei, T. Effects of water saving and nitrogen reduction on tomato growth and utilization rate ofwater and nitrogen in greenhouse. J. Drain. Irrig. Mach. Eng. 2021, 39, 1056–1061. [Google Scholar]
  24. Zhu, Y.; Cai, H.; Song, L.; Wang, X.; Shang, Z.; Sun, Y. Aerated irrigation of different irrigation levels and subsurface dripper depths affects fruit yield, quality and water use efficiency of greenhouse tomato. Sustainability 2020, 12, 2703. [Google Scholar] [CrossRef] [Green Version]
  25. Luo, H.; Li, F. Tomato yield, quality and water use efficiency under different drip fertigation strategies. Sci. Hortic. 2018, 235, 181–188. [Google Scholar] [CrossRef]
  26. Gugerell, C.; Sato, T.; Hvitsand, C.; Toriyama, D.; Suzuki, N.; Penker, M. Know the farmer that feeds you: A cross-country analysis of spatial-relational proximities and the attractiveness of community supported agriculture. Agriculture 2021, 11, 1006. [Google Scholar] [CrossRef]
  27. Jiang, X.; Zhao, Y.; Tong, L.; Wang, R.; Zhao, S. Quantitative analysis of tomato yield and comprehensive fruit quality in response to deficit irrigation at different growth stages. Hortscience 2019, 54, 1409–1417. [Google Scholar] [CrossRef] [Green Version]
  28. Keabetswe, L.; Shao, G.; Cui, J.; Lu, J.; Stimela, T. A combination of biochar and regulated deficit irrigation improves tomato fruit quality: A comprehensive quality analysis. Foli Hortic. 2019, 31, 181–193. [Google Scholar] [CrossRef] [Green Version]
  29. An, X.; Liang, Y.; Gao, D.; Zhu, S.; Kong, F. Response of health-promoting bioactive compounds and related enzyme activities of table grape (Vitis vinifera L.) to deficit irrigation in greenhouse. J. Hortic. Sci. Bio. 2018, 93, 573–584. [Google Scholar] [CrossRef]
  30. Ma, T.; Zeng, W.; Li, Q.; Wu, J.; Huang, J. Effects of water, salt and nitrogen stress on sunflower (Helianthus annuus L.) at different growth stages. J. Soil. Sci. Plant. Nutr. 2016, 16, 1024–1037. [Google Scholar] [CrossRef]
  31. Wang, Z.; Zhang, H.; Wang, Y.; Zhou, C. Integrated evaluation of the water deficit irrigation scheme of indigowoad root under mulched drip irrigation in arid regions of northwest china based on the improved TOPSIS method. Water 2021, 13, 1532. [Google Scholar] [CrossRef]
  32. Shan, B.; Guo, P.; Guo, S.; Li, Z. A Price-Forecast-Based irrigation scheduling optimization model under the response of fruit quality and price to water. Sustainability 2019, 11, 2124. [Google Scholar] [CrossRef] [Green Version]
  33. Li, H.; Liu, H.; Gong, X.; Li, S.; Pang, J.; Chen, Z.; Sun, J. Optimizing irrigation and nitrogen management strategy to trade off yield, crop water productivity, nitrogen use efficiency and fruit quality of greenhouse grown tomato. Agric. Water Manag. 2021, 245, 106570. [Google Scholar] [CrossRef]
  34. Chen, G.; Li, M. The research on the comprehensive evaluation method integration based on method set. China J. Manag. Sci. 2004, 12, 101–105. [Google Scholar]
  35. Hu, T.; He, Q.; Hong, X.; Liu, J.; Li, H.; Feng, P.; Yang, S.H. Response of tomato yield-quality evaluated by fuzzy Borda combined model to irrigation and fertilization supply. Trans. CSAE 2019, 35, 142–151. [Google Scholar]
  36. Li, H. The Principle and Technology of Plant Physiology and Biochemistry Experiment; Higher education Press: Beijing, China, 2000. [Google Scholar]
  37. Patanè, C.; Tringali, S.; Sortino, O. Effects of deficit irrigation on biomass, yield, water productivity and fruit quality of processing tomato under semi-arid Mediterranean climate conditions. Sci. Hortic. 2011, 129, 590–596. [Google Scholar] [CrossRef]
  38. Li, J.; Yang, Q.; Shi, Z.; Zang, Z.; Liu, X. Effects of deficit irrigation and organic fertilizer on yield, saponin and disease incidence in Panax notoginseng under shaded conditions. Agric. Water Manag. 2021, 256, 107056. [Google Scholar] [CrossRef]
  39. Zhang, Z.; Yang, Z.; Li, J.; Zhang, M.; Li, R.; He, D. Water and fertilizer irrigation decision of muskmelon based on grey correlation and TOPSIS coupling model. Transactions. China Soc. Agric. Mach. 2021, 52, 302–311. [Google Scholar]
  40. Rasoola, G.; Guo, X.; Wang, Z.; Alib, M.U.; Chen, S.; Zhang, S.; Wu, Q.; Ullahd, M.S. Coupling fertigation and buried straw layer improves fertilizer use efficiency, fruit yield, and quality of greenhouse tomato. Agric. Water Manag. 2020, 239, 106239. [Google Scholar] [CrossRef]
  41. Wang, H.; Cheng, M.; Zhang, S.; Fan, J.; Feng, H.; Zhang, F.; Wang, X.; Sun, L.; Xiang, Y. Optimization of irrigation amount and fertilization rate of drip-fertigated potato based on Analytic Hierarchy Process and Fuzzy Comprehensive Evaluation methods. Agric. Water Manag. 2021, 256, 107130. [Google Scholar] [CrossRef]
  42. Guo, X.; Li, S.; Wang, D.; Huang, Z.; Sarwar, N.; Mubeen, K.; Shakeel, M.; Hussain, M. Effects of water and fertilizer coupling on the physiological characteristics and growth of rabbiteye blueberry. PLoS ONE 2021, 16, e0254013. [Google Scholar] [CrossRef]
  43. Zeng, X. On the pre-test and post-test of combination evaluation method. Stat. Res. 1997, 6, 56–58. [Google Scholar]
  44. Wen, Y.; Wang, Z.; Guo, L.; Li, W. Establishing a physiology-yield-quality evaluation model for grape optimizing drip irrigation on grape fields in extremely arid regions. Appl. Eng. Agric. 2021, 37, 267–278. [Google Scholar] [CrossRef]
  45. Krivokapić, M. Study on the evaluation of (heavy) metals in water and sediment of Skadar Lake (Montenegro), with BCF assessment and translocation ability (TA) by Trapa natans and a review of SDGs. Water 2021, 13, 876. [Google Scholar] [CrossRef]
  46. Yu, S.; Tang, Z. Plant Physiological and Molecular Biology, 2nd ed.; Science Press: Beijing, China, 1998. [Google Scholar]
  47. Xu, D. Some note worthy problems in measurement and investigation of photosynthesis. J. Plant Physiol. 2006, 42, 1163–1167. [Google Scholar]
  48. Yu, W.; Ji, R.; Feng, R.; Zhao, X.; Zhang, Y. Response of water stress on photosynthetic characteristics and water use efficiency of maize leaves in different growth stage. Acta Ecol. Sin. 2015, 35, 2902–2909. [Google Scholar]
  49. Galme, J.; Medrano, H.; Flexas, J. Photosynthetic limitations in response to water stress and recovery in Mediterranean plants with different growth forms. New Phytol. 2007, 175, 81–93. [Google Scholar] [CrossRef]
  50. Zhang, J.; Davies, W. Sequential response of w hole plant water relations tow ards prolonged soil drying and the mediation by xylem sap ABA concentration in the regulation of stomata behavior of sunflower plants. New Phytol. 1989, 113, 167–174. [Google Scholar] [CrossRef]
  51. Davies, W.; Zhang, J. Root signal and the regulation of growth and development of plants in drying soil. Annu. Rev. Biol. Plant Physi. Plant Mol. 1991, 42, 55–76. [Google Scholar] [CrossRef]
  52. Liu, J.; Hu, T.; Feng, P.; Wang, L.; Yang, S. Tomato yield and water use efficiency change with various soil moisture and potassium levels during different growth stages. PLoS ONE 2019, 14, e0213643. [Google Scholar] [CrossRef]
  53. Liu, J.; Hu, T.; Feng, P.; Yao, D.; Gao, F.; Hong, X. Effect of potassium fertilization during fruit development on tomato quality, potassium uptake, water and potassium use efficiency under deficit irrigation regime. Agric. Water Manag. 2021, 250, 106831. [Google Scholar] [CrossRef]
  54. Ehret, D.L.; Ho, L.C. The effects of salinity on dry matter partitioning and fruit growth in tomatoes grown in nutrient film culture. J. Hortic. Sci. 1986, 61, 36–367. [Google Scholar] [CrossRef]
  55. Rasool, G.; Guo, X.; Wang, Z.; Chen, S.; Ullah, I. The interactive responses of fertigation levels under buried straw layer on growth, physiological traits and fruit yield in tomato plant. J. Plant Interact. 2019, 14, 552–563. [Google Scholar] [CrossRef]
  56. Yang, H.; Shukla, M.K.; Mao, X.; Kang, S.; Du, T. Interactive regimes of reduced irrigation and salt stress depressed tomato water use efficiency at leaf and plant scales by affecting leaf physiology and stem sap flow. Front. Plant Sci. 2019, 10, 160. [Google Scholar] [CrossRef]
  57. Guo, L.; Yu, H.; Kharbach, M.; Zhang, W.; Wang, J.; Niu, W. Biochar improves soil-tomato plant, tomato production, and economic benefits under reduced nitrogen application in northwestern China. Plants 2021, 10, 759. [Google Scholar] [CrossRef] [PubMed]
  58. Wang, J.; Li, Y.; Niu, W. Deficit alternate drip irrigation increased Root-Soil-Plant interaction, tomato yield, and quality. Int. J. Environ. Res. Public Health 2020, 17, 781. [Google Scholar] [CrossRef] [Green Version]
  59. Shabbir, A.; Mao, H.; Ullah, I.; Buttar, N.A.; Ajmal, M.; Lakhiar, I.A. Effects of drip irrigation emitter density with various irrigation levels on physiological parameters, root, yield and quality of cherry tomato. Agronomy 2020, 10, 1685. [Google Scholar] [CrossRef]
  60. Güneri, Ö.; Göktaş, A.; Kayalı, U. Path analysis and determining the distribution of indirect effects via simulation. J. Appl. Stat. 2017, 44, 1181–1210. [Google Scholar] [CrossRef]
  61. Cai, J.; Liu, Y.; Xu, D.; Shi, B. Sensitivity analysis on water deficit indicator of winter wheat based on path analysis theory. J. Hydra. Eng. 2008, 39, 83–90. [Google Scholar]
  62. Lu, Y.; Yan, Z.; Li, L.; Gao, C.; Shao, L. Selecting traits to improve the yield and water use efficiency of winter wheat under limited water supply. Agric. Water Manag. 2020, 242, 106410. [Google Scholar] [CrossRef]
  63. Liu, Y.; Li, Y. Objective combination evaluation model based on dimension reduction. Opera. Resear. Manag. Sci. 2009, 18, 38–43. [Google Scholar]
  64. Xing, M.; Luo, F. Comparative study on the optimization path of industrial value chain in China,s Resource-Based cities. Sustainability 2018, 10, 1338. [Google Scholar] [CrossRef] [Green Version]
Figure 1. Photosynthetic characteristics of tomato leaves at different growth stages in 2020 (ad) and 2021 (eh) under RDI. The bars indicate standard error (±SE) of the mean ((n = 3). The same letters in figure indicate nonsignificant differences between the treatments, whereas different letters indicate a significant difference (p ≤ 0.05).
Agriculture 12 00324 g001
Figure 2. Effects of RDI on the aboveground biomass accumulation and allocation of tomato at Stages I–II in 2020 (a,b) and 2021 (c,d) under RDI. The bars indicate the standard error (±SE) of the mean for the total aboveground biomass of tomato (n = 3). The same letters in figure indicate nonsignificant differences between the treatments, whereas different letters indicate a significant difference (p ≤ 0.05).
Agriculture 12 00324 g002
Figure 3. Correlation between Pn (a), Ci (b), Gs (c), Tr (d) and yield at different growth stages. The black line shows the correlation between yield and photosynthesis indexes in Stage I. The red line shows the correlation between yield and photosynthesis indexes in Stage II.
Agriculture 12 00324 g003
Figure 4. Correlation between the standardized yield (a), quality parameters (b), and irrigation quota. The standardized yield is the ratio of the yield of each treatment to the maximum yield. Standardized comprehensive quality is the average value of the ratio of each quality parameter to the highest quality value.
Agriculture 12 00324 g004
Table 1. Basic properties of soil at the experimental site.
Soil Depth
(cm)
Bulk Density
(g/cm3)
Field Capacity
(cm3/cm3)
pHOrganic Matter
(g/kg)
Total N
(g/kg)
Total P
(g/kg)
Total K
(g/kg)
0–201.190.408.3435.301.830.6744.37
20–401.590.388.2828.611.430.7743.61
40–601.580.378.5116.671.070.5642.95
Table 2. Irrigation amount and times in the two consecutive years.
Year TreatmentIrrigation Amount and Time per Growth Stage
Stage IStage IIStage IStage IIIrrigation Quota (mm)
2020T170–90% θf60–80% θf27.6 (7)27.6 (3)296.0 (11)
T270–90% θf50–70% θf27.6 (7)27.6 (2)268.4 (10)
T370–90% θf40–60% θf27.6 (7)27.6 (1)240.8 (9)
T460–80% θf60–80% θf27.6 (5)27.6 (4)268.4 (10)
T560–80% θf50–70% θf27.6 (5)27.6 (3)240.8 (9)
T660–80% θf40–60% θf27.6 (5)27.6 (2)213.2 (8)
T750–70% θf60–80% θf27.6 (3)27.6 (4)213.2 (8)
T850–70% θf50–70% θf27.6 (3)27.6 (3)185.6 (7)
T950–70% θf40–60% θf27.6 (3)27.6 (2)158.0 (6)
2021T170–90% θf60–80% θf27.6 (8)27.6 (3)328.6 (12)
T270–90% θf50–70% θf27.6 (8)27.6 (2)301.0 (11)
T370–90% θf40–60% θf27.6 (8)27.6 (1)273.4 (10)
T460–80% θf60–80% θf27.6 (6)27.6 (3)273.4 (10)
T560–80% θf50–70% θf27.6 (6)27.6 (2)245.8 (9)
T660–80% θf40–60% θf27.6 (6)27.6 (1)218.2 (8)
T750–70% θf60–80% θf27.6 (4)27.6 (4)245.8 (9)
T850–70% θf50–70% θf27.6 (4) 27.6 (3)218.2 (8)
T950–70% θf40–60% θf27.6 (4)27.6 (2)190.6 (7)
Table 3. Effects of different irrigation treatments on tomato yield and water use.
YearTreatmentYield (kg/hm2)WUEY (kg/m3)WUEL (μmol/mmol)
2020T183.3 ± 4.4 a28.2 ± 1.5 bc3.3 ± 0.5 a
T282.2 ± 3.9 a30.6 ± 1.5 abc3.5 ± 0.5 a
T381.7 ± 4.2 a33.9 ± 1.7 a3.6 ± 0.2 a
T469.4 ± 2.4 b25.9 ± 0.9 c2.9 ± 0.2 ab
T568.9 ± 2.4 b28.6 ± 1.0 bc3.2 ± 0.5 ab
T664.4 ± 2.9 bc30.22 ± 1.4 abc2.7 ± 0.2 abc
T758.3 ± 2.6 cd27.4 ± 1.2 bc2.4 ± 0.6 abc
T851.7 ± 2.6 d27.8 ± 1.4 bc2.0 ± 0.4 bc
T948.9 ± 4.8 d30.7 ± 3.0 ab1.8 ± 0.4 c
2021T193.5 ± 0.8 a28.5 ± 0.3 c2.6 ± 0.2 ab
T291.2 ± 0.4 a30.1 ± 0.2 b3.1 ± 0.2 ab
T390.3 ± 0.5 a32.8 ± 0.2 a3.2 ± 0.1 a
T471.9 ± 0.9 b26.1 ± 0.3 d3.1 ± 0.1 a
T569.9 ± 1.3 b28.4 ± 0.5 c2.9 ± 0.4 ab
T669.1 ± 0.6 b31.7 ± 0.3 a2.7 ± 0.3 ab
T757.0 ± 1.6 c23.2 ± 0.6 e3.0 ± 0.2 ab
T855.5 ± 1.7 c25.4 ± 0.8 d2.5 ± 0.1 bc
T956.0 ± 1.3 c29.4 ± 0.7 bc2.0 ± 0.1 c
Note: Values are given as the means ± standard error of the mean. The same letters following the values within the same column indicate nonsignificant differences between the treatments, whereas different letters indicate a significant difference (p ≤ 0.05).
Table 4. Fruit quality of tomato under the RDI.
YearTreatmentFSIVC (mg/100g)Fn (kg/cm2)SS (%)OA (/%)SAR
2020T10.82 ± 0.01 e14.41 ± 0.52 c1.77 ± 0.21 d4.61 ± 0.37 d0.66 ± 0.01 c6.98 ± 0.51 b
T20.86 ± 0.02 cde18.29 ± 0.70 b2.56 ± 0.15 c5.65 ± 0.07 c0.78 ± 0.06 abc7.33 ± 0.65 b
T30.94 ± 0.01 a22.17 ± 0.21 a4.22 ± 0.13 a7.31 ± 0.05 a0.83 ± 0.02 ab8.86 ± 0.25 a
T40.84 ± 0.02 de15.03 ± 0.98 c2.35 ± 0.11 c4.83 ± 0.07 d0.71 ± 0.07 bc6.90 ± 0.60 b
T50.87 ± 0.01 bcd18.98 ± 0.19 b2.68 ± 0.12 c5.92 ± 0.07 bc0.78 ± 0.06 abc7.65 ± 0.51 ab
T60.91 ± 0.02 ab21.96 ± 0.48 a4.16 ± 0.08 a7.42 ± 0.07 a0.84 ± 0.01 ab8.86 ± 0.08 a
T70.86 ± 0.01 cde17.78 ± 0.62 b2.56 ± 0.04 c5.10 ± 0.12 d0.75 ± 0.02 abc6.85 ± 0.37 b
T80.88 ± 0.01 bc19.30 ± 0.62 b3.43 ± 0.17 b6.40 ± 0.17 b0.80 ± 0.07 ab8.06 ± 0.53 ab
T90.91 ± 0.01 ab23.04 ± 0.24 a4.13 ± 0.25 a7.53 ± 0.25 a0.85 ± 0.01 a8.84 ± 0.20 a
2021T10.81 ± 0.01 c8.18 ± 0.11 e2.66 ± 0.09 c2.37 ± 0.07 d0.46 ± 0.03 c5.20 ± 0.22 d
T20.83 ± 0.01 c12.59 ± 0.12 c2.95 ± 0.16 bc4.33 ± 0.36 b0.62 ± 0.01 b6.98 ± 0.33 abc
T30.90 ± 0.01 b21.53 ± 0.31 b3.53 ± 0.01 a6.53 ± 0.04 a0.82 ± 0.03 a7.99 ± 0.34 a
T40.81 ± 0.01 c9.06 ± 0.79 de2.68 ± 0.15 c2.75 ± 0.06 cd0.49 ± 0.08 c6.03 ± 0.23 cd
T50.84 ± 0.01 c12.37 ± 0.21 c3.21 ± 0.25 ab4.43 ± 0.11 b0.69 ± 0.01 b6.38 ± 0.26 bcd
T60.91 ± 0.01 ab21.90 ± 0.57 ab3.40 ± 0.24 a6.50 ± 0.22 a0.83 ± 0.02 a7.80 ± 0.21 ab
T70.82 ± 0.02 c9.63 ± 0.29 d2.85 ± 0.09 bc3.15 ± 0.07 c0.49 ± 0.03 c6.41 ± 0.30 bcd
T80.84 ± 0.01 c13.03 ± 0.13 c3.23 ± 0.24 ab4.52 ± 0.04 b0.71 ± 0.04 b6.43 ± 0.45 bcd
T90.94 ± 0.02 a22.88 ± 0.63 a3.51 ± 0.31 a6.83 ± 0.08 a0.86 ± 0.01 a7.93 ± 0.29 a
Note: Values are given as the means ± standard error of the mean. The same letters following the values within the same column indicate nonsignificant differences between the treatments, whereas different letters show significant differences (p ≤ 0.05).
Table 5. Evaluation results of single evaluation methods.
YearTreatmentPCAGRAMFATOPSIS-AHPStandard
Deviation
of Ranking
EvREvREvREvR
2020T1−2.5690.5072.1980.3461.29
T2−0.3460.6044.8340.6021.63
T32.8410.9418.6710.9710.00
T4−2.3080.4592.0490.1590.50
T5−0.3050.5554.4950.3850.00
T61.9430.7636.9520.5740.82
T7−1.4870.4682.5370.2180.58
T80.1540.5564.2160.2871.26
T92.0620.7626.2930.5830.58
2021T1−2.1490.4882.1180.5161.26
T2−0.2140.6044.8240.7030.50
T32.5410.9118.3210.9710.00
T4−2.0970.4872.2870.3470.00
T5−0.2750.5454.2750.5450.00
T62.2730.7737.1820.8220.58
T7−2.1080.4691.9890.1890.50
T8−0.5060.5063.4760.2781.00
T92.5020.8026.6130.6040.96
Note: Ev represents evaluation value, R represents ranking.
Table 6. Kendall correlation coefficients for order values of the single evaluation methods.
YearMethodPCAGRAMFATOPSIS-AHPMean Value
2020PCA 0.720.720.560.67
GRA0.72 0.890.830.81
MFA0.720.89 0.720.78
TOPSIS-AHP0.560.830.72 0.70
2021PCA 0.940.890.670.83
GRA0.94 0.940.720.87
MFA0.890.94 0.780.87
TOPSIS-AHP0.670.720.78 0.72
Table 7. Comprehensive evaluation results of the fuzzy Borda combination evaluation model.
T1T2T3T4T5T6T7T8T9
2020Evaluation value0.668.1235.400.033.7314.910.372.9616.80
Ranking741953862
2021Evaluation value0.688.0033.780.473.8019.030.021.3217.67
Ranking741852963
Publisher’s Note: MDPI stays neutral with regard to jurisdictional claims in published maps and institutional affiliations.

