Article

Efficiency of Phosphorus Fertilizers Derived from Recycled Biogas Digestate as Applied to Maize and Ryegrass in Soils with Different pH

1
Department of Fertilization and Soil Matter Dynamics (340i), Institute of Crop Science, University of Hohenheim, Fruwirthstrasse 20, 70593 Stuttgart, Germany
2
Department of Biobased Resources in the Bioeconomy (340b), Institute of Crop Science, University of Hohenheim, Fruwirthstrasse 23, 70599 Stuttgart, Germany
*
Author to whom correspondence should be addressed.
Agriculture 2022, 12(3), 325; https://doi.org/10.3390/agriculture12030325
Submission received: 6 January 2022 / Revised: 12 February 2022 / Accepted: 21 February 2022 / Published: 24 February 2022
(This article belongs to the Section Agricultural Soils)

Abstract

:
Three phosphorus (P) fertilizer fractions recycled from biogas digestates were tested alone and in combination for their efficiency in two agricultural surface soils with different pH: a silty sandy loam and a clay loam. The experiments were carried out in pots under greenhouse conditions, using mineral triple superphosphate (TSP) as a reference. Maize was cultivated for 50 days, followed by ryegrass cultivation for an additional 84 days in the same soil, without additional fertilization. The variables investigated were above-ground plant biomass production, plant phosphorus concentration and content, and plant available phosphorus concentration in soil. The dry matter (DM) yield of maize was increased by the organic P fertilizers equal to or more than TSP in both soils. In the neutral soil, biomass was almost doubled compared to TSP when using one of the fractions (Struvite containing P-Salt) alone or in combination with dried solid fractions. P concentration in maize cultivated in the neutral soil was not significantly different between the P fertilization treatments. However, associated with biomass increase, the total P content in maize plants was equal to or higher than that with TSP. In the acidic soil, P concentration and total P content in maize plants, as well as the calcium-acetate-lactate extractable P (CAL-P) concentration in soil, were equal to or even higher than TSP. Ryegrass DM yield was unaffected by all P fertilizers, independent of the soil, although P concentration and total P content increased in the acidic soil with all fertilizers. Our results show that recycled P fertilizers from biogas digestates are effective P fertilizer alternatives to mineral TSP for maize cultivation under acidic and neutral soil conditions. The lack of growth effects in ryegrass indicates that recycled P fertilizers do not require changes in weed control. On the other hand, P extraction by ryegrass in overfertilized acidic soils as an option for soil remediation also works in soils fertilized with biogas digestate fractions.

1. Introduction

Phosphorus (P) is an essential nutritional element for plant growth and development, and sufficient P supply is a key factor for plant quality and yield in agricultural production [1]. Only a small fraction of the soil P is available to plant roots in the soil pore water fraction, because P is quickly adsorbed and immobilized onto soil particle surfaces [2,3,4]. The intensive use of organic and inorganic fertilizers in agriculture in recent decades has resulted in high P accumulation in soils [5] that is unavailable to plants [6]. In Europe, agricultural soils are estimated to contain 100–3000 mg P/kg, corresponding to 130–3900 kg/ha in the top 10 cm of the soil [3]. Worldwide, approximately 88% of agricultural P fertilizer comes from the limited resource phosphate rock [7], available only at a few locations worldwide in quantities that may secure supply for the next few hundred years (calculated from [8]). Many countries in the world, including the European member states, depend on imports from these regions and are thus susceptible to world market price fluctuations and economic and political crises [9,10]. Accordingly, the European Union has listed mineral phosphate rock (2014) and phosphorus (2017) as critical raw materials [11,12]. As a result, the activities to make more efficient use of renewable secondary phosphate resources [13,14], with similar characteristics as compared to standard mineral fertilizers, have increased in the last years.
A variety of P sources and recycling technologies have been investigated, and struvite (MgNH4PO4 * 6H2O), recycled from, e.g., sewage sludge, was identified as a slow-release fertilizer that offers a sustainable alternative to conventional phosphate rock-based fertilizers [15]. With the increase of biogas production in European countries from 6227 plants in 2009 to more than 17,000 plants 2017 [16], biogas digestates have become increasingly available as a P source, particularly in areas with high livestock densities. Compared to this, the P fertilizer consumption increased to 248,000 tons [17] in 2019/2020. At least parts of the German P consumption could be covered by digestates. They contain high amounts of P [18] and thus have a potential as valuable fertilizers or soil amendments [19]. Enrichment of P in fertilizers produced from biogas digestates has been identified as a key technology to produce storable and transportable P fertilizers [20]. One of the major challenges for P recycling from organic material is the formulation of products with high plant availability in the soil root zone. Plant uptake can considerably differ [21] across recovered products, depending on the proportion of organic P in the enriched fractions. Plants may invest substantial photosynthetic energy to access soil P through active P mobilization from less soluble fractions [22]. Promising concepts to increase P uptake and use efficiency are thus the use of highly P-efficient crop genotypes with a potential for high soil P mobilization in combination with P placement in the root zone, P-mobilizing bioeffectors and potentially P-mobilizing legumes in crop rotation [3].
Within the research project GOBi (General Optimization of Biogas Processes, grant agreement No. 03EK3525A) funded by the German Federal Ministry of Education and Research (BMBF), a technology for the recycling of P from biogas digestates and potentially also from liquid manure (slurry) was developed. The process resulted in three different P-enriched, storable and transportable fertilizer fractions, named P-Salt, warm-air dried solid (SF(W)) and steam-dried solid (SF(S)). Struvite is a substantial part of the P-Salt. First results regarding the efficiency of these fractions in maize and ornamentals were described by [23,24].
An important factor influencing P availability to plants is the soil pH. Ref. [25] addresses several reports in their publication, which found a correlation between low pH and increased solubility of P in soil, and a decrease in P sorption and increase of P uptake into plants [26,27,28,29,30]. Some recycled P fertilizers from different sources have been tested with various soils, showing significant differences in P availability, depending on the recycling process, the soil type and the soil pH [23,24,31,32,33]. Therefore, the objective of this study was to assess the influence on the fertilizer P efficiency of the three recycled P fractions and its combination treatments at different pH levels.
In the present study, the efficiency of P fertilizers, recycled from digestates of a biogas plant with the technology of the GOBi project, was tested using two agricultural soils with an acidic and a neutral pH. The experiments were conducted in a greenhouse pot setup, with maize as the primary crop and ryegrass as the subsequent culture, using TSP as reference fertilizer. In addition to the direct comparison of the fertilizer fractions, the combined application of dried solid fractions and P-Salt has previously shown synergistic effects on P efficiency [23]. Therefore, combinations were tested under identical experimental conditions to assess differences in the P fertilizer efficiency from recovered and commercial fertilizers in soils that differ in pH, texture and nutrient content. Maize was used in this study because it is one of the most widespread and versatile agricultural crops worldwide, used for different elements in human nutrition, animal feed and bio-energy production [3]. The Zea mays L. var. ‘Carolinio’ used here is a specific variety for use as a biogas substrate, with a high dry matter yield potential. Perennial ryegrass is, on the one hand, the most used grass species for sowing grasslands in temperate areas, and on the other hand, it is also a widespread weed in European agricultural soils. A second objective was the evaluation of the influence of recycled fertilizers on the growth and P uptake potential of ryegrass compared to TSP.
Based on the experimental results with the same recycled material as described above, the following hypotheses were established and tested in this study:
  • Compared to a mineral P fertilizer (TSP), fractions recycled from biogas digestates can be effective P fertilizers over a range of soils differing in pH conditions (5.5 and 7.4), with advantages in acidic soils.
  • Combined treatments (P-Salt + SF W/S) result in a higher P bioavailability, with synergistic effects, compared to the single application in both soils.
  • Ryegrass as a widespread weed does not benefit from recycled P fertilizers with regard to biomass production, and thus, its use does not require changes in weed control.
  • Ryegrass cultivation as an option for soil remediation after use of excess mineral P can also be used after application of recycled P fertilizers.

2. Materials and Methods

A greenhouse experiment with maize was conducted in two different soils using three recycled P fertilizers produced from biogas plant digestates. Fertilizers were tested alone or in paired combinations, in comparison to a mineral fertilizer (Triple superphosphate, TSP) and an unfertilized control. After maize harvest, ryegrass was sown and cultivated in the same soil for another 84 days, without additional P fertilization. Variables evaluated were above-ground plant biomass, biomass P concentration and total P content in plants, and soil CAL-P.

2.1. Recycled P Fertilizers

Three P fertilizers were derived from the liquid and the solid part of the biogas digestate from a pilot plant (Fraunhofer IGB, Kupferzell, Germany) operating with a mixture of cow manure and maize silage. The process overview is described by [34]. The first fraction was a P-enriched precipitate (“P-Salt”) recovered by alkaline precipitation from the liquid fraction of the digestate after several process steps. The final dried and milled product was a mixture of struvite, calcium phosphate and magnesium phosphates. Two types of solids were recovered from the solid fraction of the digestate, either dried at 40 °C as air-dried separated solids, “SF(W)”, or dried with a steam-dryer at 120 °C as steam-dried separated solids, “SF(S)”. The measured total P content (Pt) of P-Salt was 11.3% DM, SF(W) contained 2.1 Pt in % DM and SF(S) 2.3 Pt in % DM. Details about the separation and recycling process, the measured P contents and other nutrient concentrations of the three fertilizer fractions are given in Table 1 of [23].
All P fertilizers and their combinations were applied at the standard supply rate for maize of 150 mg total P per kg soil (lab standard dose for P supply) once at the beginning of the experiment. P concentrations measured in the used fertilizer fractions were taken as reference to calculate the corresponding dose weights of single doses or combinations. Two combinations were tested, where P-Salt was combined with SF(W) or SF(S) in the ratio 1:1. For combined fertilizers, the absolute amounts of each fraction were calculated and used accordingly to match the desired total dose of 150 mg total P per kg soil. A ratio of 1:1 represented 75 mg total P per kg soil from the P-Salt and 75 mg total P per kg soil from the separated solid fraction to add up to a total amount of 150 mg total P per kg soil. Application was done by homogeneously mixing both components into the soil sequentially (first P-Salt, followed by SF(S/W)), which corresponded to the “Dry” application in [23].

2.2. Soil Characteristics

The experiments were carried out using two agricultural surface soils, selected for their low CAL-P and different pH (CaCl2). The CAL-P, defined as P extractable in calcium-acetate-lactate solution, was determined according to [35]. The silty sandy loam with pH 5.5 was collected from a low-fertility grassland in Speyer, Germany. The clay loam with pH 7.4 was collected from an agricultural field in Kleinansbach, Germany.

2.3. Soil Sampling and Analysis of P, K, Mg and pH

Soil samples for soil characterization were taken prior to the initial P fertilization and after ryegrass harvest (84 days after maize harvest, 134 days after P fertilization). All samples were stored at −20 °C until analysis. Plant available P in soil (dried at 105 °C and sieved to 2 mm) was determined using the CAL extraction method [35], followed by flame photometric quantification. The same method was used for K and Mg determination. Soil pH was measured in a suspension with 0.01 M CaCl2 [36].

2.4. Experimental Details

The first part of the experimental setup used in this study was identical to the pot experiment with maize described in detail by [23]. The three recycled P fertilizers and the combinations were applied in comparison to the reference fertilizer TSP and an unfertilized control. An overview of the experimental setup is given in Table 1 and Figure 1.
Soil (3 kg dry weight per pot) was mixed homogeneously with the dry P fertilizer fractions and filled into round plastic pots (4 L volume, 20 cm diameter). Only the conventional fertilizer TSP was pre-mixed with de-ionized (DI) water to ensure exact dosage of the small amounts. Additional mineral fertilizer (Ammonium nitrate (NH4NO3), Potassiumsulfate (K2SO4), Magnesiumsulfate (MgSO4), Fe-Sequestren (Ferric EDTA)) was given once to each pot, including the untreated controls. After fertilization, the soil was mixed again, watered to 70% of its maximum water holding capacity (WHC) and incubated for two days in a greenhouse at 24 °C before sowing the maize seeds (energy crop Zea mays L. var. Carolinio (KWS SAAT SE & Co. KGaA, Einbeck, Germany)). Three seeds per pot were sown into each pot at 4 cm depth. After germination, the number of seedlings per pot was reduced to one. A second additional mineral fertilization, only with aqueous Ammonium nitrate, was applied three weeks after germination.
Maize plants were harvested 50 days after seeding, and the remaining pots were then cultivated with perennial ryegrass (Lolium perenne L., cv. Arvicola, Feldsaaten Freudenberger GmbH & Co., Germany) for 12 weeks. For this purpose, 5 g of ryegrass seed was incorporated into the top 1–2 mm of the soil and cultivated without any additional fertilization. Identical to the preceding maize cultivation, each pot was irrigated with deionized (DI) water and weight-controlled every three days to maintain a soil humidity of 70% WHC.

2.5. Maize and Ryegrass Harvest and P Analysis

Maize shoots were harvested 50 days after sowing. Ryegrass shoots were harvested 56 days and 84 days after sowing. Plant material was collected by cutting the shoots 0.5 cm above the soil surface, followed by determination of dry weight (after drying at 60 °C for 48 h, DM—dry matter). Dried plant material was ground using a laboratory disk mill (TS 250, Siebtechnik GmbH, Mülheim and der Ruhr, Germany) and 0.5 g of the plant material was suspended in concentrated HNO3 and H2O2, followed by microwave extraction at 210 °C for 62 min and filtration. Analysis was carried out by ICP-OES (Agilent 5100, Santa Clara, CA, USA) according to DIN EN ISO 11885 [37]. Shoot P was calculated as concentration (mg/g DM) and as absolute amount per cut (maize: single plant, ryegrass: total cut).

2.6. Evaluation of Synergistic Effects

Possible synergistic effects of P-Salt + SF (SF(W) or SF(S)) were evaluated by calculation of theoretical maize biomass production and maize/ryegrass P content from data with P-Salt and SF applied alone, using the following equation (see also Bach et al.) [23]:
Calculated maize DM yield for ratio 1:1:
calculated   DM   yield = SF   ( W   or   S )   DM   yield + P Salt   DM   yield 2
Calculated maize/ryegrass P content for ratio 1:1:
calculated   P   content = ( SF   ( W   or   S )   P   content + P Salt   P   content ) 2
Measured values higher than the calculated values after combined application were interpreted as synergistic effect, whereas measured values equal or lower than the calculated ones indicated non-synergistic effects.

2.7. Statistical Analysis

Data analysis was performed using the statistical computing software R version 4.0.4. The effect of the block design, treatments and soil types on different variables (P concentration, DM yield and P content in the plants and CAL-P in soils) was assessed using a two-factorial linear model (n = 4). Data were log-transformed in order to meet the model assumption of normality of residuals and variance homogeneity, when necessary. Least-square means and letter display for pairwise comparison were performed using the R packages emmeans [38] and multcomp [39,40]. Significance was determined at p ≤ 0.05 using a Tukey test, performed only on finding significant differences in the F-test. Significantly different mean values on different variables were indicated by different letters, and significant differences between the soils were indicated by an asterisk (*).

3. Results

3.1. Effect of P Fertilizers on Maize Biomass Yield and Plant P Concentration

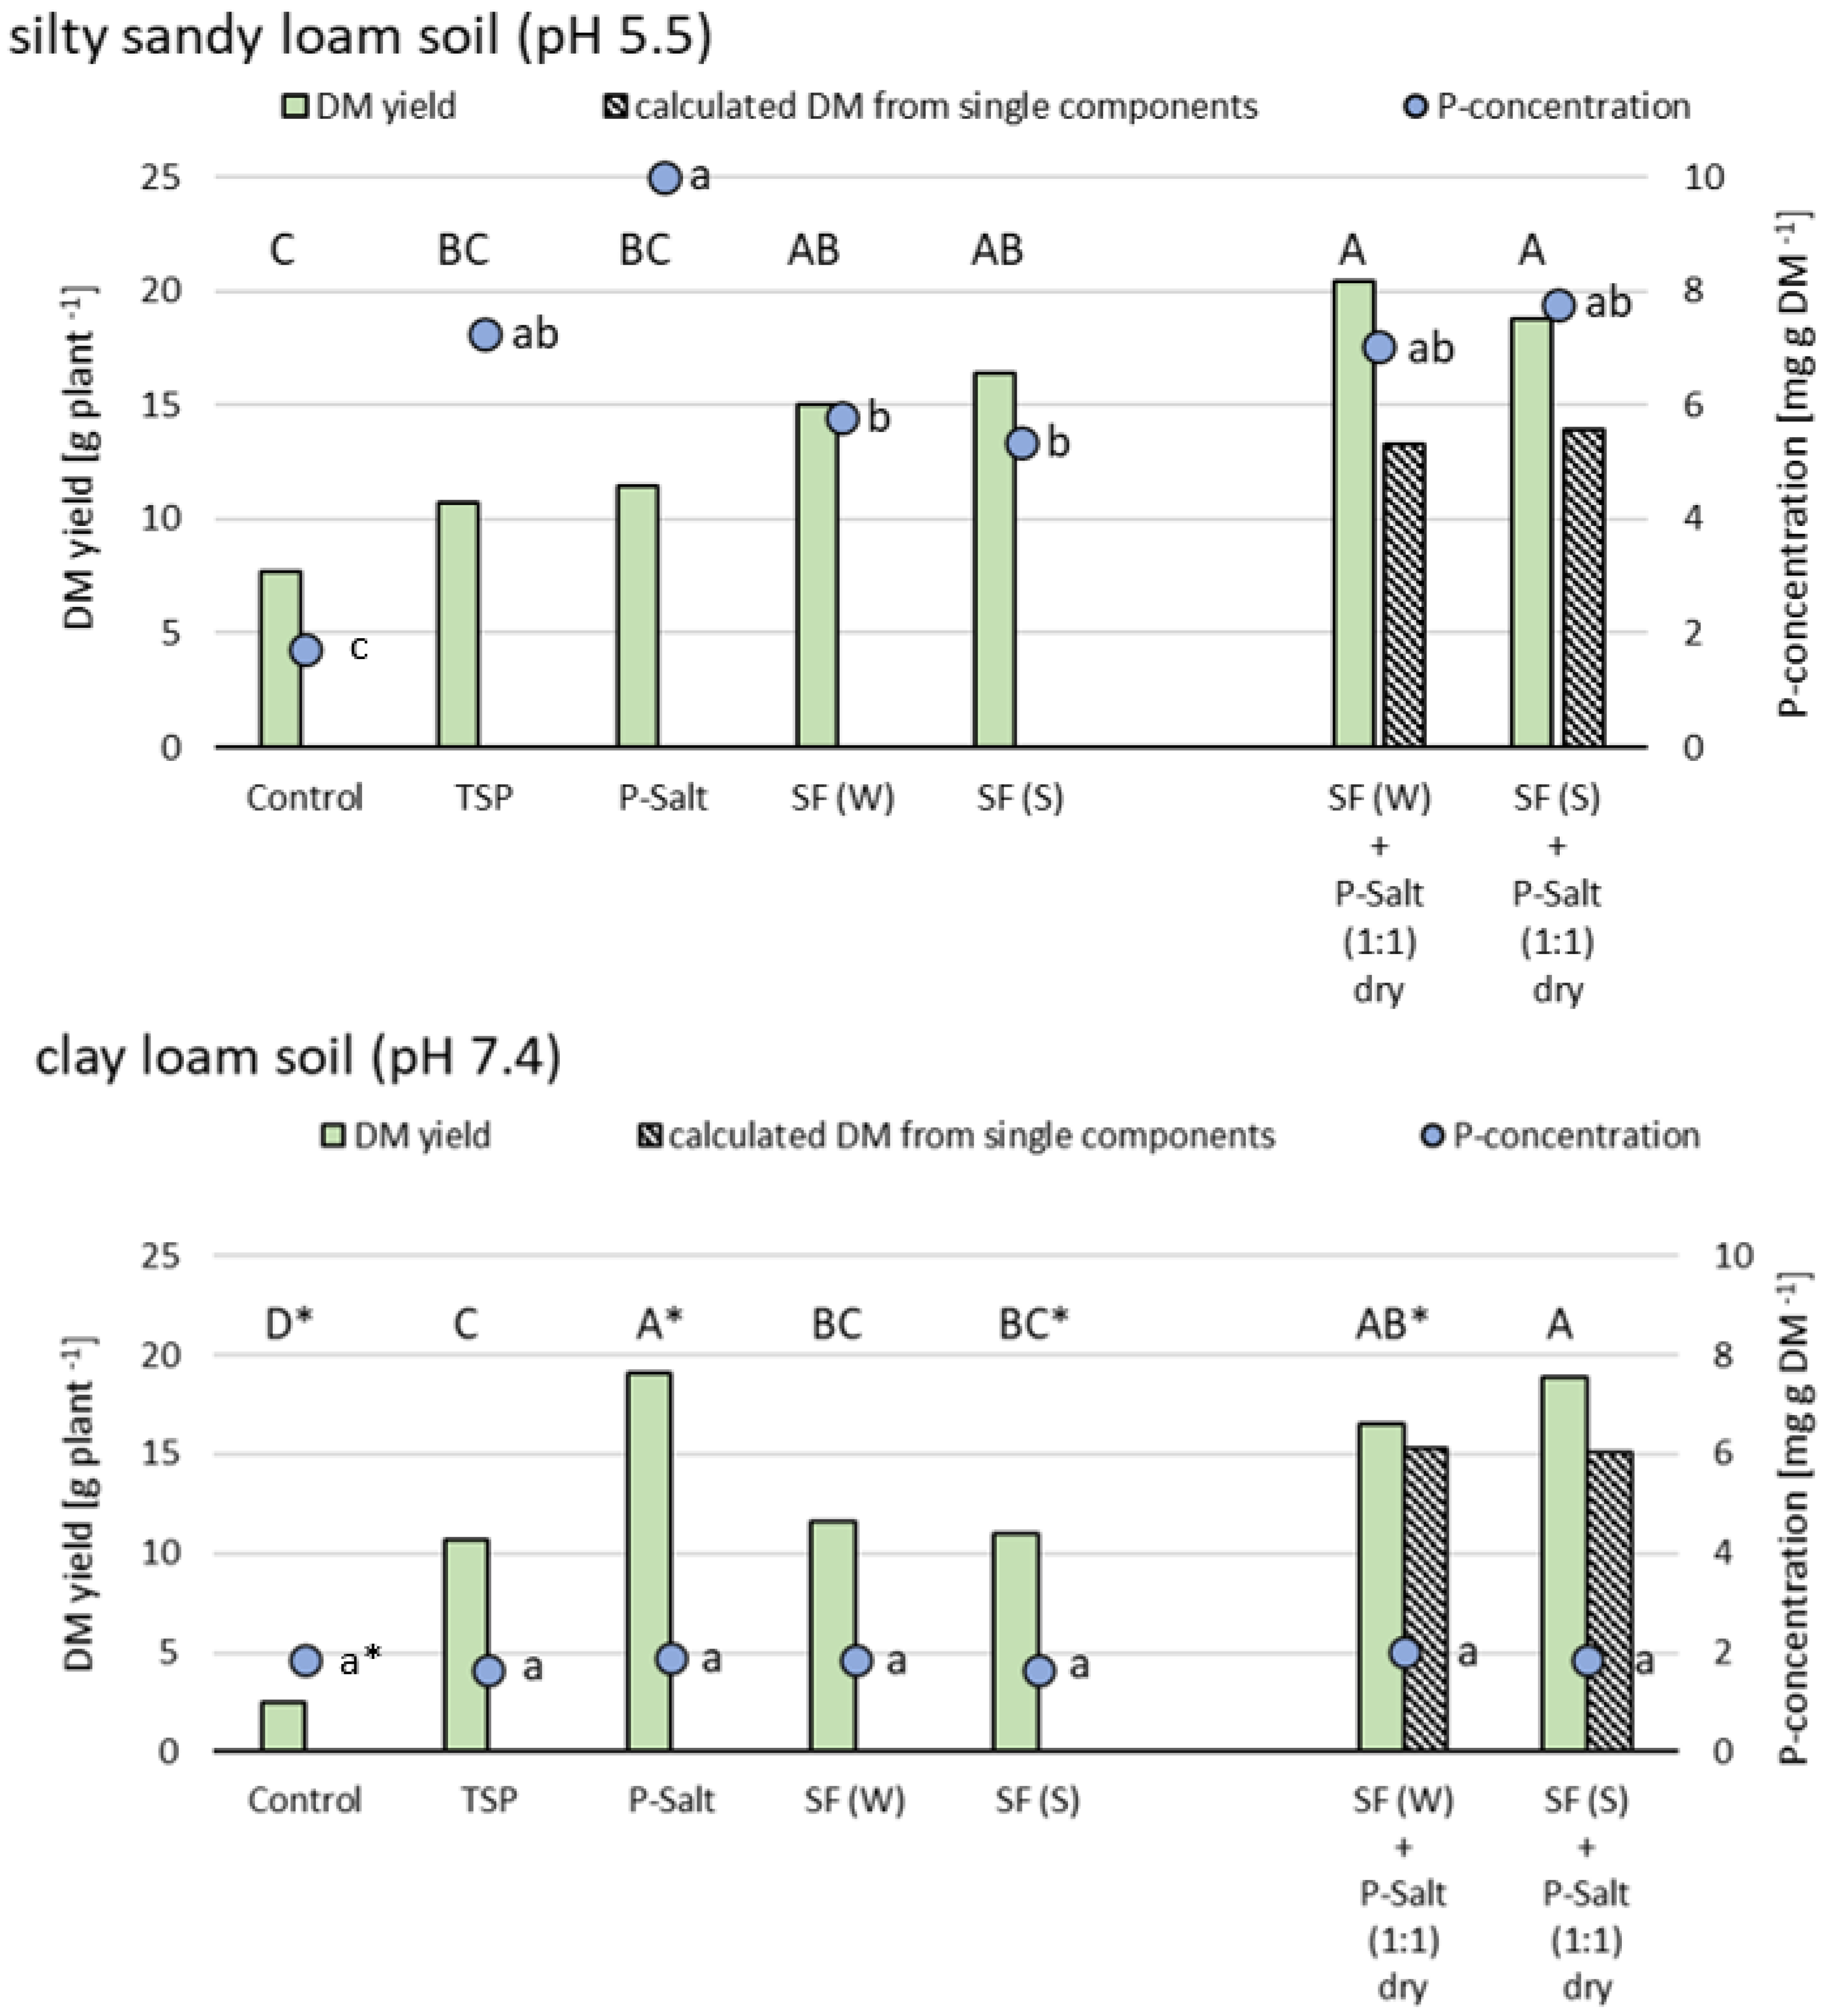
Maize shoot dry matter yield (DM yield) as an indicator for fertilization efficiency is shown in Figure 2. In the acidic silty sandy loam soil (pH 5.5), untreated controls developed the lowest DM yield (7.3 g/plant) compared to all fertilizer treatments. All single treatment groups, including the positive TSP control, were significantly higher in yield, with no significant differences between one another. The highest increase after single dosing was measured with the solid fraction SF(S) (16.45 g DM/plant) and SF(W) (15.08 g DM/plant). The overall highest DM yield (20.48 g/plant) was detected in the (1:1) mixed treatments SF(W)+ P-Salt and SF(S) + P-Salt. Both combination treatments resulted in much higher DM yield than calculated from the single component yields, indicating a synergistic effect between the fractions.
Nutrient concentration of P in the maize shoots after harvest as an indicator of nutrient mobilization and uptake into the plants is shown as mg P/g DM yield. Compared to the untreated controls, the P concentration in the maize shoots increased significantly under all fertilizer treatments and especially after treatment with P-Salt alone (10.0 mg/g DM). Compared to the reference TSP (7.26 mg P/g DM), all single and both combined treatments with recycled fertilizer resulted in similar P concentrations in the plants, indicating a sufficient P supply and an efficient P mobilization and uptake in this acidic silty sandy loam soil.
In the neutral clay loam soil (pH 7.4), untreated control plants developed by far the lowest level of DM (2.5 g/plant) compared to all other treatment groups, including those of the acidic soil. Here, P fertilization generally had a much higher relative effect on plant growth compared to the acidic soil. The TSP reference dosing increased DM to 10.7 g/plant, similar to both dried solids, SF(W) and SF(S), in single dosing. In contrast to the acidic silty sandy loam soil, single dosing of P-Salt here had the highest effect of all treatments (19.1 g DM yield/plant), significantly higher than all other single treatments including TSP. Similar to the acidic silty sandy loam soil, differences between the two dried solids were not pronounced, but absolute DM yields with the mixtures were comparable in both soils. A comparison of the calculated yields from single dosing with those of the actually measured yields of both combination treatments indicated slight additive effects of both fraction types.
Despite these high differences in dry matter yield, the P concentrations in plants grown in the neutral soil did not differ significantly between the fertilizer treatments, even including the untreated control. Apparently, the higher pH in this soil limited P availability, and therefore P uptake, to a value not influenced by the different fertilizers.

3.2. Effect of P Fertilizers on Plant Nutrient Content in Maize

Since the differences of P concentration between treatments were low, at least in case of the neutral clay loam soil, the data were also evaluated as total P content per maize plant (Figure 3). The objective was to compare the total P in each plant as a result of differences in growth.
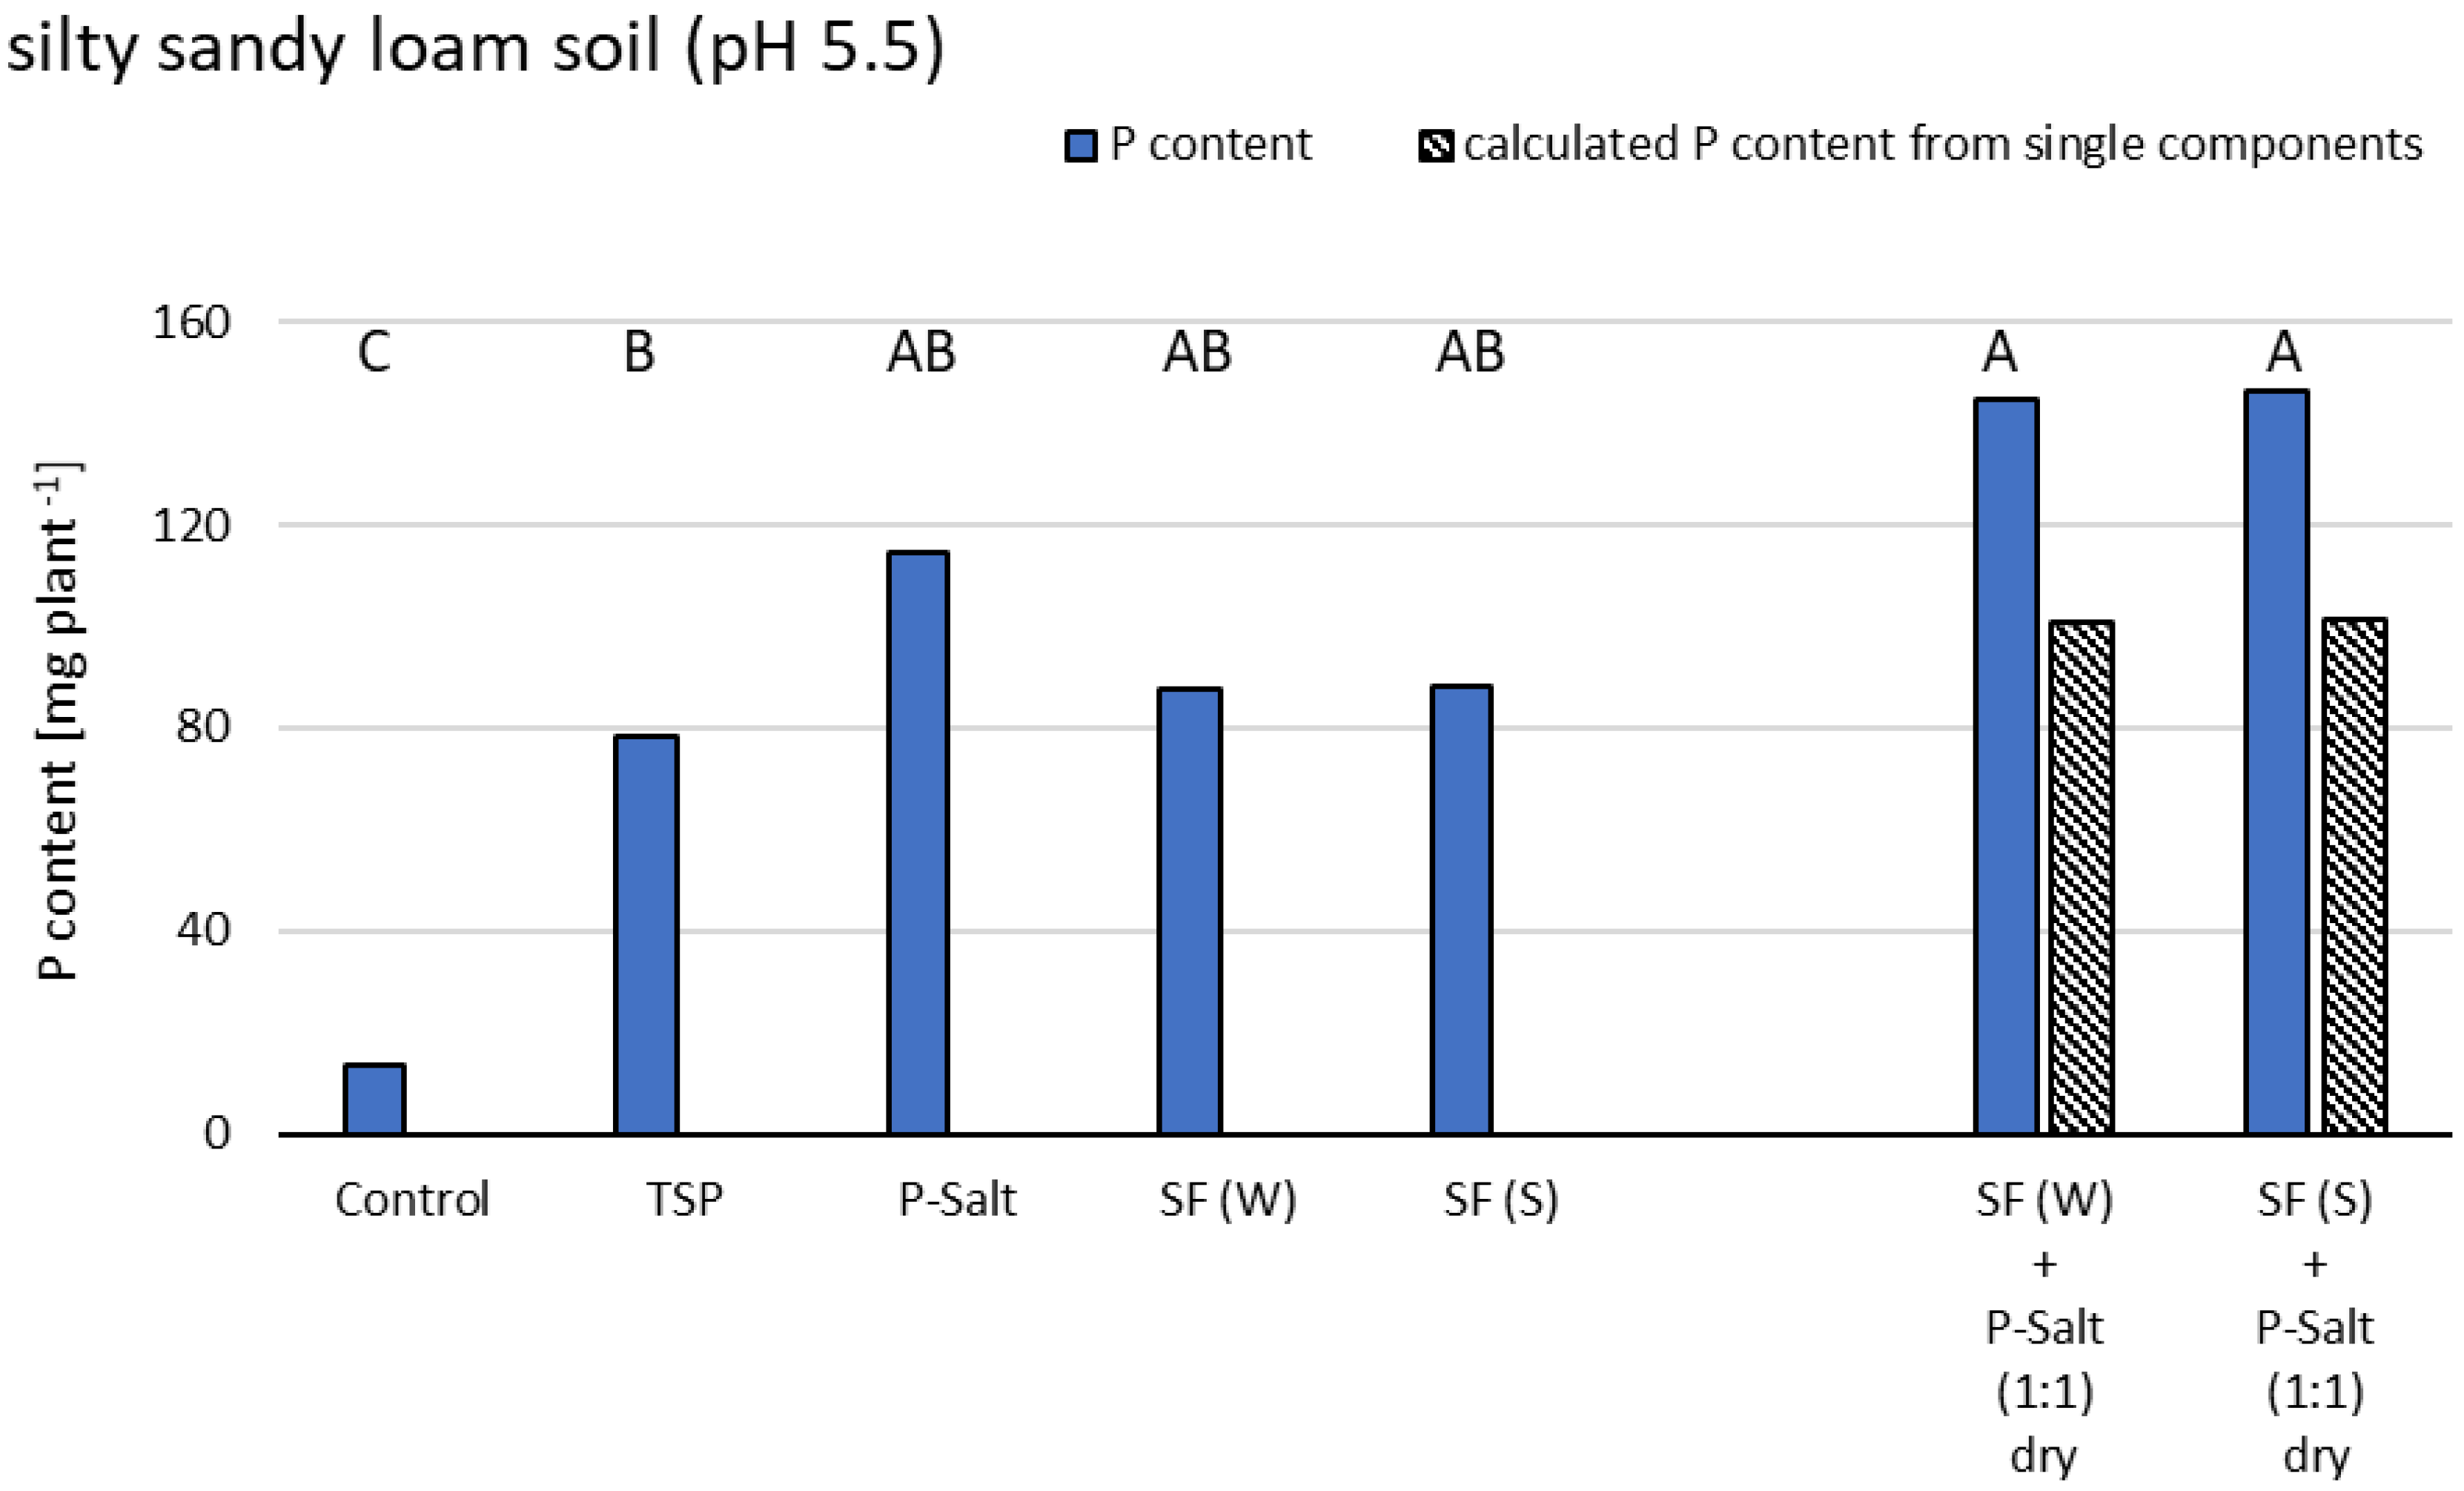
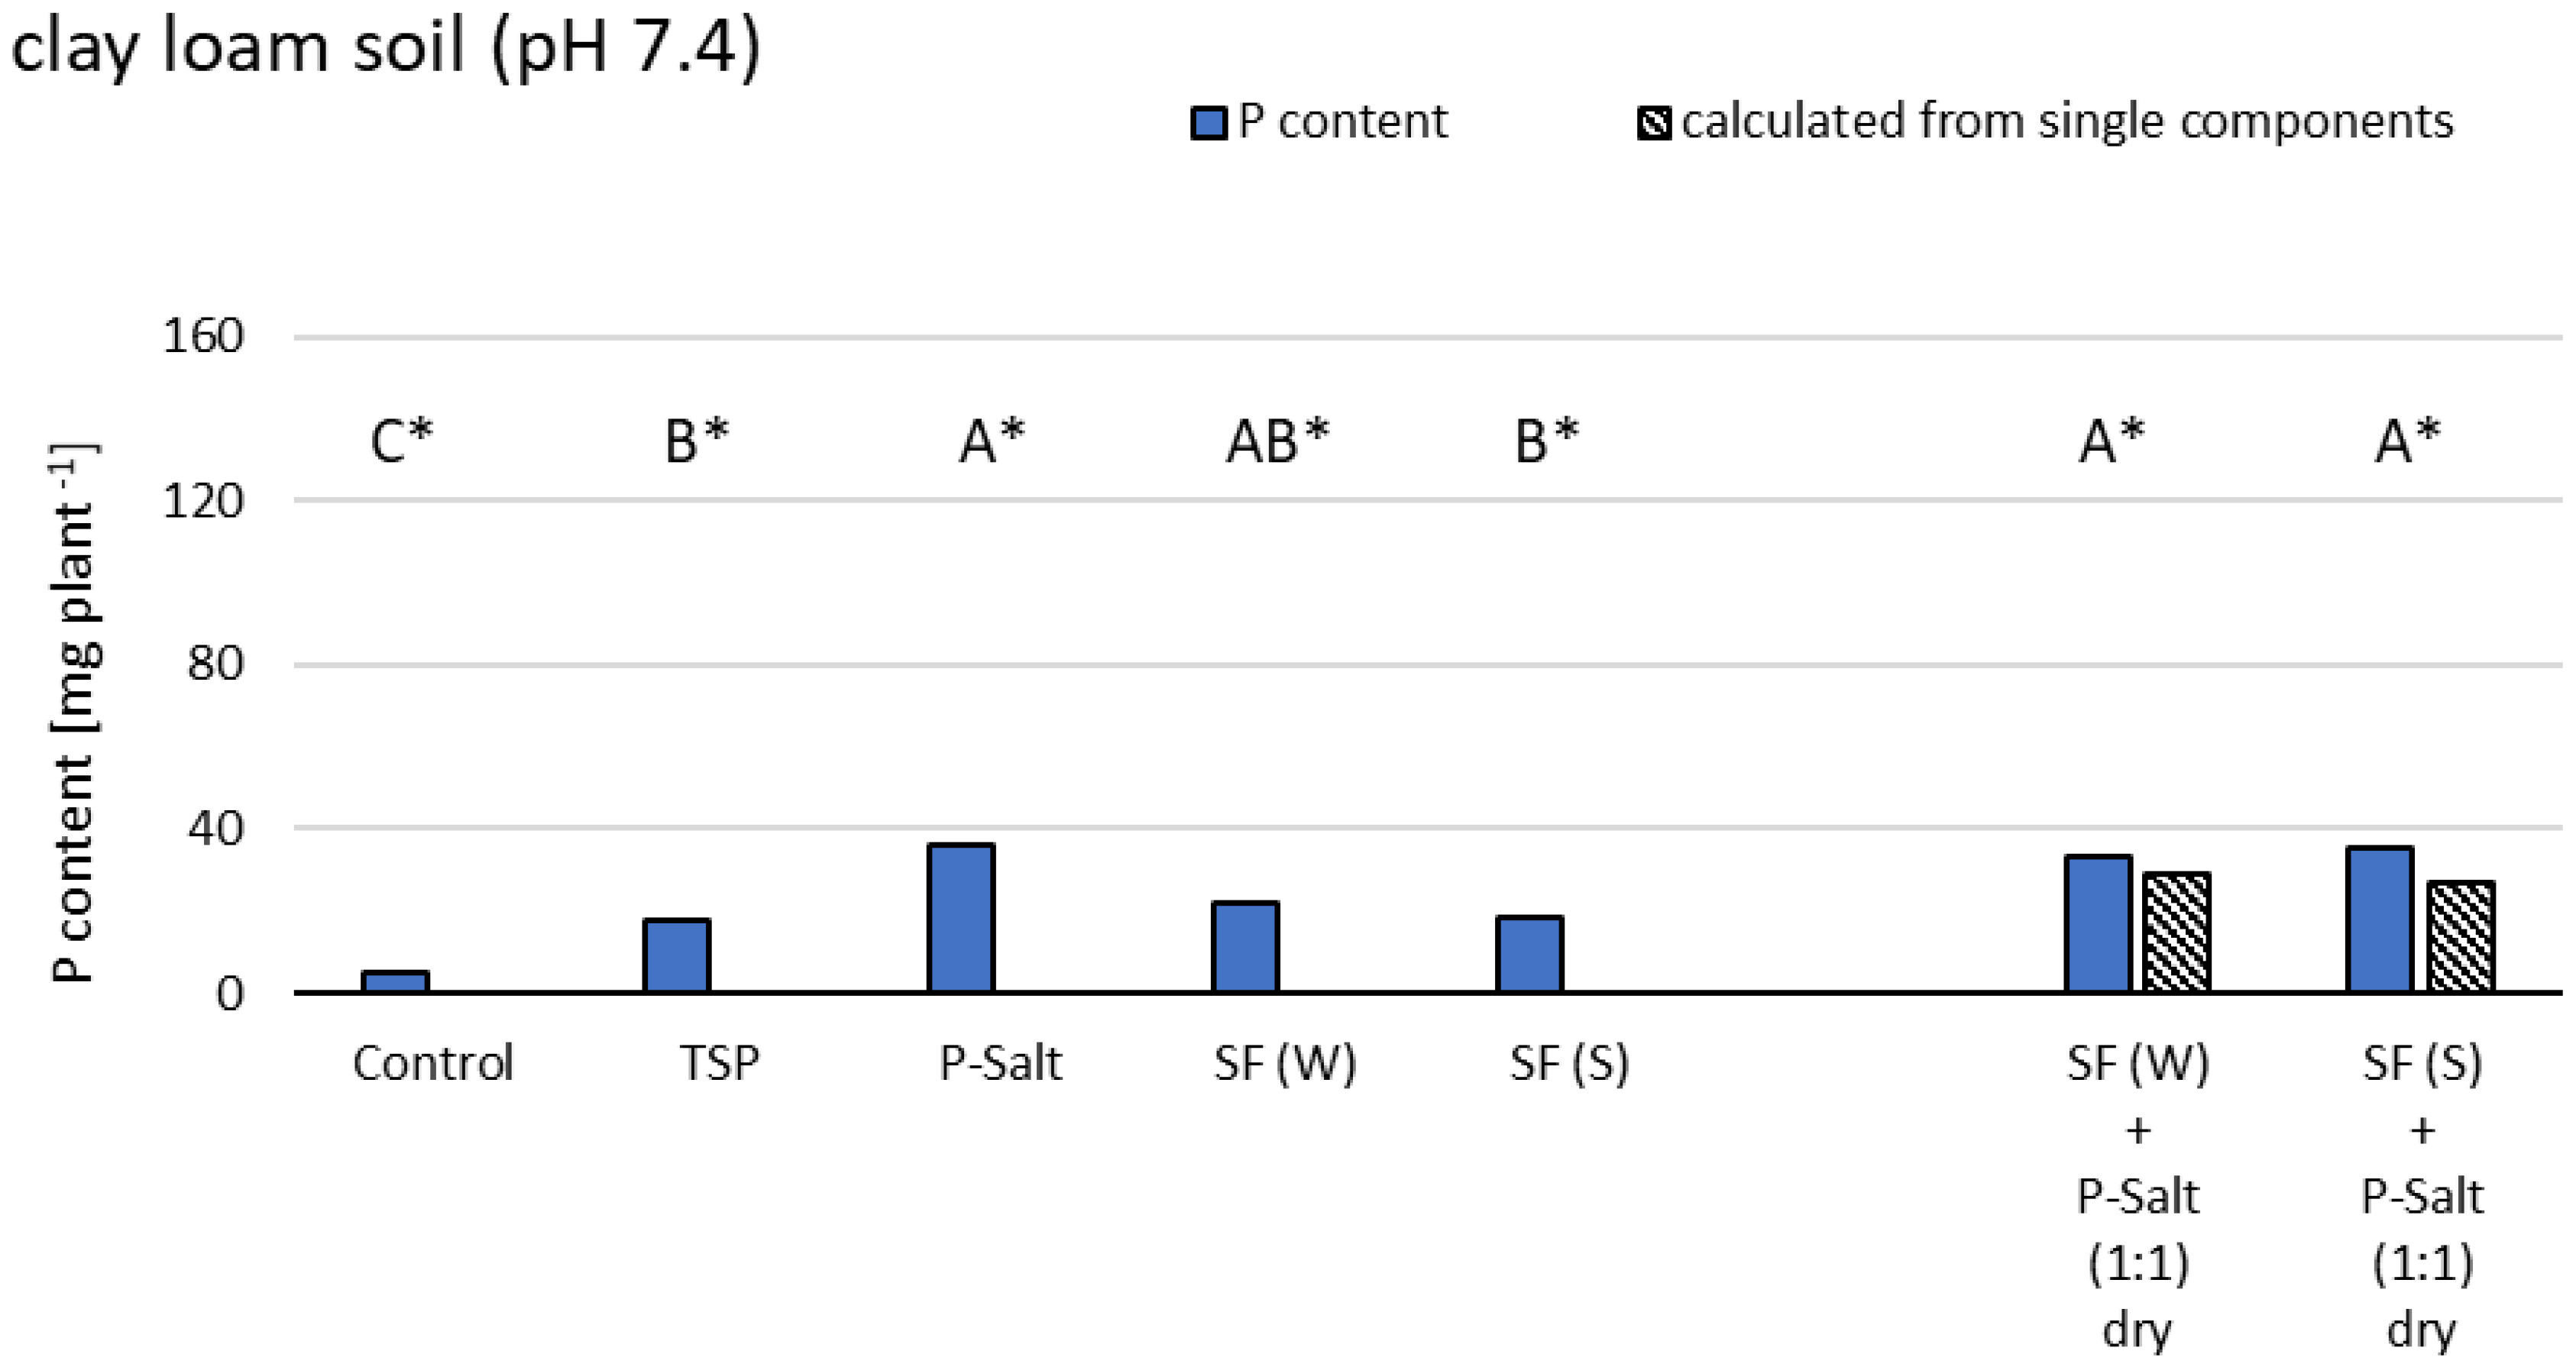
In this evaluation, the total P content per plant was increased by all applied P fertilizers in the acidic silty sandy loam. Compared to TSP, the recycled fertilizers had similar or increased effects on P content, with no difference between SF(S) and SF(W). From all single treatments, P-Salt alone resulted in the highest P content. However, when combining the single components SF + P-Salt, both combination treatments resulted in the highest P contents, without differences between each other. A comparison of the calculated P content from single dosing with those of the combinations showed clear differences, indicating once more synergistic effects in this soil.
The P content per plant in the neutral clay loam was generally much lower compared to the acidic soil. Again, single application of P-Salt resulted in the highest P content per plant, and treatments with SF(W) or SF(S) alone were less effective, with a P content similar to TSP. Like in the acidic soil, differences between SF(W) and SF(S) were not significant. Combination treatments were in the order of magnitude of P-Salt alone. Only slight synergistic effects of the combined treatments with SF(W/S) and P-Salt were observed.

3.3. Effect of P Fertilizers on Ryegrass Biomass Yield and Plant P Concentration

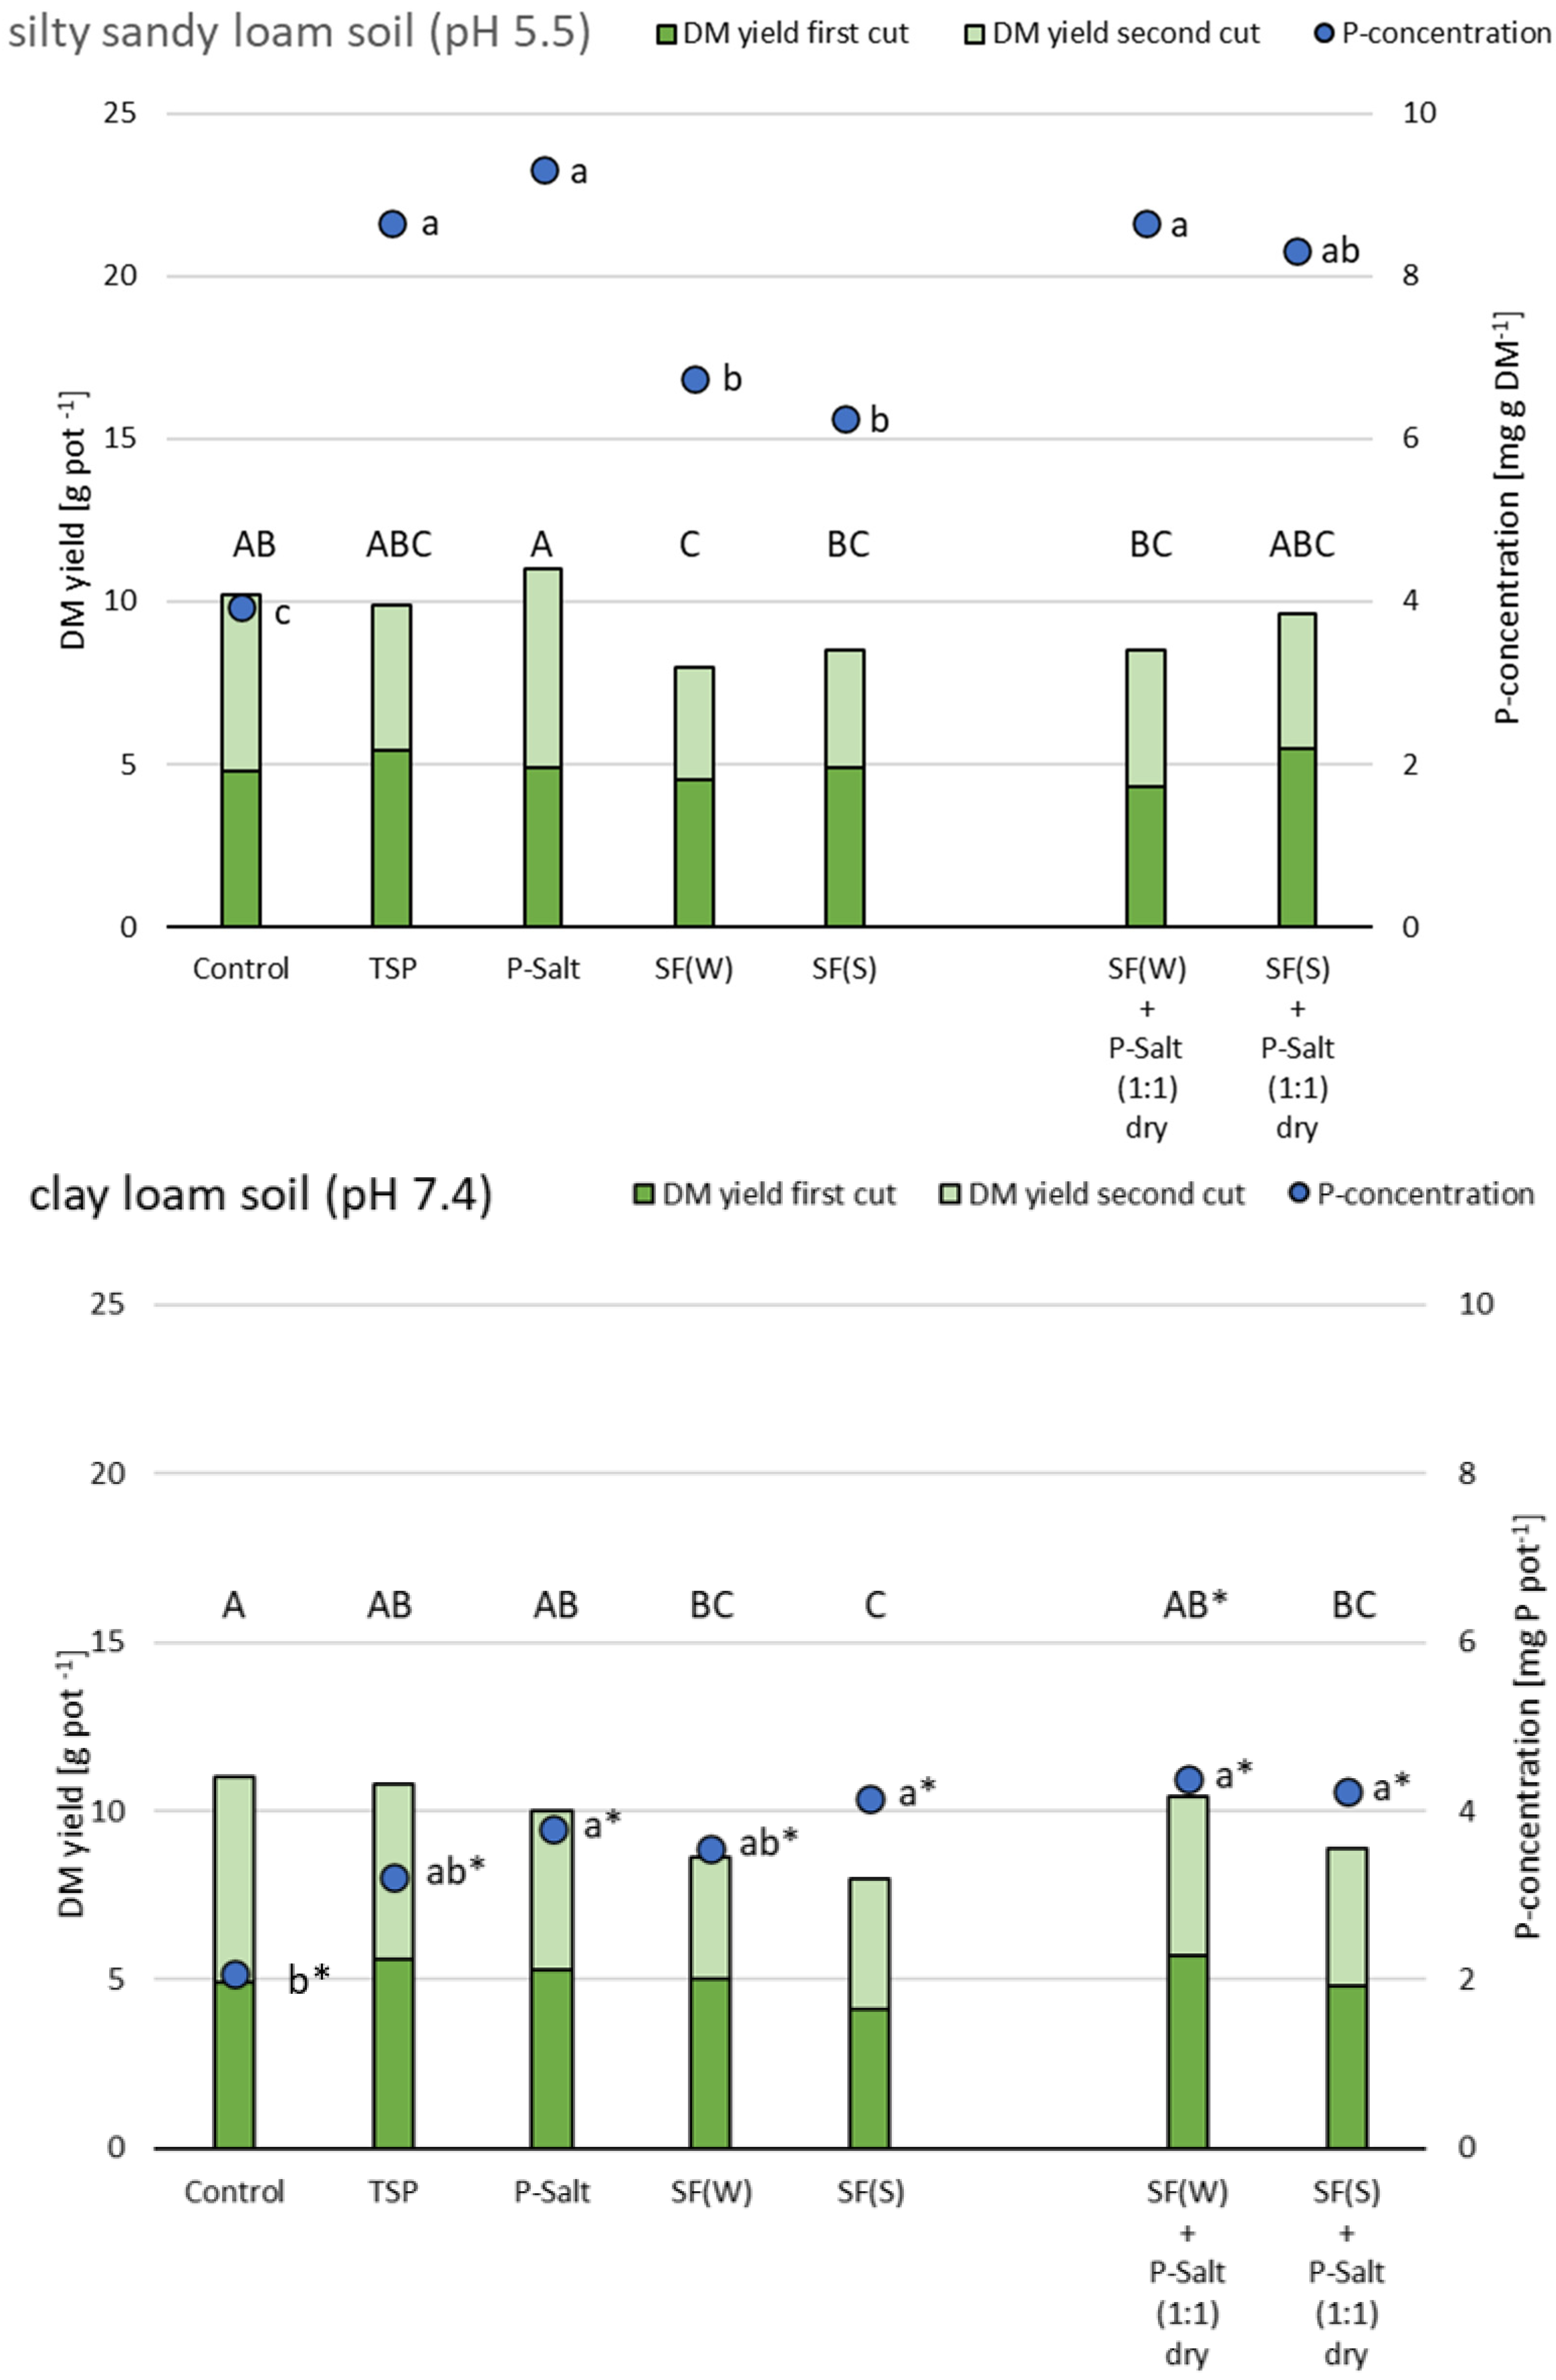
Ryegrass dry matter (DM) yield and plant P concentration are shown in Figure 4. DM yield (in g/pot) is shown as stacked bars for the first and the second cut (56 days and 84 days after ryegrass sowing). The P concentration (in mg P/g DM) as an indicator of nutrient availability in the plants is shown as an average across both harvests.
In the acidic silty sandy loam soil, none of the P fertilizers increased DM yield significantly compared to the untreated controls, despite significant differences in the plant P concentration (see below). DM yield was the highest with P-Salt alone (11 g/pot) and lowest (around 8 g/pot) with both separately dosed solid fractions (SF(W) and SF(S)). Plants exposed to the combinations of P-Salt with SF(W) or SF(S) both gave yields between these extremes, indicating a slight suppressing effect of the solid fractions, confirmed also in comparison with the untreated controls that gave remarkably high yield, similar to TSP and P-Salt.
DM yield was not found to be correlated with P concentration. Plants grown in previously P-fertilized soil had P concentrations between 6 and 9 mg P/g DM, with the highest values after P-Salt treatment (9.3 mg P/g DM) and the lowest with both solid SF(W/S) treatments (ca. 6 mg P/g DM), which were still much higher than the untreated controls (3.9 mg P/g DM). Looking at both DM yield and P concentration together, the results indicate that plant uptake of P was increased by all P fertilizers; however, unlike in maize, it was without an associated increase of plant biomass.
In the neutral clay loam soil (pH 7.4), the highest DM yield (11 g/pot) was detected in the unfertilized controls, the TSP treatment group and one combination treatment (SF(S) + P-Salt). Overall, values were at the same level as in the acidic silty sandy loam soil. The combination treatment SF(S) + P-Salt and both solid fractions alone (SF(W/S) had the lowest, but still comparably high, DM yields (around 8 g/pot).
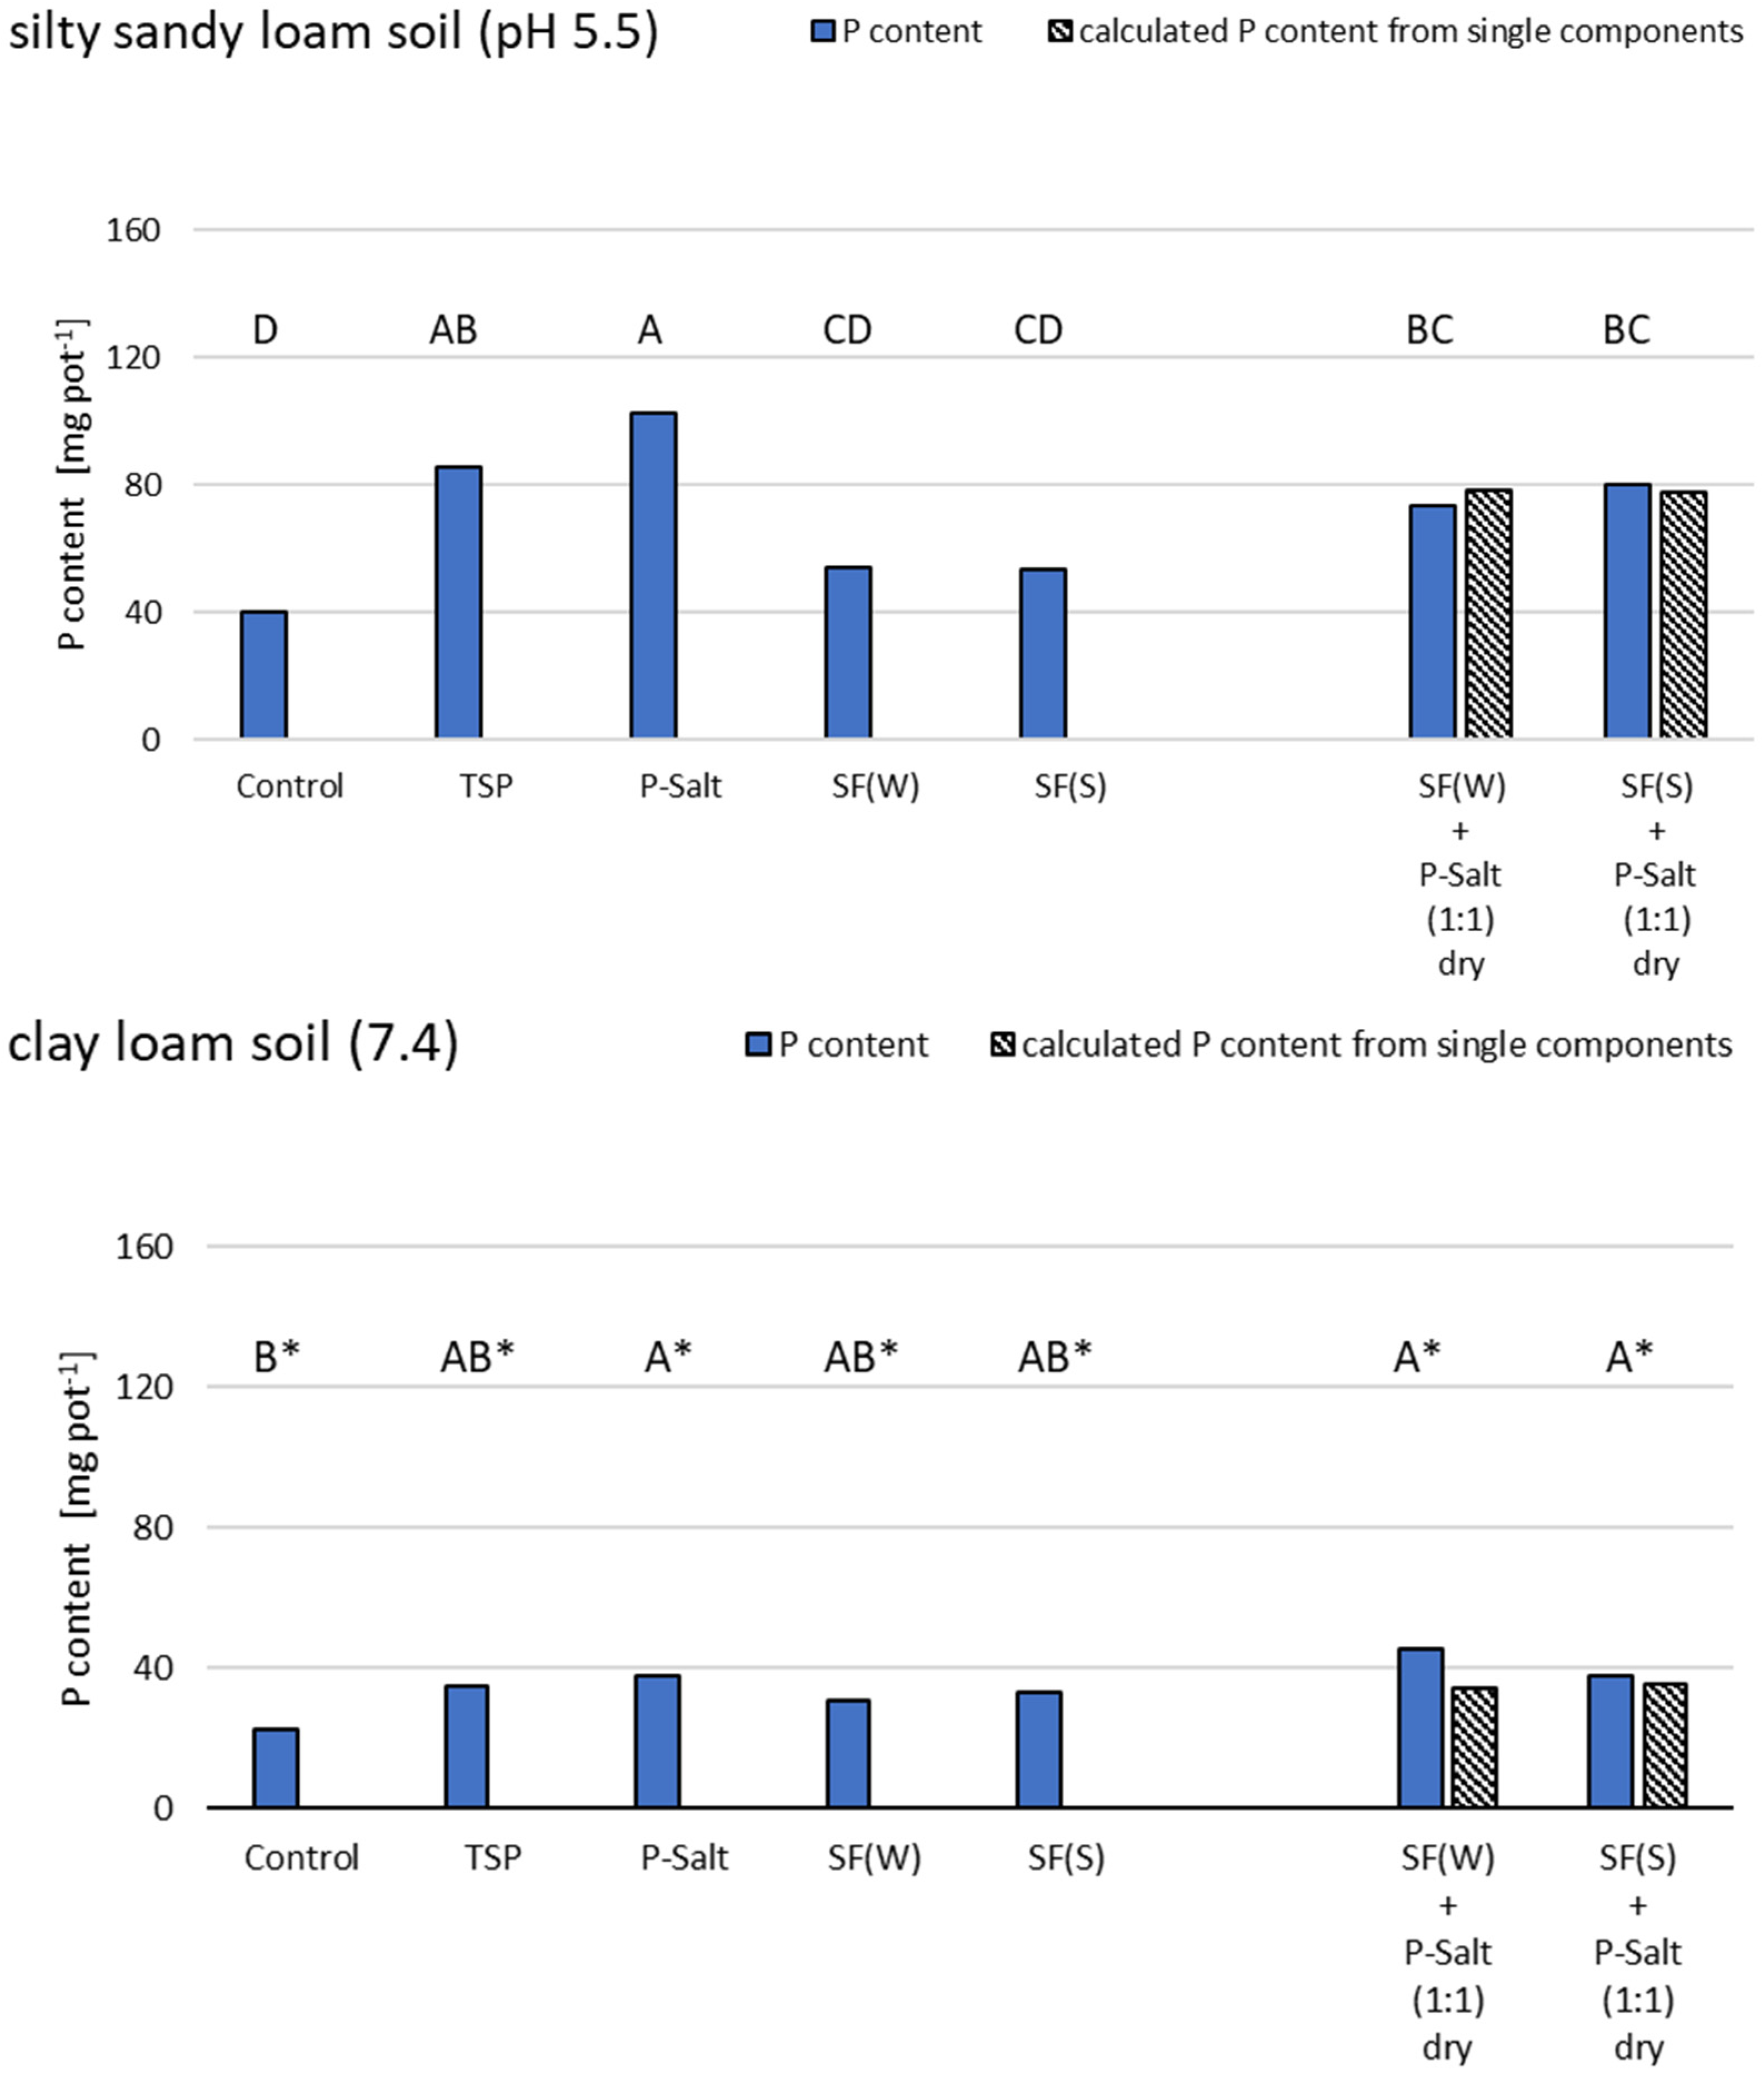
As expected, P concentration in ryegrass grown in the neutral clay loam soil was generally lower (3–4 mg P/pot) than in the acidic silty sandy loam (6–8 mg P/pot), ranging from 2.1 mg/g DM in the untreated controls to 4.4 mg/g DM in the SF(W) + P-Salt combination. Overall, P concentration in ryegrass, grown in this neutral soil, was rather inversely correlated with DM yield, at least with the single doses, indicating that P was not a limiting nutrient for this plant species in this experimental setup.

3.4. Effect of P Fertilizers on Plant Nutrient Content in Ryegrass

Similar to the maize experiment, the total P content per growth unit was related to the total plant biomass harvested per pot (Figure 5). In the acidic silty sandy loam, all P fertilizer treatments resulted in increased P content compared to the unfertilized controls. The highest P content was detected with P-Salt alone (102.4 mg P/pot). The TSP reference dosing gave slightly lower P content (85.7 mg P/pot). Both solid fractions (SF(W/S)) had the lowest P content of all fertilizer treatments (around 54 mg P/pot), which was still higher than the unfertilized controls. Intermediate P contents of ca. 75 mg P/pot were found after both combination treatments, SF(W/S) + P-Salt, where, in contrast to maize, values suggested rather additive than synergistic effects.
In the neutral clay loam soil, the total P content of all ryegrass harvests was 50–60% lower than in the acidic silty sandy loam soil. The highest P content in the neutral clay loam was detected with the combination treatment SF(W) + P-Salt (45.5 mg P/pot), with slight synergistic effects between the mixing partners. The second combination treatment (SF(S) + P-Salt) was on a similar level, and the effects were additive here. Of the single fertilizer treatments, TSP and P-Salt gave similar P contents of 34.7 and 37.9 mg P/pot, whereas both solid fractions (SF(W/S)) were slightly lower (30.5 and 33.2 mg P/pot). The lowest P-content (22.7 mg P/pot) was measured in the untreated controls.

3.5. Effect of P Fertilizers on Plant Available P (CAL-P) in Soil

At the end of the experiment (134 days after soil fertilization, followed by maize cultivation for 50 days and harvest, and subsequent ryegrass cultivation for 84 days and harvest), the CAL-P concentration in the soil was analyzed as an indicator for the P plant availability as a function of the different initial P fertilizer treatments in both soils.
The results displayed in Table 2 show that all tested P fertilizers significantly increased the CAL-P concentration in the acidic silty sandy loam soil compared to the untreated control. The highest values were found in soil fertilized with P-Salt alone (81 mg P/kg soil), compared to only 19 mg P/kg soil in the untreated control (comparable to its initial value before fertilization of 15 mg/kg soil). P-Salt and both combinations with SF(S) and SF(W) resulted in higher CAL-P levels than the reference TSP, which was at the same level as the solids SF(S) and SF(W).
In the neutral clay loam soil, all tested P fertilizers also increased the free P concentration in soil compared to untreated controls (19 mg/kg soil; value prior to fertilization: 26 mg/kg soil), but to a lower extent than in the acidic silty sandy loam. Like in the acidic soil, P-Salt and both combination treatments gave higher values (43–57 mg/kg soil) than TSP (38 mg/kg soil). The highest CAL-P was found for SF(W), with 57 mg/kg soil.

4. Discussion

4.1. Effects of P Fertilizers on Maize Biomass Yield and P Uptake

Organic P fertilizers, produced from digestates of a biogas plant operating with a mixture of cow manure and maize silage, increased the dry matter yield of maize to the same or a higher extent than the reference triple superphosphate (TSP). Whilst the P fertilizing properties of this material have previously been investigated in neutral soils with different crops and soils [23,24,33], this study shows a comparison between a neutral clay loam soil (pH 7.4) and an acidic silty sandy loam soil (pH 5.5), both representing a large proportion of European agricultural soils [41].
Biomass yield in the neutral soil almost doubled compared to TSP when P-enriched salt (P-Salt), recovered from the liquid fraction of the digestate, or combinations with solid fractions were used. The increase compared to TSP was even more pronounced if compared to an earlier experiment performed with the same soil [23]. Combined treatments of P-Salt and solid fractions (SF(W/S)) generally gave equal or more favorable biomass growth compared to single treatments, with insignificant differences between the drying techniques of the recycled solids. The highest DM yield increase in the acidic soil was observed with combinations of P-Salt with solid fractions, and P-Salt alone had an effect similar to TSP. Apparently, P availability was less of a limiting factor in the acidic than in the neutral soil, which confirms earlier findings by [25]. The authors explained this effect by a higher abundance of H2PO4 over HPO42− in soils with an acidic pH. While P-Salt had a higher relative influence on maize fertilization in the neutral soil, the solid fractions (SF(W/S)), containing high proportions of organic material, apparently had a higher impact on DM yield increase under acidic soil conditions by an additional, yet unknown, growth stimulating mechanism.
Similar to earlier findings [23], P concentration in crops grown in the neutral clay loam soil was not significantly affected by any fertilization measure. However, total P content was positively correlated with DM yield across the different treatments, indicating that net P uptake into the plants increased with P-Salt and combinations. In contrast to the neutral soil, all fertilizer treatments increased the P concentration of crops grown in the acidic silty sandy loam soil by a factor of 2.5–5, but without direct correlation to DM yield. The net P uptake into the plants was the highest with P-Salt and combinations, and for the treatment combinations, this correlated well with their highest DM yield. The finding that soil pH has a great influence on P bioavailability was also reported earlier [31,42]. With respect to biomass increase, however, a comparison across all fertilizer combinations in both soils indicates that P uptake of plants in the acidic soil was beyond the limiting minimum for plant growth.
The influence of soil pH on the efficiency of recycled P fertilizer was investigated by [43], who used Magnesium-SSA. This material is a thermal recycling product from sewage sludge (sewage sludge ashes, SSA), which contains high amounts of Ca and Mg phosphates, similar to the P-Salt used in this study. The authors found that a high fertilizer efficiency of Mg-SAA was only observed under acidic (pH < 6.5) soil conditions. It was suggested that recycled P fertilizers might work best in acidic soils because the dissolution of Ca and Mg phosphates might be controlled by protons. Consequently, Möller et al. [42] recommended that Mg-SAA should be used under acidic soil conditions only. For the P fertilizer fractions in this study, however, it could be shown that the fertilizing effects in neutral soils were similar and even more pronounced than in acidic soils, so that the pH limitations observed earlier could be overcome with the material produced in the GOBi recycling process.
Summing up, the results described above confirm that P-Salt and combinations with the associated solid fractions can be effective alternative fertilizers to TSP for maize grown in neutral and acidic agricultural soils.

4.2. Influence of P Fertilizers on Ryegrass Biomass Yield and P Uptake

The DM yield of ryegrass, grown for 84 days in the remaining pots after previous maize cultivation, was not positively affected by any of the initial P fertilizations, neither in the acidic silty sandy loam soil nor in the neutral clay loam soil. P availability in both soils seemingly was not limited for ryegrass under these conditions of crop rotation, without additional P fertilization at sowing.
The absence of P fertilizing effects with ryegrass is in contrast to earlier findings by [44,45], who reported an increase of DM yield following P fertilizer application. Despite the difference that these authors used initial fertilization directly prior to cultivation, it was also mentioned by [45] that perennial ryegrass cultivated in warmer seasons at soil temperatures up to 13 °C did not show yield responses to P fertilizers and suggested that soil temperature may be a critical factor for ryegrass fertilization. The greenhouse pot cultivation in our study may be a model for summer season cultivation without observable P fertilizing effects. A more likely reason, however, is that the P concentration in both soils at the timepoint of ryegrass sowing still was above the maximum P demand of the plants.
Despite the biomass being unaffected by the fertilizer treatments, P concentration in ryegrass was increased compared to the untreated controls in both soils, and more so in plants grown in the acidic silty sandy loam soil than in the neutral clay loam. Ref. [46] reported that the optimum P concentration in plants is between 3.0–4.0 g/kg DM. Looking at the unfertilized vs. fertilized DM of ryegrass, sufficient P was apparently available in the neutral clay loam soil, and levels were even more than what was required in the acidic soil. Ryegrass is known to extract P from soils; the application of P fertilizer has led to an accumulation of total soil P and is therefore a good candidate for phytoremediation in many agricultural soils [47], reducing the risk of P loss to the environment. The results of this study show that P extraction by ryegrass is also possible after use of recycled P fertilizers. Our finding that the P concentration in ryegrass plants was much higher compared to maize plants is in line with earlier reports (for maize, e.g., [48,49]; for ryegrass, e.g., [44]).

4.3. CAL-P in Soil

The measured CAL-P concentration in both soils, 134 days after P fertilization and growth of maize and ryegrass, was still increased with all tested P fertilizers compared to the untreated control. CAL-P, representing the P pool available for plant uptake over time, was generally lower in the neutral clay loam soil (pH 7.4) than in the acidic silty sandy loam soil (pH 5.5). This confirms once more that increased soil pH towards neutral or slightly alkaline conditions causes a decrease in soluble P or an increase in P sorption and/or P immobilization [50], so that plant-available P may become suboptimal for crop production, although total soil P is high [49]. In contrast to the neutral soil, the acidic silty sandy loam soil had most likely fewer binding sites for P and a higher P mobilization potential, which allowed for higher P uptake in maize and ryegrass plants.
The highest CAL-P concentrations were observed in the acidic soil treated with P-Salt alone or in combination with the recycled solids, which correlates with the increased net uptake of P into the plants. In the neutral soil, no clear difference between the P fertilizer treatments could be observed for CAL-P, which is again in line with the low P concentration in both plant species compared to the acidic soil. Unlike in the study by Bach et al. [23], correlations between CAL-P and DM yield could not be observed here, even in the same neutral clay loam soil used in this study. However, CAL-P was measured much later here than in the previous setup and might be dependent on the temporary soil/rhizosphere–plant continuum [4,51].

5. Conclusions

In the present study, we compared P fertilizers recovered from digestates of a biogas plant, operating with a mixture of cow manure and maize silage, in two different soils and plant species. Compared to the reference fertilizer TSP, the recycled fractions tested alone or in combination caused similar or even higher DM yield in maize plants cultivated in soils with neutral as well as with acidic pH. In contrast to this, ryegrass biomass was not increased by any P fertilization treatment in both soils, which might be an important finding for grassland cultivation and weed management in maize or other crops. Despite biomass production being unaffected by all P fertilizers, an increased net uptake of P in ryegrass represents an option to extract excess P from soils after treatment with the recycled fertilizers used in this study.
Significant differences were observed for P concentration and total P content in both maize and ryegrass plants, with the acidic silty sandy loam soil and the neutral clay loam soil, suggesting possible fertilization regimes for soils with different pH in agricultural practice.
The results of this study show that the recycled P fertilizers investigated have a high potential for replacement of inorganic P derived from phosphate rock, not only in neutral but also in acidic soils. Our investigations were run as pot experiments under controlled greenhouse conditions. Investigations under field conditions, including further research on the associated soil/rhizosphere interactions, like phosphatase activity, plant growth–promoting rhizobacteria, release of organic acid anions and more, will be important to understand the underlying effects and influencing parameters that are essential for commercial use in maize growth and other agricultural circumstances.

Author Contributions

I.-M.B. conceived, designed and performed the experiments and analyzed the data. L.E. and A.B. supported the experiment performance and analysis. I.-M.B. and T.M. are the lead authors; all authors contributed to the writing of the paper. All authors have read and agreed to the published version of the manuscript.

Funding

This work was performed within the project “GOBi”, which received funding from the Federal Ministry of Education and Research (BMBF) under grant agreement No. 03EK3525A.

Institutional Review Board Statement

Not applicable.

Informed Consent Statement

Not applicable.

Data Availability Statement

Data are available from the corresponding author.

Acknowledgments

We would like to thank Helene Ochott and Charlotte Haake for their support with the laboratory analyses and Ivan Guzman-Bustamante for statistical advice.

Conflicts of Interest

The authors declare no conflict of interest.

References

  1. Garg, S.; Bahl, G.S. Phosphorus availability to maize influenced by organic manures and fertilizer P associated phosphatase activity in soils. Bioresour. Technol. 2008, 99, 5773–5777. [Google Scholar] [CrossRef] [PubMed]
  2. Barrow, N.J.; Debnath, A. Effect of phosphate status on the sorption and desorption properties of some soils of northern India. Plant Soil 2014, 378, 383–395. [Google Scholar] [CrossRef]
  3. Müller, T.; Zhang, F. Maize-based food-feed-energy systems under limited phosphate resources. Front. Agric. Sci. Eng. 2019, 6, 313–320. [Google Scholar] [CrossRef] [Green Version]
  4. Shen, J.; Yuan, L.; Zhang, J.; Li, H.; Bai, Z.; Chen, X.; Zhang, W.; Zhang, F. Phosphorus Dynamics: From Soil to Plant. Plant Physiol. 2011, 156, 997–1005. [Google Scholar] [CrossRef] [PubMed] [Green Version]
  5. De Bolle, S.; De Neve, S.; Hofmann, G. Rapid redistribution of P to deeper soil layers in P saturated acid sandy soils. Soil Use Manag. 2013, 29, 76–82. [Google Scholar] [CrossRef]
  6. Djojic, F.; Bergström, L.; Grant, C. Phosphorus management in balanced agricultural systems. Soil Use Manag. 2005, 21, 94–101. [Google Scholar] [CrossRef]
  7. Ohtake, H.; Tsuneda, S. Phosphorus Recovery and Recycling; Springer: Singapore, 2019. [Google Scholar]
  8. U.S. Geological Survey. Mineral Commodity Summaries; U.S. Department of the Interior, U.S. Geological Survey: Reston, VA, USA, 2021.
  9. Lou, H.; Zhao, C.; Yang, S.; Shi, L.; Wang, Y.; Ren, X.; Bai, J. Quantitative evaluation of legacy phosphorus and its spatial distribution. J. Environ. Manag. 2018, 211, 296–305. [Google Scholar] [CrossRef]
  10. Krüger, O.; Adam, C. Phosphorus in recycling fertilizers—Analytical challenges. Environ. Res. 2017, 155, 353–358. [Google Scholar] [CrossRef]
  11. European Commission (2014) COM 1-214-297-EN F1-1 Communication from the Commission to the European Parliament, the Council, the European Economic and Social Committee and the Committee of the Regions: On the Review of the List of Critical Raw Materials for the EU and the Implementation of the Raw Materials Initiative. {SWD(2014) 171 Final}. Available online: https://eur-lex.europa.eu/legal-content/EN/TXT/PDF/?uri=CELEX:52014DC0297&from=CS (accessed on 5 January 2022).
  12. European Commission (2017) Communication from the Commission to the European Parliament, the Council, the European Economic and Social Committee and the Committee of the Regions on the 2017 List of Critical Raw Materials for the EU. {COM(2017) 490 Final}. Available online: https://ec.europa.eu/transparency/documents-register/detail?ref=COM(2017)490&lang=en (accessed on 5 January 2022).
  13. Eichler-Löbermann, B.; Köhne, S.; Köppen, D. Effect of organic, inorganic, and combined organic and inorganic P fertilization on plant P uptake and soil P pools. J. Plant Nutr. Soil Sci. 2007, 170, 623–628. [Google Scholar] [CrossRef]
  14. Kratz, S.; Vogel, C.; Adam, C. Agronomic performance of P recycling fertilizers and methods to predict it: A review. Nutr. Cycl. Agroecosyst. 2019, 115, 1–39. [Google Scholar] [CrossRef]
  15. Talboys, P.J.; Heppell, J.; Roose, T.; Healey, J.R.; Jones, D.L.; Withers, P.J.A. Struvite: A slow-release fertiliser for sustainable phosphorus management? Plant Soil 2016, 401, 109–123. [Google Scholar] [CrossRef] [PubMed] [Green Version]
  16. EBA. Statistical Report; European Biogas Association: Brussels, Belgium, 2018. [Google Scholar]
  17. Produzierendes Gewerbe, Düngemittelversorgung, Wirtschaftsjahr 2019/2020. Statistisches Bundesamt (Destatis). 2020. Available online: https://www.destatis.de/DE/Themen/Branchen-Unternehmen/Industrie-Verarbeitendes-Gewerbe/Publikationen/Downloads-Fachstatistiken/duengemittelversorgung-jahr-2040820207004.pdf?__blob=publicationFile (accessed on 25 September 2021).
  18. Alburquerque, J.A.; de la Fuente, C.; Campoy, M.; Carrasco, L.; Najera, I.; Baixauli, C.; Caravaca, F.; Roldan, A.; Cegarra, J.; Bernal, M.P. Agrucultural use of digestate for horticultural crop production and improvement of soil properties. Eur. J. Agron. 2012, 43, 119–128. [Google Scholar] [CrossRef]
  19. Möller, K.; Müller, T. Effects of anaerobic digestion on digestate nutrient availability and crop growth: A review. Eng. Life Sci. 2012, 12, 242–257. [Google Scholar] [CrossRef]
  20. Romero-Güiza, M.S.; Mata-Alvarez, J.; Chimenos Rivera, J.M.; Astals Garcia, S. Nutrient recovery technologies for anaerobic digestion systems: An overview. Rev. ION 2016, 29, 7–26. [Google Scholar] [CrossRef] [Green Version]
  21. Kahiluoto, H.; Kuisma, M.; Ketoja, E.; Salo, T.; Heikkinen, J. Phosphorus in manure and sewage sludge more recyclable than in soluble inorganic fertilizer. Environ. Sci. Technol. 2015, 49, 2115–2122. [Google Scholar] [CrossRef] [Green Version]
  22. Lambers, H.; Finnegan, P.M.; Lalibertè, E.; Pearse, S.J.; Ryan, M.H.; Shane, M.W.; Veneklaas, E.J. Phosphorus nutrition of Proteaceae in severely ohosphorus-impoverished soils: Are there lessons to be learned for future? Plant Physiol. 2011, 156, 1058–1066. [Google Scholar] [CrossRef] [Green Version]
  23. Bach, I.-M.; Essich, L.; Müller, T. Efficiency of recycled biogas digestates as phosphorus fertilizers for maize. Agriculture 2021, 11, 553. [Google Scholar] [CrossRef]
  24. Ehmann, A.; Bach, I.-M.; Bilbao, J.; Lewandowski, I.; Müller, T. Phosphate recycled from semi-liquid manure and digestate are suitable alternative fertilizers for ornamentals. Sci. Hortic. 2018, 243, 440–450. [Google Scholar] [CrossRef]
  25. Penn, C.J.; Camberato, J.J. A critical review on soil chemical processes that control how soil pH affects phosphorus availability to plants. Agriculture 2019, 9, 120. [Google Scholar] [CrossRef] [Green Version]
  26. Murrmann, R.P.; Peech, M. Effect of pH on Labile and Soluble Phosphate in Soils. Soil Sci. Soc. Am. J. 1969, 33, 205–210. [Google Scholar] [CrossRef]
  27. Gustafsson, J.P.; Mwamila, L.B.; Kergoat, K. The pH dependence of phosphate sorption and desorption in Swedish agricultural soils. Geoderma 2012, 189, 304–311. [Google Scholar] [CrossRef] [Green Version]
  28. Scanlan, C.; Brennan, R.; Sarre, G.A. Effect of soil pH and crop sequence on the response of wheat (Triticum aestivum) to phosphorus fertiliser. Crop Pasture Sci. 2015, 66, 23–31. [Google Scholar] [CrossRef]
  29. Von Tucher, S.; Hörndl, D.; Schmidhalter, U. Interaction of soil pH and phosphorus efficacy: Long-term effects of P fertilizer and lime applications on wheat, barley, and sugar beet. Ambio 2018, 47, 41–49. [Google Scholar] [CrossRef] [PubMed] [Green Version]
  30. Penn, C.J.; Rutter, E.B.; Arnall, D.B.; Camberato, J.; Williams, M.; Watkins, P. A discussion on mehlich-3 phosphorus extraction from the perspective of governing chemical reactions and phases: Impact of soil pH. Agriculture 2018, 8, 106. [Google Scholar] [CrossRef] [Green Version]
  31. Cabeza, R.; Steingrobe, B.; Römer, W.; Claassen, N. Effectiveness of recycled P products as P fertilizers, as evaluated in pot experiments. Nutr. Cycl. Agroecosyst. 2011, 91, 173–184. [Google Scholar] [CrossRef]
  32. Römer, W.; Steingrobe, B. Fertilizer Effect of Phosphorus Recycling Products. Sustainability 2018, 10, 1166. [Google Scholar] [CrossRef] [Green Version]
  33. Ehmann, A.; Bach, I.-M.; Laopeamthong, S.; Bilbao, J.; Lewandowski, I. Can Phosphate Salts Recovered from Manure Replace Conventional Phosphate Fertilizer? Agriculture 2017, 7, 1. [Google Scholar] [CrossRef] [Green Version]
  34. Bilbao, J.; Frank, D.; Hirth, T. Combined Recovery of Phosphorus, Potassium and Nitrogen from Aqueous Residual Material; International Classification, Cooperative Patent Classification C01B25/45; Fraunhofer GES zur Förderung der Angewandten Forschung EV: Munich, Germany, 2015. [Google Scholar]
  35. Schüller, H. Die CAL-Methode, eine neue Methode zur Bestimmung des pflanzenverfügbaren Phosphates in Böden. Z. Pflanzenernähr. Düngg. Bodenk. 1969, 123, 48–63. [Google Scholar] [CrossRef]
  36. VDLUFA Methode A 5.1.1. pH-Wert. In Handbuch der Landwirtschaftlichen Versuchs- und Untersuchungsmethodik (VDLUFA-Methodenbuch), Bd. I Die Untersuchung von Böden; VDLUFA: Darmstadt, Germany, 1991.
  37. VDLUFA Methode 2.1.1. Nasschemischer Aufschluss unter Druck. In Handbuch der Landwirtschaftlichen Versuchs- und Untersuchungsmethodik (VDLUFA-Methodenbuch), Bd. VII Umweltanalytik 4. Aufl.; VDLUFA: Darmstadt, Germany, 2011.
  38. Lenth, R.V. emmeans: Estimated Marginal Means, aka Least-Squares Means. R Package, Version 1.5.4. 2021. Available online: https://CRAN.R-project.org/package=emmeans(accessed on 16 May 2021).
  39. Hothorn, T.; Bretz, F.; Westfall, P. Simultaneous Inference in General Parametric Models. Biom. J. 2008, 50, 346–363. [Google Scholar] [CrossRef] [Green Version]
  40. Piepho, H.-P. An Algorithm for a Letter-Based Representation of All-Pairwise Comparisons. J. Comput. Graph. Stat. 2004, 13, 456–466. [Google Scholar] [CrossRef]
  41. European Soil Data Centre (ESDAC). Soil pH in Europe. Map: pH in Europe. 2010. Available online: https://esdac.jrc.ec.europa.eu/content/soil-ph-europe (accessed on 25 September 2021).
  42. Möller, K.; Oberson, A.; Bünemann, E.K.; Cooper, J.; Friedel, J.K.; Glaesner, N.; Hörtenhuber, S.; Loes, A.K.; Mäder, P.; Meyer, G.; et al. Improved phosphorus cycling in organic farming: Navigating between constraints. Adv. Agron. 2018, 147, 159–237. [Google Scholar]
  43. Nanzer, S.; Oberson, A.; Berger, L.; Berset, E.; Hermann, L.; Frossard, E. The plant availability of phosphorus from thermo-chemically treated sewage sludge ashes as studied by 33P labeling techniques. Plant Soil 2014, 377, 439–456. [Google Scholar] [CrossRef] [Green Version]
  44. Sheil, T.S.; Wall, D.P.; Culleton, N.; Murphy, J.; Grant, J.; Lalor, S.T.J. Long-term effects of phosphorus fertilizer on soil test phosphorus, phosphorus uptake and yield of perennial ryegrass. J. Agric. Sci. 2016, 154, 1068–1081. [Google Scholar] [CrossRef]
  45. Burkitt, L.L.; Donaghy, D.J.; Smethurst, P.J. Low rates of phosphorus fertilizer applied strategically throughout the growing season under rain-fed conditions did not affect dry matter production of perennial ryegrass (Lolium perenne L.). Crop Pasture Sci. 2010, 61, 353–362. [Google Scholar] [CrossRef]
  46. Karn, J.F. Phosphorus nutrition of grazing cattle: A review. Anim. Feed Sci. Technol. 2001, 89, 133–153. [Google Scholar] [CrossRef]
  47. Starnes, D.L.; Padmanabhan, P.; Sahi, S.V. Effect of P sources on growth, P accumulation and activities of phytase and acid phosphatases in two cultivars of annual ryegrass (Lolium multiflorum L.). Plant Physiol. Biochem. 2008, 46, 580–589. [Google Scholar] [CrossRef]
  48. Wortmann, C.S.; Dobermann, A.R.; Ferguson, R.B.; Hergert, G.W.; Shapiro, C.A.; Tarkalson, D.D.; Walters, D.T. High-yielding corn response to applied phosphorus, potassium, and sulfur in Nebraska. Agron. J. 2009, 101, 546–555. [Google Scholar] [CrossRef] [Green Version]
  49. Rashid, M.; Iqbal, M. Effect of phosphorus fertilizer on the yield and quality of maize (Zea mays L.) fodder on clay loam soil. J. Anim. Plant Sci. 2012, 22, 199–203. [Google Scholar]
  50. Curtin, D.; Syers, J.K. Lime-induced changes in indices of soil phosphate availability. Soil Sci. Soc. Am. J. 2001, 65, 147–152. [Google Scholar] [CrossRef]
  51. Hinsinger, P. Bioavailability of soil inorganic P in the rhizosphere as affected by root-induced chemical changes: A review. Plant Soil 2001, 237, 173–195. [Google Scholar] [CrossRef]
Figure 1. Experimental setup of the greenhouse pot experiment with maize followed by ryegrass. Fertilizer fractions tested were P-Salt, SF(W); SF(S), and two combinations of them, compared to unfertilized control and triple superphosphate (TSP). Maize plants were cultivated for 50 days in a silty sandy loam and clay loam soil. After maize harvest, ryegrass seeds were cultivated for 84 days with two ryegrass cuttings 56 and 84 days after sowing. DM: dry matter; FM: fresh matter; Ca: calcium, Mg: magnesium; K: potassium; N: nitrogen; Fe: iron; WHC: water holding capacity.
Agriculture 12 00325 g001
Figure 2. Mean shoot dry matter yield (DM yield) after 50 days in g plant−1 and mean shoot P concentration of maize in mg DM plant−1 after soil treatment with different recycled fertilizers in a total dose equivalent to 150 mg P (kg soil)−1; fractions tested: P-enriched precipitate from the liquid fraction (P-Salt), air-dried solid fraction (SF(W)), steam-dried solid fraction (SF(S)), and two different combinations of them, compared to unfertilized control and triple superphosphate (TSP). Based on the total fertilizer dose corresponding to 150 mg P (kg soil)−1, designation (1:1) means that fertilizers were applied with a mass portion of SF (W or S) containing 75 mg P (kg soil)−1 + a mass portion of P-Salt containing 75 mg P (kg soil)−1. “Calculated DM yields from single components” represent a mathematical calculation of the combinations based on the results of the real DM yield of the single components (P-Salt, SF(W), SF(S)) to indicate possible additive or synergistic effects (see Materials and Methods: Evaluation of Synergistic Effects, equation). Data are means of four replicates each. Different letters denote significant differences (two factorial Tukey test with p ≤ 0.05), and significant differences between the soils are indicated by an asterisk (*).
Agriculture 12 00325 g002
Figure 3. Total phosphorus content (P content) after 50 days in mg plant−1 of maize after soil treatment with different recycled fertilizers in a total dose equivalent to 150 mg P (kg soil)−1; fractions tested: P-Salt, SF(W), (SF(S), and two different combinations of them compared to unfertilized control and TSP. Based on the total fertilizer dose corresponding to 150 mg P (kg soil)−1, designation (1:1) means that fertilizers were applied with a mass portion of SF (W or S) containing 75 mg P (kg soil)−1 plus a mass portion of P-Salt containing 75 mg P (kg soil)−1. “Calculated P-content from single components” represent a mathematical calculation of the combinations based on the results of the real P contents of the single components (P-Salt, SF(W), SF(S)) to indicate possible additive or synergistic effects (see Material And Methods: Evaluation of Synergistic Effects, equation). Data are means of four replicates each. Different letters denote significant differences (two factorial Tukey test with p ≤ 0.05), and significant differences between the soils are indicated by an asterisk (*).
Agriculture 12 00325 g003aAgriculture 12 00325 g003b
Figure 4. Total dry matter yield of ryegrass (DM yield) after 84 days in g pot−1, separated into first and second harvest, and ryegrass P concentration in mg P/g DM after soil treatment with different recycled digestate fertilizers in a total dose equivalent of 150 mg P (kg soil)−1; fractions tested: P-Salt, SF(W), SF(S), and two different combinations of them, compared to unfertilized control and TSP. Based on the total fertilizer dose corresponding to 150 mg P (kg soil)−1, designation (1:1) means that fertilizers were applied with a mass portion of SF (W or S) containing 75 mg P (kg soil)−1 + a mass portion of P-Salt containing 75 mg P (kg soil)−1. Data are means of four replicates each. Different letters denote significant differences (two factorial Tukey test with p ≤ 0.05), and significant differences between the soils are indicated by an asterisk (*).
Agriculture 12 00325 g004
Figure 5. Total phosphorus content (P content) after 84 days in mg P/pot of ryegrass, initially treated with different recycled fertilizers in a total dose equivalent to 150 mg P (kg soil)−1 followed by maize cultivation (50 days) and harvest; fractions tested: P-Salt, SF(W), SF(S), and two different combinations of them, compared to unfertilized control and TSP. Based on the total fertilizer dose corresponding to 150 mg P (kg soil)−1, designation (1:1) means that fertilizers were applied with a mass portion of SF (W or S) containing 75 mg P (kg soil)−1 + a mass portion of P-Salt containing 75 mg P (kg soil)−1. Ryegrass plants were cultivated for 84 days, with a first harvest cut after 56 days, and a second cut after 84 days. Data are means of four replicates each. Different letters denote significant differences (two factorial Tukey-test with p ≤ 0.05), and significant differences between the soils are indicated by an asterisk (*).
Agriculture 12 00325 g005
Table 1. Experimental setup of the greenhouse pot experiment with maize and ryegrass.
Start CropMaize (Zea mays L., var. Carolinio) 3 seeds per pot; after germination, reduction to 1 seedling per pot
SoilSilty sandy loam:
Texture sSL; pH (CaCl2) 5.5; nutrient status for P, K, Mg (all CAL) in mg/kg soil: 15, 100, 32
Clay loam:
Texture tL; pH (CaCl2) 7.4; nutrient status for P, K, Mg (all CAL) in mg/kg soil): 26, 150, 580
Additional mineral fertilization per pot (excluding P)200 (mg N (kg soil)−1) as NH4NO3, 200 (mg K (kg soil)−1) as K2SO4, 100 (mg Mg (kg soil)−1) as MgSO4 * 7H2O and 10 (mg Fe (kg soil)−1) Fe-Sequestren (6 %).
4 weeks after sowing: 200 (mg N (kg soil)−1) as NH4NO3
Experimental Duration Total: 50 days (Time schedule, Figure 1: 0–50 days)
ConditionsAmbient greenhouse conditions (University of Hohenheim, Germany, June 2017); ca. 16 h light, 8 h dark, ca. 20 °C, watering to 70% WHC with DI water (weight control every 2–3 days)
P fertilizer treatments:
Recycled P fertilizersAll mg below refer to P equivalents per 1 kg dry soil
P-Salt
SF(W)
SF(S)
150 mg
150 mg
150 mg
SF(W) + P-Salt (1:1) dryDry mixed (“dry”): 75 mg SF(W) mixed into the soil, directly followed by + 75 mg P-Salt mixed into the soil
SF(S) + P-Salt (1:1) dryDry mixed (“dry”): 75 mg SF(S) mixed into the soil, directly followed by + 75 mg P-Salt mixed into the soil
Control treatments:
Triple superphosphate (TSP)
Negative control

Positive Reference; 150 mg
DI water
Ryegrass cultivation in the remaining pots (same soils and treatments, same greenhouse conditions):
Following crop Perennial ryegrass (Lolium perenne L., cv. Arvicola) 5 g seeds per pot
Experimental Duration84 days from seeding to harvest (Time schedule, Figure 1: 50–134 days)
Harvest (grass cuts)First cut: 56 days after sowing
Second cut: 84 days after sowing
FertilizationNo additional mineral or recycled P fertilization
IrrigationWatering to 70% WHC with DI water (weight control every 2–3 days)
The pots were set up in a randomized complete block design on tables in the same greenhouse, using four replicates per treatment, resulting in a total number of 56 pots, 28 for each soil type.
Table 2. CAL-extractable P (CAL-P) in soil.
P SourcesCAL-P
after Ryegrass Harvest
CAL-P
after Ryegrass Harvest
Silty Sandy Loam Soil
[mg kg−1]
Clay Loam Soil
[mg kg−1]
Control19 D19 C
TSP42 C38 AB
P-Salt81 A44 AB *
SF(W)50 BC44 AB
SF(S)43 C33 B *
SF(W) + P-Salt (1:1) dry61 B43 AB *
SF(S) + P-Salt (1:1) dry67 AB48 A *
Plant available P (CAL-P) in mg (kg soil)−1 after soil treatment with different recycled fertilizers in a total dose equivalent to 150 mg P (kg soil)−1, maize cultivation for 50 days followed by ryegrass cultivation for 84 days; fractions tested: P-Salt, SF(W), SF(S), and two different combinations of them, compared to unfertilized control and TSP. Based on the total fertilizer dose corresponding to 150 mg P (kg soil)−1, designation (1:1) means that fertilizers were applied with a mass portion of SF (W or S) containing 75 mg P (kg soil)−1 + a mass portion of P-Salt containing 75 mg P (kg soil)−1. Data are means of four replicates each. Different letters denote significant differences (two factorial Tukey-test with p ≤ 0.05), and significant differences between the soils are indicated by an asterisk (*).
Publisher’s Note: MDPI stays neutral with regard to jurisdictional claims in published maps and institutional affiliations.