Article

Effects of Intercropping, Nitrogen Fertilization and Corn Plant Density on Yield, Crude Protein Accumulation and Ensiling Characteristics of Silage Corn Interseeded into Alfalfa Stand

1
College of Grassland Science and Technology, China Agricultural University, Beijing 100193, China
2
Key Laboratory of Grassland Management and Utilization, Ministry of Agriculture and Rural Affairs, Beijing 100193, China
3
Dryland Farming Institute, Hebei Academy of Agricultural and Forestry Sciences, Hengshui 053000, China
4
Key Laboratory of Crop Drought Resistance of Hebei Province, Hengshui 053000, China
*
Author to whom correspondence should be addressed.
Agriculture 2022, 12(3), 357; https://doi.org/10.3390/agriculture12030357
Submission received: 27 January 2022 / Revised: 25 February 2022 / Accepted: 28 February 2022 / Published: 2 March 2022
(This article belongs to the Section Crop Production)

Abstract

:
Interseeding silage corn into an alfalfa stand following its spring harvests to produce mixed silage would feasibly break the restriction of alfalfa production during a hot-rainy summer. In this 2-yr experiment, the alfalfa–silage corn intercropping system (AC) with nitrogen (N) fertilization rates of 0, 60, 120, and 180 kg N ha−1 and corn plant densities of 30,000, 45,000, and 60,000 plants ha−1 was compared with the monocultured corn (CK) managed using the local farmers’ practice. Intercropping with alfalfa significantly decreased the dry matter (DM) yield of the corn by 31.5% on average, while increasing the N application rate and corn plant density promoted DM yield and crude protein (CP) accumulation of the intercropped corn, and the intercropping system could achieve the same CP yield as CK—it did in most cases. Although the DM contents, pH values, and NH3-N concentrations were decreased in the mixed silage, its fermentation quality was not reduced and the CP, water soluble carbohydrates, and lactic acid contents were dramatically increased by 16.3%, 17.8%, and 72.9% compared with those of CK, respectively. For the opposite effects of N fertilization and corn density on silage quality, the treatment combination with a medium corn density (45,000 plants ha−1) fertilized at a medium N rate (120 kg N ha−1) was evaluated as the optimum for more balanced system productivity, silage nutritive values and fermentative characteristics during the coexisting period.

1. Introduction

Silage corn (Zea mays L.) is the most essential feedstuff for ruminant livestock, but continuous corn production increases the environmental risks such as nitrogen (N) losses and soil degradation [1,2]. Thus, a wide variety of cover crops or living mulches are developed as companion crops with corn, and the cover crops could also be harvested as forage to boost the system productivity and enhance forage quality [2,3].
Alfalfa (Medicago sativa L.), a kind of high-quality legume forage, is not only commonly fed to dairy cattle, but also served as a popular cover crop [4,5]. However, the climate of high temperature and heavy precipitation during summer may lead to alfalfa yield loss and quality reduction. Previous studies showed that the alfalfa yield during summer only accounts for less than 40% of the total annual yield in the North China Plain (NCP), which has a typical temperate monsoon climate with hot-rainy summers [6,7,8]. The concentrated rainfall and subsequent muddy soils would also exacerbate the risks and costs of alfalfa harvesting and processing by machinery.
Corn and alfalfa are often planted in rotation or intercropping and fed together to maximize performance for the complementary agronomic and nutritional characteristics [9,10,11]. For the reason that alfalfa has a low fermentable carbohydrate content and high buffering capacity, it is difficult to be ensiled alone and ensiling corn with alfalfa has been suggested to be a good strategy to improve fermentation quality [12,13].
According to the environmental and production requirements of regions such as the NCP, we proposed an intercropping system of alfalfa and silage corn in which (i) alfalfa is harvested as hay in spring, (ii) interseeding silage corn into the alfalfa stand while alfalfa serves as ground cover during summer, (iii) a mixture of corn and alfalfa is harvested in the autumn for use as silage [7]. Previous papers published from the study of this new system reported the system productivity, influences of interspecific competition and the benefits achieved from the agronomic, environmental and economic points of view [14,15]. It has been shown that the alfalfa–silage corn intercropping system was advantageous in promoting the overall forage production, and the alfalfa production during spring was not affected. Furthermore, we want to evaluate the system performances during summer, especially for the influences of intercropping on the silage quality.
Many studies focused on the influences of an appropriate legume–grass ratio in the silage mixtures on the silage quality [13,16], and they showed that the alfalfa–silage corn mixtures improve silage crude protein (CP) content and in vitro digestibility which leads to higher feed intakes and milk production compared with corn silage alone [17,18,19]. However, the effects of ground cover companions and the field managements on silage mixtures are seldomly mentioned. Previous studies have shown that perennial ground covers can lead to a yield reduction of 10–23% in silage corn [10,20], while the appropriate N application improves corn yield and its CP concentration, especially in intercropping with the strong competitor alfalfa [2,14,21]. Increasing corn plant density has a positive effect on the silage yield of corn but negatively affects the alfalfa stands, which is shade-intolerant, for the limiting of light transmittance [22,23]. Therefore, the N application rate and corn plant density have further effects on the alfalfa and silage corn ratio, nutritive values, and fermentation characteristics of the mixed silage.
The winter wheat (Triticum aestivum L.) and summer corn rotation bas been the most popular cropping system in the NCP since the 1970s [24]. In this study, to better evaluate the advantages of the alfalfa–silage corn intercropping system in production performances during summer, the monoculture silage corn managed according to local farmers’ practices, which could represent the local production levels, was set as a control. A 2-yr experiment was conducted to examine the effects of intercropping, the N rate and corn plant density on the yield and N accumulation of both alfalfa and corn, as well as on the fermentation quality and chemical composition of the corresponding silage mixture products. We hypothesized that: (i) intercropping would decrease system yield while increasing the crude protein yield, (ii) N application would improve the yield and CP content of the intercropped corn but decrease the alfalfa yield, and it would improve CP content of the mixed silage, and (iii) a high corn plant density had a significant negative effect on alfalfa growth as well as silage quality. The objectives of this study were to identify whether the improvement of silage quality could compensate for the yield loss of silage maize in intercropping compared with local farmers’ practices and to explore the appropriate field management methods to improve system yield, nutritive value, and ensilability.

2. Materials and Methods

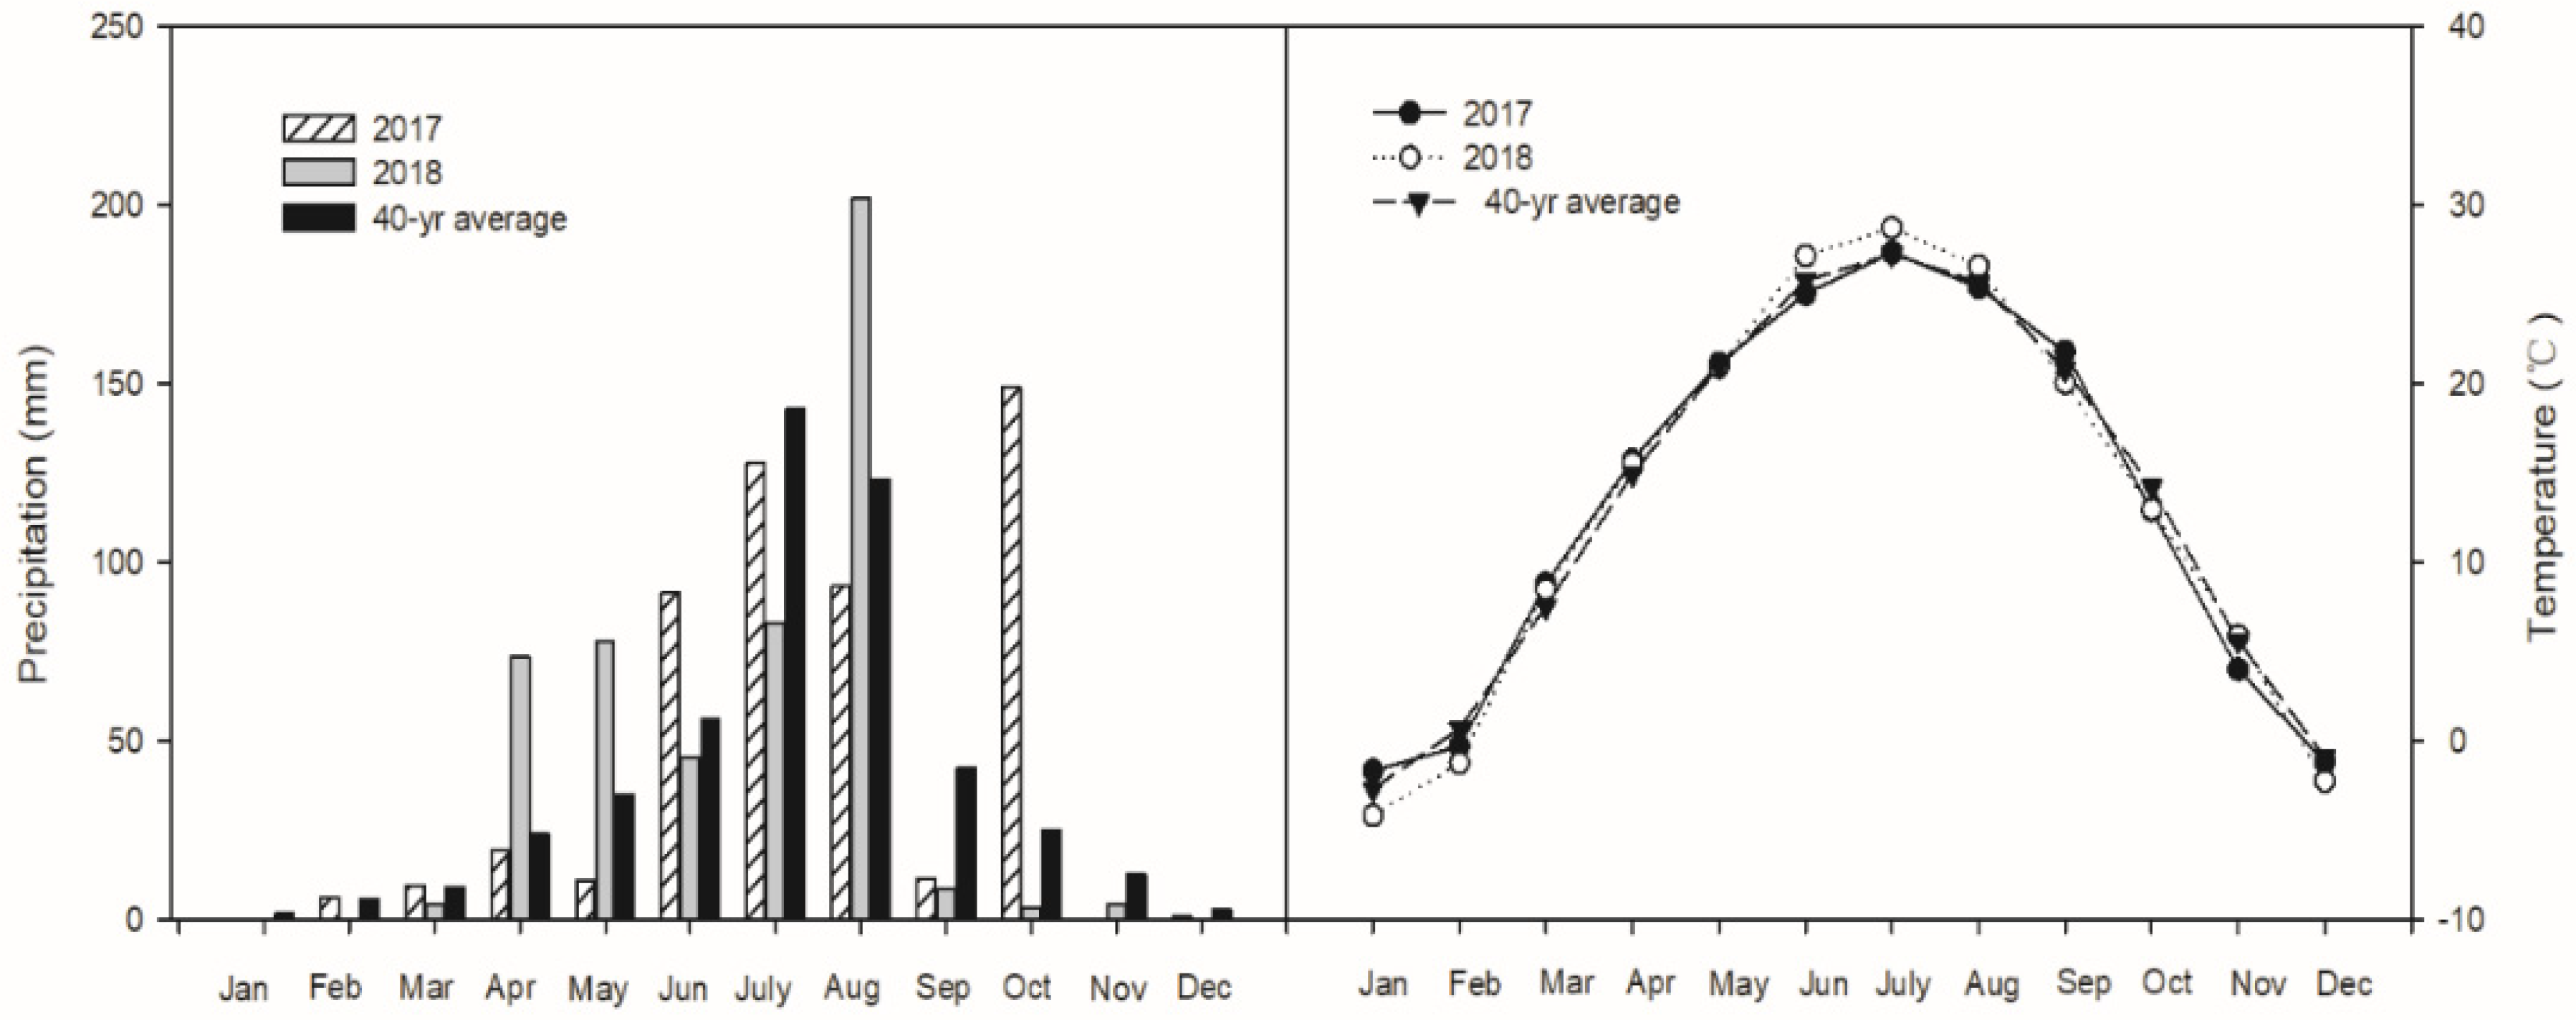
2.1. Study Site, Field Experimental Design and Management Practices

The field experiment was carried out in 2017 and 2018 at the Dryland Farming and Water-saving Station of Hebei Academy of Agricultural and Forestry Sciences in Hengshui (Hebei, China: latitude 37°44′ N, longitude 115°42′ E, elevation 20 m above sea level). The study area has a warm-temperate sub-humid continental monsoon climate with an annual mean temperature of 13.3 °C and annual precipitation of 487 mm from 1980–2019, with 76% falling in June–September. The monthly precipitation totals and mean air temperature during experimental years (2017–2018) and the 40-yr average (1980–2019) are shown in Figure 1. Cumulative precipitation during silage corn growing season from June through September totaled 324 mm in 2017 and 339 mm in 2018, which were generally below 40-yr normal (365 mm). The 2017 season was the wetter year with a total rainfall amount of 521 mm, and there was a considerable amount of rainfall in October (149 mm) after corn harvesting. The precipitation in 2018 (502 mm) was more concentrated in growing seasons from March through August, with a pronounced peak (202 mm) in August. Mean monthly air temperature of the corn growing period from July through September was 0.3 °C and 0.5 °C higher than the 40-yr average in 2017 and 2018, respectively. The soil was a silt loam with pH of 7.75, organic matter of 14.4 g kg−1, alkali–hydrolyzable N of 74.0 mg kg−1, soil available phosphorus of 19.4 mg kg−1, soil available potassium of 202.1 mg kg−1 within the top 20-cm soil. The soil of the study site was relatively rich in nutrients and it can represent the local level of medium and high yield fields. The preceding crop was sorghum-sudangrass grown with an annual N application rate of 250 kg N ha−1 from 2012–2016.
The field experiment was established in March 2017. Alfalfa–silage corn intercropping system (AC) with four N application rates (whole-plot factor) and three corn plant densities (sub-plot factor) were assigned according to split-plot design with three replications. Monocultured corn (CK) managed according to local farmers’ practices was included in one whole plot per replicate as a control. The subplot size was 40 m2 (5 m × 8 m) with 1.5 m walkways to separate subplots.
For the alfalfa–silage corn intercropping system, a local variety of alfalfa “Zhongmu number 1” mixed with rhizobia was sown with a drill on March 16, 2017 in the seeding rate of 22.5 kg ha−1. An alternating row spacing of 20–40–20–40 cm was employed. After the alfalfa harvest in mid-June, a summer dual-purpose corn hybrid (Zhengdan 958) was drilled into the 40 cm wide gap between alfalfa rows at plant densities of 30,000 (D30), 45,000 (D45), 60,000 (D60) plants per hectare. Urea (46% N) was broadcasted by hand after corn sowing at 0 (N0), 60 (N60), 120 (N120), and 180 (N180) kg N ha−1. To eliminate phosphorus and potassium limitation, all plots of AC received 100 kg P2O5 ha−1 as granular superphosphate and 100 kg K2O ha−1 as potassium sulfate before alfalfa seeding in 2017 by broadcasting and after corn seeding in 2018 by side dressing.
Corn monoculture control was managed using the local farmers’ current management practices and rotated with winter wheat. The variety “Zhengdan 958” was planted on the same day as corn seeding in AC with a plant density of 75,000 plants ha−1. The row spacing was also 60 cm. A total of 112 kg N ha−1, 112 kg P2O5 ha−1 and 112 kg K2O ha−1 was broadcasted by hand as NPK compound fertilizer (15:15:15) after corn sowing.
Silage corn was harvested between 1 October to 5 October each year with a stubble of 10 cm. The alfalfa in AC was harvested once in 2017 (22 June) and twice in 2018 (3 May, 13 June) during the spring season, it was not utilized during summer and the remaining alfalfa was harvested together with corn and used as mixed silage. Alfalfa and corn were harvested manually and separately in the central area of 18 m2 (3 × 6 m) in each subplot to determine the fresh matter (FM) yield of each crop. A homogenized subsample of 500 g of alfalfa and five randomly selected corn plants were chopped and oven-dried at 65 °C for 48 h to determine dry matter (DM) yield. Whole-plant N content of each crop was measured by Dumas combustion method on an Elemental Vario Cube elemental analyzer (Elementar Analysensysteme GmbH, Langenselbold, Germany) and crude protein (CP) content was calculated by multiplying 6.25 with the N content according to the AOAC [25]. CP yield was determined by the DM yield of the crops multiplied by CP concentration. The total system yield or CP yield of the AC was defined as the sum of the yield or CP yield of alfalfa during the co-existing period and corn silage yield or CP yield.

2.2. Silage Preparation and Sampling

On the same day of harvesting, ten randomly selected whole-plant corn and 1.0 kg of alfalfa from each subplot were chopped into 1–2 cm pieces and mixed separately within the same treatment combination. Then, calculating alfalfa to corn FM yield ratio of each treatment combination (Table 1), we fully mixed two crops based on the ratio and ensiled immediately. The corn material of the corn monoculture control was ensiled as 100% corn silage control. We packed 3.75 kg of the forage mixture individually into a 5.0 L polyethylene bucket (17 cm in diameter, 28 cm in height and about 300 g per one) using a cylindrical rod and an axe, and the bucket full of forage mixture was tightened with a lid and finally covered with three layers of Scotch tape to prevent the exchange of gas between the inside and outside of the bucket. Three silos for each treatment combination were ensiled at a density of about 750 kg of FM per m3 with 39 silos in all at room temperature (20–25 °C) for 180 days each year.

2.3. Chemical Analyses

At silo opening, the topmost moldy or spoiled part (about 100 g) of silages was discarded, with the remaining mass mixed thoroughly. Twenty grams of each fresh silage sample was homogenized in a blender with 180 mL of distilled water for 2 min, and then filtered through four layers of cheesecloth and one layer of qualitative filter paper. Afterward, pH value was measured immediately using an electrode pH meter (PHS-3C, INESA, Shanghai, China). Then the filtrate was centrifuged at 20,000 g for 10 min and reserved for fermentation acids and ammoniacal nitrogen (NH3-N) analyses. Lactic acid (LA), acetic acid (AA), propionic acid (PA) and butyric acid (BA) were determined by high performance liquid chromatography (HPLC) (LC-20A; Shimadzu, Tokyo, Japan). The analytical conditions were as follows: column, Shodex RSpak KC-811S-DVB gel C (8.0 mm × 30 cm, Shimadzu); oven temperature, 50 °C; mobile phase, 3 mmol L−1 HClO4; flow rate, 1.0 mL min−1; injection volume 5 μL; detector, SPD-M20AVP (Shimadzu). The NH3-N concentration was determined by the phenol-hypochlorite colorimetric method according to Broderick and Kang [26]. V-score was calculated by the proportion of NH3-N in the total nitrogen and fermentation acid contents in the silage (percent of fresh weight) to assess the fermentation quality (Liu et al., 2016). According to V-score, fermentation quality of silage was defined in 3 levels: great (V-score ≥ 80), acceptable (60 ≤ V-score < 80), poor (V-score < 60).
Subsamples of about 200 g from silage and mixed raw materials before ensiling were dried at 65 °C for 48 h to determine DM content. CP was determined as described above. Concentrations of neutral detergent fiber (NDF) and acid detergent fiber (ADF) were determined sequentially according to the procedures of Van Soest et al. [27]. Relative feed value (RFV) was calculated by reference to a standard digestible DM intake that has been adopted to standardize a full-bloom legume forage containing 53% NDF and 41% ADF for an RFV of 100 [28]. Water soluble carbohydrates (WSC) were determined using the anthrone method [29].

2.4. Multicriteria Assessment

To compare the overall performance of different treatment combinations in AC, the representative criteria of system productivity and silage quality performances were transformed to 0–10 scale using minimum average values (Min) and maximum average values (Max) of each indicator, with 0 being the worst performance and 10 the best performance [30,31]. Two-year total system DM yield, two-year total system CP yield, and two-year average DM content, two-year average CP content, two-year average LA and two-year average WSC of silage were calculated by the following formula:
Scale = 10 × (Value − Min)/(Max − Min)
Two-year average pH of silage was calculated by the following formula:
Scale = 10 − [10 × (Value − Min)/(Max − Min)]

2.5. Data Analysis

Approaches described by Piepho et al. [32] were used to analyze the effect of intercropping, N application rate and corn plant density using linear mixed model. The data of agronomic characteristics (DM and FM yield, CP content, CP yield) were analyzed based on split-plot experimental design while the data of nutritive and fermentation characteristics of raw materials or silage were analyzed based on a completely randomized design. Alfalfa–silage corn intercropping vs. silage corn monoculture control (AC vs. CK), N rate (NR) and corn plant density (PD) were treated as fixed effects. Block and its interaction with the whole-plot factor (N rate, only in the split-plot experimental design) were considered as random effects. The nesting of the two-way structure within the grouping of treatments vs. control can be expressed as below:
AC. vs. CK + AC. vs. CK·NR + AC. vs. CK·PD + AC. vs. CK·NR·PD
Data for each year were analyzed separately. If the analysis of variance showed significant treatment or interaction effects, Tukey’s Honestly Significant Difference (HSD) test was used for multiple comparisons. Residuals were visually checked for normality and equal variance. Significance level was set at p < 0.05. Analyses were performed in SPSS (version19.0, IBM SPSS Software Inc., Armonk, NY, USA).

3. Results

3.1. Subsection

Forage Fresh Matter Yield and Alfalfa to Corn Ratio

The effects of the N rate, corn plant density and their interaction in the alfalfa FM yield, silage corn FM yield and their ratio in the mixed silage in two experimental years are presented in Table 1. In the AC system, the alfalfa FM yield reduced as the corn plant density increased (p < 0.001), especially under a low N rate (N0) and high N rate (N120 and N180). Both the increasing N rate and corn plant density pronouncedly improved the corn FM yield (p < 0.05), and the corn FM yield was lower in 2018 than that in 2017 for the relatively long growing period. Thus, the alfalfa proportion on an FM basis in mixed silage, which negatively responded to the N rate and plant density treatment (p < 0.05), ranged from 3% to 25% with a mean of 9% in 2017 and 11% in 2018.

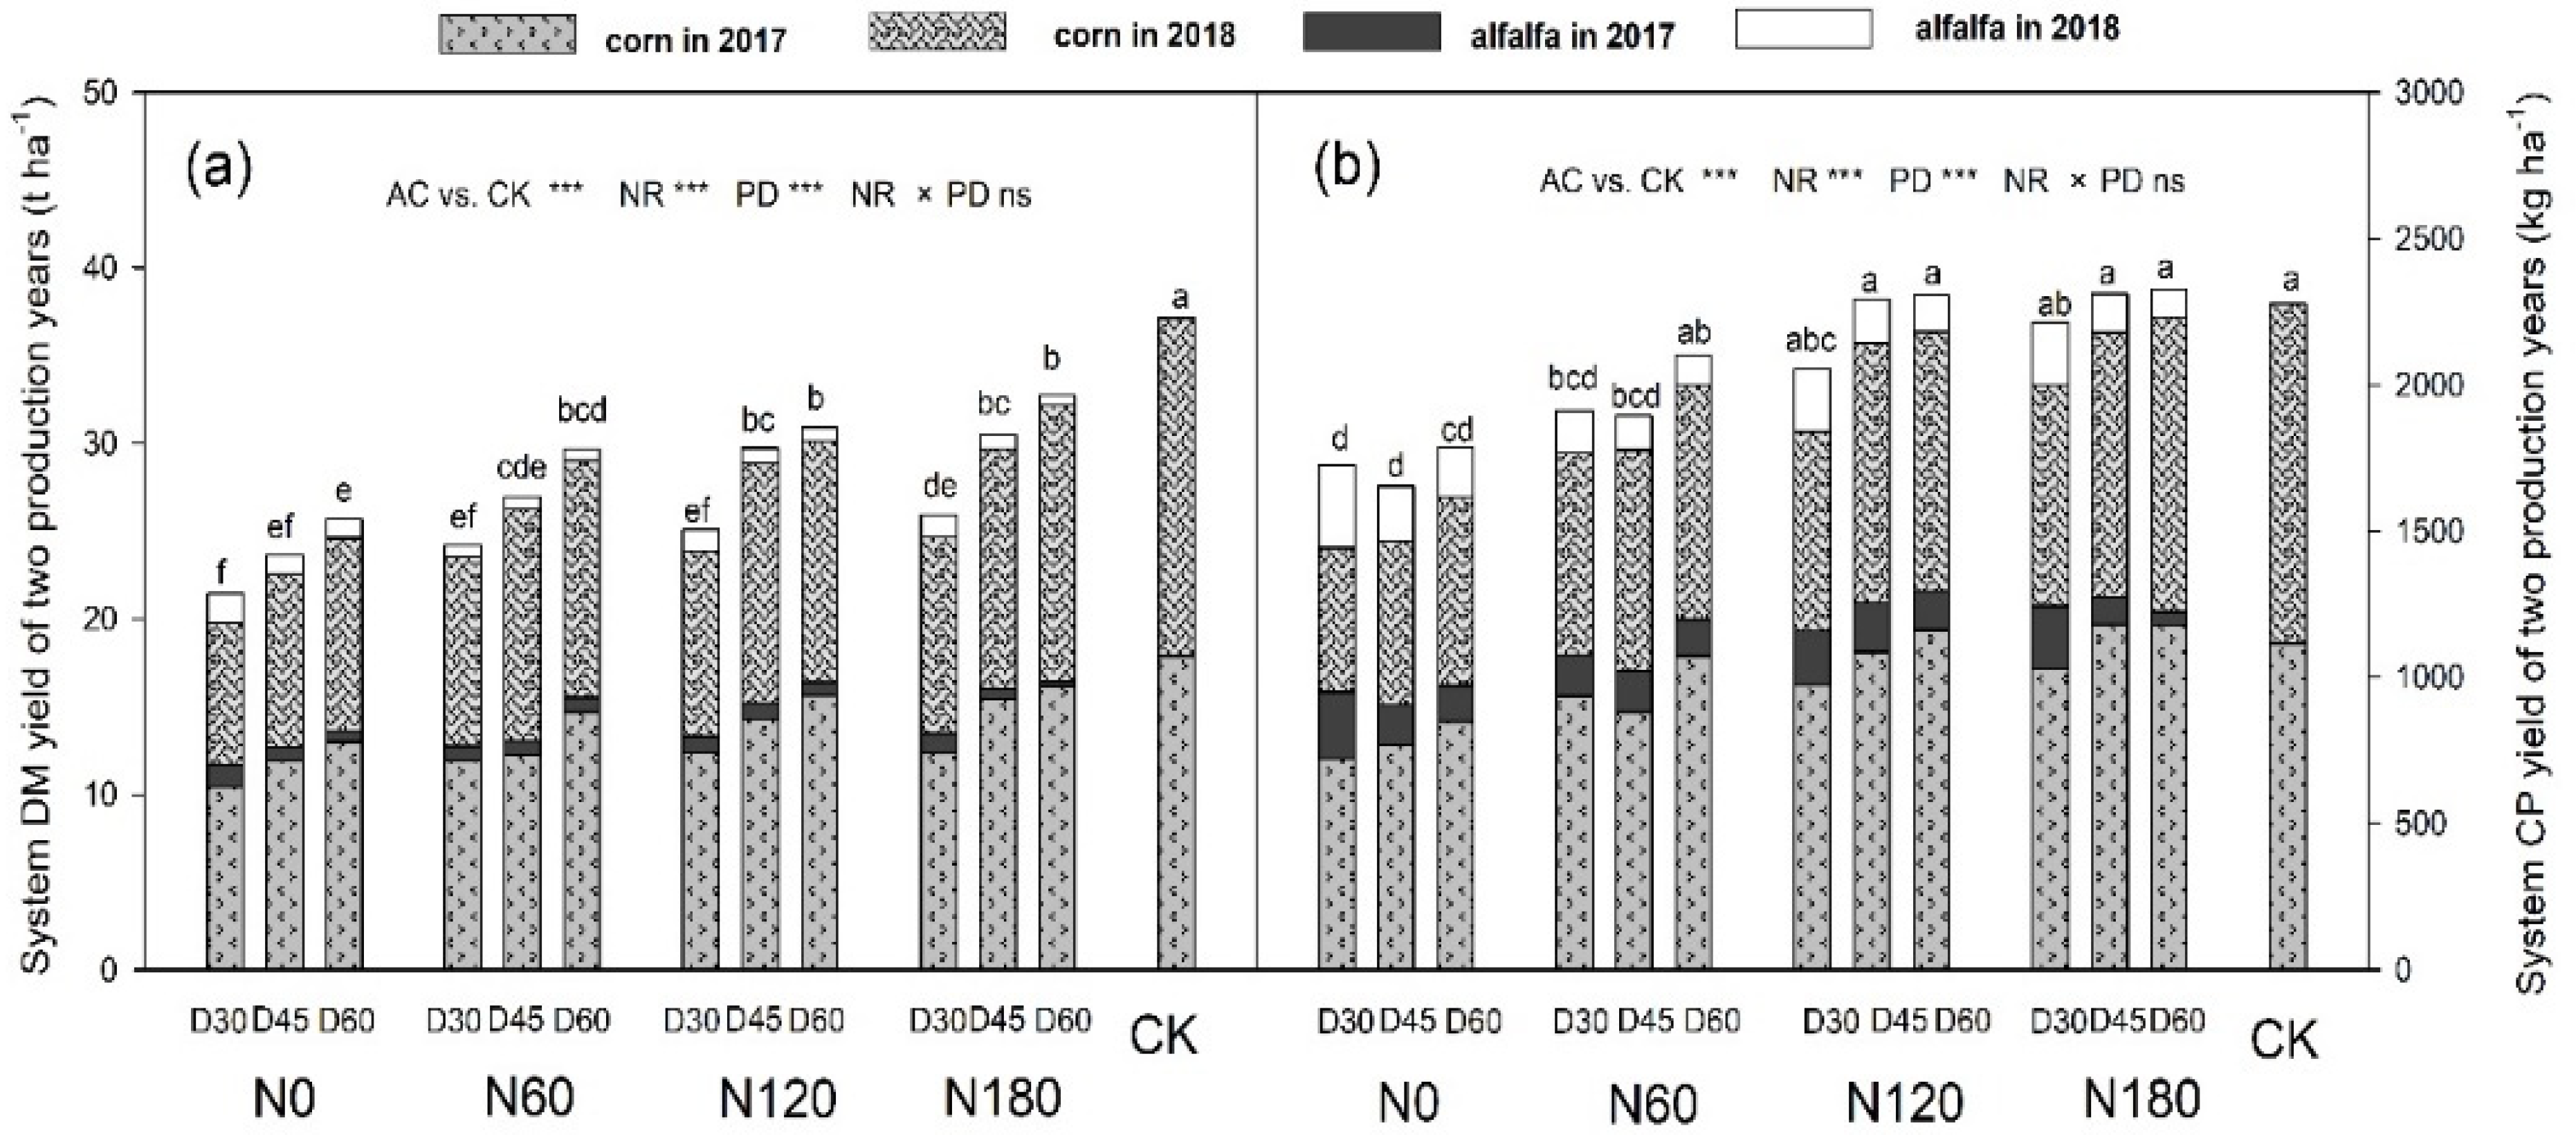
3.2. Forage Dry Matter Yield and Crude Protein Yield

The DM yield of alfalfa was very low during this co-existing period and only 0.82 and 0.95 t ha−1 were harvested in 2017 and 2018, averaged across all treatment combinations, respectively. The DM yield of alfalfa was affected by the N rate, corn plant density, and their interaction in 2017 (p < 0.001), but only by the corn plant density in 2018 (p = 0.001; Table 2). Corn plant density was the main factor that decreased the alfalfa DM yield by an average of 28.5% under D45 and 42.1% under D60 compared with that under D30. Intercropping, the N rate and corn plant density dramatically affected the corn DM yield (p < 0.01; Table 2). The DM yield of intercropped corn was pronouncedly decreased by up to 32.3% compared with that of monocultured CK during two experimental years (p < 0.001; Table 2). Although the increasing N rate and corn plant density significantly improved the DM yield of intercropped corn (p ≤ 0.001), the total system DM yield of AC during summer was still 14.0%–50.3% lower than that of CK (p < 0.001; Figure 2).
However, the total system CP yield of AC was dramatically improved for the mixture of alfalfa (p < 0.001; Table 2). Seven treatment combinations, especially under a high N rate and high corn density, achieved the same total system CP yield as CK did during the co-existing period across two experimental years (p > 0.05; Figure 2). Intercropping significantly improved the CP content of corn in 2017 and the increasing N rate had a positive effect on the CP content of intercropped corn in both 2017 and 2018 (p < 0.05). Despite that the corn CP content had a decreasing trend as plant density increased, the corn CP yield in AC was dramatically improved by both the increasing N rate and plant density (p < 0.05; Table 2). The CP content of alfalfa was less affected by the treatments and its CP yield was decreased as the corn plant density increased in both years (p < 0.001; Table 2).

3.3. Characteristics of Silage Chemical and Fermentation Characteristics

Compared with CK, the corn–alfalfa silage mixture had an 11.3% and 11.1% lower DM content in 2017 and 2018, respectively (p < 0.001; Table 3). On the contrary, the CP content of AC was significantly increased by 17.0% and 15.4% in 2017 and 2018, respectively (p < 0.001; Table 3). The effect of the N rate × corn density interaction was significant on DM and CP in both years, and the differences of DM among treatments within AC were relatively small while the increasing corn density could dramatically decrease silage CP content by 5.4–18.4% (p < 0.001; Table 3). Few differences were found in the values of NDF, ADF and RFV between AC and CK, the main effect of the N rate was significant while the differences among different N rates were relatively small (Table 3). The WSC of AC was 84.6% and 51.9% higher than that of CK in 2017 and 2018, respectively (p < 0.01), the increasing N rate could improve the WSC content in both years and the N rate × corn density interaction was significant in 2017 (p = 0.041; Table 3). The chemical compositions of raw materials before silage are presented in Table S1 and the treatment effects on nutritive values of raw materials were similar to those of silage (Table 3).
The pH value of AC was significantly higher than that of CK only in 2018 and the effect of the N rate × corn density interaction was significant in both 2017 and 2018 (p < 0.01). However, all the treatments had a pH value lower than 3.90 and the differences among treatments were relatively small (Table 4). The difference in the NH3-N concentration between AC and CK was not significant in both years (p > 0.05). Only the N rate had a significant positive effect on NH3-N, especially under the highest N rate (N 180), which was 36.1% and 33.2% higher than that under N0 in 2017 and 2018, respectively (p < 0.05; Table 4). The lactic acid concentration of AC was 8.5% and 38.8% higher than that of CK in 2017 and 2018, respectively, but the difference was significant only in 2018 (p = 0.001). All effects of N, corn density and their interaction on LA were significant in 2017 (p < 0.05) but not in 2018 (p > 0.05), and the LA was much lower in 2018 (Table 4). Except that the AA concentration of AC was dramatically increased by 60.6% in 2018 (p < 0.05; Table 4), few treatment effects were found on AA. All treatment effects on PA were significant in 2017 (p < 0.05; Table 4). AC pronouncedly lowered PA content by 41.9% compared with CK, and the increasing N rate and corn density could decrease PA concentration. PA was detected in only a few treatments in 2018 and the treatment effects were not pronounced. BA levels were very low and it was not detected in most cases (Table 4). All the treatments achieved a great level of silage fermentation quality with an average V-score of 99.25 and 99.03 in 2017 and 2018, respectively (Table 4).

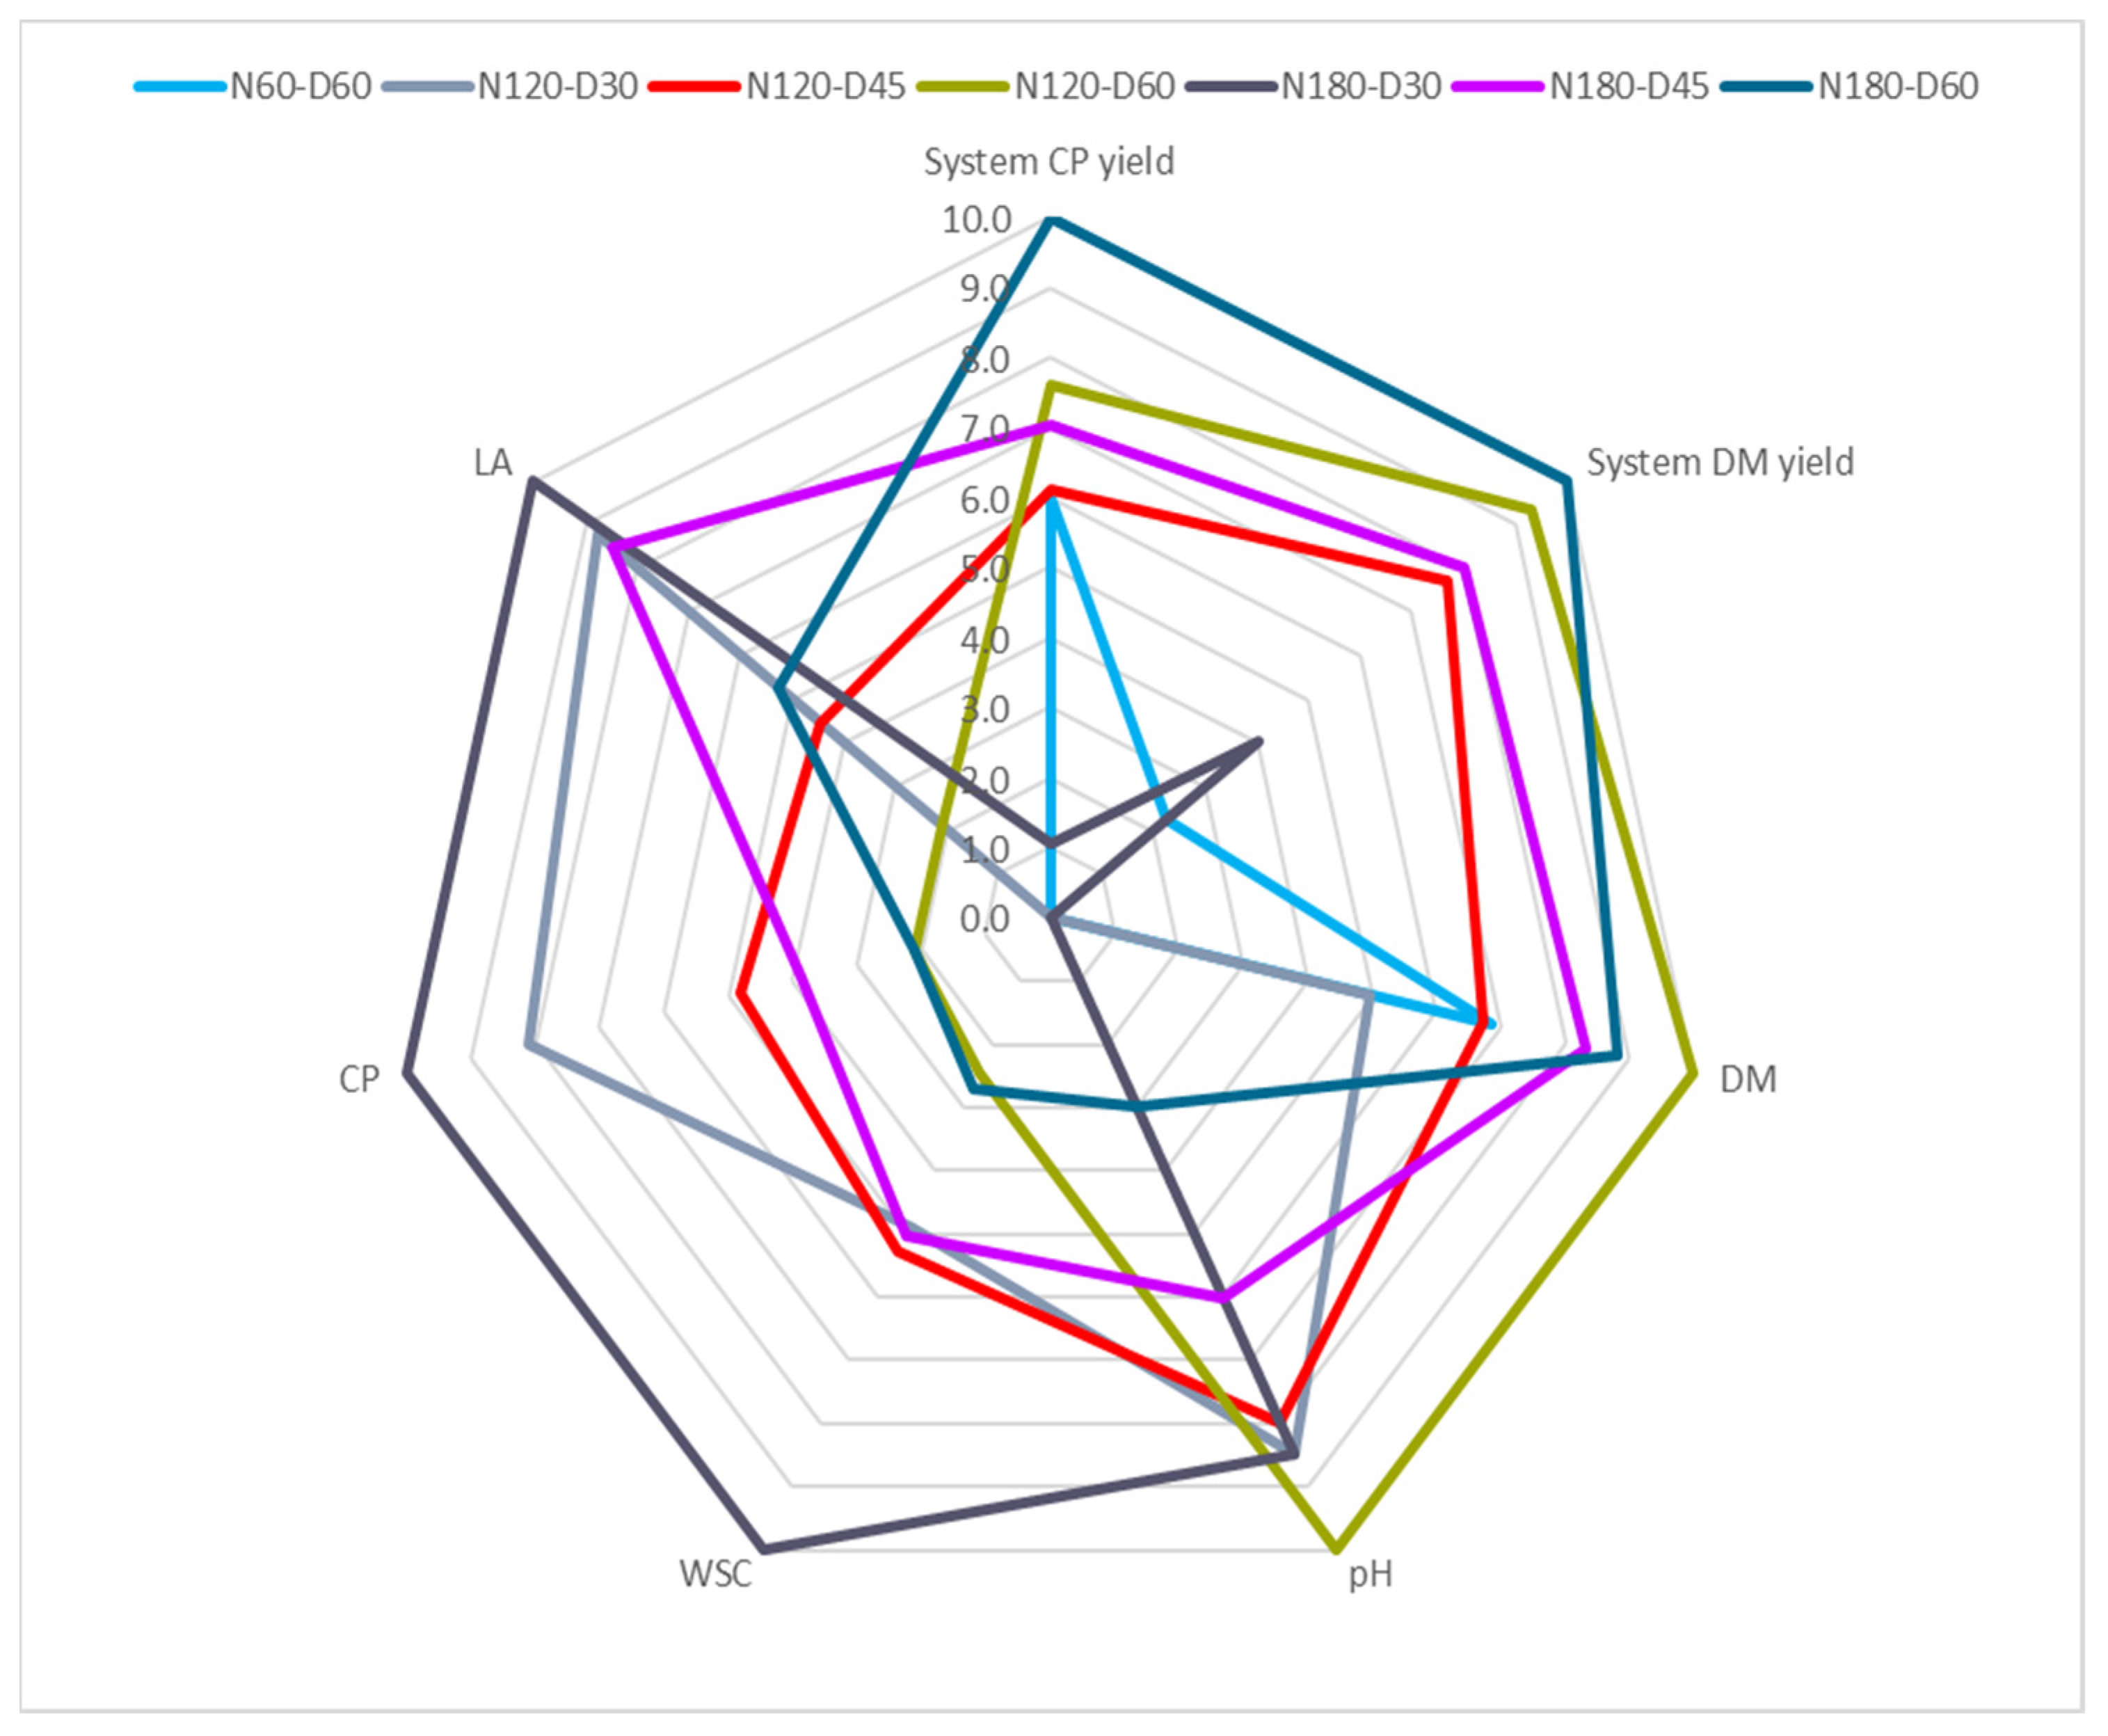
3.4. Multicriteria Assessment on Overall Performances

Six representative criteria that were significantly affected by the N rate × corn density interaction (DM yield, CP yield, silage CP content, silage WSC content, pH value and LA concentration) were selected to assess the overall performances of seven treatment combinations that achieved a similar CP yield with CK (p > 0.05). As shown in the spider diagram (Figure 3), the treatment combinations of N60–D60, N120–D60, N180–D60, which had a high corn plant density, achieved high scores on agronomic indicators, e.g., a 2-yr total system DM yield (2.3, 9.3, and 10.0 for N60–D60, N120–D60, and N180–D60, respectively) and a 2-yr total system CP yield (6.0, 7.6, and 10.0, respectively) but had poor performances on nutritive and fermentative indicators, e.g., WSC (0, 2.4, and 2.7, respectively), CP content (0, 2.1, and 2.1, respectively) and LA (0, 2.1, and 5.3, respectively). On the contrary, the treatment combinations of N120–D30, N180–D30 with a low corn plant density performed better on silage quality (averaged in 7.0 and 7.7 for N120–D30 and N180–D30, respectively), while the system total DM yield and CP yield were relatively low (averaged in 0 and 2.6, respectively). The scores of N120–D45 and N180–D45 ranged from 3.9 to 8.5 for all criteria, showing a more balanced performance on both productivity and quality characteristics.

4. Discussion

4.1. Effects of Intercropping on System Productivity and Silage Quality

Previous studies have shown that alfalfa, as a vigorous perennial legume, is the superior competitor in the alfalfa–silage corn intercropping, and alfalfa could significantly reduce the root growth, phosphorus and nitrogen uptake, and DM yield of the intercropped corn [10,20,21,33]. Different from the system that alfalfa served only as ground cover which is always suppressed by agrichemicals, we should maximize alfalfa production in the spring and corn production in the summer in our intercropping system. Thus, both the alfalfa and silage corn in the AC conducted the same row spacing and production area as the monoculture did in the local area and the interspecific competition between alfalfa and silage corn during the co-existing period was increased. For the silage corn, except the competition from alfalfa, to ensure the alfalfa survival, the lowered corn density (30,000 to 60,000 plants ha−1) in intercropping instead of 75,000 plants ha−1 in monocultured CK also had a significantly negative effect on corn DM yield. As a result, a reduction of 31.5% in the yield of silage corn was found in the AC on average across two years (Table 2). For the reason that the intercropped alfalfa became wilting in late August and regenerated gradually from then, the alfalfa yield during this co-existing period was really low (0.25–1.66 t ha−1; Figure 2) and the CP content of alfalfa residues was only 175.1 and 170.1 g kg−1 in 2017 and 2018 (Table 2), which were much lower than that of alfalfa harvested in the bud or early bloom stage [13,34]. Consequently, the intercropped alfalfa during summer did not contribute much to system yield, while still significantly improving system CP yield (Figure. 2). Besides, the increase in system CP yield also benefited from silage corn. The improvement of CP content in corn intercropping with alfalfa had a positive effect on corn CP content which was further improved by N fertilization, especially in 2017 (Table 2), which is consistent with previous studies [35,36]. Furthermore, we harvested all corn at the same time, but the intercropped corn was less mature than CK (about 10–15 days’ delay) for the competition from alfalfa and the CP content decreased with the maturity [37]. The results showed that seven treatment combinations (N60–D60, N120–D30, N120–D40, N120–D60, N180–D30, N180–D40, N180–D60,) achieved the same CP productivity as CK did (Figure. 2), which could compensate for the DM yield losses to a great extent.
For silage quality, the addition of alfalfa always improves the CP content of grass silage [12,13]. Despite the low proportion (≤25%) and relatively low CP content (<19%) of alfalfa raw materials in the AC, the CP of the mixed silage was significantly increased by 16.3% compared with that of CK on average (p < 0.001; Table 3). Meanwhile, as mentioned above, the CP contents of corn materials were also significantly increased by intercropping which promoted silage CP concentration (Table 2 and Table 3). However, a high level of soluble protein in alfalfa silage can degrade rapidly and yield ammonia which prevents the pH value of silage from reaching the required level [13]. We indeed found that the ammonia-N contents in both years were increased by 7.9% on average in the mixed silage, but the differences between the two systems were not significant (p > 0.05; Table 4). What is more, the pH values of all treatments were lower than 4.0, which are optimal for silage preservation in a stable form [38]. In fact, alfalfa is difficult to ensile successfully not only for the relatively high buffering capacity, but also for the low WSC contents and low DM content [38], this is also one of the important reasons why we suggest interseeding corn into alfalfa during a hot-rainy summer instead of ensiling pure alfalfa. In our study, the addition of alfalfa significantly reduced the silage DM content (p < 0.001; Table 3), but significantly increased the WSC content by up to 68.4% compared with that of 100% corn silage control, this is inconsistent with previous studies which showed that WSC content had a linear increase as the proportion of corn increased [12,13]. This could also be explained by that the monocultured corn was more mature than the intercropped corn when harvested, for which the DM content increased but the WSC decreased sharply owing to starch accumulation [37]. Thus, a higher WSC content, as the primary fermentation substrate, enhanced the fermentation characteristics of the alfalfa–corn mixed silage with a relatively low pH value and a higher LA content (8.5% and 38.8% higher than that of CK in 2017 and 2018, respectively) [34,39]. Jahanzad et al. [40] also showed that the addition of the legumes resulted in the production of higher concentrations of organic acids. In spite of a slight reduction of V-score in AC compared with that in CK, the mixed silage achieved a great fermentation quality (Table 4). Intercropping and the following mixed ensilage had few effects on fiber content and RFV value (Table 2), the results agree with previous studies [13,40].

4.2. Multicriteria Assessment on Productivity and Quality Performance of Alfalfa–Silage Corn Intercropping

In the establishment year 2017, the productivity of alfalfa was lower than that in the following production year (p < 0.05; Table 2). Meanwhile, the alfalfa needed a longer growth period in spring 2017, and silage corn was planted a few days later than that in 2018. So, the corn was harvested at the one-third milkline in 2017, while at the two-third milkline in 2018. This longer growth period increased the silage DM content but reduced the silage WSC content, LA concentration, as well as the forage FM yield in 2018 (Table 1, Table 2 and Table 3) [37]. For the effect of N fertilizer, the DM yield and CP content of the intercropped corn increased significantly as the N rate increased (p < 0.05; Table 1 and Table 2), for the reason that the addition of N fertilizer could reduce interspecific competition for N and improve N nutrition in silage corn [3,41]. The alfalfa DM yield and CP content were affected by the N rate only in 2017 (p < 0.01; Table 1 and Table 2), when the alfalfa was newly established and more sensitive to the N addition and the increased shading from the larger corn canopy. Corn plant density was the key factor affecting the alfalfa to silage corn ration in the mixed silage for the significantly opposite effects on alfalfa and corn yield in both years (p < 0.05; Table 1 and Table 2). The previous paper published from the system has reported that the density of alfalfa stands decreased with the increasing of corn plant density [14], and the alfalfa yield during summer was also significantly affected by the corn plant density (Table 1 and Table 2). As a result, the alfalfa proportion ratio in mixed silage based on an FM basis was influenced by the N rate, corn plant density, their interaction (Table 1, Table 2, Table 3 and Table 4), and the year, the total system DM yield and CP yield were negatively related with the alfalfa proportion in the mixed silage (data not shown).
For the nutritive values of the mixed silage, the proportion of alfalfa, which has a high CP content but low WSC content, was one of the key factors affecting the CP and WSC of the mixed silage [12,13]. Besides, consistent with previous studies, both the CP and WSC content of the corn was improved by the increasing N fertilizer and decreased by the increasing corn plant density [42,43]. Thus, we found that the treatments of low corn densities (D30, D45) combined with high N rates (N120, N180) had a relatively higher CP and WSC content, while they were relatively low under treatments of a high corn density (D60) (Figure 3). The DM content of the mixed silage was affected by the N rate × corn density interaction in both years (Table 3), but there was no linear correlation relationship with the alfalfa proportion [34]. Previous studies also have shown that neither corn plant density nor N fertilizer affected corn NDF [44,45], which agree with our results that only minor differences of NDF, ADF as well as RFV were found among different N rates or corn plant densities in both raw materials or the mixed silage (Table 3 and Table S1).
For the fermentation characteristics, consistent with other studies [40,43], the NH3-N content was significantly increased by N fertilizer. Given that pH values and LA contents were affected by the N rate and corn plant density, the differences of fermentation characteristics among treatment combinations of the mixed silage were relatively small (Table 4).
Proper field management is important for a new cropping system to achieve high productivity and forage quality. To evaluate the better N rate and corn plant density of the alfalfa–silage corn intercropping system we proposed, the multicriteria assessment on all agronomic, nutritive and fermentation characteristics was used, and we found that the treatment combinations under a high N rate and medium corn density (N120–D45 and N180–D45) could achieve high scores on both productivity and quality characteristics during the summer season (Figure 3). We have also proven that although the alfalfa stand density was decreased, the alfalfa productivity during spring was not affected, except for the treatment combination N180–D60 compared with the monocultured alfalfa, and the treatment combination of N120–D45 which achieved a higher annual system DM yield, annual system protein yield and land equivalent ratio with relatively low environmental costs [14,15]. Conclusively, we suggested the N120–D45 as the most advantageous alfalfa–silage corn intercropping combination for this system. However, further studies should be conducted in a variety selection, water management, etc., to improve the productivity and flexibility of the intercropping system.

5. Conclusions

Although the total system DM yield during the co-existing period was decreased, interseeding silage corn into the alfalfa stand would not decrease the system CP yield compared with the monocultured corn control in most cases. Despite that the intercropped alfalfa had negative effects on the DM contents, pH values and NH3-N concentrations of the mixed silage, the CP, WSC and LA contents of AC were dramatically increased. These improvements in CP yield and silage quality in AC would compensate for the DM yield losses to a great extent. The N input and corn plant density are the important management practices in the system, and significantly affected the silage nutritive values and fermentation characteristics, including the DM, CP, WSC, pH and LA contents of the mixed silage. Considering the different performances on system productivity and silage quality, we evaluated the treatment combinations by multicriteria assessment and suggested the N120–D45 as the optimal alfalfa–silage corn intercropping combination in NCP which had a more balanced yield, nutritive value and ensilability.

Supplementary Materials

The following supporting information can be downloaded at: https://www.mdpi.com/article/10.3390/agriculture12030357/s1, Table S1: chemical compositions of the fresh mixed crop from alfalfa–silage corn relay intercropping (AC) and whole crop corn from silage corn monoculture control (CK) before ensiling affected by intercropping (AC vs. CK), nitrogen application rate (NR) and corn plant density (PD).

Author Contributions

Conceptualization, R.X. and Y.Z.; methodology, R.X. and H.Z.; software, R.X.; formal analysis, R.X., Y.Y., R.W. and B.; resources, H.Z.; writing—original draft preparation, R.X.; writing—review and editing, G.L., Z.S. and Y.Z.; supervision, G.L.; project administration, Y.Z.; funding acquisition, G.L. and Y.Z. All authors have read and agreed to the published version of the manuscript.

Funding

This research was funded by the China Agriculture Research System of MOF and MARA, grant number CARS-34 and the China Scholarship Council.

Institutional Review Board Statement

Not applicable.

Informed Consent Statement

Not applicable.

Data Availability Statement

Not applicable.

Acknowledgments

Special thanks to Musen Wang for the help with data statistics and constructive comments on the manuscript.

Conflicts of Interest

The authors declare no conflict of interest.

References

  1. Fageria, N.K.; Baligar, V.C.; Bailey, B.A. Role of Cover Crops in Improving Soil and Row Crop Productivity. Commun. Soil Sci. Plant Anal. 2005, 36, 2733–2757. [Google Scholar] [CrossRef]
  2. Grabber, J.H.; Jokela, W.E.; Lauer, J.G. Soil Nitrogen and Forage Yields of Corn Grown with Clover or Grass Companion Crops and Manure. Agron. J. 2014, 106, 952–961. [Google Scholar] [CrossRef] [Green Version]
  3. West, J.R.; Ruark, M.D.; Shelley, K.B. Sustainable intensification of corn silage cropping systems with winter rye. Agron. Sustain. Dev. 2020, 40, 11. [Google Scholar] [CrossRef]
  4. Chen, S.; Wyse, D.L.; Johnson, G.A.; Porter, P.M.; Stetina, S.R.; Miller, D.R.; Betts, K.J.; Klossner, L.D.; Haar, M.J. Effect of cover crops alfalfa, red clover, and perennial ryegrass on soybean cyst nematode population and soybean and corn yields in Minnesota. Crop Sci. 2006, 46, 1890–1897. [Google Scholar] [CrossRef]
  5. Coombs, C.; Lauzon, J.D.; Deen, B.; Van Eerd, L.L. Legume cover crop management on nitrogen dynamics and yield in grain corn systems. Field Crops Res. 2017, 201, 75–85. [Google Scholar] [CrossRef]
  6. Kang, J.M.; Yang, Q.C.; Guo, W.S.; Zhang, T.J.; Sun, Y. Yield evaluation of ten introduced alfalfa cultivars in Beijing area of china. Chin. J. Grassl. 2010, 32, 5–10. [Google Scholar]
  7. Li, Y.; Zhao, H.M.; You, Y.L.; Wu, R.X.; Liu, G.B. Evaluation on production performance and economic benefit of the single alfalfa field interplanting different forage crops in summer. Acta Pratacult. Sinica 2019, 28, 73–87. [Google Scholar]
  8. Lv, H.G.; Kang, J.M.; Long, R.C.; Yang, Q.C.; Sun, Y.; Jun, Z.T. Yield evaluation of 22 alfalfa cultivars in Hebei area. Acta Agrestia Sin. 2018, 26, 948–958. [Google Scholar]
  9. Brito, A.F.; Broderick, G.A. Effect of Varying Dietary Ratios of Alfalfa Silage to Corn Silage on Production and Nitrogen Utilization in Lactating Dairy Cows1. J. Dairy Sci. 2006, 89, 3924–3938. [Google Scholar] [CrossRef]
  10. Grabber, J.H. Prohexadione-calcium improves stand density and yield of alfalfainterseeded into silage corn. Agron. J. 2016, 108, 726–735. [Google Scholar] [CrossRef]
  11. Weiss, W.P.; St-Pierre, N.R.; Willett, L.B. Varying type of forage, concentration of metabolizable protein, and source of carbohydrate affects nutrient digestibility and production by dairy cows. J. Dairy Sci. 2009, 92, 5595–5606. [Google Scholar] [CrossRef] [PubMed] [Green Version]
  12. Tao, Y.; Sun, Q.; Li, F.; Xu, C.; Cai, Y. Comparative analysis of ensiling characteristics and protein degradation of alfalfa silage prepared with corn or sweet sorghum in semiarid region of Inner Mongolia. Anim. Sci. J. 2020, 91, e13321. [Google Scholar] [CrossRef]
  13. Zhang, Q.; Zhao, M.; Wang, X.; Yu, Z.; Na, R. Ensiling alfalfa with whole crop corn improves the silage quality and in vitro digestibility of the silage mixtures. Grassl. Scie. 2017, 63, 211–217. [Google Scholar] [CrossRef]
  14. Xu, R.; Zhao, H.; Liu, G.; You, Y.; Ma, L.; Liu, N.; Zhang, Y. Effects of nitrogen and maize plant density on forage yield and nitrogen uptake in an alfalfa–silage maize relay intercropping system in the North China Plain. Field Crops Res. 2021, 263, 108068. [Google Scholar] [CrossRef]
  15. Xu, R.; Zhao, H.; Liu, G.; Li, Y.; Li, S.; Zhang, Y.; Liu, N.; Ma, L. Alfalfa and silage maize intercropping provides comparable productivity and profitability with lower environmental impacts than wheat–maize system in the North China plain. Agr. Syst. 2022, 195, 103305. [Google Scholar] [CrossRef]
  16. Wang, M.; Wang, L.; Yu, Z. Fermentation dynamics and bacterial diversity of mixed lucerne and sweet corn stalk silage ensiled at six ratios. Grass Forage Sci. 2019, 74, 264–273. [Google Scholar] [CrossRef]
  17. Baghdadi, A.; Halim, R.A.; Radziah, O.; Martini, M.Y.; Ebrahimi, M. Fermentation characteristics and nutritive value of corn silage intercropped with soybean under different crop combination ratios. J. Anim. Plant Sci. 2016, 26, 1710–1717. [Google Scholar]
  18. Dewhurst, R.J. Milk production from silage: Comparison of grass, legume and maize silages and their mixtures. Agr. Food Sci. 2013, 22, 57–69. [Google Scholar] [CrossRef] [Green Version]
  19. Kaiser, A.G.; Dear, B.S.; Morris, S.G. An evaluation of the yield and quality of oatlegume and ryegrasslegume mixtures and legume monocultures harvested at three stages of growth for silage. Aust. J. Exp. Agr. 2007, 47, 25–38. [Google Scholar] [CrossRef]
  20. Flynn, E.S.; Moore, K.J.; Singer, J.W.; Lamkey, K.R. Evaluation of Grass and Legume Species as Perennial Ground Covers in Corn Production. Crop Sci. 2013, 53, 611–620. [Google Scholar] [CrossRef]
  21. Zhang, G.; Yang, Z.; Dong, S. Interspecific competitiveness affects the total biomass yield in an alfalfa and corn intercropping system. Field Crops Res. 2011, 124, 66–73. [Google Scholar] [CrossRef]
  22. Varella, A.C.; Moot, D.J.; Pollock, K.M.; Peri, P.L.; Lucas, R.J. Do light and alfalfa responses to cloth and slatted shade represent those measured under an agroforestry system? Agrofor. Syst. 2011, 81, 157–173. [Google Scholar] [CrossRef]
  23. Wu, Y.S.; Gong, W.Z.; Yang, F.; Wang, X.C.; Yong, T.W.; Yang, W.Y. Responses to shade and subsequent recovery of soya bean in maize-soya bean relay strip intercropping. Plant. Prod. Sci. 2016, 19, 206–214. [Google Scholar] [CrossRef] [Green Version]
  24. Song, J.; Hui, Y.; Yu, C.D.; Zhang, Q.; Zhou, Y.Q.; Li, Y.; Liu, X.H.; Zhu, L.L.; Hui, D.F.; Wan, S.Q. Carbon balance under four double-season cropping systems in North China Plain. Plant Soil 2017, 421, 319–336. [Google Scholar] [CrossRef]
  25. Association of Official Analytical Chemists (AOAC). Official Methods of Analysis of the Association of Official Analytical Chemists, 15th ed.; Association of Official Analytical Chemists (AOAC): Arlington, TX, USA, 1990; pp. 1–1298. [Google Scholar]
  26. Broderick, G.A.; Kang, J.H. Automated Simultaneous Determination of Ammonia and Total Amino Acids in Ruminal Fluid and In Vitro Media. J. Dairy Sci. 1980, 63, 64–75. [Google Scholar] [CrossRef]
  27. Van Soest, P.J.; Robertson, J.B.; Lewis, B.A. Methods for Dietary Fiber, Neutral Detergent Fiber, and Nonstarch Polysaccharides in Relation to Animal Nutrition. J. Dairy Sc. 1991, 74, 3583–3597. [Google Scholar] [CrossRef]
  28. Linn, J.G.; Martin, N.P. Forage Quality Tests and Interpretation; University of Minnesota Extension Service: St. Paul, MN, USA, 1989; (MN AG-FO-02637). [Google Scholar]
  29. Murphy, R.P. A method for the extraction of plant samples and the determination of total soluble carbohydrates. J. Sci. Food Agr. 1958, 9, 714–717. [Google Scholar] [CrossRef]
  30. Pelzer, E.; Bazot, M.; Makowski, D.; Corre-Hellou, G.; Naudin, C.; Al Rifai, M.; Baranger, E.; Bedoussac, L.; Biarnes, V.; Boucheny, P.; et al. Pea-wheat intercrops in low-input conditions combine high economic performances and low environmental impacts. Eur. J. Agron. 2012, 40, 39–53. [Google Scholar] [CrossRef]
  31. Pelzer, E.; Bazot, M.; Guichard, L.; Jeuffroy, M.-H. Crop Management Affects the Performance of a Winter Pea–Wheat Intercrop. Agron. J. 2016, 108, 1089–1100. [Google Scholar] [CrossRef]
  32. Piepho, H.P.; Williams, E.R.; Fleck, M. A note on the analysis of designed experiments with complex treatment structure. Hortscience 2006, 41, 446–452. [Google Scholar] [CrossRef] [Green Version]
  33. Sun, B.; Gao, Y.; Yang, H.; Zhang, W.; Li, Z. Performance of alfalfa rather than maize stimulates system phosphorus uptake and overyielding of maize/alfalfa intercropping via changes in soil water balance and root morphology and distribution in a light chernozemic soil. Plant Soil 2019, 439, 145–161. [Google Scholar] [CrossRef]
  34. Wang, M.; Yu, Z.; Wu, Z.; Hannaway, D.B. Effect of Lactobacillus plantarum ‘KR107070’ and a propionic acid-based preservative on the fermentation characteristics, nutritive value and aerobic stability of alfalfa-corn mixed silage ensiled with four ratios. Grassl. Sci. 2018, 64, 51–60. [Google Scholar] [CrossRef]
  35. Li, L.; Li, S.-M.; Sun, J.-H.; Zhou, L.-L.; Bao, X.-G.; Zhang, H.-G.; Zhang, F.-S. Diversity enhances agricultural productivity via rhizosphere phosphorus facilitation on phosphorus-deficient soils. Proc. Natl. Acad. Sci. USA 2007, 104, 11192–11196. [Google Scholar] [CrossRef] [PubMed] [Green Version]
  36. Nasar, J.; Shao, Z.; Arshad, A.; Jones, F.G.; Liu, S.; Li, C.; Khan, M.Z.; Khan, T.; Banda, J.S.K.; Zhou, X.; et al. The effect of maize–alfalfa intercropping on the physiological characteristics, nitrogen uptake and yield of maize. Plant Biol. 2020, 22, 1140–1149. [Google Scholar] [CrossRef]
  37. Filya, I. Nutritive value and aerobic stability of whole crop maize silage harvested at four stages of maturity. Anim. Feed Sci. Technol. 2004, 116, 141–150. [Google Scholar] [CrossRef]
  38. McDonald, P.; Henderson, A.R.; Heron, S.J.E. The Biochemistry of Silage, 2nd ed.; Chalcombe Publications: Marlow, UK, 1991; p. 340. [Google Scholar]
  39. Downing, T.W.; Buyserie, A.; Gamroth, M.; French, P. Effect of Water Soluble Carbohydrates on Fermentation Characteristics of Ensiled Perennial Ryegrass. Pro. Anim. Scient. 2008, 24, 35–39. [Google Scholar] [CrossRef]
  40. Jahanzad, E.; Sadeghpour, A.; Hosseini, M.B.; Barker, A.V.; Hashemi, M.; Zandvakili, O.R. Silage Yield and Nutritive Value of Millet-Soybean Intercrops as Influenced by Nitrogen Application. Agron. J. 2014, 106, 1993–2000. [Google Scholar] [CrossRef]
  41. Smeltekop, H.; Clay, D.E.; Clay, S.A. The impact of intercropping annual ‘Sava’ snail medic on corn production. Agron. J. 2002, 94, 917–924. [Google Scholar] [CrossRef]
  42. Feng, P.; Wen, D.Y.; Sun, Q.Z. Effect of plant density on yield and quality of silage corn. Pratacult. Sci. 2011, 28, 2203–2208. [Google Scholar]
  43. Sun, Z.Q.; Wang, T.Z.; Tian, J.P.; Liu, G.B.; You, Y.L.; Zhao, H.M.; Yu, Z. The effects of the ensiling density and nitrogen application rate on the quality of whole plant corn silage. China Dairy Cattle 2019, 7, 13–16. [Google Scholar]
  44. Marsalis, M.A.; Angadi, S.V.; Contreras-Govea, F.E. Dry matter yield and nutritive value of corn, forage sorghum, and BMR forage sorghum at different plant populations and nitrogen rates. Field Crops Res. 2010, 116, 52–57. [Google Scholar] [CrossRef]
  45. Skonieski, F.R.; Viégas, J.; Martin, T.N.; Nörnberg, J.L.; Meinerz, G.R.; Tonin, T.J.; Bernhard, P.; Frata, M.T. Effect of seed inoculation with Azospirillum brasilense and nitrogen fertilization rates on maize plant yield and silage quality. Rev. Bras. Zootec. 2017, 46, 722–730. [Google Scholar] [CrossRef] [Green Version]
Figure 1. Monthly precipitation totals and temperature averages for 2017–2018 and 40-yr average (1980–2019).
Agriculture 12 00357 g001
Figure 2. System total dry matter (DM) yield (a) and crude protein (CP) yield (b) of alfalfa–silage corn relay intercropping (AC) and silage corn monoculture control (CK) as affected by nitrogen application rate (NR) and corn plant density (PD). N0, N60, N120 and N180 mean N application rate of 0, 60, 120 and 180 kg N ha−1. D30, D45 and D60 mean corn seeding rate of 30, 45 and 60 thousand plants ha−1. Different letters indicate significant differences at the level of p < 0.05. *** indicates significant difference at p < 0.001; ns indicates not significant at p < 0.05.
Agriculture 12 00357 g002
Figure 3. Multicriteria assessment of treatment combinations in alfalfa–silage corn relay intercropping system. A 2-yr system total dry matter (DM) yield, 2-yr system crude protein (CP) yield, and 2-yr average DM content, 2-yr average CP content, 2-yr average pH, 2-yr average lactic acid (LA) concentration and 2-yr average water soluble carbohydrate (WSC) of silage transformed to 0 to 10 scores, 0 being the worst score and 10 the best score. N60, N120 and N180 mean N application rate of 60, 120 and 180 kg N ha−1. D30, D45 and D60 mean corn seeding rate of 30, 45 and 60 thousand plants ha−1.
Agriculture 12 00357 g003
Table 1. Forage fresh matter (FM) yield and alfalfa proportion (FM basis) in mixed silage of alfalfa–silage corn relay intercropping as affected by nitrogen application rate (NR) and corn plant density (PD).
NRPDAlfalfa FM Yield, t ha−1Corn FM Yield, t ha−1Alfalfa Proportion in Silage, %
201720182017201820172018
N0 aD30 b5.26 Aa5.05 a29.66 Bb20.42 Bb18 Aa25 Aa
D452.75 B3.4033.59 ABb24.52 AB8 B14 B
D601.54 B3.1737.84 A27.83 Ab5 C11 B
N60D303.23 c2.67 b34.70 Bab26.61 ab9 b10 b
D453.242.0638.30 ABab31.6188
D602.481.8140.80 A32.81 ab66
N120D303.41 Ac3.82 ab34.78 ab25.39 ab10 Ab15 b
D453.18 A2.5639.84 ab32.308 AB8
D602.73 B2.0839.1133.37 ab7 B7
N180D304.38 Ab3.90 Aab36.36 Ba27.30 Ba12 b14 Ab
D452.28 B2.43 AB45.37 Aa31.95 A58 AB
D601.19 B1.17 B47.26 A36.07 Aa33 B
Mean3.002.8438.5730.21911
SEM c0.190.210.910.970.010.01
Source of variation p value
NRns dns0.0220.0130.0200.010
PD<0.001<0.001<0.001<0.001<0.001<0.001
NR × PD<0.001nsnsns<0.001ns
Different lowercase letters in the same column indicate significant differences at p < 0.05 among N application rates under the same corn plant density, and different capital letters in the same column indicate significant differences at p < 0.05 among corn plant densities under the same N rate. a N0, N60, N120 and N180 mean N application rate of 0, 60, 120 and 180 kg N ha−1. b D30, D45 and D60 mean corn plant density of 30, 45 and 60 thousand plants ha−1. c Standard error of the overall mean. d ns indicates not significant at p < 0.05.
Table 2. Forage dry matter (DM) yield, crude protein (CP) content, CP yield of alfalfa–silage corn relay intercropping (AC) and silage corn monoculture control (CK) as affected by nitrogen application rate (NR) and corn plant density (PD).
TreatmentAlfalfa DM Yield
(t ha−1)
Corn DM Yield
(t ha−1)
Alfalfa CP Content
(g kg−1 DM)
Corn CP Content
(g kg−1 DM)
Alfalfa CP Yield
(kg ha−1)
Corn CP Yield
(kg ha−1)
201720182017201820172018201720182017201820172018
Cropping system
CK 17.8619.30 62.5060.19 1114.701161.83
AC 13.3512.09 73.7762.47 986.08756.23
N application rate
CK 17.86 a19.30 a 62.50 c60.19 ab 1114.70 a1161.83 a
N0 a0.93 a1.2711.75 d9.63 c175.35 ab167.2466.18 bc59.02 b162.96 a212.93778.32 b567.31 c
N600.82 a0.7212.95 cd12.51 b165.38 b169.5774.44 ab60.31 ab135.29 ab122.60963.14 ab749.01 b
N1200.89 a0.9614.07 bc12.66 b181.77 a169.0576.59 ab64.66 ab162.23 a162.671072.96 a818.77 b
N1800.65 b0.8514.63 b13.56 b177.92 a174.5577.84 a65.88 a116.47 b146.941129.90 a889.84 b
Corn plant density
CK 17.86 a19.30 a 62.50 b60.19 1114.70 a1161.83 a
D30 b1.07 a1.24 a11.74 c10.15 c178.28173.3577.60 a64.46191.79 a214.38 a913.87 b655.99 c
D450.78 b0.87 b13.46 bc12.59 bc173.75168.5172.29 ab61.31135.16 b146.61 b979.34 ab776.99 bc
D600.61 b0.73 b14.86 b13.52 b173.28168.4471.41 ab61.64105.77 b122.90 b1065.03 ab835.71 b
Overall Mean0.820.9513.6912.64175.10170.10 72.9062.30144.24161.29995.98787.43
SEM c0.050.060.350.471.971.701.260.738.611.0727.3130.23
Source of variation p value
AC vs. CK <0.001<0.001 0.004ns 0.032<0.001
NR<0.001ns d0.0010.0010.003ns0.001<0.001<0.001ns<0.0010.001
PD<0.0010.001<0.001<0.001nsns0.0370.030<0.001<0.0010.003<0.001
NR × PD<0.001nsnsns0.008nsnsns<0.001nsnsns
Different letters in the same column within the same treatment indicate significant differences (p < 0.05). a N0, N60, N120 and N180 mean N application rate of 0, 60, 120 and 180 kg N ha−1. b D30, D45 and D60 mean corn plant density of 30, 45 and 60 thousand plants ha−1. c Standard error of the overall mean. d ns indicates not significant at p < 0.05.
Table 3. Nutritive values of the mixed silage from alfalfa–silage corn relay intercropping (AC) and whole crop corn from silage corn monoculture control (CK) affected by nitrogen application rate (NR) and corn plant density (PD).
TreatmentDM (g kg−1)CP (g kg−1 DM)NDF (g kg−1 DM)ADF (g kg−1 DM)RFVWSC (g kg−1 DM)
201720182017201820172018201720182017201820172018
Cropping system
CK387.31483.7071.2062.83447.16444.67275.13258.85180.45247.2919.5410.85
AC343.62430.2083.3272.51447.97463.14275.82276.28189.77228.3136.0716.48
N application rate
CK387.31 a483.70 a71.20 b62.83 b447.16 ab444.67 b275.13 ab258.85 b180.45247.29 a19.54 c10.85 c
N0 a343.07 bc405.39 c83.02 a70.49 ab468.89 a481.01 a288.19 a290.83 a184.03211.86 b28.73 bc12.59 bc
N60332.42 c425.67 bc81.87 a68.24 ab444.63 ab445.01 b265.98 b262.45 b195.68246.81 a33.77 ab15.82 abc
N120364.25 ab436.54 bc84.43 a74.85 a432.63 b461.84 ab283.75 ab280.48 ab185.01227.37 ab38.76 ab18.33 ab
N180334.74 c453.18 ab83.95 a76.43 a445.72 ab464.68 ab265.36 ab271.37 ab194.35227.17 ab43.00 a19.16 a
Corn plant density
CK387.31 a483.70 a71.20 c62.83 c447.16444.67275.13258.85180.45247.2919.54 b10.85 b
D30 b340.15 b409.96 b87.86 a81.33 a457.52467.97271.66278.18192.21222.8540.04 a17.99 a
D45343.43 b435.99 b82.47 ab69.80 b440.58465.95274.96278.42192.42224.4334.39 a16.08 ab
D60347.29 b444.31 ab79.62 b66.39 bc445.81455.49280.85272.24184.67237.6433.76 a15.35 ab
Overall Mean346.98434.3182.3871.76447.91461.72275.77274.94189.05229.7634.8016.04
SEM c3.495.170.951.283.943.533.262.632.653.381.510.72
Source of variation p value
AC vs. CK<0.001<0.001<0.001<0.001nsnsns0.049nsns<0.0010.009
NR<0.001<0.001ns<0.0010.0110.0040.0020.001ns0.03<0.0010.001
PDns d<0.001<0.001<0.001nsnsnsnsnsns0.019ns
NR × PD<0.001<0.0010.0010.028nsnsnsnsnsns0.041ns
Different letters in the same column within the same treatment indicate significant differences (p < 0.05). ADF, acid detergent fiber; CP, crude protein; DM, dry matter; NDF, neutral detergent fiber; RFV, relative feed value; WSC, water soluble carbohydrate. a N0, N60, N120 and N180 mean N application rate of 0, 60, 120 and 180 kg N ha−1. b D30, D45 and D60 mean corn plant density of 30, 45 and 60 thousand plants ha−1. c Standard error of the overall mean. d ns indicates not significant at p < 0.05.
Table 4. Fermentation characteristics of the mixed silage from alfalfa–silage corn relay intercropping (AC) and whole crop corn from silage corn monoculture control (CK) affected by nitrogen application rate (NR) and corn plant density (PD).
TreatmentpHNH3-N (g kg−1 TN)LA (g kg−1 DM)AA (g kg−1 DM)PA (g kg−1 DM)BA (g kg−1 DM)V-Score
20172018201720182017201820172018201720182017201820172018
Cropping system
CK3.823.6149.0245.8366.9629.4910.265.991.91ND eND0.08100.0099.34
AC3.793.6554.0851.5272.6640.929.649.621.110.20ND0.0399.1999.00
N application rate
CK3.823.61 b49.02 b45.83 b66.9629.49 b10.265.99 b1.91 aNDND0.08100.00 a99.34 ab
N0 a3.803.67 a45.59 b47.06 b72.6143.79 a8.489.36 a1.47 ab0.14ND0.0999.79 a99.12 ab
N603.793.62 b52.22 ab46.35 b71.5939.07 ab9.899.47 a1.07 b0.43NDND99.99 a99.99 a
N1203.793.64 ab56.47 ab49.97 b67.6941.28 a10.549.40 a0.92 bNDNDND99.52 a99.52 ab
N1803.793.67 a62.04 a62.69 a78.7339.53 a9.6710.37 a0.99 b0.23ND0.0197.47 b97.39 b
Corn plant density
CK3.82 a3.61 b49.0245.8366.96 bc29.49 b10.265.99 b1.91 aNDND0.08100.0099.34
D30 b3.77 b3.66 a55.3952.5783.53 a40.13 a10.169.49 a1.73 a0.19ND0.0799.1598.64
D453.80 ab3.64 ab53.4450.8975.50 ab41.91 a9.799.54 a1.04 b0.31ND0.0199.1799.11
D603.81 a3.65 ab53.4051.0858.93 c40.72 a8.989.83 a0.56 b0.11NDND99.2699.26
Overall Mean3.793.6553.6951.0872.2240.049.709.341.170.19ND0.0399.2599.03
SEM c0.010.011.411.372.171.060.330.420.110.09ND0.020.210.26
Source of variation p value
AC vs. CKns d0.005nsnsns0.004ns0.001<0.001ns nsns
NRns<0.0010.001<0.0010.035nsnsns0.001ns <0.0010.003
PD<0.001nsnsns<0.001nsnsns<0.001ns nsns
NR × PD0.0050.009nsns0.048nsnsns<0.001ns nsns
Different letters in the same column within the same treatment indicate significant differences (p < 0.05). AA, acetic acid; BA, butyric acid; LA, lactic acid; NH3-N, ammoniacal nitrogen; ND, not detected; PA, propionic acid. a N0, N60, N120 and N180 mean N application rate of 0, 60, 120 and 180 kg N ha−1. b D30, D45 and D60 mean corn plant density of 30, 45 and 60 thousand plants ha−1. c Standard error of the overall mean. d ns indicates not significant at p < 0.05. ND indicates not detected.
Publisher’s Note: MDPI stays neutral with regard to jurisdictional claims in published maps and institutional affiliations.

