A Pedological Catenal Characterization along Steeply Sloped and Perhumid Regions: The Case Study of Piedemonte Llanero, Colombia

 ,
,  and
and
Abstract
:1. Introduction
2. Materials and Methods
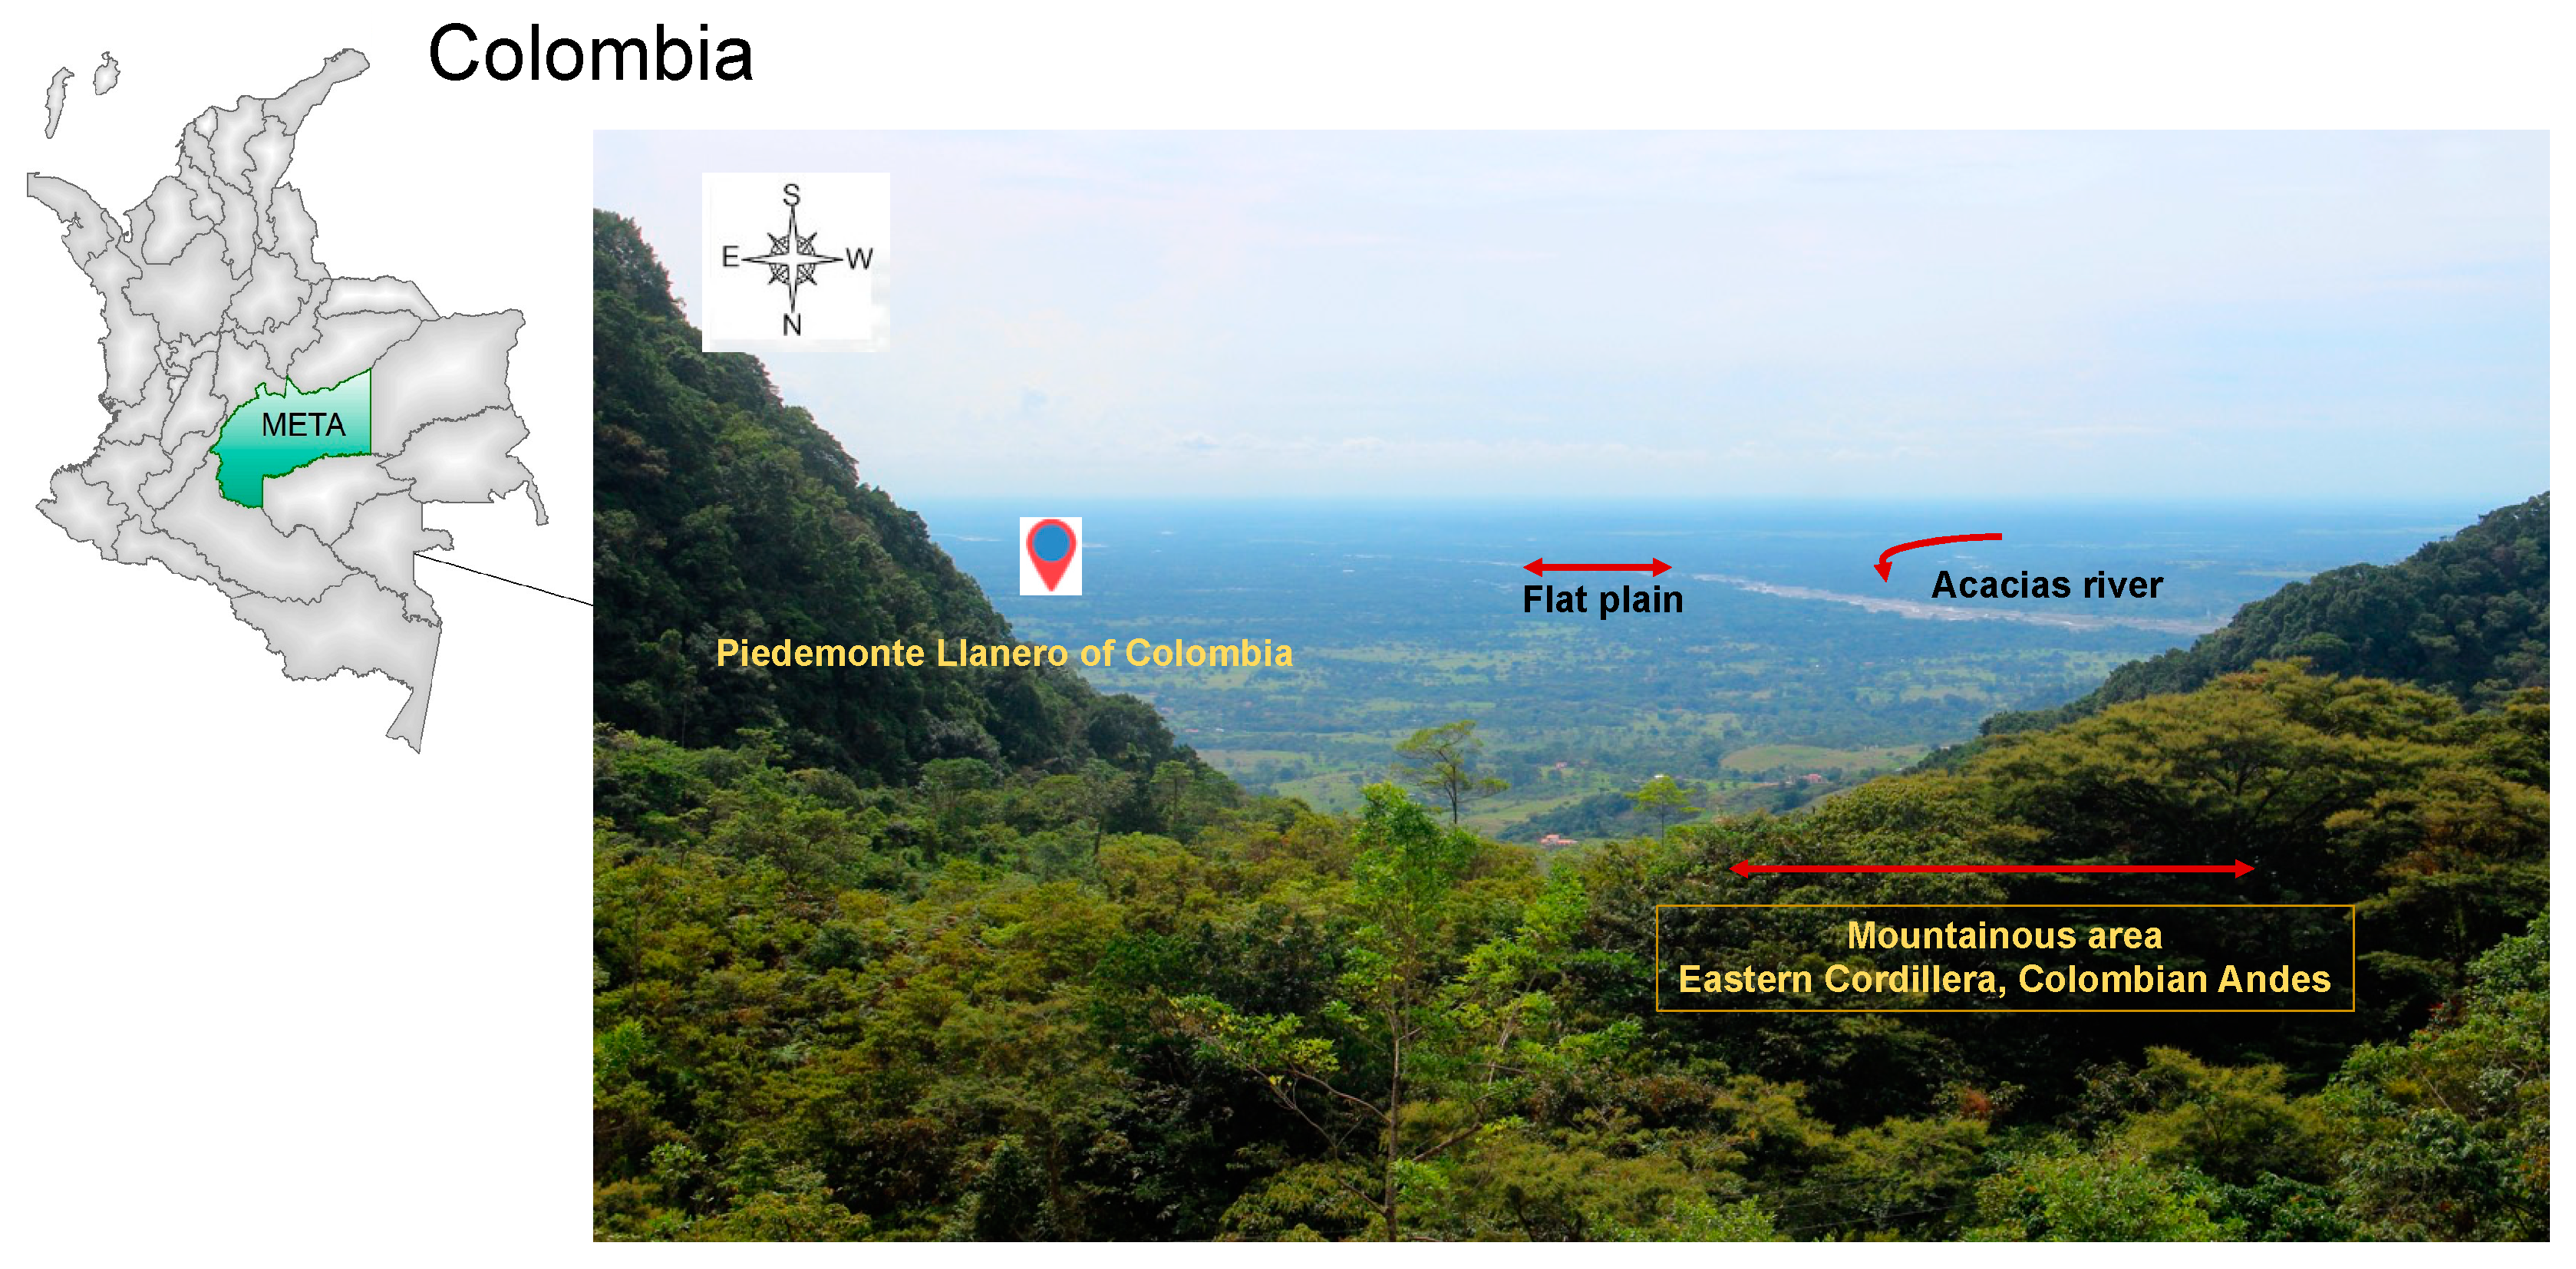
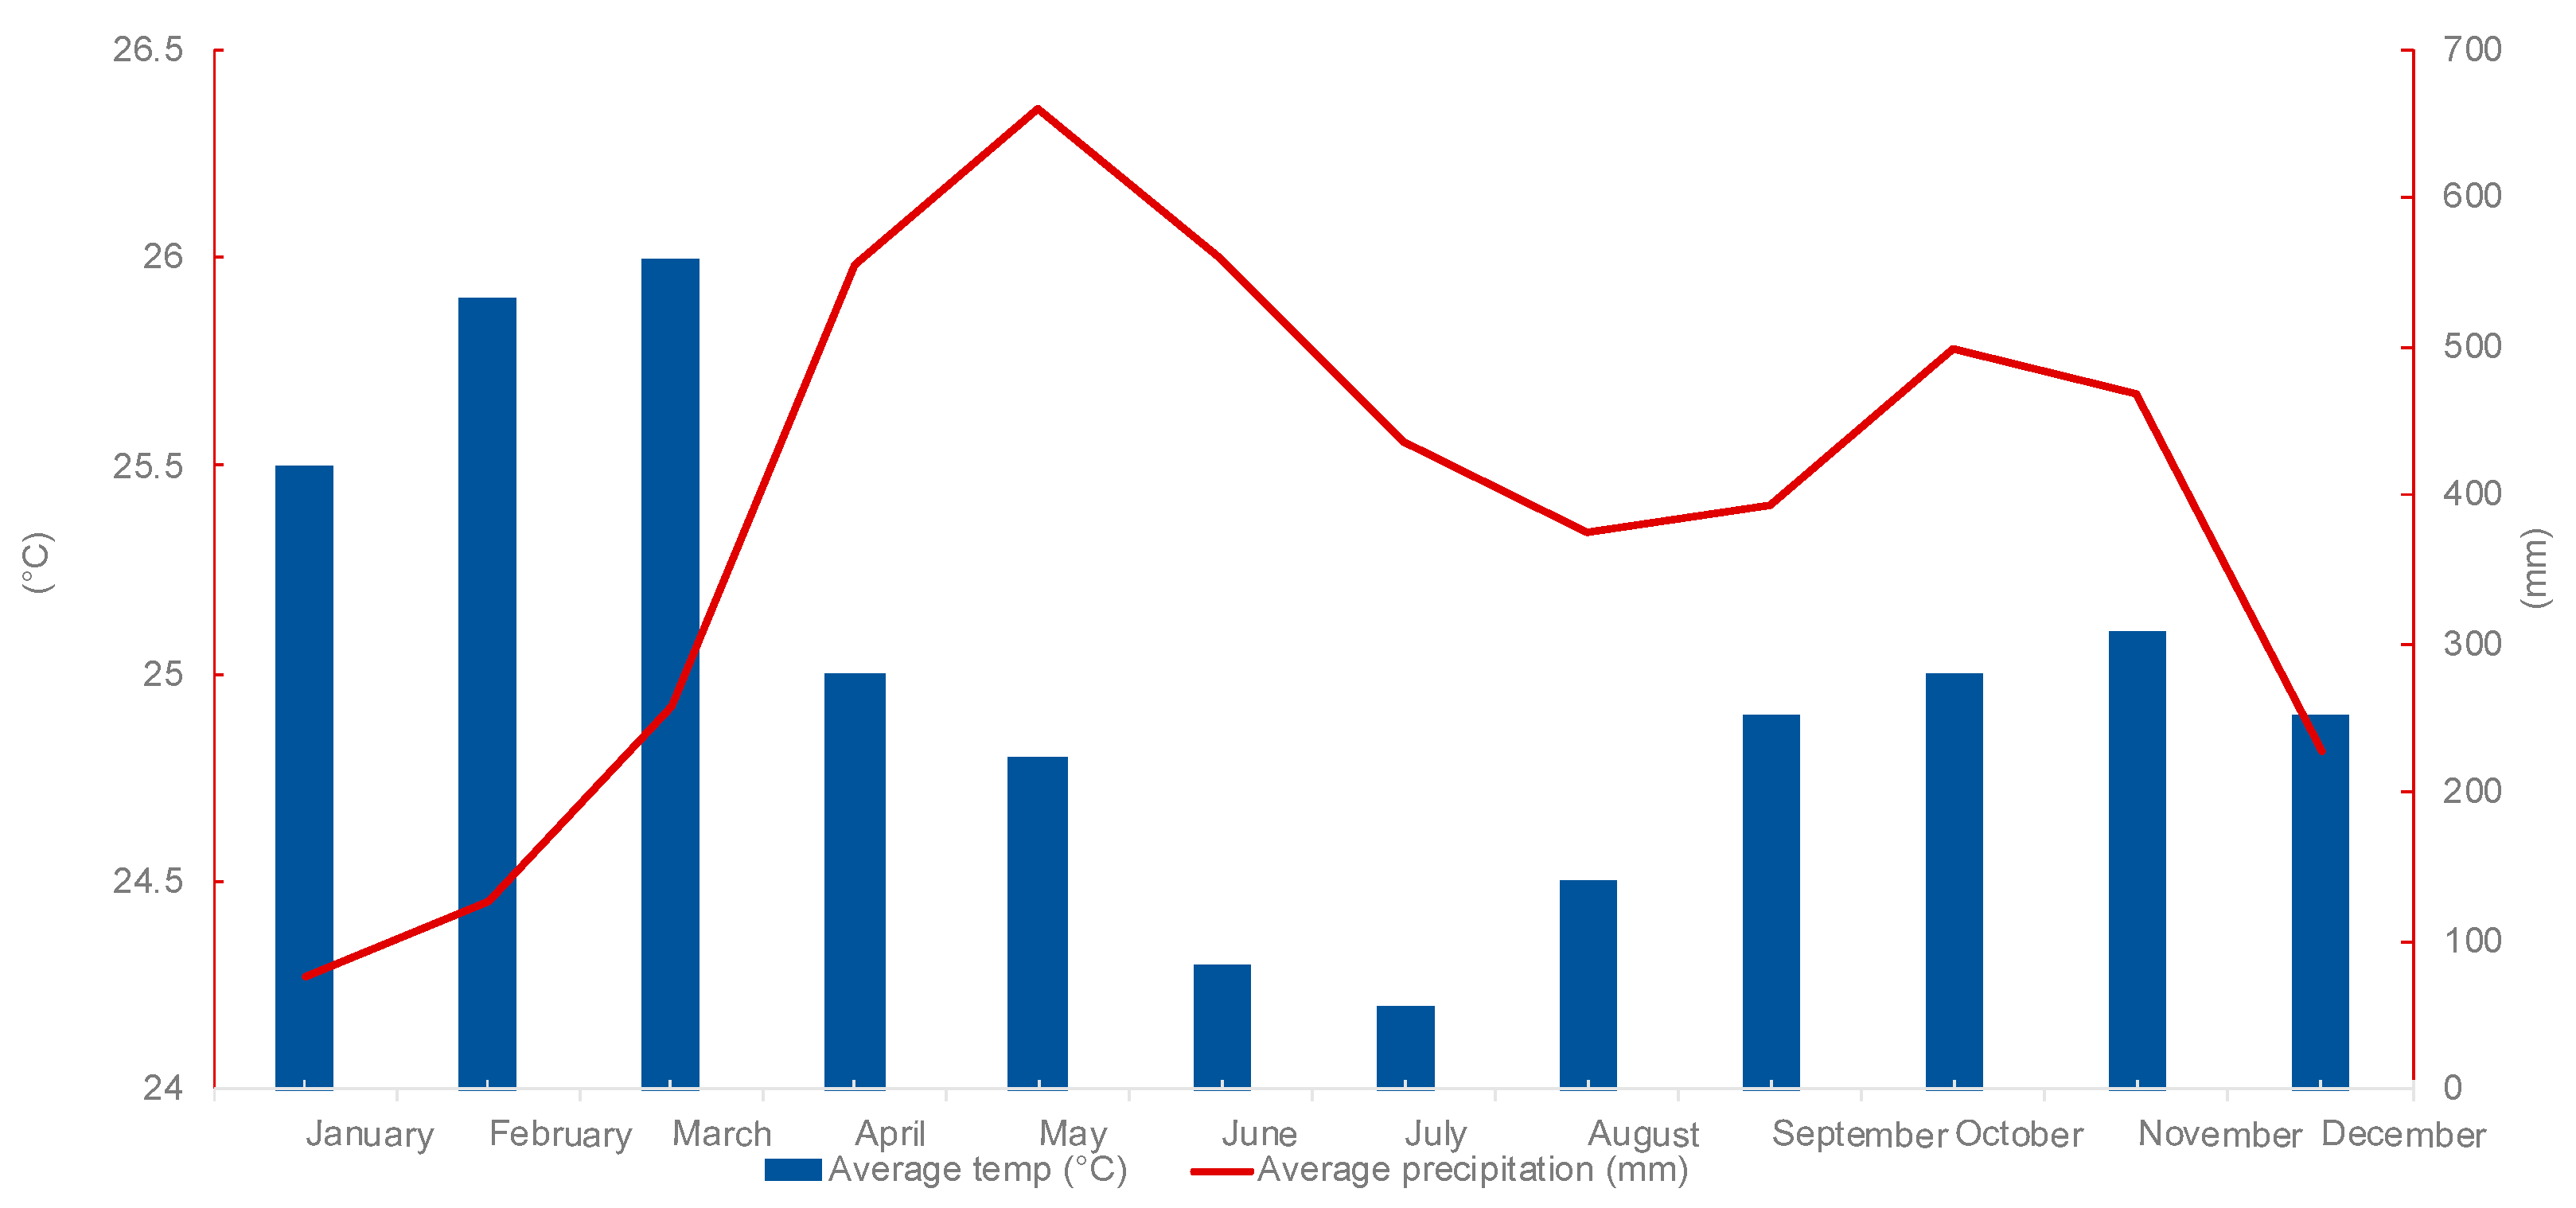
2.1. Site Descriptions
2.2. Field Survey and Sampling
2.3. Analytical Procedure
2.4. Soil Index
3. Results and Discussion
3.1. Soil Characteristics
3.2. Application of the Soil Index
4. Conclusions
Author Contributions
Funding
Institutional Review Board Statement
Informed Consent Statement
Data Availability Statement
Acknowledgments
Conflicts of Interest
References
- Wakene, N.; Heluf, G. Influence of land management on morphological, physical and chemical properties of some soils of Bako, Western Ethiopia. Agropedology 2003, 13, 1–9. [Google Scholar]
- Fantaw, Y.; Yimer, A. The effect of crop land fall owing on soil nutrient restoration in the Bale Mountain. Sci. Dev. J. 2011, 1, 43–51. [Google Scholar]
- Sanchez, P.A. Properties and Management of Soils in the Tropics. Soil Sci. 1977, 124, 187. [Google Scholar] [CrossRef]
- Cairns, M.; Garrity, D.P. Improving shifting cultivation in Southeast Asia by building on indigenous fallow management strategies. Agrofor. Syst. 1999, 47, 37–48. [Google Scholar] [CrossRef]
- Foote, R.L.; Grogan, P. Soil carbon accumulation during temperate forest succession on abandoned low productivity agricultural lands. Ecosystems 2010, 13, 795–812. [Google Scholar] [CrossRef]
- Knops, J.M.H.; Tilman, D. Dynamics of soil nitrogen and carbon accumulation for 61 years after agricultural abandonment. Ecology 2000, 81, 88–98. [Google Scholar] [CrossRef]
- Garrett, R.D.; Koh, I.; Lambin, E.F.; le Polain de Waroux, Y.; Kastens, J.H.; Brown, J.C. Intensification in agriculture-forest frontiers: Land use responses to development and conservation policies in Brazil. Glob. Environ. Chang. 2018, 53, 233–243. [Google Scholar] [CrossRef]
- Grogan, P.; Lalnunmawia, F.; Tripathi, S.K. Shifting cultivation in steeply sloped regions: A review of management options and research priorities for Mizoram state, Northeast India. Agrofor. Syst. 2012, 84, 163–177. [Google Scholar] [CrossRef]
- Choudhury, B.U.; Fiyaz, A.R.; Mohapatra, K.P.; Ngachan, S. Impact of Land Uses, Agrophysical Variables and Altitudinal Gradient on Soil Organic Carbon Concentration of North-Eastern Himalayan Region of India. Land Degrad. Dev. 2014, 27, 1163–1174. [Google Scholar] [CrossRef]
- Tricart, J. Les caractéristiques fondamentales du système morpho-génétique des pays tropicaux humides. L’inf. Géogr. 1961, 25, 155–169. [Google Scholar] [CrossRef]
- Harcombe, P.A. Soil Nutrient Loss as a Factor in Early Tropical Secondary Succession. Biotropica 1980, 12, 8–15. [Google Scholar] [CrossRef]
- Buringh, P. Introduction to the Study of Soils in Tropical and Subtropical Regions, 3rd ed.; Centre for Agricultural Publishing and Documentation: Wageningen, The Netherlands, 1979; p. 148. [Google Scholar]
- Mahecha-Pulido, J.D.; Trujillo-González, J.M.; Torres-Mora, M.A. Análisis de estudios en metales pesados en zonas agrícolas de Colombia. Orinoquia 2017, 21, 83–93. [Google Scholar] [CrossRef]
- Muir, A. The Soils of Equatorial Regions. Nature 1945, 156, 93–95. [Google Scholar] [CrossRef]
- Mohr, E.C.J.; Van Baren, F.A.; Van Sehuylenborgh, J. Tropical soils. Soil Sci. 1975, 119, 472. [Google Scholar] [CrossRef]
- Sanchez, P.A.; Buol, S.W. Soils of the Tropics and the World Food Crisis. Science 1975, 188, 598–603. [Google Scholar] [CrossRef]
- CORMACARENA. Plan de Ordenación y Manejo de la Cuenca del río Acacias–Pajure; Villavicencio, Documento técnico; Corporación para el Desarrollo Sostenible del Área de Manejo Especial La Macarena, 2012; 160p. Available online: https://www.cormacarena.gov.co/gestion-de-planificacion/pomcas/ (accessed on 15 December 2021).
- IGAC. Estudio General de Suelos y Zonificación de Tierras de Meta. Estudio General; Instituto Geográfico Agustín Codazzi: Bogotá, Colombia, 2004.
- Alvarado, S. Cartografía Geológica de la Zona Centro y Sur del Departamento del Meta Planchas 217, 286, 287, 288, 289, 290, 307, 308 y 309 a Escala 1:100.000; INGEOMINAS: Bogotá, Colombia, 2009. Available online: https://catalogo.sgc.gov.co/cgi-bin/koha/opac-detail.pl?biblionumber=48919 (accessed on 3 March 2021).
- Gómez, J. Mapa Geológico de Colombia; INGEOMINAS: Bogotá, Colombia, 2007.
- López, E. Aspectos más Relevantes de la Geomorfología y Geología del Piedemonte Llanero de Colombia; INGEOMINAS: Bogotá, Colombia, 2004.
- Cuatrecasas, J. Aspectos de la vegetación natural de Colombia. Perez-Arbelaezia 1989, 2, 155–283. [Google Scholar]
- Cuesta, F.; Peralvo, M.; Valarezo, N. Programa Regional ECOBONA-Intercooperation. Los bosques montanos de los Andes Tropicales; ECOBONA: Quito, Ecuador.
- Bouyoucos, G. Hydrometer method improvement for making particle size analysis of soils. Agron. J. 1962, 54, 179–181. [Google Scholar] [CrossRef]
- van Reeuwijk, L. Procedures for Soil Analysis, 6th ed.; FAO: Rome, Italy, 2002. [Google Scholar]
- Walkley, A.; Black, C. An examination of the Degtjareff method for determining soil organic matter and modifying the chromic acid method. Soil Sci. 1934, 37, 29–33. [Google Scholar] [CrossRef]
- Olsen, S.; Cole, C.; Watanabe, F.; Dean, L. Estimation of Available Phosphorus in Soils by Extraction with Sodium Bicarbonate. USDA Circular 93; U.S. Govt. Printing: Washington, DC, USA, 1954; pp. 1–19.
- Sumner, M.E.; Miller, W.P. Cation exchange capacity and exchange coefficients. In Methods of Soil Analysis. Part 3. Chemical Methods; Bingham, J.M., Ed.; ASA-SSSA: Madison, WI, USA, 1996. [Google Scholar]
- Pieri, C.J. Fertility of Soils: A Future for Farming in the West African Savannah; Springer Science & Business Media: Berlin/Heidelberg, Germany, 2012; Volume 10. [Google Scholar]
- Remy, J.C. Marin-Laflèche. L’analyse de terre: Réalisation d’un program d’interpretation automatique. Ann. Agron. 1974, 25, 607–632. [Google Scholar]
- Forestier, J. Fertilite des sols des cafeieres en RCA. Agron. Trop. 1960, XIV, 306–348. [Google Scholar]
- Kamprath, E.J. Exchangeable aluminium as a criterion for limiting leached mineral soils. Soils Soc. Am. Proc. 1970, 24, 252–254. [Google Scholar] [CrossRef]
- Beernaert, F.; Bitondo, D. Simple and practical methods to evaluate analytical data of soil profiles. Maputo Mozamb. 1990, 25, 145–150. [Google Scholar]
- Soil Survey Staff Keys to Soil Taxonomy, 12th ed.; United States Govt Printing Office: Washington, DC, USA, 2014; pp. 161–323.
- IUSS Working Group WRB. World Reference Base for Soil Resources 2014, Update 2015. International Soil Classification System for Naming Soils and Creating Legends for Soil Maps. World Soil Resources Reports No. 106. FAO, 2015, Rome. Available online: http://www.fao.org/3/i3794en/I3794en.pdf (accessed on 4 March 2022).
- Sutradhar, A.; Lollato, R.; Butchee, K.; Arnall, D.B. Determining Critical Soil pH for Sunflower Production. Int. J. Agron. 2014, 2014, 1–13. [Google Scholar] [CrossRef] [Green Version]
- Kochian, L.V.; Piñeros, M.A.; Hoekenga, O.A. The Physiology, Genetics and Molecular Biology of Plant Aluminum Resistance and Toxicity. Plant Soil 2005, 274, 175–195. [Google Scholar] [CrossRef]
- Påhlsson, A.M.B. Influence of aluminium on biomass, nutrients, soluble carbohydrates and phenols in beech (Fagus sylvatica). Physiol. Plant. 1990, 78, 79–84. [Google Scholar] [CrossRef]
- Hazelton, P.; Murphy, B. Interpreting Soil Test Results: What Do All the Numbers Mean? CSIRO: 2016. Available online: http://www.agrifs.ir/sites/default/files/Interpreting%20Soil%20Test%20Results,%20What%20Do%20All%20The%20Numbers%20Mean%20%7BPam%20Hazelton%7D%20%5B9780643092259%5D%20(CSIRO%20Publishing%20-%202007).pdf (accessed on 4 March 2022).
- Wang, Q.; Li, Y. Phosphorus adsorption and desorption behavior on sediments of different origins. J. Soils Sediments 2010, 10, 1159–1173. [Google Scholar] [CrossRef]
- Guedes, R.S.; Melo, L.; Vergutz, L.; Rodríguez-Vila, A.; Covelo, E.F.; Fernandes, A.R. Adsorption and desorption kinetics and phosphorus hysteresis in highly weathered soil by stirred flow chamber experiments. Soil Tillage Res. 2016, 162, 46–54. [Google Scholar] [CrossRef]
- Fink, J.R.; Inda, A.V.; Bayer, C. Mineralogy and phosphorus adsorption in soils of south and central-west Brazil under conventional and no-tillage systems. Acta Scientiarum. Agron. 2014, 36, 379. [Google Scholar] [CrossRef] [Green Version]
- Olson, R.A.; Englestad, O.P. Soil Phosphorus and Sulfur. Soils of the Humid Tropics; National Academy of Sciences: Washington, DC, USA, 1972; pp. 82–101. [Google Scholar]
- McClung, A.C.; de Freitas, L.M.M.; Lott, W.L. Analysis of several Brazilian soils in relation to plant responses to sulfur. Soil Sci. Soc. Am. Proc. 1959, 23, 221–224. [Google Scholar] [CrossRef]
- Nahon, D. Weathering in tropical zone. Significance through ancient and still active mechanisms. Comptes Rendus Géosci. 2003, 335, 1109–1119. [Google Scholar] [CrossRef]
- Tardy, Y. Pétrologie des latérites et des sols tropicaux. Masson 1993, 459. Available online: https://www.documentation.ird.fr/hor/fdi:38818 (accessed on 10 March 2022).
- Duzgoren-Aydin, N.; Aydin, A.; Malpas, J. Re-assessment of chemical weathering indices: Case study on pyroclastic rocks of Hong Kong. Eng. Geol. 2002, 63, 99–119. [Google Scholar] [CrossRef]
- Price, J.R.; Velbel, M.A. Chemical weathering indices applied to weathering profiles developed on heterogeneous felsic metamorphic parent rocks. Chem. Geol. 2003, 202, 397–416. [Google Scholar] [CrossRef]
- Dengiz, O.; Sağlam, M.; Özaytekin, H.H.; Baskan, O. Weathering rates and some physico-chemical characteristics of soils developed on a calcic toposequences. Carpathian J. Earth Environ. Sci. 2013, 8, 13–24. [Google Scholar]
- Nesbitt, Y.W.; Young, G.M. Early Proterozoic climates and plate motions inferred from major element chemistry of lutites. Nature 1982, 299, 715–717. [Google Scholar] [CrossRef]
- Harnois, L. The CIW index: A new chemical index of weathering. Sediment. Geol. 1988, 55, 319–322. [Google Scholar] [CrossRef]
- Fedo, C.M.; Nesbitt, H.W.; Young, G.M. Unraveling the effects of potassium metasomatism in sedimentary rocks and paleosols with implications for paleoweathering conditions and provenance. Geology 1995, 23, 921–924. [Google Scholar] [CrossRef]
- Ao, H.; Deng, C.; Dekkers, M.J.; Sun, Y.; Liu, Q.; Zhu, R. Pleistocene environmental evoluation in the Nihewan Basin and implication for early human colonization of North China. Quat. Int. 2010, 223, 472–478. [Google Scholar] [CrossRef]
- Johannes, A.; Matter, A.; Schulin, R.; Weisskopf, P.; Baveye, P.; Boivin, P. Corrigendum to “Optimal organic carbon values for soil structure quality of arable soils. Does clay content matter?”. Geoderma 2017, 302, 111. [Google Scholar] [CrossRef]
- Wei, J.; Fan, W.; Yu, Y.; Mao, X. Polarimetric Decomposition Parameters for Artificial Forest Canopy Biomass Estimation Using GF-3 Fully Polarimetric SAR Data. Sci. Silvae Sin. 2020, 56, 174–183. (In Chinese) [Google Scholar] [CrossRef]
- Schjønning, P.; de Jonge, L.; Munkholm, L.; Moldrup, P.; Christensen, B.; Olesen, J. Clay Dispersibility and Soil Friability-Testing the Soil Clay-to-Carbon Saturation Concept. Vadose Zone J. 2012, 11. [Google Scholar] [CrossRef]
- Jensen, J.L.; Schjønning, P.; Watts, C.; Christensen, B.T.; Peltre, C.; Munkholm, L.J. Relating soil C and organic matter fractions to soil structural stability. Geoderma 2018, 337, 834–843. [Google Scholar] [CrossRef]

| Soil Aggregate Stability Index (ISS) | Soil Sealing Index (IB) | ||
|---|---|---|---|
| Value | Category | Value | Category |
| ISS > 9% | Stable structure | IB < 1.4 | Soils with no thrust risk and with no erosion risk |
| 7% < ISS ≤ 9 | Low structural degradation risk | 1.4 < IB ≤ 1.6 | Soils with a low erosion risk |
| 5% < ISS ≤ 7% | High degradation risk | 1.6 < IB ≤ 1.8 | Soils with a medium erosion riskf |
| ISS ≤ 5% | Structurally degraded soil | IB ≥ 1.8 | Soils with high erosion risk |
| Forestier Index (IF) | Kamprath Index (m) | ||
| Value | Category | Value | Category |
| IF < 1.5 | Soils with low nutrient reserves | m < 20% | Soils with aluminium toxicity |
| IF > 1.5 | Soils with good nutrient reserves. | 20 < m (%) < 50 | Soils with high aluminium toxicity |
| m > 50% | Soils with very high aluminium toxicity | ||
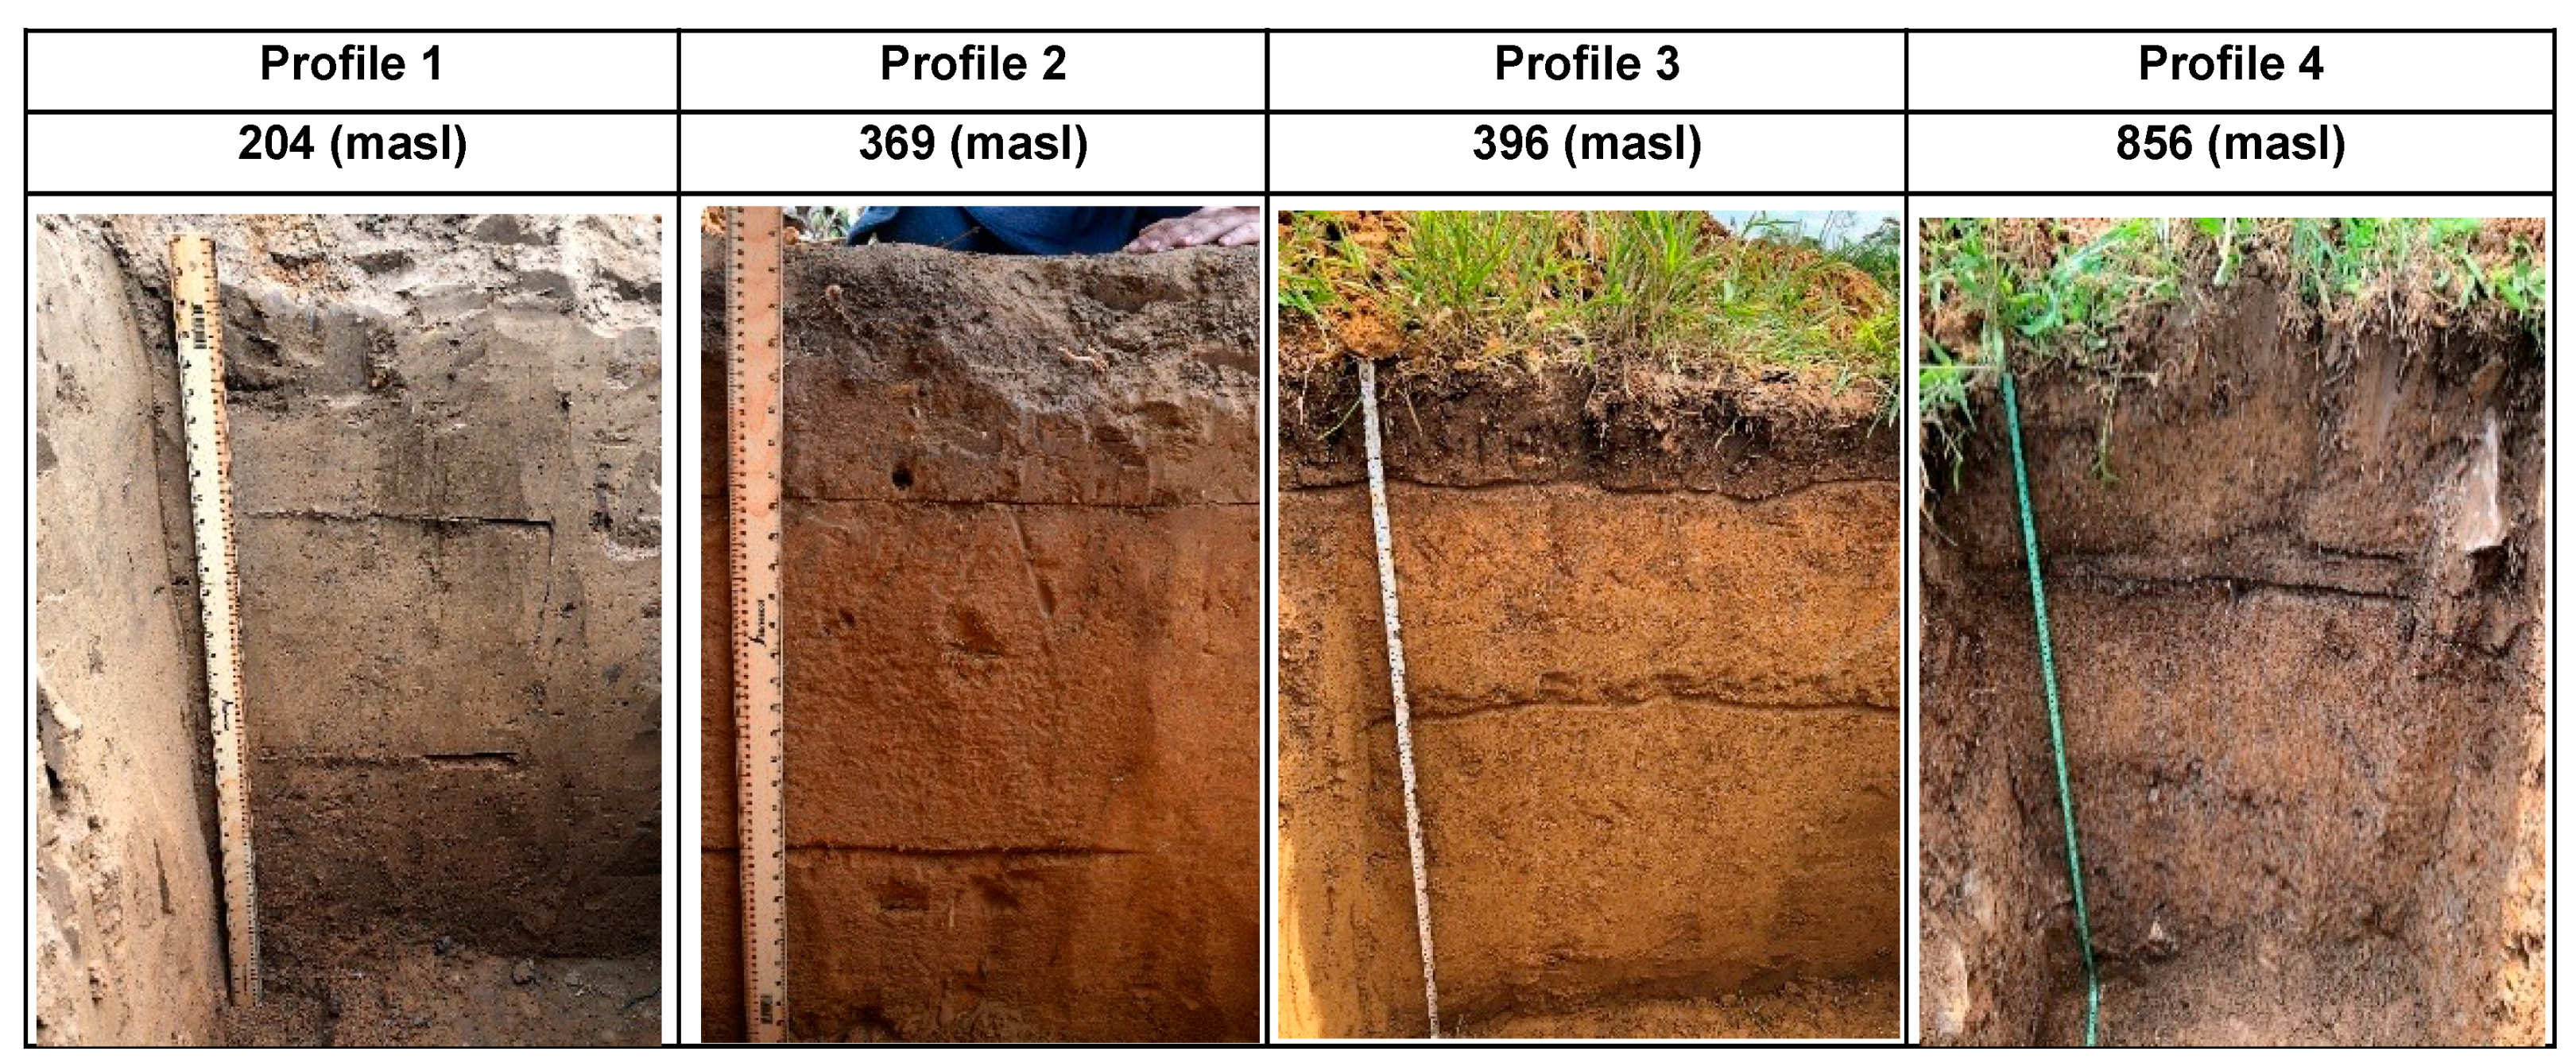
| Profile | Altitude (m.a.s.l.) | Coordinates | Soil Use | Parent Material/ Relief | Soil Type (Soil Taxonmy) | Morphology | Color |
|---|---|---|---|---|---|---|---|
| 1 | 204 | 3°52′47.2″ N 73°08′13.0″ W | Palm oil cultivation | Alluvial sediments /Flat | Oxic Dystrudepts | Ap (0–25 cm) Bw (25–56 cm) C (56–100 cm) | 5YR3/2 5YR5/3 |
| 2 | 369 | 3°54′51.5″ N 73°36′06.3″ W | Banana cultivation | Sandstone/ Flat | Typic Hapludox | Ap (0–21 cm) Bw (21–54 cm) C (54–80 cm) | 5YR3/2 5YR5/6 |
| 3 | 396 | 3°56′39.1″ N 73°47′08.6″ W | Pastures | Sandstone/Somewhat steep (>30%) | Oxic Dystrudepts | Ah (0–13 cm) Bw (13–43 cm) C (43–100 cm) | 5YR4/4 7,5YR7/4 |
| 4 | 856 | 3°57′0.8″ N 73°49′42.3″ W | Pastures | Sandstone/Steep (>30%) | Typic Udorthent | A (0–25 cm) C (25–75 cm) | 5YR3/2 5YR7/4 |
| Altitude (m) | 204 | 369 | 396 | 856 | ||||
| Profile 1 Oxic Dystrudepts | Profile 2 Typic Hapludox | Profile 3 Oxic Dystrudepts | Profile 4 Typic Udorthent | |||||
| Ap | ABw | Ap | Bw | Ah | ABw | Ah | C | |
| Depth (cm) | 0–25 | 25–56 | 0–21 | 21–54 | 0–13 | 13–46 | 0–24 | 24–100 |
| Sand (%) | 31.96 | 29.83 | 56.28 | 38.02 | 70.43 | 54.11 | 51.57 | 90.74 |
| Fine silt (%) | 42.03 | 37.51 | 20.11 | 35.35 | 12.52 | 19.67 | 17.45 | 6.39 |
| Coarse silt (%) | 1.00 | 1.00 | 0.50 | 2.00 | 0.00 | 1.00 | 1.00 | 0.00 |
| Clay (%) | 25.01 | 31.66 | 23.11 | 24.63 | 17.05 | 25.22 | 29.98 | 2.87 |
| Texture | Loam | Sandy loam | Sandy-Clay-Loam | Sandy-Clay- Loam | Sandy-Loam | Sandy-Clay- Loam | Sandy-Clay-Loam | Sandy |
| Organic Matter (%) | 1.97 | 1.48 | 1.55 | 0.2 | 1.93 | 1.90 | 2.24 | 0.55 |
| Soil Organic Carbon (%) | 1.14 | 0.86 | 0.90 | 0.2 | 1.12 | 1.10 | 1.13 | 0.34 |
| pH (destilled water 1:2.5) | 4.74 | 4.94 | 4.64 | 4.77 | 4.94 | 4.11 | 5.00 | 4.09 |
| Electrical conductivity (dS/m) | 0.16 | 0.10 | 0.17 | 0.11 | 0.10 | 0.27 | 0.10 | 0.20 |
| P (mg/kg) | 8.36 | 7.90 | 5.76 | <3.87 | 54.11 | 23.81 | 12.5 | 7.15 |
| S (mg/kg) | 12.57 | 6.11 | 4.23 | 2.37 | 1.82 | 0.76 | 3.01 | 2.11 |
| ECEC (cmol/kg) | 3.77 | 4.97 | 3.22 | 4.14 | 3.41 | 4.03 | 10.84 | 8.91 |
| S (bases) (cmol/kg) | 1.35 | nd | 2.80 | nd | 0.58 | nd | 2.05 | nd |
| H + Al Int. (cmol/kg) | 2.42 | nd | 2.23 | nd | 2.83 | nd | 8.79 | nd |
| Al(KCl) (cmol/kg) | 2.09 | nd | 1.60 | nd | 2.18 | nd | 8.59 | nd |
| AlSat | 55.0 | nd | 60.0 | nd | 64.0 | nd | 70.0 | nd |
| Soil Index | |||||
|---|---|---|---|---|---|
| Soil Profile | ISS | IF | Al | Soil Fertility (CEC) | S |
| 1 Oxic Dystrudepts | 2.89 | 0.03 | 55 | Very low value | Very low value |
| 2 Typic Hapludox | 3.54 | 0.18 | 60 | Very low value | Low value |
| 3 Oxic Dystrudepts | 6.52 | 0.01 | 64 | Very low value | Very low value |
| 4 Typic Udorthent | 4.62 | 0.08 | 70 | Average value | High value |
| Profile | Oxides (mg/kg) | Weathering Index | ||||||
|---|---|---|---|---|---|---|---|---|
| Al2O3 | CaO | Na2O | K2O | CIA | CIW | PIA | SOC/Clay Ratio | |
| 1 | 25,640 | 209.4 | 139.0 | 928.3 | 96.8 | 99.0 | 94.6 | 0.045 |
| 2 | 45,040 | 192.6 | 70.42 | 498.7 | 98.9 | 100 | 98.2 | 0.038 |
| 3 | 13,330 | 121.8 | 77.33 | 1121 | 94.0 | 98.9 | 89.0 | 0.065 |
| 4 | 30,260 | 552.1 | 130 | 28.77 | 98.3 | 98 | 98.3 | 0.037 |
Publisher’s Note: MDPI stays neutral with regard to jurisdictional claims in published maps and institutional affiliations. |
© 2022 by the authors. Licensee MDPI, Basel, Switzerland. This article is an open access article distributed under the terms and conditions of the Creative Commons Attribution (CC BY) license (https://creativecommons.org/licenses/by/4.0/).
Share and Cite
Trujillo-González, J.M.; Torres-Mora, M.A.; García-Navarro, F.J.; Jiménez-Ballesta, R. A Pedological Catenal Characterization along Steeply Sloped and Perhumid Regions: The Case Study of Piedemonte Llanero, Colombia. Agriculture 2022, 12, 401. https://doi.org/10.3390/agriculture12030401
Trujillo-González JM, Torres-Mora MA, García-Navarro FJ, Jiménez-Ballesta R. A Pedological Catenal Characterization along Steeply Sloped and Perhumid Regions: The Case Study of Piedemonte Llanero, Colombia. Agriculture. 2022; 12(3):401. https://doi.org/10.3390/agriculture12030401
Chicago/Turabian StyleTrujillo-González, Juan Manuel, Marco Aurelio Torres-Mora, Francisco J. García-Navarro, and Raimundo Jiménez-Ballesta. 2022. "A Pedological Catenal Characterization along Steeply Sloped and Perhumid Regions: The Case Study of Piedemonte Llanero, Colombia" Agriculture 12, no. 3: 401. https://doi.org/10.3390/agriculture12030401