
Age- and Sex-Related Changes in Body Weight, Muscle, and Tibia in Growing Chinese Domestic Geese (Anser domesticus)


Abstract
:1. Introduction
2. Materials and Methods
2.1. Birds and Housing
2.2. Sample Collection
2.3. Tibia Parameters
2.4. Statistical Analysis
3. Results
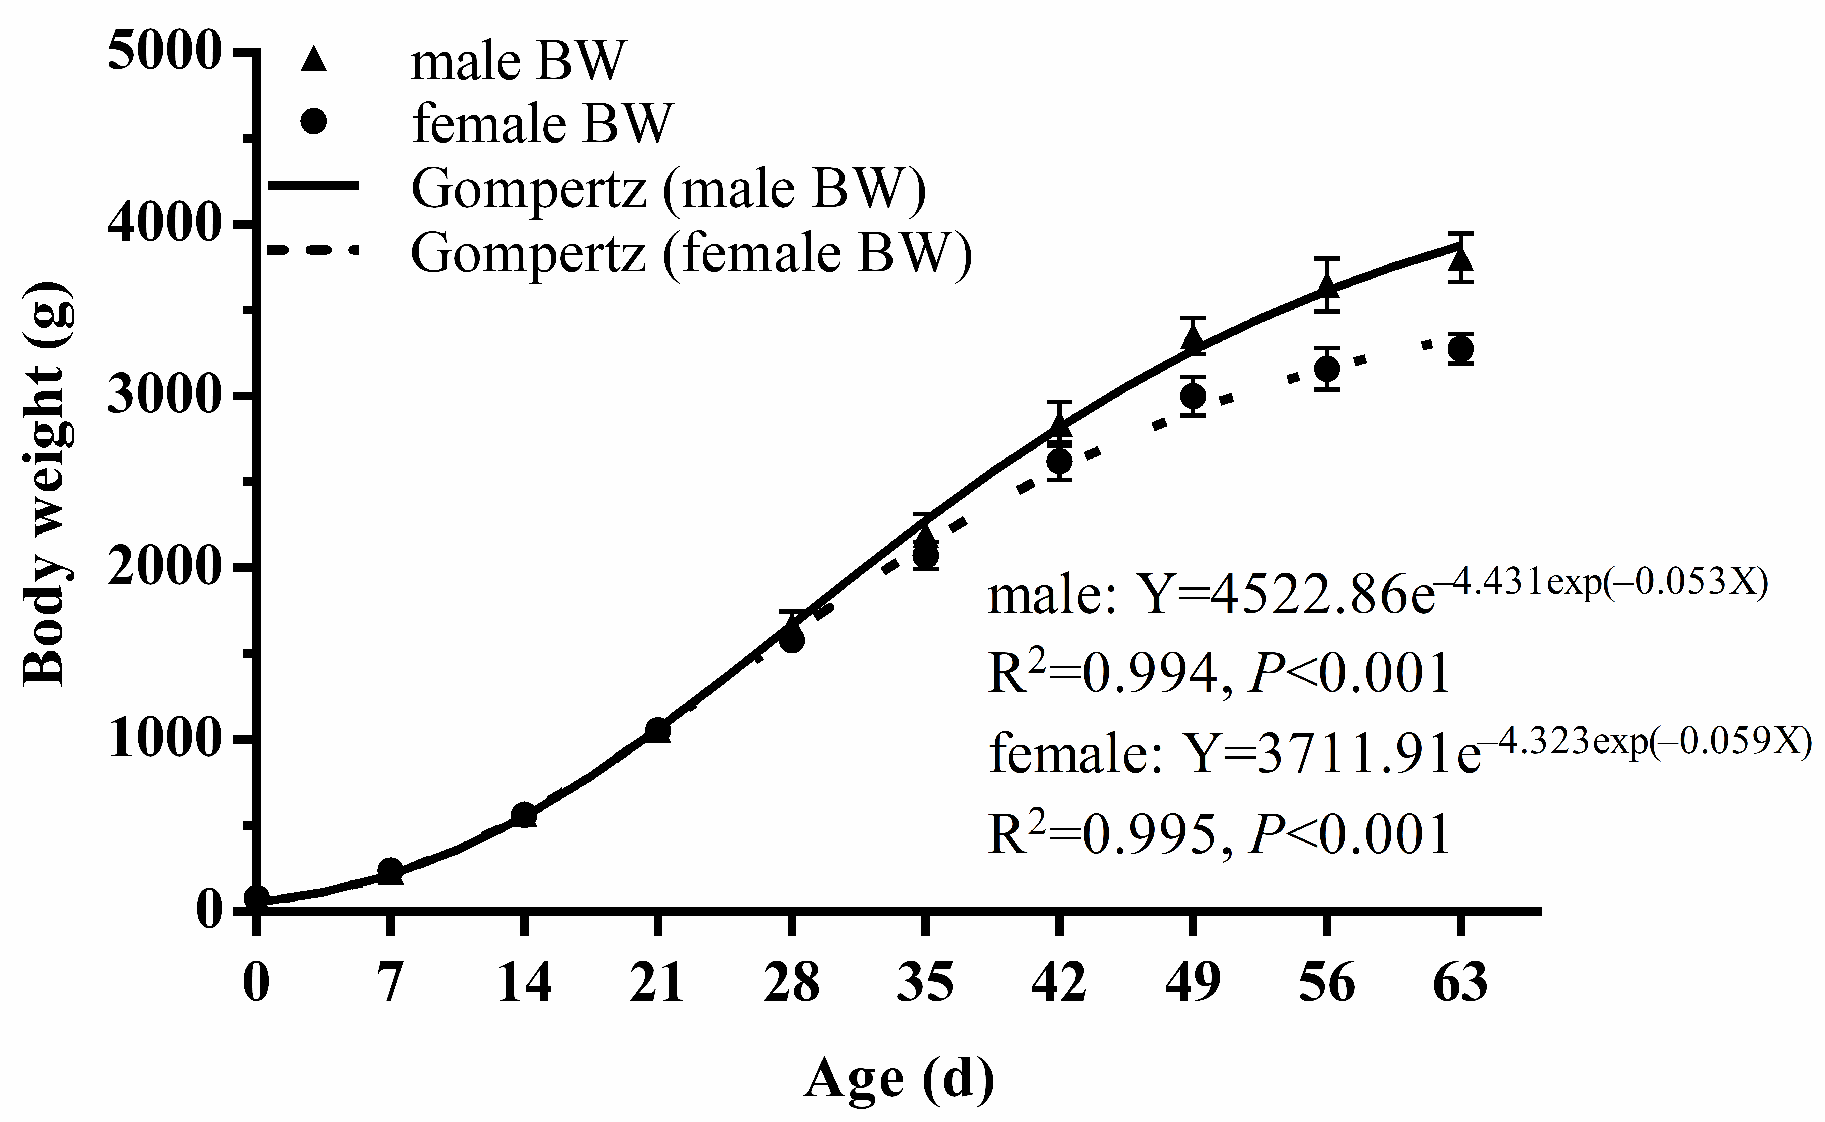
3.1. Body Weight
3.2. Breast and Leg Muscles
3.3. Tibia Parameters
4. Discussion
5. Conclusions
Supplementary Materials
Author Contributions
Funding
Institutional Review Board Statement
Informed Consent Statement
Data Availability Statement
Conflicts of Interest
References
- Charuta, A.; Cooper, R.G. Computed tomographic and densitometric analysis of tibiotarsal bone mineral density and content in postnatal Peking ducks (Anas platyrhynchos var. domestica) as influenced by age and sex. Pol. J. Vet. Sci. 2012, 15, 537–545. [Google Scholar] [CrossRef] [PubMed]
- Bochno, R.; Brzozowski, W.; Murawska, D. Age-related changes in the distribution of meat, fat with skin and bones in broiler chicken carcasses. Pol. J. Nat. Sci. 2003, 14, 335–345. [Google Scholar]
- Murawska, D. The effect of age on the growth rate of tissues and organs and the percentage content of edible and nonedible carcass components in Pekin ducks. Poult. Sci. 2012, 91, 2030–2038. [Google Scholar] [CrossRef]
- Boz, M.A.; Oz, F.; Yamak, U.S.; Sarica, M.; Cilavdaroglu, E. The carcass traits, carcass nutrient composition, amino acid, fatty acid, and cholesterol contents of local Turkish goose varieties reared in an extensive production system. Poult. Sci. 2019, 98, 3067–3080. [Google Scholar] [CrossRef] [PubMed]
- Yu, J.; Yang, H.M.; Lai, Y.Y.; Wan, X.L.; Wang, Z.Y. The body fat distribution and fatty acid composition of muscles and adipose tissues in geese. Poult. Sci. 2020, 99, 4634–4641. [Google Scholar] [CrossRef] [PubMed]
- Orban, J.; Adeola, O.; Stroshine, R. Microbial phytase in finisher diets of White Pekin ducks: Effects on growth performance, plasma phosphorus concentration, and leg bone characteristics. Poult. Sci. 1999, 78, 366–377. [Google Scholar] [CrossRef] [PubMed]
- Williams, B.; Waddington, D.; Murray, D.H.; Farquharson, C. Bone strength during growth: Influence of growth rate on cortical porosity and mineralization. Calcif. Tissue Int. 2004, 74, 236–245. [Google Scholar] [CrossRef] [PubMed]
- Charuta, A.; Tatara, R.M.; Dzierzecka, M.; Polawska, E.; Ptaszynska Sarosiek, I. Interrelationships of body weight and bone weight with densitometric properties of tibiotarsal bone in geese during post-hatching development. Vet. Med. Czech 2015, 60, 682–690. [Google Scholar] [CrossRef] [Green Version]
- Bochno, R.; Brzozowski, W.; Murawska, D. Age-related changes in the distribution of lean fat with skin and bones in goose carcasses. Poult. Sci. 2005, 46, 199–203. [Google Scholar] [CrossRef]
- Shi, S.R.; Wang, Z.Y.; Yang, H.M.; Zhang, Y.Y. Nitrogen requirement for maintenance in Yangzhou goslings. Br. Poult. Sci. 2007, 48, 205–209. [Google Scholar] [CrossRef]
- Wang, Z.Y.; Shi, S.R.; Zhou, Q.Y.; Yang, H.M.; Zou, J.M.; Zhang, K.N.; Han, H.M. Response of growing goslings to dietary methionine from 28 to 70 days of age. Br. Poult. Sci. 2010, 51, 118–121. [Google Scholar] [CrossRef] [PubMed]
- Ramos, S.B.; Caetano, S.L.; Savegnago, R.P.; Nunes, B.N.; Ramos, A.A.; Munari, D.P. Growth curves for ostriches (Struthio camelus) in a Brazilian population. Poult. Sci. 2013, 92, 277–282. [Google Scholar] [CrossRef] [PubMed]
- Applegate, T.J.; Lilburn, M.S. Growth of the femur and tibia of a commercial broiler line. Poult. Sci. 2002, 81, 1289–1294. [Google Scholar] [CrossRef] [PubMed]
- Köhn, F.; Sharifi, A.R.; Simianer, H. Modeling the growth of the Goettingen minipig. J. Anim. Sci. 2007, 85, 84–92. [Google Scholar] [CrossRef] [PubMed]
- Knizetova, H.; Hyanek, J.; Veselsky, A. Analysis of growth curves of fowl. III. Geese. Br. Poult. Sci. 1994, 35, 335–344. [Google Scholar] [CrossRef] [PubMed]
- Liu, Z.L.; Huang, Y.; Wang, Q.G.; Peng, X.W.; Wang, Y.M.; Li, J.; Lan, Y.X.; Wang, C. Fitting and analysis of growth curve of body weight, muscle, and digestive tract in Sichuan White geese. Chin. J. Anim. Sci. 2017, 53, 21–27. [Google Scholar]
- Wang, X.; Ma, A. Comparison of four nonlinear growth models for effective exploration of growth characteristics of turbot Scophthalmus maximus fish strain. Afr. J. Biotechnol. 2016, 15, 2251–2258. [Google Scholar]
- Henry, M.H.; Burke, W.H. Sexual dimorphism in broiler chick embryos and embryonic muscle development in late incubation. Poult. Sci. 1998, 77, 728–736. [Google Scholar] [CrossRef]
- Scheuermann, G.N.; Bilgili, S.F.; Hess, J.B.; Mulvaney, D.R. Breast muscle development in commercial broiler chickens. Poult. Sci. 2003, 82, 1648–1658. [Google Scholar] [CrossRef]
- Williams, B.; Solomon, S.; Waddington, D.; Thorp, B.; Farquharson, C. Skeletal development in the meat-type chicken. Br. Poult. Sci. 2000, 41, 141–149. [Google Scholar] [CrossRef]
- Rath, N.C.; Balog, J.M.; Huff, W.E.; Huff, G.R.; Kulkarni, G.B.; Tierce, J.F. Comparative differences in the composition and biomechanical properties of tibiae of seven- and seventy-two-week-old male and female broiler breeder chickens. Poult. Sci. 1999, 78, 1232–1239. [Google Scholar] [CrossRef] [PubMed]
- Komosa, M.; Purzyc, H.; Wojnar, M.; Frackowiak, H.; Kobryńczuk, F. Navicular syndrome in sport horses as a result of the disorder of biological bone tissue turnover rhythm: A review. Biol. Rhythm. Res. 2013, 44, 339–351. [Google Scholar] [CrossRef]
- Charuta, A.; Dzierzęcka, M.; Czerwiński, E.; Cooper, R.G.; Horbańczuk, J.O. Sex- and age-related changes of trabecular bone of tibia in growing domestic geese (Anser domesticus). Folia Biol. Krakow 2012, 60, 205–212. [Google Scholar] [CrossRef] [PubMed]
- Rath, N.C.; Huff, G.R.; Huff, W.E.; Balog, J.M. Factors regulating bone maturity and strength in poultry. Poult. Sci. 2000, 79, 1024–1032. [Google Scholar] [CrossRef]
- Lilburn, M.S. Skeletal growth of commercial poultry species. Poult. Sci. 1994, 73, 897–903. [Google Scholar] [CrossRef]
- Zhang, H.Y.; Zeng, Q.F.; Bai, S.P.; Wang, J.P.; Ding, X.M.; Xuan, Y.; Su, Z.W.; Fraley, G.S.; Zhang, K.Y. Study on the morphology and mineralization of the tibia in meat ducks from 1 to 56 d. Poult. Sci. 2019, 98, 3336–3355. [Google Scholar] [CrossRef]


| Item | 0 to 21 d | 22 to 42 d | 43 to 63 d |
|---|---|---|---|
| Ingredient (%) | |||
| Corn | 58.00 | 59.30 | 59.50 |
| Soybean meal, 43.15% CP | 30.20 | 25.10 | 23.70 |
| Wheat bran, 15.3% CP | 4.80 | 4.40 | 4.70 |
| Rice husk, 3.03% CP | 3.40 | 7.60 | 8.50 |
| Limestone | 0.80 | 0.80 | 0.70 |
| Dicalcium phosphate | 1.40 | 1.40 | 1.50 |
| DL-Methionine | 0.10 | 0.10 | 0.10 |
| Salt | 0.30 | 0.30 | 0.30 |
| Premix | 1.00 1 | 1.00 2 | 1.00 2 |
| Total | 100.00 | 100.00 | 100.00 |
| Calculated value (%) | |||
| ME (MJ/kg) | 11.32 | 11.12 | 11.06 |
| Crude protein (CP) | 19.04 | 17.02 | 16.51 |
| Crude fiber | 4.54 | 6.08 | 6.42 |
| Calcium | 0.83 | 0.83 | 0.82 |
| Total phosphorus | 0.71 | 0.69 | 0.71 |
| Methionine | 0.38 | 0.35 | 0.34 |
| Lysine | 0.97 | 0.83 | 0.80 |
| Sex | Statistical Measure | Age (Days) | |||||||||
|---|---|---|---|---|---|---|---|---|---|---|---|
| 0 | 7 | 14 | 21 | 28 | 35 | 42 | 49 | 56 | 63 | ||
| Male (n = 8) | Mean | 80.21 j | 235.87 i | 569.67 h | 1060.72 g | 1664.49 f* | 2194.16 e* | 2838.61 d* | 3352.31 c* | 3649.11 b* | 3804.62 a* |
| SD | 0.81 | 18.65 | 38.03 | 64.50 | 82.14 | 120.93 | 132.16 | 104.57 | 153.71 | 144.67 | |
| Female (n = 8) | Mean | 79.61 j | 238.68 i | 565.94 h | 1056.71 g | 1582.50 f | 2072.07 e | 2622.39 d | 3002.67 c | 3160.89 b | 3275.60 a |
| SD | 0.70 | 9.73 | 18.81 | 41.20 | 63.49 | 82.06 | 107.39 | 114.77 | 119.69 | 88.27 | |
| Average (n = 16) | Mean | 79.91 j | 237.27 i | 567.81 h | 1058.71 g | 1623.49 f | 2133.11 e | 2730.50 d | 3177.49 c | 3405.00 b | 3540.11 a |
| SD | 0.79 | 14.45 | 29.05 | 52.32 | 82.60 | 118.07 | 161.24 | 209.40 | 285.09 | 296.70 | |
| Item | Sex | Non-Liner Model | R2 | Inflection Point | Asymptotic Value | Fast-Growth Interval (d) | |
|---|---|---|---|---|---|---|---|
| Age (d) | Value | ||||||
| Body weight (g) | Male | Gompertz | 0.994 | 27.92 | 1663.87 | 4522.86 | (10.52, 49.02) |
| Female | Gompertz | 0.995 | 24.88 | 1365.54 | 3711.91 | (8.35, 40.43) | |
| Breast muscle (g) | Male | Logistic | 0.962 | 54.35 | 150.7 | 301.41 | (46.10, 64.91) |
| Female | Logistic | 0.969 | 56.7 | 167.69 | 335.39 | (45.20, 69.15) | |
| Leg muscle (g) | Male | Gompertz | 0.960 | 25.49 | 161.23 | 438.26 | (9.71, 41.26) |
| Female | Logistic | 0.950 | 27.67 | 173.56 | 347.11 | (16.59, 35.58) | |
| Tibia length (mm) | Male | Logistic | 0.997 | 12.29 | 7.73 | 15.46 | (0, 29.89) |
| Female | Logistic | 0.995 | 10.38 | 7.11 | 14.22 | (0, 27.26) | |
| Tibia width (mm) | Male | Logistic | 0.961 | 14.74 | 0.52 | 1.04 | (0, 33.57) |
| Female | Logistic | 0.950 | 12.33 | 0.48 | 0.95 | (0, 31.67) | |
| Tibia fat-free weight (g) | Male | Gompertz | 0.966 | 24.00 | 4.86 | 13.20 | (8.77, 40.85) |
| Female | Gompertz | 0.971 | 22.24 | 3.87 | 10.52 | (7.68, 39.76) | |
| Tibia breaking strength (N) | Male | Gompertz | 0.979 | 27.25 | 269.22 | 731.82 | (8.72, 45.74) |
| Female | Gompertz | 0.975 | 25.98 | 230.54 | 626.67 | (7.47, 44.48) | |
| Tibia ash content (%) | Male | Logistic | 0.918 | 0.01 | 28.89 | 57.78 | (0, 21.18) |
| Female | Logistic | 0.901 | −2.22 | 28.96 | 57.91 | (0, 19.84) | |
Publisher’s Note: MDPI stays neutral with regard to jurisdictional claims in published maps and institutional affiliations. |
© 2022 by the authors. Licensee MDPI, Basel, Switzerland. This article is an open access article distributed under the terms and conditions of the Creative Commons Attribution (CC BY) license (https://creativecommons.org/licenses/by/4.0/).
Share and Cite
Yu, J.; Wan, Y.; Yang, H.; Wang, Z. Age- and Sex-Related Changes in Body Weight, Muscle, and Tibia in Growing Chinese Domestic Geese (Anser domesticus). Agriculture 2022, 12, 463. https://doi.org/10.3390/agriculture12040463
Yu J, Wan Y, Yang H, Wang Z. Age- and Sex-Related Changes in Body Weight, Muscle, and Tibia in Growing Chinese Domestic Geese (Anser domesticus). Agriculture. 2022; 12(4):463. https://doi.org/10.3390/agriculture12040463
Chicago/Turabian StyleYu, Jun, Yu Wan, Haiming Yang, and Zhiyue Wang. 2022. "Age- and Sex-Related Changes in Body Weight, Muscle, and Tibia in Growing Chinese Domestic Geese (Anser domesticus)" Agriculture 12, no. 4: 463. https://doi.org/10.3390/agriculture12040463