Article

Fatigue Analysis of Spike Segment of Special Tractor Wheels in Terms of Design Improvement for Chernozem Soil

1
Institute of Agricultural Engineering, Transport and Bioenergetics, Faculty of Engineering, Slovak University of Agriculture in Nitra, 949 76 Nitra, Slovakia
2
Information and Coordination Centre of Research, Faculty of Engineering, Slovak University of Agriculture in Nitra, 949 76 Nitra, Slovakia
3
Institute of Design and Engineering Technologies, Faculty of Engineering, Slovak University of Agriculture in Nitra, 949 76 Nitra, Slovakia
4
Institute of Electrical Engineering, Automation, Informatics and Physics, Faculty of Engineering, Slovak University of Agriculture in Nitra, 949 76 Nitra, Slovakia
5
Department of Geotechnics, Faculty of Civil Engineering, University of Žilina, 010 26 Žilina, Slovakia
*
Author to whom correspondence should be addressed.
Agriculture 2022, 12(4), 471; https://doi.org/10.3390/agriculture12040471
Submission received: 2 March 2022 / Revised: 23 March 2022 / Accepted: 24 March 2022 / Published: 26 March 2022

Abstract

:
The driving wheels affect the tractive efficiency, fuel consumption, and soil compaction. This study presents the fatigue analysis of a spike segment that is the main part of an innovative driving wheels designed to improve tractor tractive performance. The design improvement was proposed for Chernozem soil allowing the full penetration of spikes. The spike segment was loaded by forces resulting from the maximum drawbar pull at 100% wheel slip and penetrometer resistance. A drawbar pull increase caused by the spike tires was also calculated. The experiments were performed using a subcompact tractor in the first gear on a grass field at soil moisture 18.8%. Gerber theory was used for the fatigue analysis performed using ANSYS software. The dependances of the safety factor on the horizontal rod diameter and the number of load cycles was constructed. The safety factor of 1.73 calculated for the spike segment made of steel S355 is suitable for the reduction of the actual horizontal rod diameter (12 mm). The fatigue analysis showed a safety factor of 1.28 at 100,000 load cycles in the case of a reduced diameter (10 mm). A diameter of 8 mm was also simulated, but the calculated safety factors do not allow it in terms of safe operation.

1. Introduction

Force interactions between the driving wheels and ground affect tractive efficiency and the effectivity of machine operation. Energy used for agrotechnical operations is an input with a high impact on the cost of crop production [1]. An increase in the load acting on the tractor from an implement causes an increase in the slip ratio [2]. It can be illustrated by the increase in tillage depth increasing the driving wheel slip [3,4,5]. The main purpose of tractors is to generate a drawbar pull that varies under operating conditions. The change in drawbar pull depends on the soil properties, agrotechnical operation, and an implement connecting to the tractor [6]. Besides tractor engine power, wheel slip due to soil–tire interactions limits the drawbar pull of the tractor. The forces between the driving wheels and ground depend on the soil properties [7,8,9] and the type of tractor power delivery to the ground (e.g., two-wheel drive, four-wheel drive, crawler tractors, etc.) [10,11,12,13]. The research performed by Reference [14] showed improvement of the tractor tractive efficiency using four rubber tracks. The steel single grouser shoe performed better than the rubber single grouser shoe in traction for the soil used in the study presented by Reference [15].
An effective tractor operation is characterized by the maximum traction output of the tires interacting with the soil [16]. The main tire parameters influencing the performance of the wheels are the tire diameter, tire width, dual tire, tire shape, rubber segments shape, height, angle, spacing, tread material, inflation pressure, tire deflection rim width, and carcass construction [7,17,18]. A decrease in tire inflation pressure extends the tire contact area [19,20,21] to reduce wheel slip and minimize the fuel consumption of the tractor [22,23]. Using a ballast weight, tires with large contact area or change of tire inflation pressure [24,25,26] are conventionally employed to improve vehicle tractive performance. On the other hand, the increase in tractor load can negatively affect the soil compaction after field traffic [27,28,29]. These measures are not useful in the special area of driving wheel applications such as wheeled robots [30] or planetary rovers [31]. In these cases, the ballast weight increases the energy requirements, and wheels with large contact areas increase the dimensions of the machine, which is unacceptable. Cage wheels [32,33] or rigid wheels with grousers [34] use steel segments mounted to steel wheels instead of standard tires. Various diameters and widths of cage wheels have been proposed and tested [35]. The shape, dimensions, and position of grousers affected wheel–soil interactions [36,37,38,39,40]. Replacing a rigid grouser with a movable one, these wheels can be innovated [41]. To improve the tractive properties on a sandy terrain, Reference [42] developed special driving wheels with grousers actively protruded or retracted through the planetary gear. By tuning the sinkage length of an active grouser, the developed wheeled mechanism can dampen the fluctuations of the drawbar pull that arise when using a wheel with fixed grousers. The next innovation of driving wheels with grousers is a Dyna-bite traction system that can be placed over a conventional tractor drive tire. Under the influence of the vertical load and drawbar pull, the device deforms as grousers penetrate the soil [43,44,45]. The Dyna-bite system allows the retraction or protruding of grousers for transportation on a road or an operation on soil.
The special driving wheels mentioned above are widely used to improve the tractive performance, but in most cases, they do not allow standard transportation on a road. Another disadvantage is that these wheels have the same diameters as driving wheels with tires and solid construction, so they need a large storage space when not used on a tractor.
The research mentioned above showed that the steel segments of various special driving wheels essentially influence the force interaction between the wheels and ground. This study is aimed at a new design of special driving wheels to improve the drawbar performance of various vehicles without the need for an increase in vehicle load, change of tire inflation pressure, or wheels with grousers. The fatigue analysis of the spike segment was performed by simulation software ANSYS. The maximum drawbar pulls of the test tractor and penetrometer resistance of the grass field (Chernozem) acting against spike penetration was used to load the spike segment. Based on the safety factor of the actual design, a reduction in the dimensions of the most important part was analyzed [46,47]. Smaller dimensions of the spike segment need smaller space in the tire tread pattern and improve the design of spike tires.
The objectives of this study were (a) an analysis of the spike segment design, which is the main part of spike tires interacting with soil, (b) a selection of alternating stresses to simulate the highest load acting on the spike segment based on the maximum tractor drawbar pull at 100% wheel slip and penetrometer resistance at the relatively low soil moisture of Chernozem, and (c) a proposal of diameter reduction of the spike segment horizontal rod to improve the design of spike tires.

2. Materials and Methods

2.1. Principle of Special Driving Wheels

The principle of the spike tires developed at the Slovak University of Agriculture in Nitra (Slovakia) was published by References [48,49,50]. Special driving wheels (Figure 1) are spike tires using spikes (2) on spike segments (1) to improve the vehicle tractive performance. Spike tires consist of four spike segments. Each segment is placed in a tire groove (9) cut in the tire tread pattern. The test tractor was equipped with 6.5/75–14 bias ply tires (Mitas, a. s., Prague, Czech Republic) with TS-02 tread design and four-ply rating (4PR). The same tire type was used for the special driving wheels. The spike tire allows changing the base and protruded position of the spikes. A carrier wire strand (4) connects the spike segments by the pins (8). This wire strand provides a contact of the spike segments with the tire. The change of the spike segment position is performed by a control lever mechanism (5) and a control wire strand (3). Disconnecting the levers of the control lever mechanism, the control wire strand allows the rotation of spike segments by the pins (7). The connection and disconnection of the control lever mechanism is shown in Figure 1c.
The change of the spike segment position is described in Figure 2. The control lever mechanism (9) consists of four levers. The mechanism freely rotates around the pins in holes (7). The holes (8) are intended for safety screws blocking the mechanism into one of the extreme positions (base or protruded position). The base position of the spike segments is shown in Figure 2a). To change the spike segment position, the safety screws must be loose at first. The levers of the control lever mechanism are disconnected (Figure 2b), and the spike segments can rotate in the tire tread pattern grooves (2). When the spike segments are in the second extreme position (Figure 2c), the position is blocked with the safety screws in the holes (7). The spike segments are automatically protruded due to wheel rotation when the tractor moves forward. Moving the tractor back in the reverse gear, the spikes can be placed back into the base position for road transportation.
Spikes do not interact with the ground when they are in the base position. The spikes in the protruded position are used to improve the drawbar performance during operation on the soil or grass surface. This feature results in two positions of the spikes, namely the base position (Figure 2a) for road transportation and the protruded position (Figure 2c) for field operation.

2.2. Forces Loading the Spike Segment

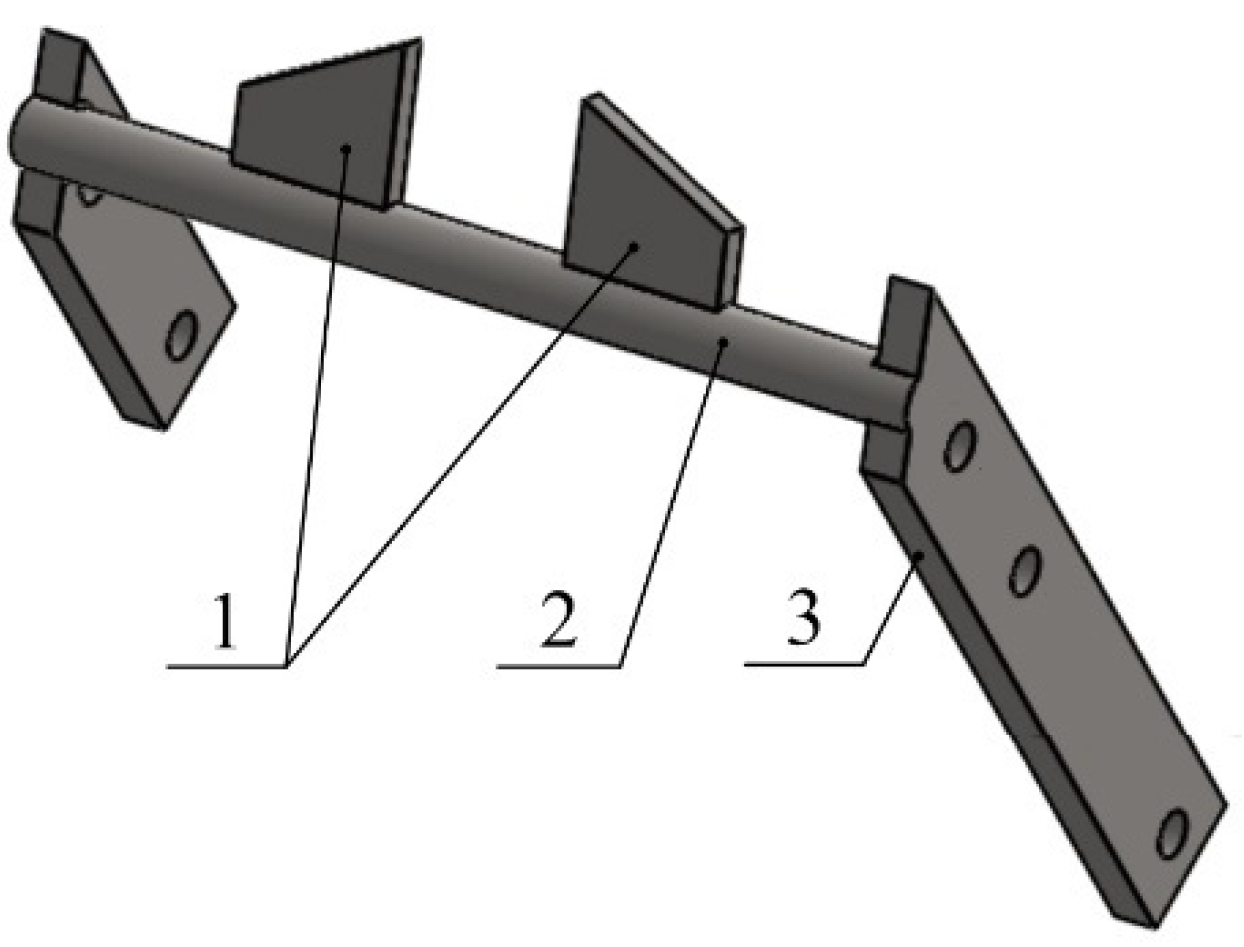
The spike segments are the most critical part of the special driving wheels, because their dimensions must be adapted to the space between the rubber segments of the tire tread pattern. The spikes in the base position are placed in the tire tread pattern so they do not exceed the tire diameter. The slope of spikes corresponds with the orientation of the rubber segments of the tire tread pattern. The dimensions and shape of the spike segment are described in Figure 3. The welding technology used for manufacturing the spike segments requires the selection of steel with good weldability. The material S355 was used for the design of the spike segment.
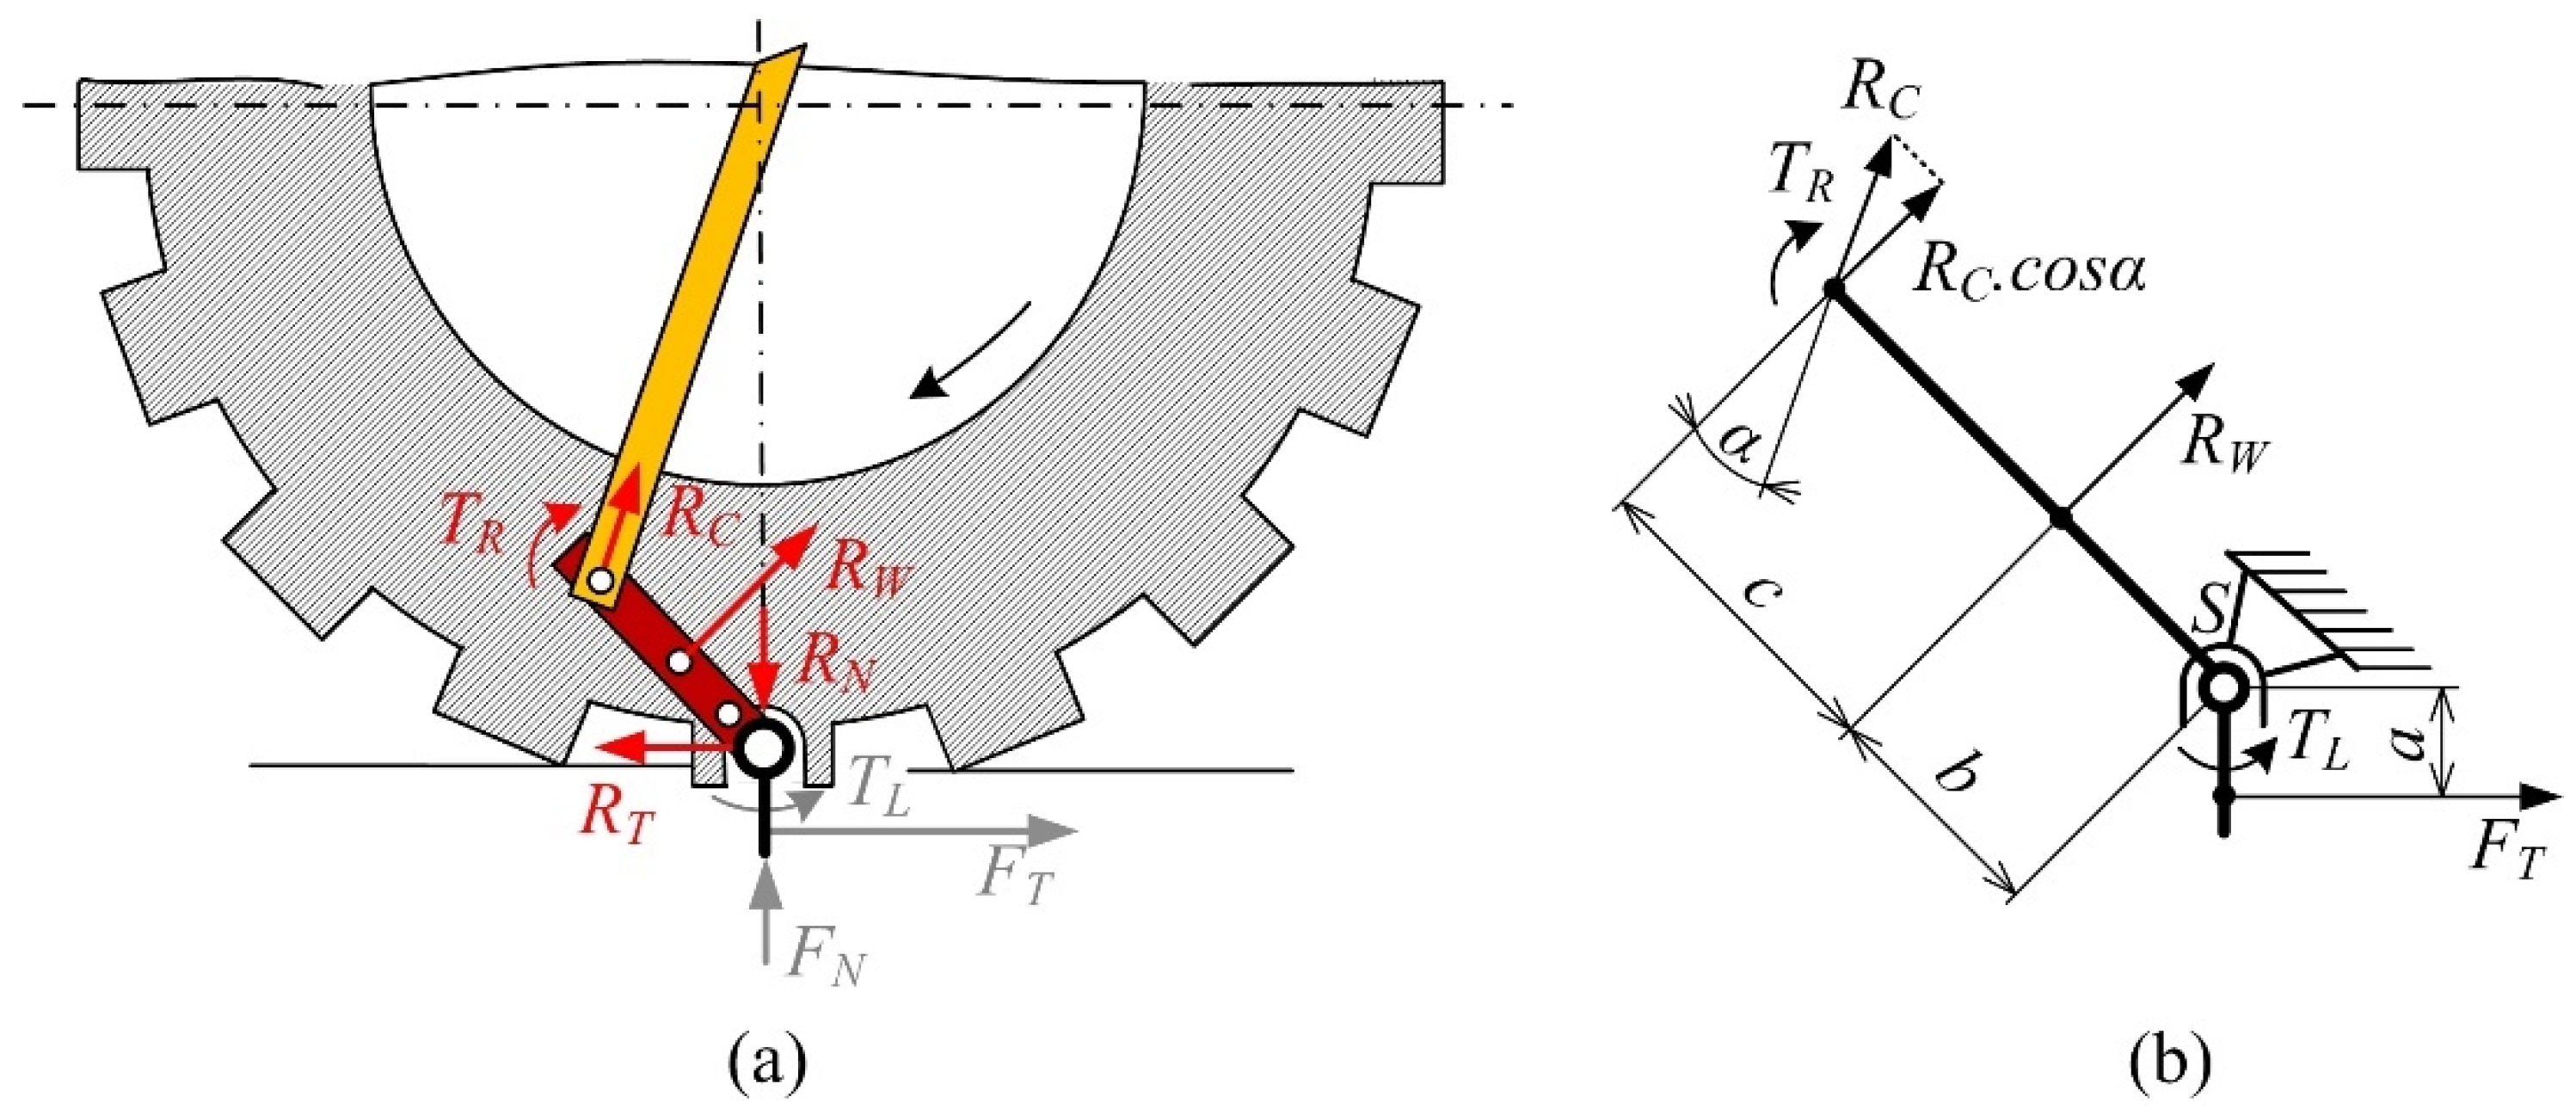
The spike segment is loaded by the two most significant forces (Figure 4):
-
tangential force FT, which acts on the spike segment from the drawbar pull generated by the tractor and
-
normal force FN, which acts when the spike segment penetrates the ground.
When the spikes of the spike segments are in contact with the ground, a tangential force FT loads them due to the drawbar pull generated by the tractor. This force is perpendicular to the spikes and creates a load moment TL acting on the center of the horizontal rod. The second force acting on the spike segment is the normal force FN. This force is caused by spike penetration into the ground. The main reactions act in the grooves of the tire tread pattern. Normal RN and tangential RT reactions support the spike segments in the tire tread pattern. The reaction in the control wire strand RW and in the lever of the control mechanism RC fix the spike segment in the protruded position and do not allow it to turn. These two reactions create a reaction moment TR acting in the opposite direction to the load moment TL. The reaction in the hole for the pins of the carrier wire strand was not considered, because its influence on the interactions between the spikes and ground was negligible. The carrier wire strand was used to hold all the parts of the spike system together and protect it from centrifugal forces.
A balance of moments was expressed from the forces and reactions acting on the spike segment (Figure 4) as follows:
  M S = 0 :   T L T R = 0
  M S = 0 :   F T   · a R W   · b R C   ·   c o s α   ·   ( b + c ) = 0
F T   · a = R W   · b + R C   ·   c o s α   ·   ( b + c ) = 0
where TL—load moment (N. m); TR—reaction moment (N. m); FT—tangential force acting on the spike (N); RW—reaction in the control wire strand (N); RC—reaction in the rod of the control mechanism (N); a, b, and c—the force arms (m); and α—inclination angle of the control lever (°).
The design improvement of the spike segment was analyzed for tractor operations on Chernozem soil. This soil type and sharp shape of the spikes allow the full penetration of the spikes into the ground. Normal force loads the spike segment due to spike penetration into the ground. The penetrometer resistance of the soil affects spike penetration into the ground during the soil–tire interactions. When the spikes penetrate the ground, the tractor wheel is not lifted, and the tire tread pattern is in full contact with the ground. On the other hand, normal force on the spiked tire grouser is less than the regular tire grouser without the spikes, because normal pressure supports an adequate portion of the dynamic rear axle weight and reduces the normal load on the tire grousers on the spike tire by the same amount. With the lower normal force, the maximum tractive effort of the tire rubber grousers of the spike tires is decreased. To simulate the highest load (worst case scenario) acting on the spikes, the drawbar pull difference was calculated from the highest value of the maximums (spike tires) and lowest value of minimums (standard tires) decreased by the percentage of the rear axle weight. The drawbar pulls are experimentally measured at 100% wheel slip to calculate the tangential force needed for a fatigue analysis of the spike segment. The maximum and minimum drawbar pulls were identified in individual measurements.
The load acting on the spikes was estimated with some uncertainty due to the limitations of the methodology. The first one relates the rolling resistance of the test tractor operated according to the “stop-and-go” methodology. Considering the maximum values of the drawbar pulls when the tractor did not move, the rolling resistance was neglected. The second one relates to the position of the spike segments on the left and right wheel. When the spike tires are 180 degrees out of phase, the increase in the tractor drawbar pull is minimal, because the only one spike segment on one wheel is in contact with the ground. On the other hand, if both spike segments are in contact with the ground at the same time, the increase in drawbar pull reaches the highest value. Due to different rotation speeds of the driving wheels during the test, four measurement repetitions allowed the simulation of various positions of the spike segments on the left and right wheels. Highly sophisticated methodology and instrumentation on the spike would be required to estimate the exact value of the force acting on the spike. Therefore, load estimation according to the methodology mentioned above was determined.

2.3. Measurement of Maximum Drawbar Pull at 100% Driving Wheels Slip

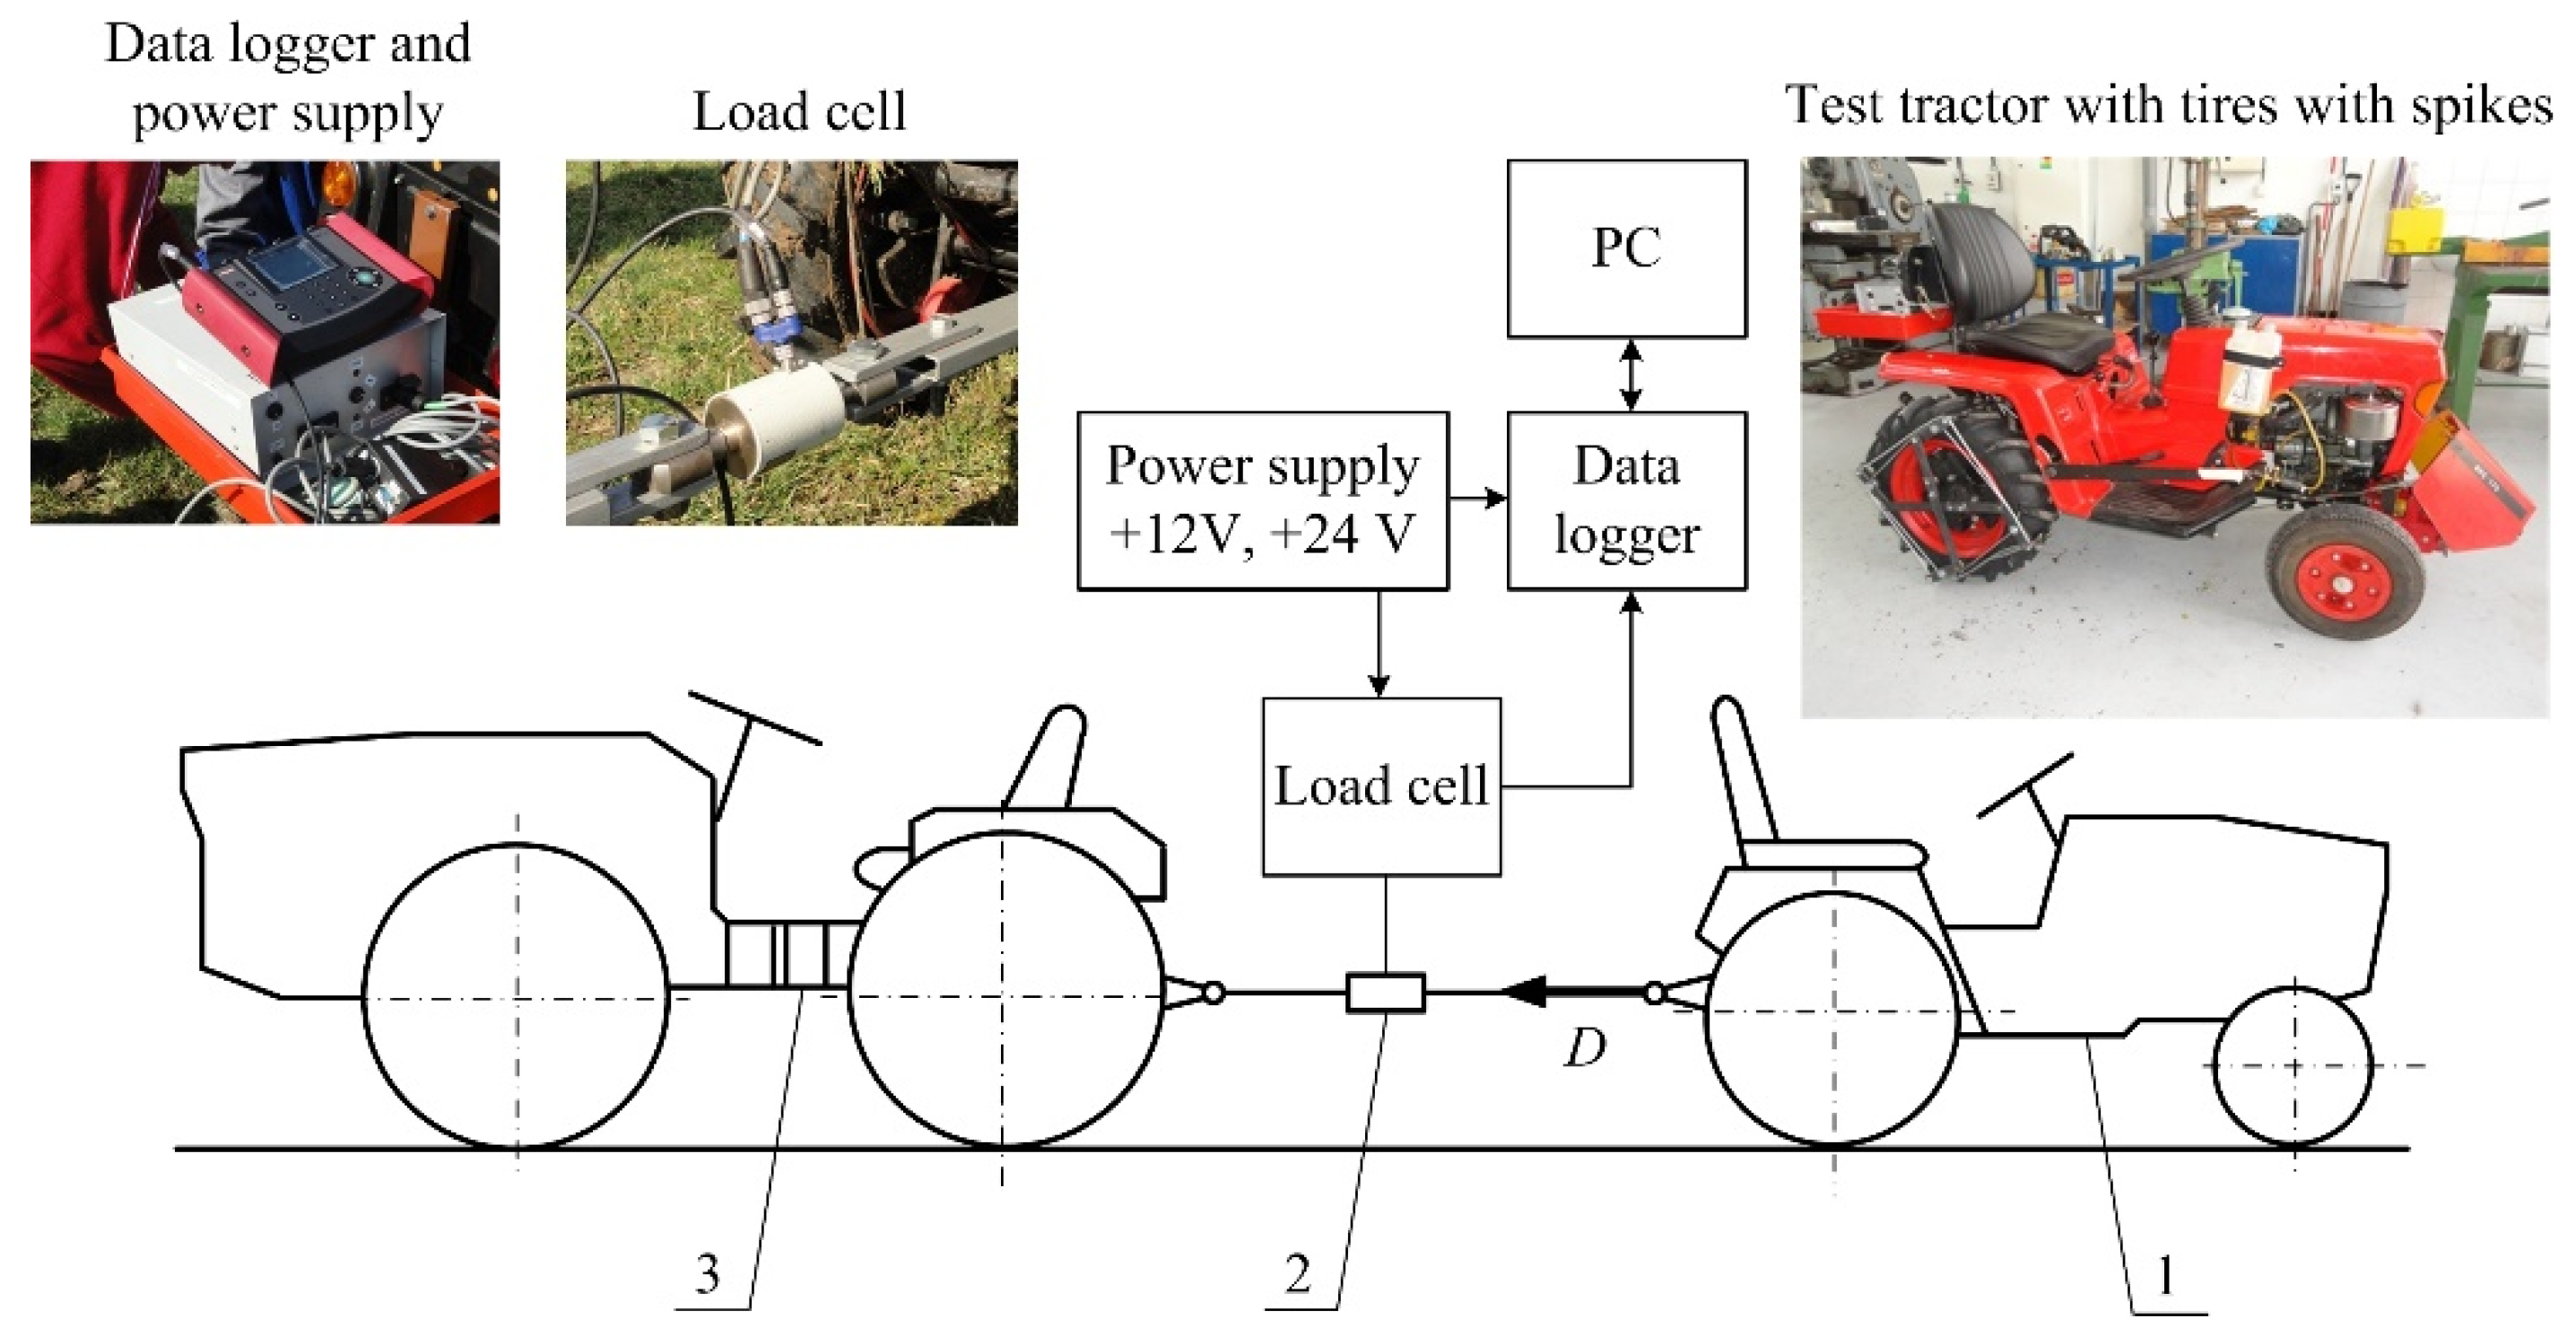
To determine the forces acting on the spike segment, the maximum drawbar pull of the test tractor at 100% wheel slip was experimentally measured (Figure 5). This method was used to simulate the dynamic load acting on the driving wheels at the highest load level. The “stop-and-go” methodology was used, which means that the brakes were applied periodically on the load tractor. The movement of both tractors (load tractor brakes released) alternated with a short stop (load tractor brakes applied) when the driving wheels rotated at 100% slip.
The drawbar pull measurements were performed in accordance to Reference [51] and were repeated four times. The test tractor MT8-070 (Agrozet, České Budějovice, Czech Republic) was operated at a rated engine speed (3600 rev/min) in the 1st gear. The gear ratio of the 1st gear was 252. The rotation speed of the driving wheels was 14.3 rev/min. A load tractor 4K-14 (Agrozet, České Budějovice, Czech Republic) was used to stop the test tractor. References [52,53,54] also used the load tractor to measure the drawbar pull of the test tractor. The load cell EMS 150 (Emsyst, s.r.o., Trenčín, Slovakia), with an accuracy class of 0.2, rated capacity of 10 kN, and rated output of 0–10 V, was placed between the load and test tractor. The data logger HMG 3010 (Hydac GmbH, Sulzbach/Saar, Germany) [48,49,50], with a measurement accuracy of voltage input (0–10 V): ≤±0.1% of the full scale, was used to record the drawbar pull. The sampling frequency was 1 kHz.
The test tractor was equipped with two types of driving wheels (standard tires and spike tires). The rear axle load (205 kg) and front axle load (105 kg) without rear wheel ballast weight and without the driver were experimentally measured by weighting pads. The weight distribution on the tractor axles was presented by Reference [55]. The mass of two steel discs of the rear wheel ballast weight was 30.5 kg (two times 15.25 kg), the mass of the tractor driver was 92 kg, and the mass of the spike system was 9 kg (one wheel was 4.5 kg). The sum of the partial masses mentioned above added up to a total rear axle load of 336.5 kg.

2.4. Field Conditions

The properties of the spike tires were tested on a mown grass field in the area of the Slovak Agricultural Museum in Nitra. The grass plot was chosen due to ideal traction properties in terms of the tire–soil interactions. The properties of the experimental area are listed in Table 1.
The tests were performed at a relatively low moisture content to obtain the highest drawbar pull of the test tractor. Three soil samples were collected randomly at depths of 0–100 mm. Steel sampling cylinders with a diameter and height of 100 mm were used. Organic matter affects the cohesion of the ground. Grass roots improve ground cohesion. Therefore, this parameter was also evaluated. The percentage content of grass roots was 0.4%. Chernozem soil (World Reference Base for Soil Resources) is typical for the lowland country where the tests were performed (the southwestern region of Slovakia, Nitra District).
A hand penetrologger with a cone diameter of 10 mm and angle of 60° was used to measure the penetrometer resistance. Three measurement repetitions on random places of the experimental area were performed. Considering the relatively low soil moisture, grass plot as the experimental area, and relatively low weight on one driving wheel, the soil compaction in the wheel tracks was considered negligible. Using the data file from the measurement device, the penetrometer resistance was evaluated at ten soil depths, as listed in Table 2. Using the experimental data, the average values and standard deviations were calculated.

2.5. Fatigue Analysis of Spike Segment

Considering the operation conditions of the tractor driving wheels where loads are cyclic (wheel rotation) combined with the occasional impact or shock (striking a rock in soil), both the fatigue and impact loading were considered for a fatigue analysis of the spike segment. A cyclic load occurs due to the rotation of driving wheels when the load acting on the spike segments is periodically repeated. When the spike segment interacts with the ground, the maximum load acts on the spike segment. On the other hand, no load acts on the spike segment when it is not in contact with the ground. A periodic increase and decrease in the load cause cyclic stress of the spike segments. Shock can occur due to contact of the spikes with various obstacles that soil contains. Considering Chernozem soil, shock loading was not considered, because it does not contain dangerous rocks or stones. While Chernozem soil may be rock-free, many other soils in different parts of the world have varying degrees of rocks and stones. The analysis performed in this study is not applicable to situations where rocks are prevalent.
The diameter of the horizontal rod is the most important dimension of the spike segment in terms of device function. A smaller rod diameter requires smaller grooves in the tire tread pattern. Therefore, less rubber material must be removed for the placement of the spike segment to the tire and the integrity of the tire tread pattern to be less disrupted. The principle of special driving wheels enables their use only if the rubber segments of the tire tread pattern are higher than the horizontal rod diameter. Tire wear lowers the rubber segment height. When the spike segments exceed the tire diameter due to the wear process, the tire must be changed. Therefore, the next benefit of the smaller diameter of the horizontal rod is a possibly longer use of the tire. Two rod diameters (10 and 8 mm) smaller than the actual one (12 mm) were simulated, and safety factors were calculated for various numbers of the cyclic load (1000, 10,000, 100,000, and 1,000,000). Fatigue loading was considered for the FEM analysis of the spike segment design. The spike segment was loaded, and the safety factors were calculated to evaluate the actual design and design with a reduced diameter of the horizontal rod.
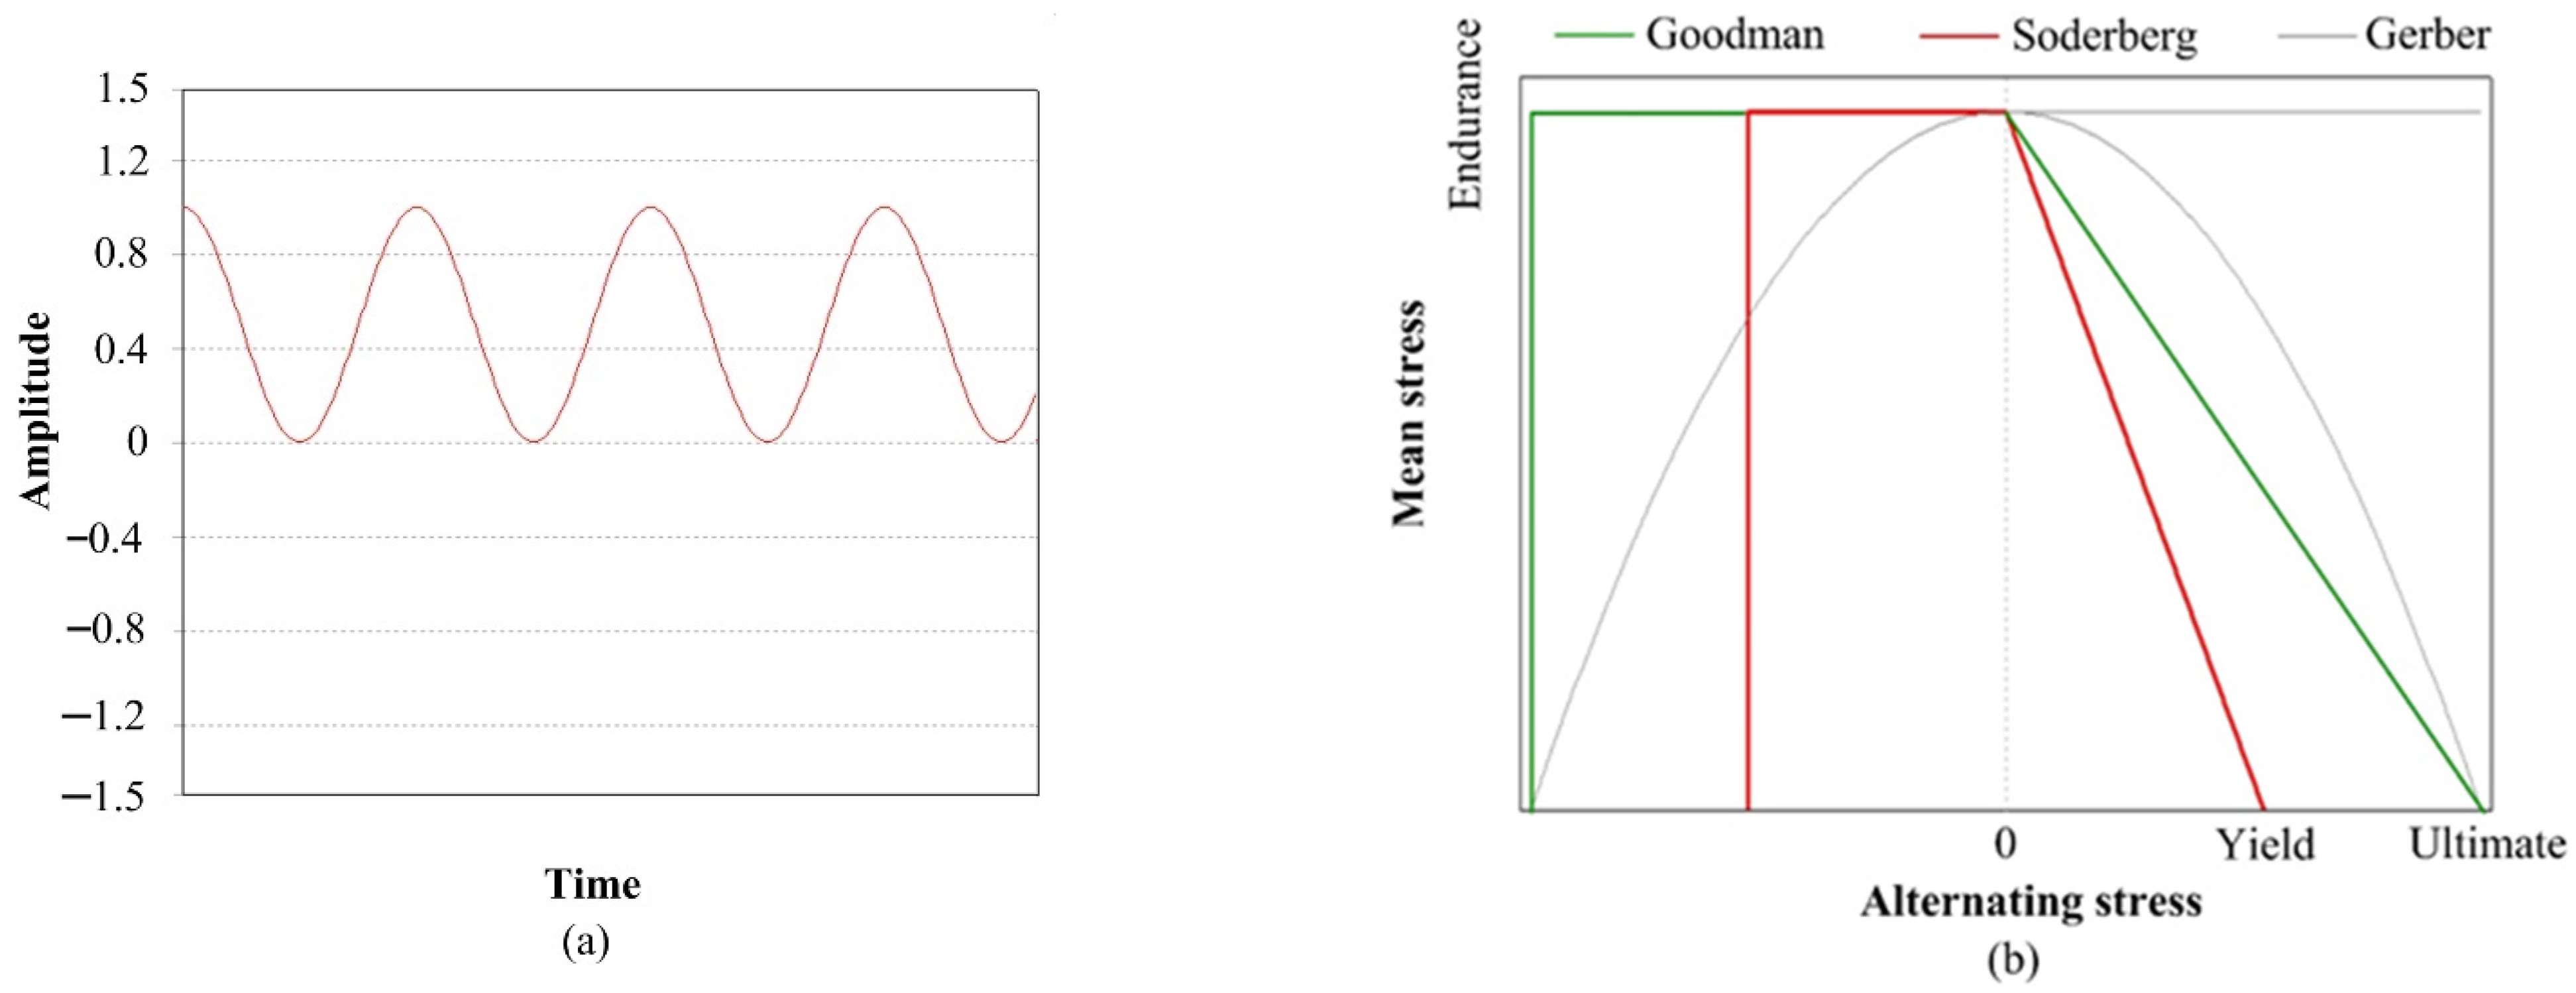
Simulation software ANSYS was used for a fatigue analysis. This software has been successfully used for many applications to analyze various designs [56,57,58]. In this kind of numerical simulation, the fatigue analysis defined in the simulation software was chosen, as shown in Figure 6. Cyclic stress was defined as a zero-based loading characteristic (Figure 6a). The fatigue diagram shows the mean stress plotted on the abscissa and stress amplitude on the ordinate (Figure 6b). The yield and ultimate tensile strength are also plotted on the horizontal axis. There is a border dividing the safe and unsafe regions for various combinations of mean stress and stress amplitude. To construct the borderline dividing the safe zone and failure zone, different criteria, including the Gerber line, Soderberg line, and Goodman line, are usually used. Gerber and Goodman lines connect the endurance limit with the ultimate strength. The Soderberg line connects the endurance limit with the yield strength. The Soderberg theory is the most conservative of the three shown and is the only one that is completely below the yield line [59]. In general terms, the Goodman method is used for brittle materials and the Gerber method for ductile materials. Therefore, the Gerber theory was applied to the fatigue analysis of the spike segment made of ductile material.
The 3D model of the spike segment was created in the CAD system CATIA V5. The material properties of the spike segment (Table 3) were defined in the simulation models. The Wohler S–N diagram for material S355 was used for fatigue simulation, as presented by Reference [60].

3. Results and Discussion

3.1. Drawbar Pull at 100% Wheel Slip

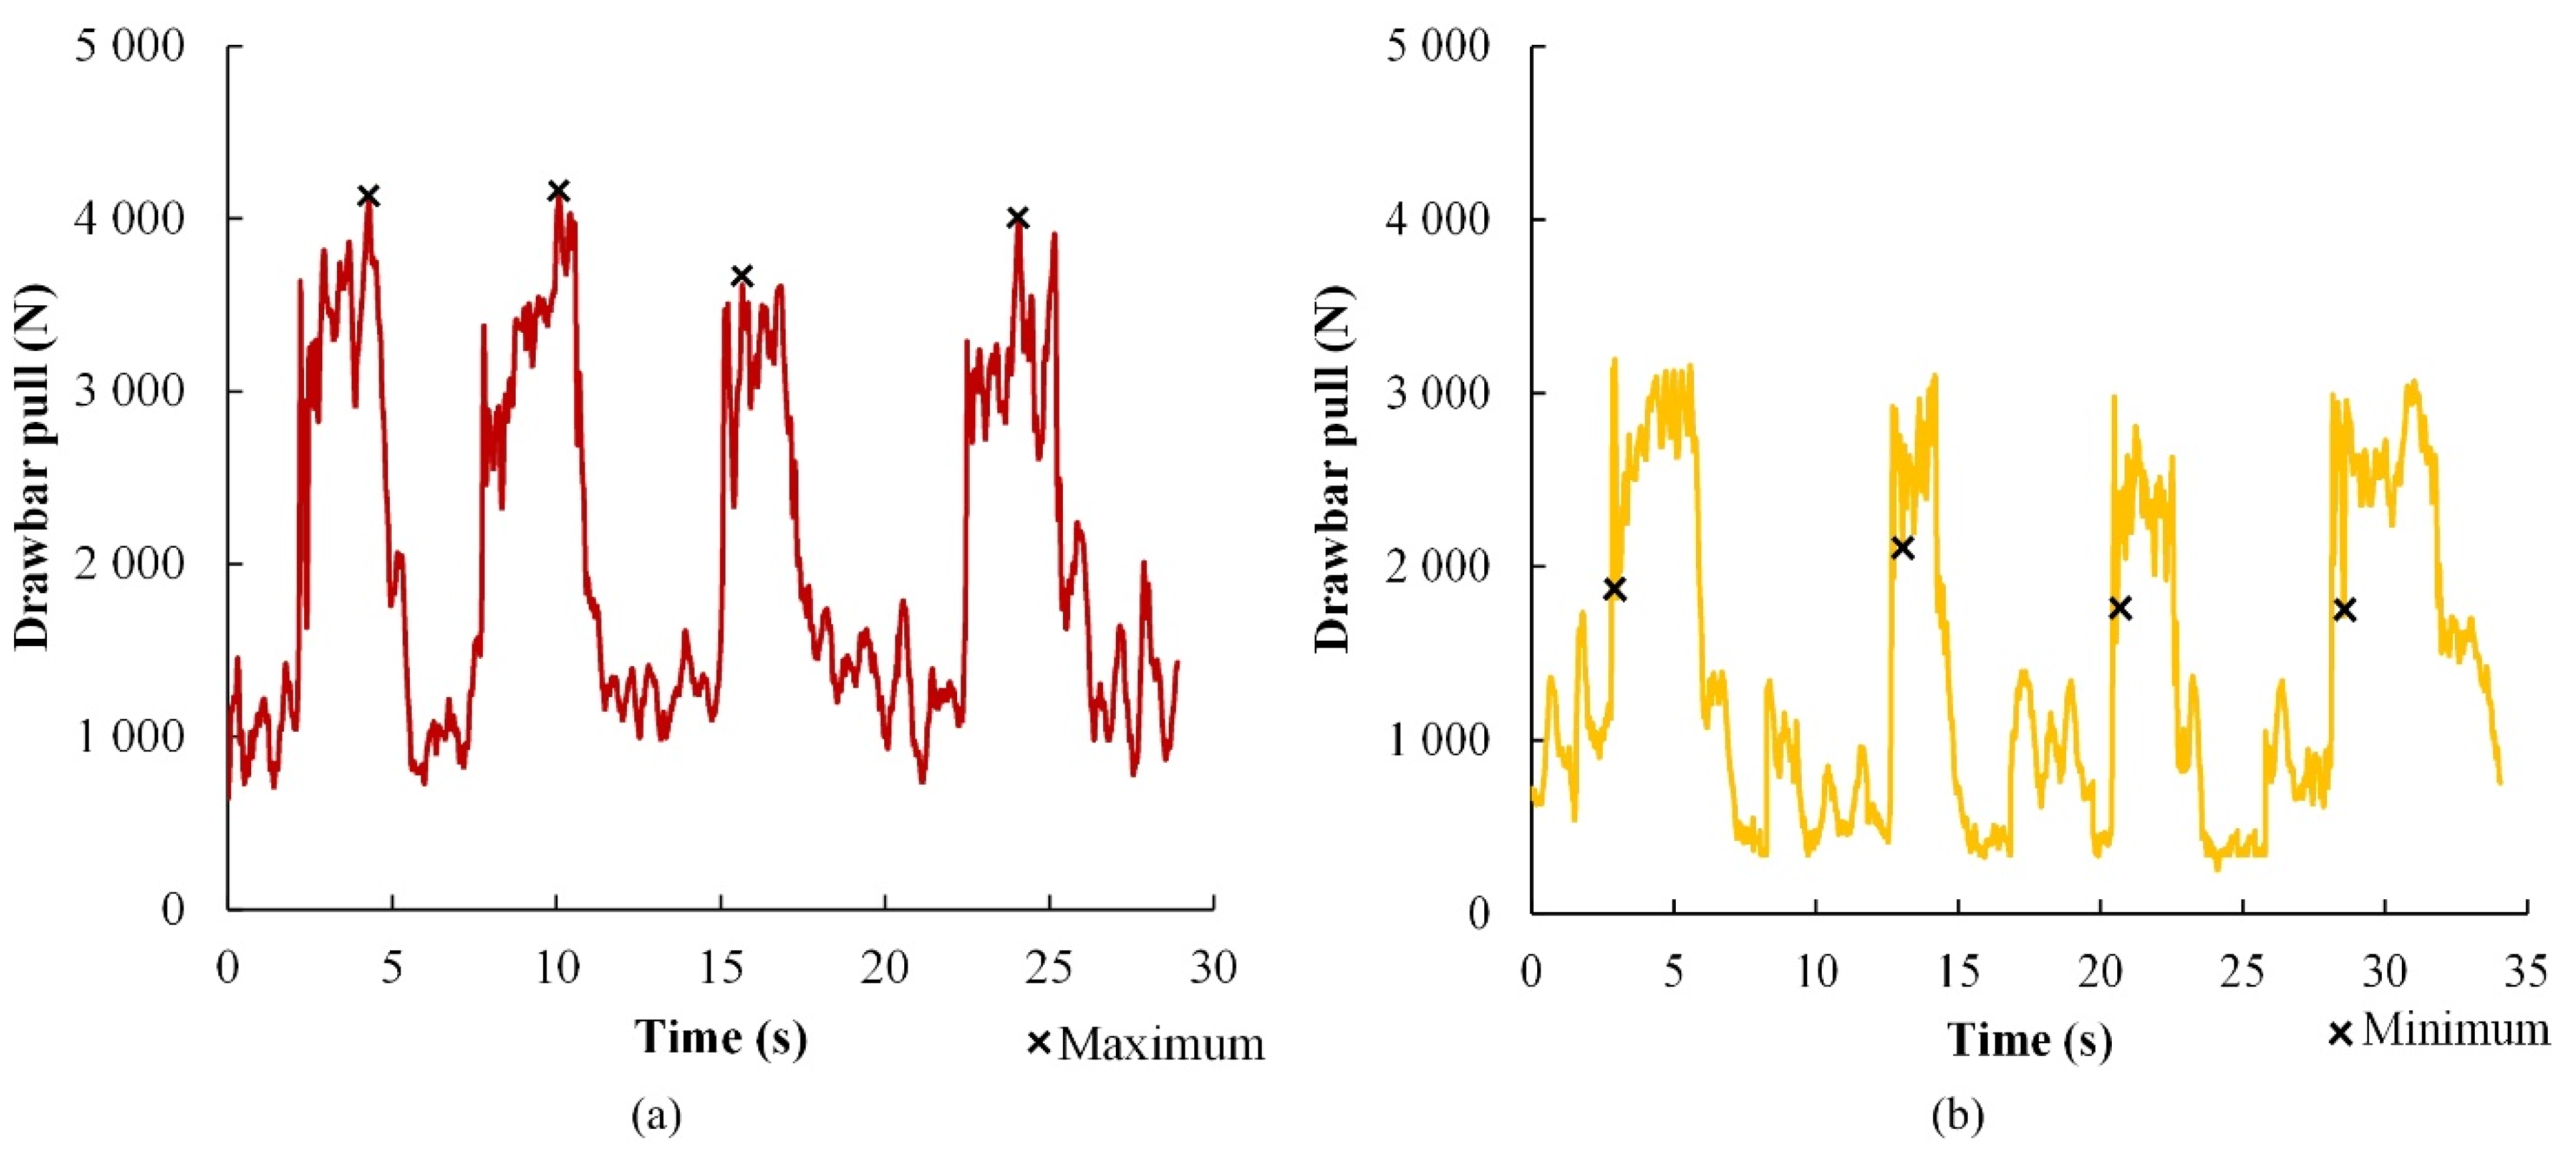
The raw data of the drawbar pull (Figure 7) were used to express the maximum load acting on the spike segment. It showed the results of four measurements with the test tractor in first gear that generated the highest drawbar pulls due to the highest gear ratio.
The oscillation of the drawbar pulls varied during the single measurements due to the actual ground conditions, which also varied when the wheels sank. The drawbar pull oscillation reflected the field nature of the experiments. The courses of drawbar pull started to oscillate around the minimum values. This section of the graph plots characterized the test tractor pulling the load tractor in neutral. When the operator of the load tractor activated the brakes, the drawbar pull began to increase up to the maximum values. When the test tractor did not move, the driving wheels still rotated. In this state, the drawbar pull oscillated around the mean values. The oscillation was caused by interactions of the rubber segments, the tire tread pattern, or spikes with the ground. The results of Reference [61] showed that pull forces showing cyclic variation with the wheel rotation and the period was found approximately equal to the rubber segments spacing. Testing a rigid wheel with grousers, Reference [62] presented oscillations of the drawbar pull with a certain amplitude due to transition of the grouser encountering the terrain or the gradual departure of the grouser leaving the terrain. Research aimed at the dependence of an off-road vehicle performance on interactions between the ground and running gear was published by Reference [63]. In the study, the formation of periodic ripples under a rigid wheel was investigated within the framework of a finite element analysis. The results of this research showed variations in the drawbar pull as a function of elapsed time when periodic ripples are formed. The effect of spike tires on tractor vibrations due to drawbar pull oscillation was analyzed and compared with the standard tires and special type of steel wheels with grousers. Study [64] presented a lower vibration level of spike tires than special steel wheels with grousers.
The t-test was used to determine whether there were statistically significant differences between the standard tires and spike tires. Standardized kurtosis was used to determine whether the experimental data came from normal distributions. The values of these statistics inside the range of ±2 indicated a significant normality for the standard tires and spike tires. The increase in the drawbar pull of 16.7% was calculated from average values of 2729 N and 3190 N (standard tires and spike tires). The difference was 461 N. Considering the test statics (t = −22.3) and p-value (0), there was a statistically significant difference between the two driving wheel types at the 95% confidence level.
Peak forces cause problems with a structural failure of the spike segments. Therefore, the highest difference between the drawbar pull of the test tractor with standard tires and spike tires was used for the FEM analysis of the spike segment. The drawbar pull of the test tractor in first gear is shown in Table 4.
Force interactions between the spike tires and ground are divided into tire tread patterns and spikes of spike segments. The penetrometer resistance affects spike penetration into the ground and reduces the tractor weight acting on the rubber grousers of the tires with spikes. Therefore, the tractive effort of the tire tread pattern of the spike tires was reduced. A penetrometer resistance of 1 MPa was applied to the end of the spikes, with a total cross-section of 600 mm2 (two spikes per wheels, two wheels) calculated from the dimensions of one spike (5 × 30 mm). Therefore, the normal force was 600 N. This was 18.2% of the rear axle static weight of 3298 N (336.5 kg). The maximum value of 4136 N (spike tires) and minimum value of 1856 N (standard tires) were stated from experimental measurements (Table 4). The minimum value decreased by the percentage of the rear axle weight of 337 N (18.2%) was 1518 N. The highest difference of 2617 N was calculated from the maximum value of 4136 N and minimum value of 1518 N decreased by the percentage of the rear axle weight. The difference was calculated for two driving wheels. The half-value for one driving wheel (one spike segment) was 1309 N.

3.2. Boundary Conditions of the Spike Segment

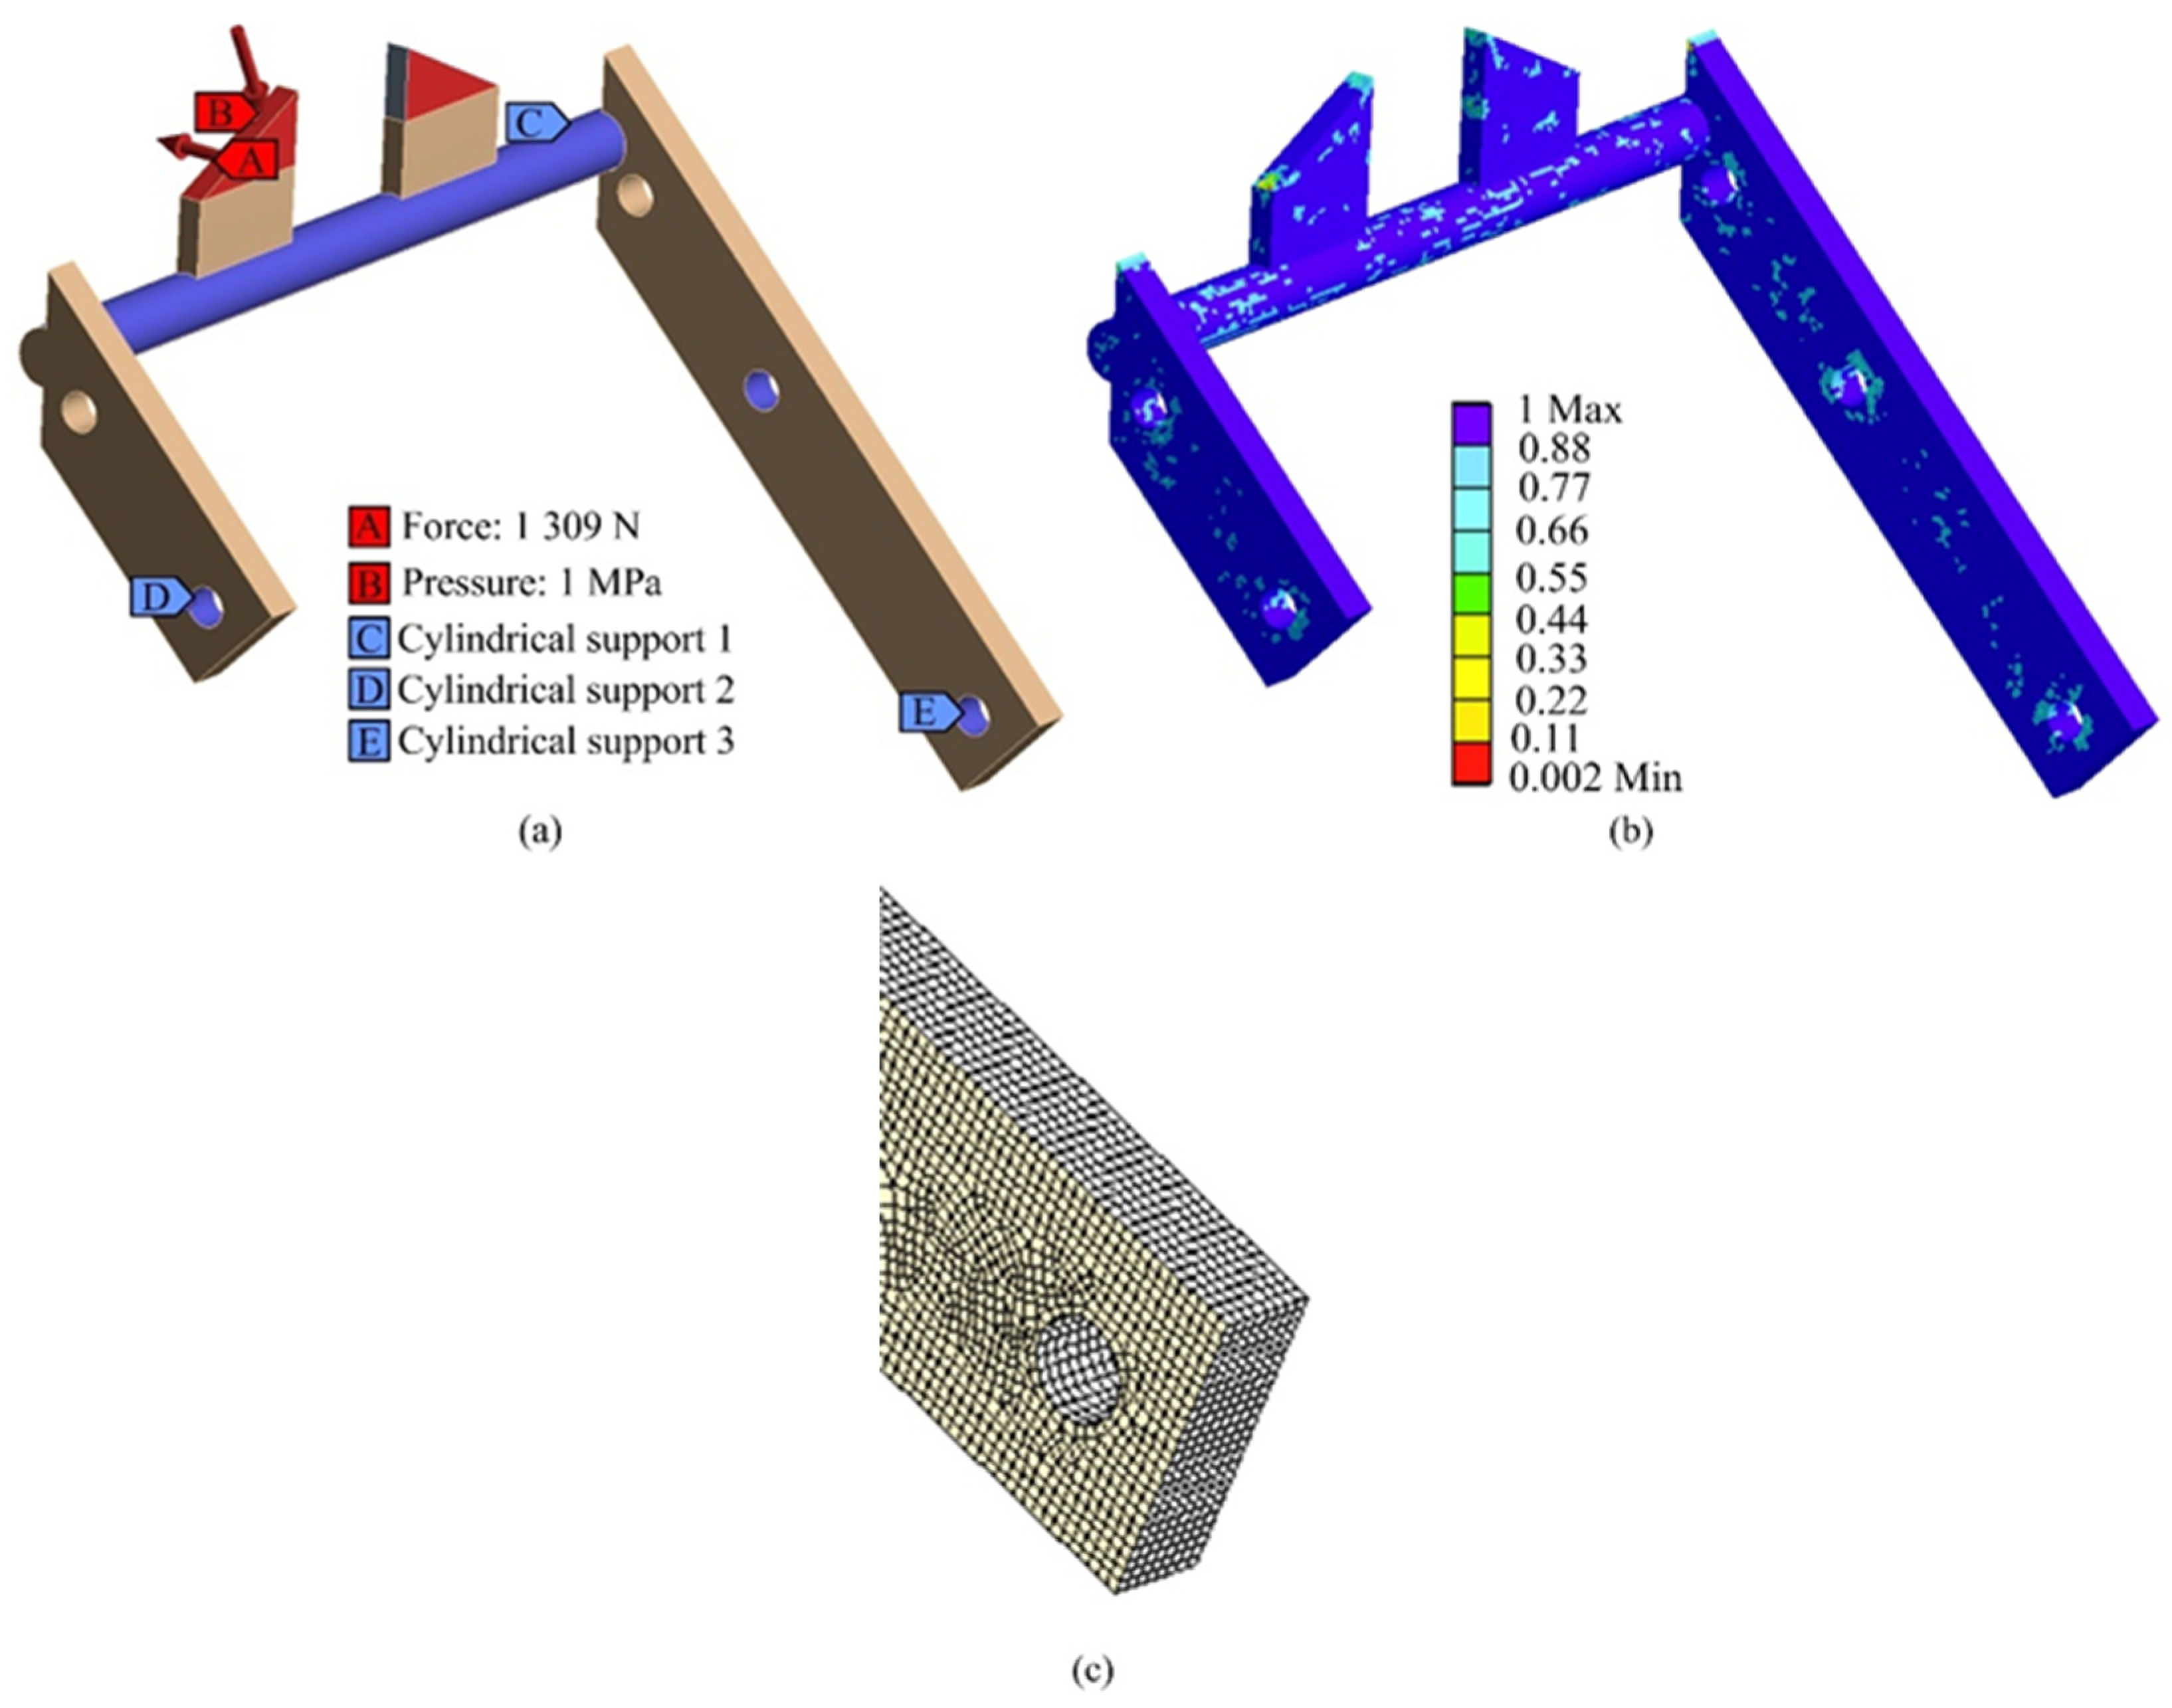
A three-dimensional model of the spike segment was created, as shown in Figure 8a. The spikes were welded to the horizontal rod by weld joints. The horizontal rod was welded to the side steel strips by the weld joints located outside the spike segment. It was not important to simulate the specific shapes and locations of the weld joints, because the aim of the fatigue analysis was to find places with the highest stress. Therefore, the weld joints were simplified. The mesh quality determines the reliability of a simulation. The meshing algorithm of the software discretized the part into a finite element mesh. The high quality of the mesh is expressed by the areas of the model with blue color (Figure 8b). Other colors on the mesh show areas with reduced mesh quality and reduced accuracy of the results. There are only minimal areas with other colors. To provide a high-quality model, a three-dimensional mesh with high density was created for the numerical analysis. The maximum size of the element was 1 mm. The finite element mesh contained 131,491 elements and 485,588 nodes. The mesh details of the side steel strip are shown in Figure 8c.
The fastening and loading of the spike segment are shown in Figure 8a. Fastening in the form of cylindrical support is marked with blue areas and located in the holes for pins of the control wire strand and for the lever of the control mechanism. The fastening of the horizontal rod was also performed by the cylindrical support to allow a free rotation of the spike segment in the groove of the tire tread pattern. Forces acting from the ground load the spike segments. The red arrows represent the loading of both spikes. The arrow marked with the letter A shows the tangential force expressed from the drawbar pull measured experimentally (1309 N). This force symmetrically loads both spikes. Spikes are not loaded the most when the whole area is considered, because a point of action is in the geometric center of the part. Therefore, the worst case for a load is when only the upper part of spikes is in contact with the ground. In this case, a moment of force is greater because a force arm is longer. This situation occurs when the rubber segments of the new tire tread pattern partially cover the spikes. The red color marks the upper triangular area of the spikes loaded with the forces. The driving wheels sank to a maximum depth of 10 cm during rotation at 100% slip. The penetrometer resistance reached a value close to 1 MPa at the depth of 10 cm (Table 2), so this value was used to model the load acting on the spike segment. The load from spike penetration into the ground was simulated by pressure that equaled the maximum penetrometer resistance (1 MPa). When spikes penetrated the ground, pressure acted on the top surface marked with the letter B.

3.3. Run Analysis and Results

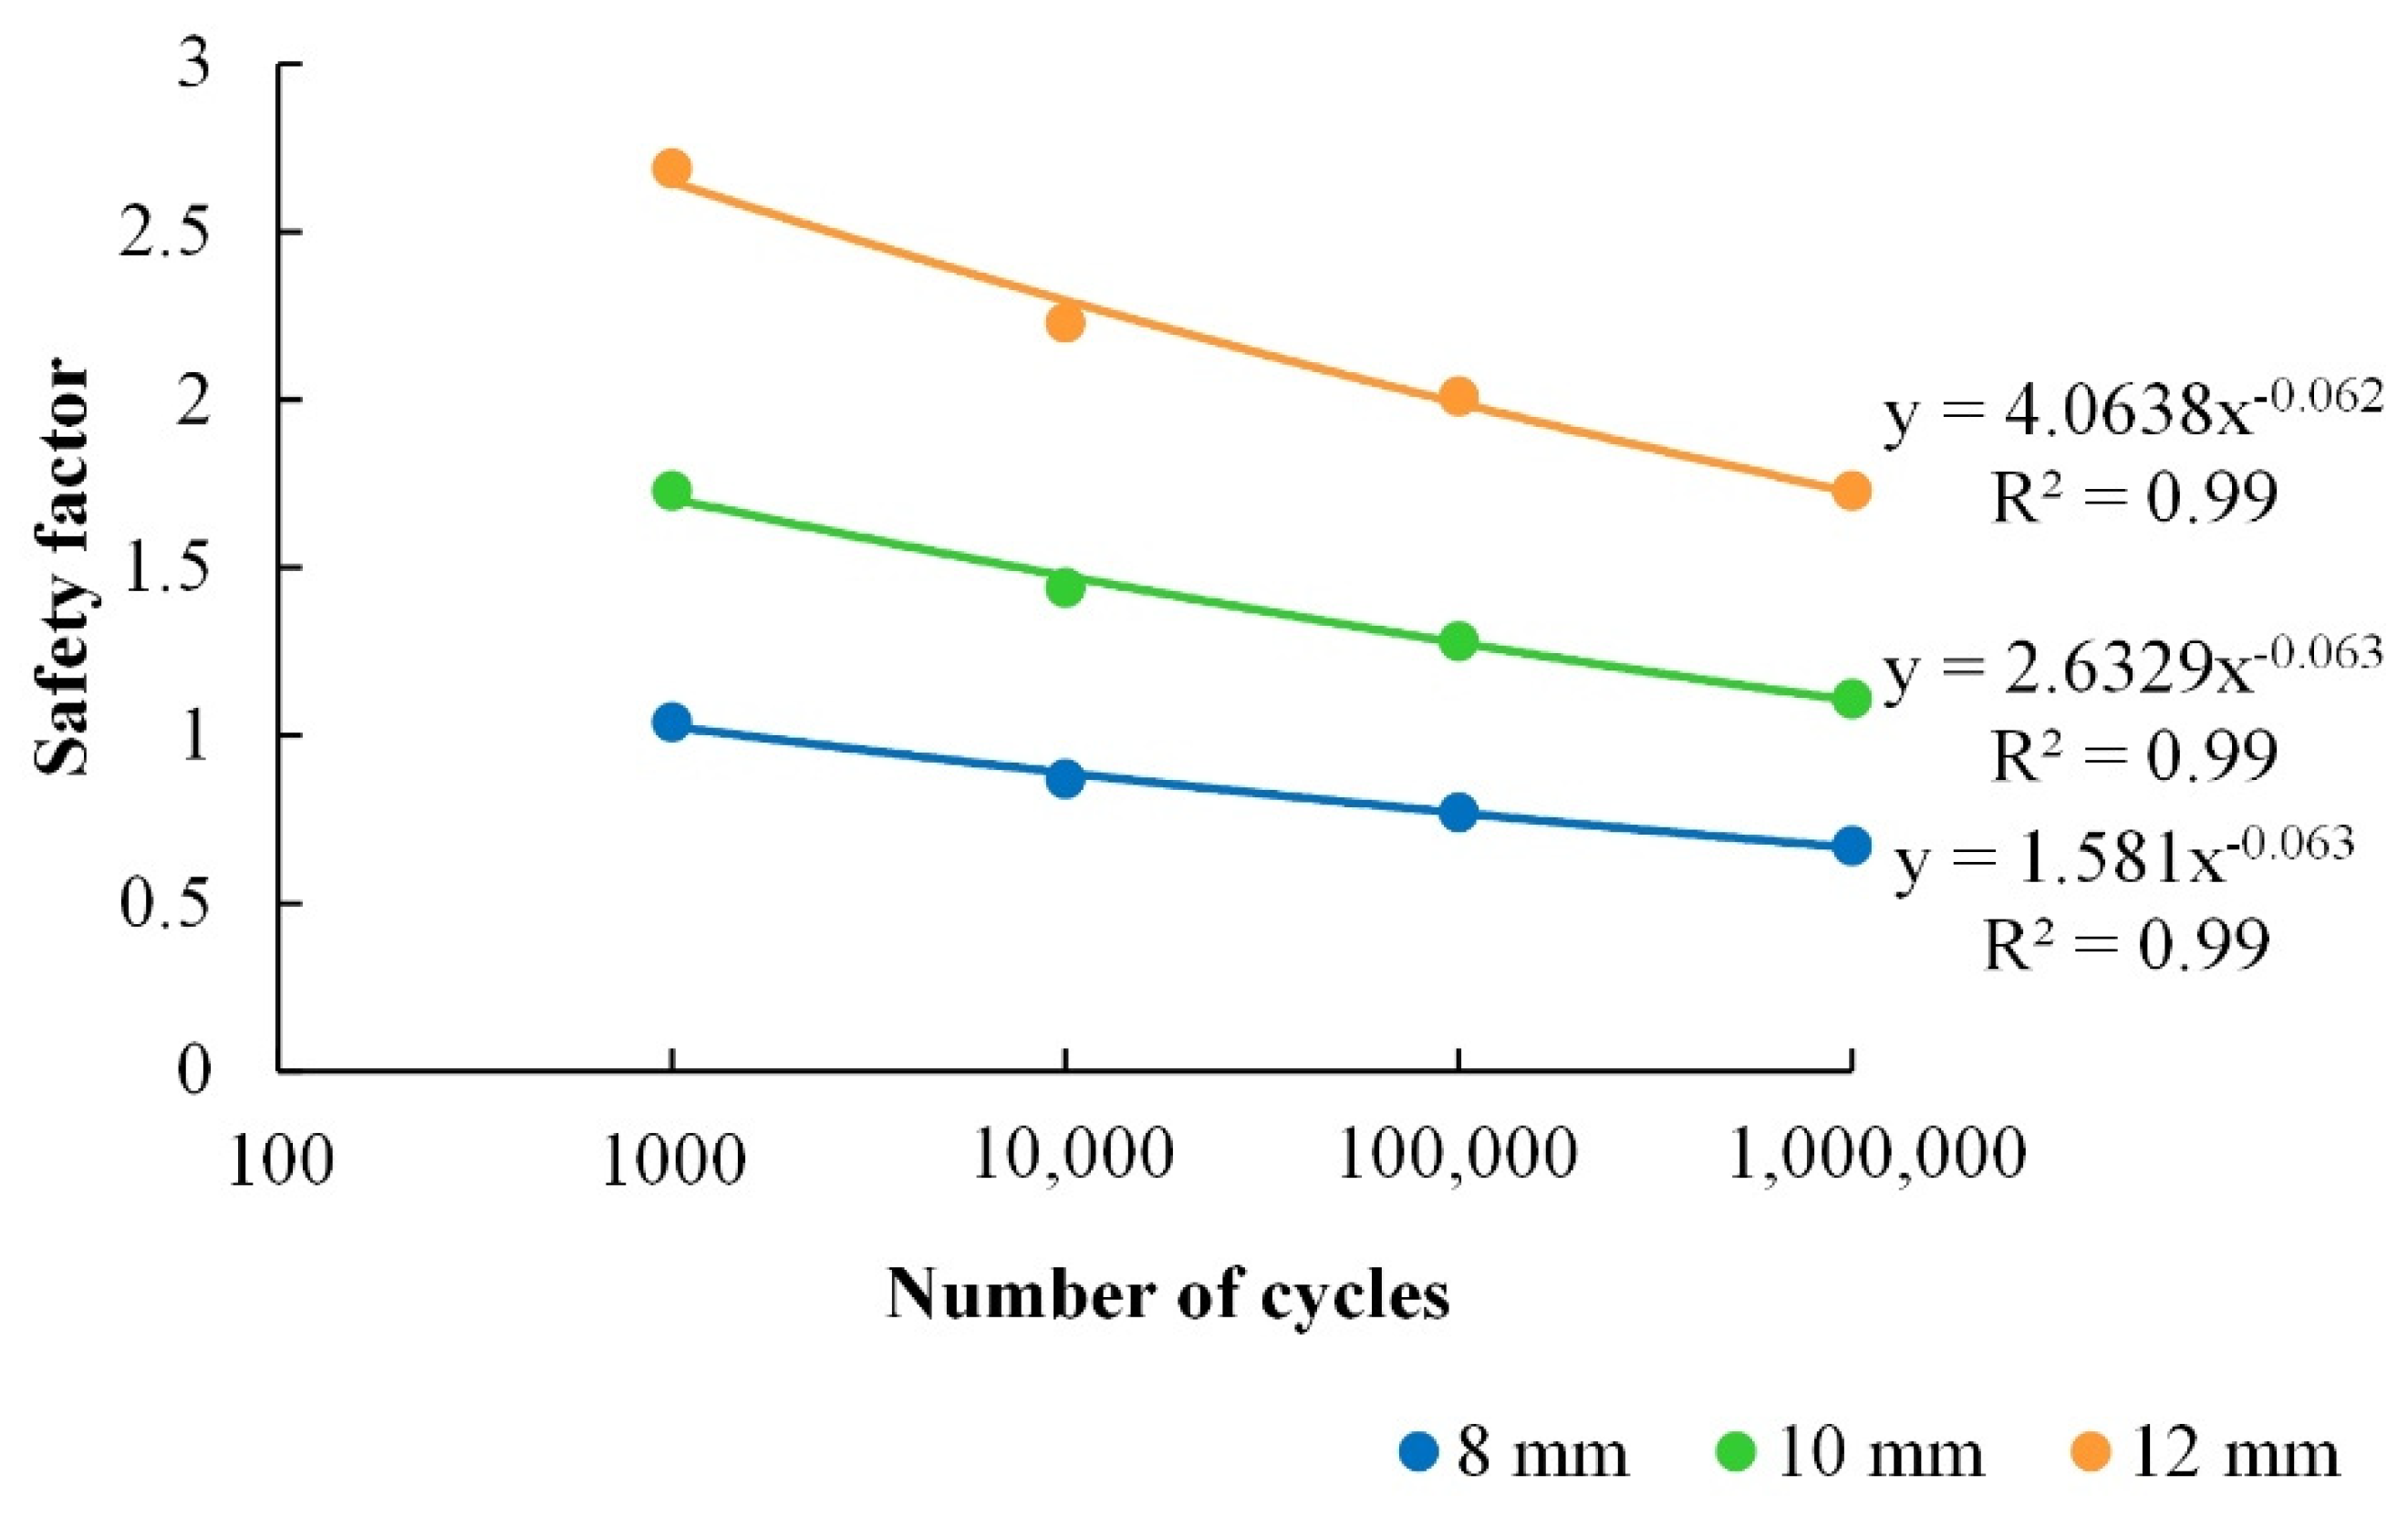
When all the necessary settings were done, the calculation process was started, and the results of the numerical simulation were collected. The simulation software loaded the models of the spike segments with connection rod diameters of 12 mm (actual design), 10 mm, and 8 mm by various numbers of cyclic loads (1000, 10,000, 100,000, and 1,000,000). The relationships between the safety factor and number of cycles were expressed by power functions (Figure 9), as is typical for S–N diagrams of materials. This relationship allows to predict the durability of the spike segment. It shows that the increase in cycles of the maximum load and the reduction of the horizontal rod diameter decrease the safety factor and increase a risk of damage.
The results showed that the safety factors for the spike segment with a connection rod diameter of 12 mm and 10 mm were higher than ones in the cases of all numbers of the cyclic load, as listed in Table 5. A safety factor close to one was calculated for a horizontal rod diameter of 8 mm only at 1000 cycles and lower than one for higher numbers of load cycles. These values represent insufficient spike segment durability. Lower rod diameters were not analyzed, because a safety factor lower than one increases the risk of spike segment damage.
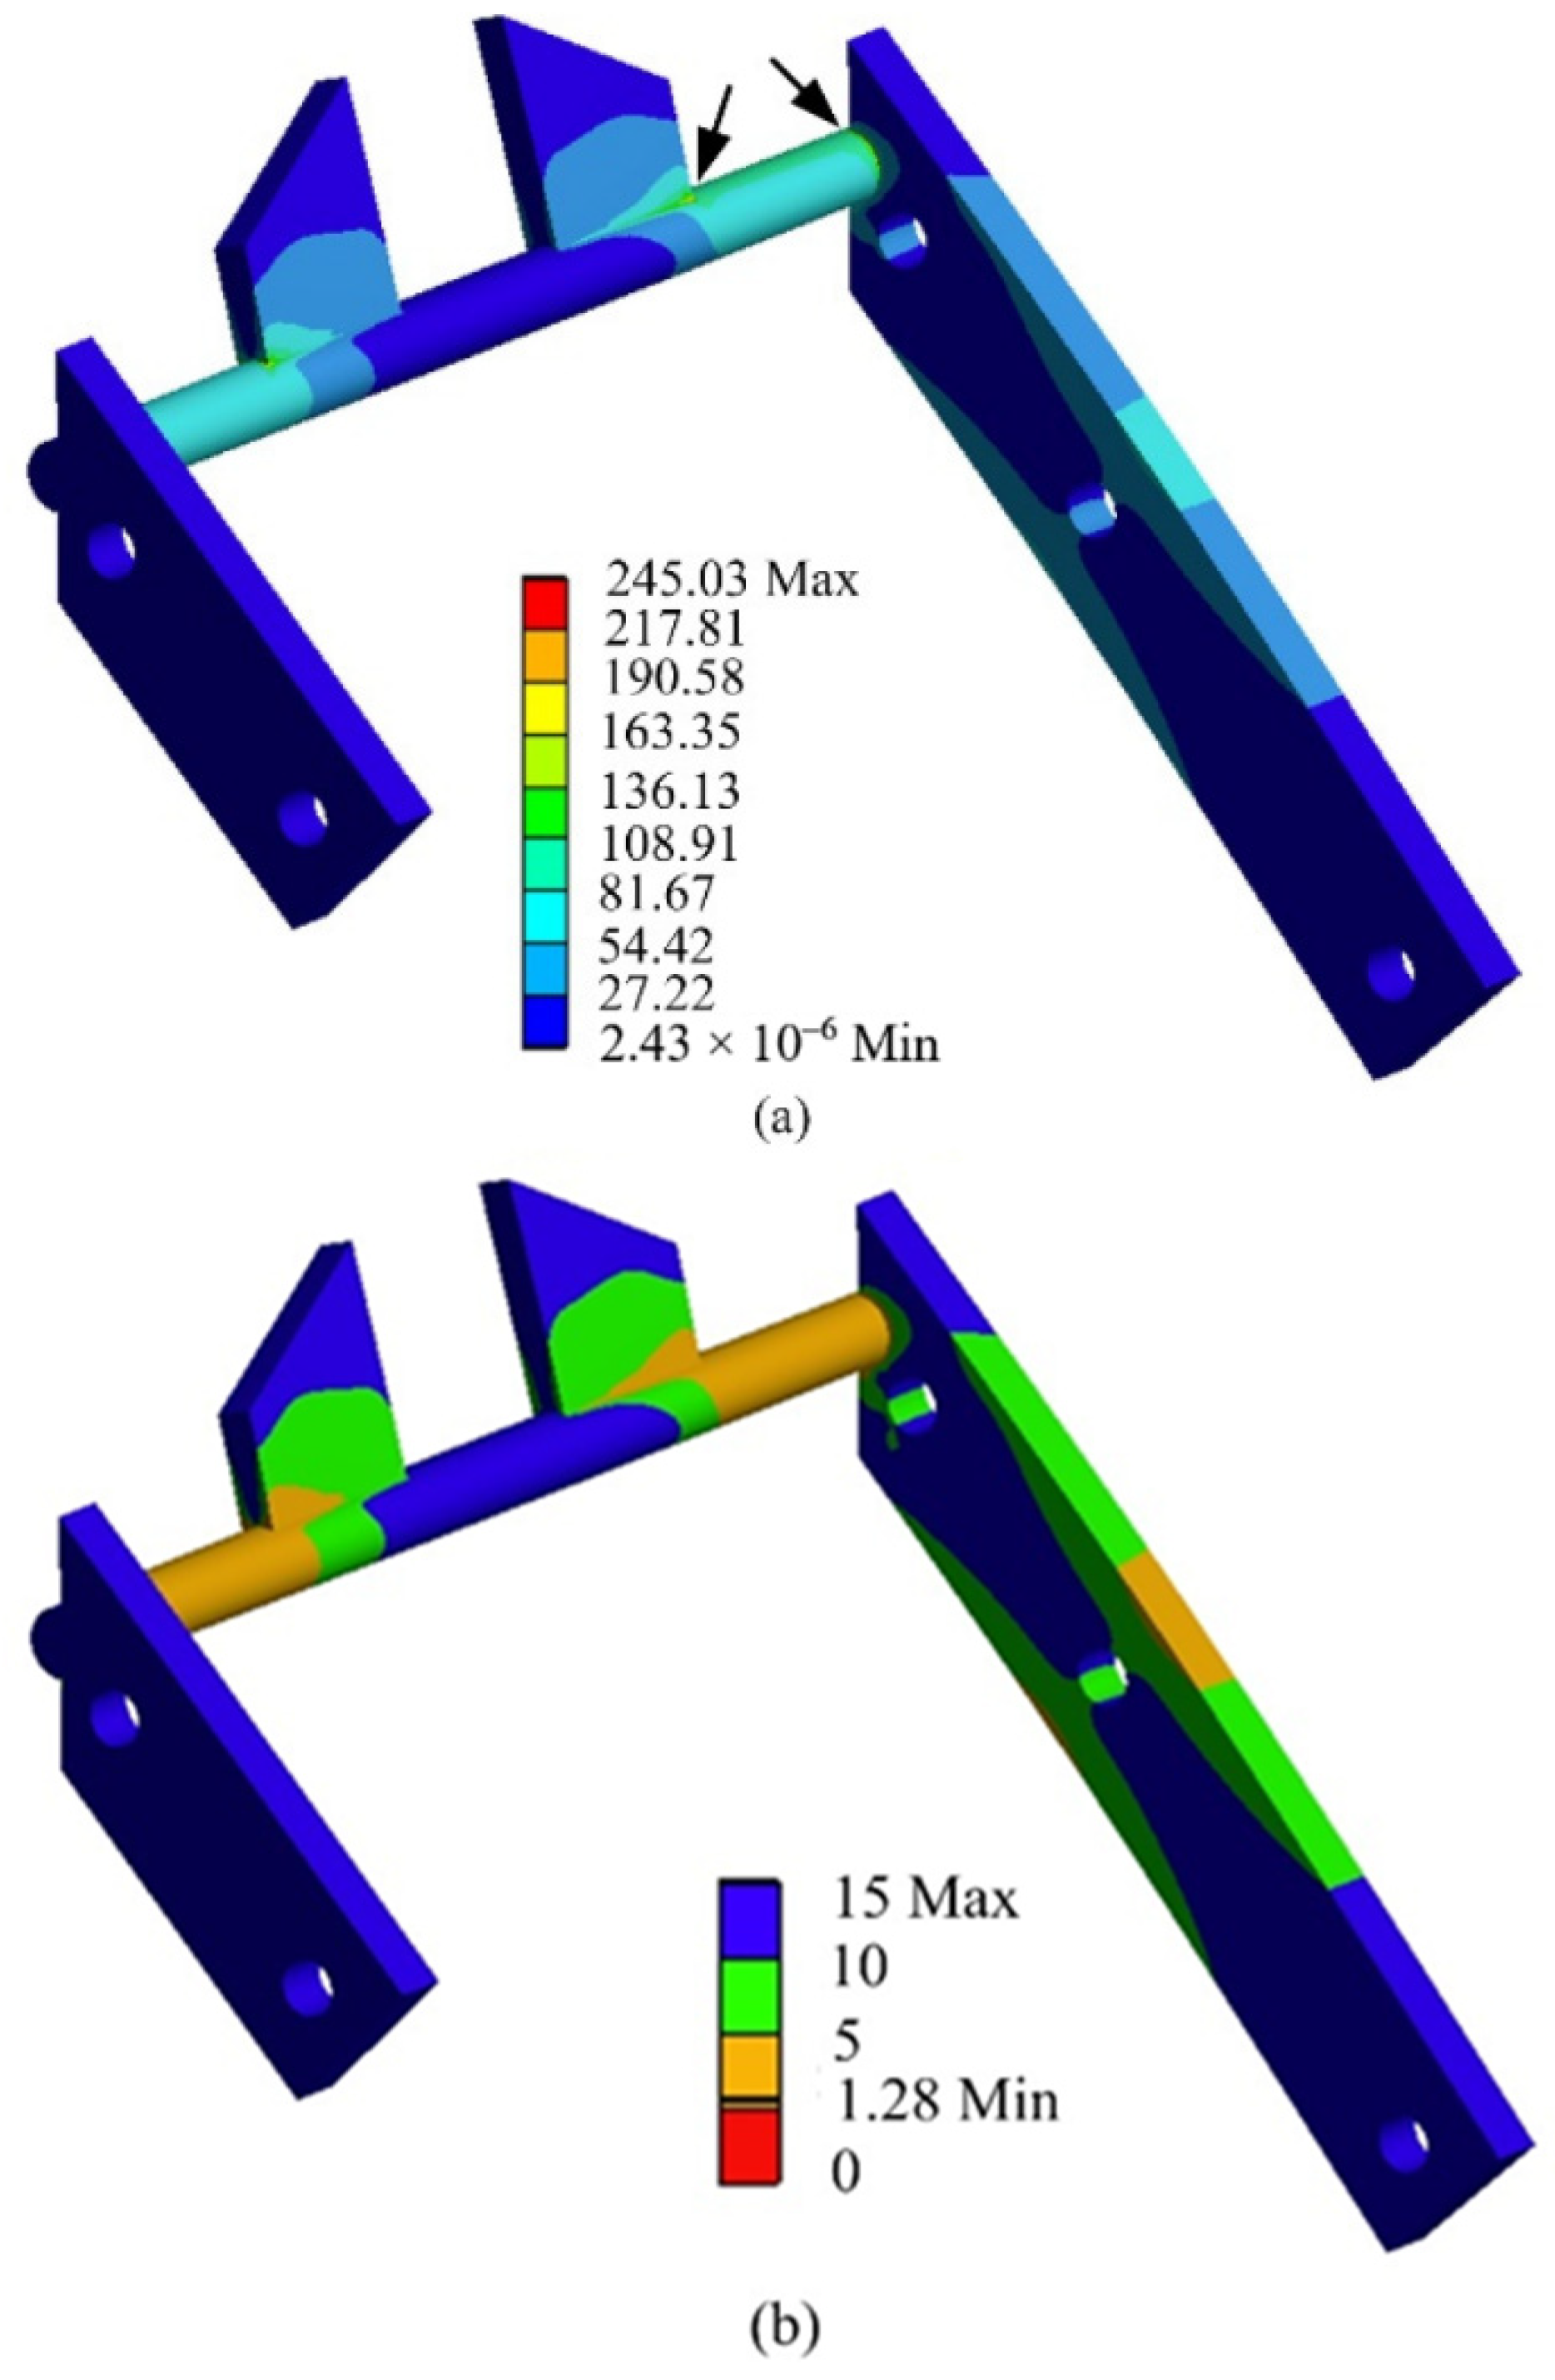
The analysis of the spike segment with the horizontal rod diameter of 12 mm showed the safety factor of 1.73 at the highest number of cyclic loads. In terms of practical applications, this safety factor hints at oversizing of the actual design. To increase the safety factor, materials with higher limit strengths can be used [45]. Reference [65] considered a minimum safety factor of 1.25. Reference [66] recommended a minimum safety factor of 1.2 for shafts under fatigue stress. Considering the safety factor of 1.28 at 100,000 cycles of the maximum load (100% wheel slip) acting on the special driving wheels, the spike segment with a horizontal rod diameter of 10 mm was proposed (Figure 10). Since the tractors only seldom operate at 100% wheel slip, the number of cycles used for the calculations was adequate to predict the safety operations.
All the stresses shown in Figure 10 were lower than the limit strength of the material (safety factor higher than one). As a result, alternating stresses were calculated to find the most stressed place of the spike element (black arrows). It was located at the connection of the side steel strip and spikes with the horizontal rod. The less stressed areas were shown in blue. The exact values of the alternating stresses from the lowest to the highest were expressed by the color scale. The most stressed places were welded joins. Therefore, it is most important to pay attention to the quality of welded joints. It is recommended to create welded joins without notches negatively affecting the durability of the spike segment under a fatigue load.
An integrity of the spike segment with a reduced diameter of the horizontal rod could be infracted due to dynamic contact with solid obstacles. The spike tires represent a combination of the rigid (spike segments made from steel) and elastic (tire made from rubber) parts. This feature is the main innovation of the spike system in comparison with various types of wheels with steel grousers [30,33,37,41]. The spike segments interact with the soil only when the tire is stiff enough to support them. When rocks, roots, or other obstacles in the ground block the spike segment against continual rotation, wire strands are released due to tire deformation, and the tire does not support the spike segments. Tire deformation partially protects the spike segments from overload but not fully, because it is relatively small at the recommended inflation pressure of 150 kPa. Considering the Chernozem soil for operation of the special driving wheels and overload protection of the system due to tire elasticity, the spike segment proposed with a horizontal rod diameter of 10 mm can be applied.

4. Conclusions

Special driving wheels improving the tractor tractive performance were developed and presented in this paper. It allowed using the tractor tires with or without steel spikes.
The drawbar pull of the test tractor equipped with spike tires or standard tires was measured at 100% wheel slip. The experiments showed that the drawbar pull oscillated around the mean values due to interactions of the tire grousers and spikes with the ground. The comparison of the spike tires and standard tires was expressed by a drawbar pull increase of 16.7% and a difference between the mean drawbar pull of 461 N. Considering the drawbar pull oscillation, the maximum tangential force of 1309 N was calculated for the fatigue analysis of the spike segment. The normal force acting on the spike segment was expressed from the experimentally measured penetrometer resistance of 1 MPa.
The fatigue analysis of the spike segment showed the possibility of reduction in an actual horizontal rod diameter of 12 mm. The safety factors of 2.69, 2.23, 2.01, and 1.73 were calculated for 1000, 10,000, 100,000, and 1,000,000 load cycles. These values higher than the minimal value of 1.2 showed possibilities for reducing the horizontal rod diameter. Based on the safety factor of 1.28 at 100,000 load cycles, a reduced diameter of 10 mm was proposed for operation on Chernozem soil. The horizontal rod diameter of 8 mm was also analyzed. The safety factor of 1.04 (close to one) at 1000 cycles and 0.87, 0.77, and 0.67 (lower than one) at higher load cycles were calculated, so safe operations could not be guaranteed.
The relationship between the safety factor and the number of load cycles was constructed from calculated data. Using the power function, model relationships were statistically determined. It showed that higher safety factors are predicted at lower numbers of load cycles and a higher horizontal rod diameter.
The results showed that both simulated parameters, as the number of load cycles and horizontal rod diameter, affect the safe operations expressed by the safety factor. Based on fatigue analysis, the design of the spike segment with a reduced horizontal rod diameter was proposed. This design of the spike segment requires little space in the tire tread pattern. The results are a presumption of the safe operation of the special driving wheels.

Author Contributions

Conceptualization, R.A. and R.M.; methodology, R.A., R.M. and Š.H.; software, Š.H. and Ľ.K.; validation, Z.T. and K.K.; formal analysis, K.K. and Ľ.K.; investigation, R.M. and Z.T.; resources, R.M. and S.M.; data curation, S.M. and R.A.; writing—original draft preparation, R.M.; writing—review and editing, R.A. and K.K.; visualization, R.M. and Š.H.; supervision, R.M.; and project administration, K.K. and R.M. All authors have read and agreed to the published version of the manuscript.

Funding

This research was funded by the Ministry of Education of the Slovakia, grant number VEGA 1/0724/19, “Research, Design and Application of Special Driving Wheels for Drawbar Properties Improvement and Elimination of Soil Damage under Operation of Vehicles and Tractors”.

Institutional Review Board Statement

Not applicable.

Informed Consent Statement

Not applicable.

Data Availability Statement

Not applicable.

Conflicts of Interest

The authors declare no conflict of interest.

References

  1. López-Vázquez, A.; Cadena-Zapata, M.; Campos-Magaña, S.; Zermeño-Gonzalez, A.; Mendez-Dorado, M. Comparison of energy used and effects on bulk density and yield by tillage systems in a semiarid condition of Mexico. Agronomy 2019, 9, 189. [Google Scholar] [CrossRef] [Green Version]
  2. Semetko, J.; Janoško, I.; Pernis, P. Determination of driving force of tractor and trailer wheels. Acta Technol. Agric. 2002, 5, 1–4. [Google Scholar]
  3. Kim, Y.-S.; Kim, W.-S.; Siddique, M.A.A.; Baek, S.-Y.; Baek, S.-M.; Cheon, S.-H.; Lee, S.-D.; Lee, K.-H.; Hong, D.-H.; Park, S.-U.; et al. Power transmission efficiency analysis of 42 kW power agricultural tractor according to tillage depth during moldboard plowing. Agronomy 2020, 10, 1263. [Google Scholar] [CrossRef]
  4. Raheman, H.; Jha, S.K. Wheel slip measurement in 2WD tractor. J. Terramech. 2007, 44, 89–94. [Google Scholar] [CrossRef]
  5. Ashok Kumar, A.; Tewari, V.K.; Nare, B. Embedded digital draft force and wheel slip indicator for tillage research. Comput. Electron. Agric. 2016, 127, 38–49. [Google Scholar] [CrossRef]
  6. Moitzi, G.; Wagentristl, H.; Refenner, K.; Weingartmann, H.; Piringer, G.; Boxberger, J.; Gronauer, A. Effects of working depth and wheel slip on fuel consumption of selected tillage implements. Agric. Eng. Int. CIGR E-J. 2014, 16, 182–190. [Google Scholar]
  7. Schreiber, M.; Kutzbach, H.D. Influence of soil and tire parameters on traction. Res. Agric. Eng. 2008, 54, 43–49. [Google Scholar] [CrossRef] [Green Version]
  8. Battiato, A.; Diserens, E. Tractor traction performance simulation on differently textured soils and validation: A basic study to make traction and energy requirements accessible to the practice. Soil Tillage Res. 2017, 166, 18–32. [Google Scholar] [CrossRef]
  9. Kim, W.S.; Kim, Y.J.; Baek, S.M.; Baek, S.Y.; Moon, S.P.; Lee, N.G.; Kim, T.J.; Siddique, A.A.; Jeon, H.H.; Kim, Y.S. Effect of the cone index on the work load of the agricultural tractor. J. Drove Control 2020, 17, 9–18. [Google Scholar]
  10. Moinfar, A.M.; Shahgholi, G.; Gilandeh, Y.A.; Gundoshmian, T.M. The effect of the tractor driving system on its performance and fuel consumption. Energy 2020, 202, 117803. [Google Scholar] [CrossRef]
  11. Semetko, J.; Janoško, I.; Pernis, P. Determination of power of multidrive vehicles. Acta Technol. Agric. 2004, 7, 20–23. [Google Scholar]
  12. Arvidsson, J.; Westlin, H.; Keller, T.; Gilbertsson, M. Rubber track systems for conventional tractors—Effects on soil compaction and traction. Soil Tillage Res. 2011, 117, 103–109. [Google Scholar] [CrossRef]
  13. Mudarisov, S.; Gainullin, I.; Gabitov, I.; Khasanov, E. Improvement of traction indicators of a track-chain tractor. Commun. Sci. Lett. Univ. Zilina 2020, 22, 89–102. [Google Scholar] [CrossRef]
  14. Molari, G.; Bellentani, L.; Guarnieri, A.; Walker, M.; Sedoni, E. Performance of an agricultural tractor fitted with rubber tracks. Biosyst. Eng. 2020, 111, 57–63. [Google Scholar] [CrossRef]
  15. Ge, J.; Wang, X.; Kito, K. Comparing tractive performance of steel and rubber single grouser shoe under different soil moisture contents. Int. J. Agric. Biol. Eng. 2016, 9, 11–20. [Google Scholar]
  16. Serrano, J.M.; Peça, J.O.; Marques da Silva, J.; Pinheiro, A.; Carvalho, M. Tractor energy requirements in disc harrow systems. Biosyst. Eng. 2007, 98, 286–296. [Google Scholar] [CrossRef]
  17. Freitag, D.R. Wheels on Soft Soils: An Analysis of Existing Data; Army MRC: Vicksburg, MI, USA, 1965. [Google Scholar]
  18. Grigorev, I.; Kunickaya, O.; Tikhonov, E.; Hertz, E.; Khakhina, A.; Burmistrova, O.; Sukhomlinova, N.; Zhuk, A. Methodology for assessing and managing the environmental performance of skidding and feller buncher tractors. Forests 2021, 12, 1723. [Google Scholar] [CrossRef]
  19. Taghavifar, H.; Mardani, A. Potential of functional image processing technique for the measurements of contact area and contact pressure of a radial ply tire in a soil bin testing facility. Measurement 2013, 46, 4038–4044. [Google Scholar] [CrossRef]
  20. Way, T.R.; Kishimoto, T. Interface pressures of a tractor drive tyre on structured and loose soils. Biosyst. Eng. 2004, 87, 375–386. [Google Scholar] [CrossRef]
  21. Kučera, M.; Helexa, M.; Molenda, M. Selected tire characteristics and their relation to its radial stiffness. MM Sci. J. 2016, 9, 1524–1530. [Google Scholar] [CrossRef]
  22. Janulevičius, A.; Damanauskas, V. How to select air pressures in the tires of MFWD (mechanical front-wheel drive) tractor to minimize fuel consumption for the case of reasonable wheel slip. Energy 2015, 90, 691–700. [Google Scholar] [CrossRef]
  23. Šmerda, T.; Čupera, J. Tire inflation and its influence on drawbar characteristics and performance—Energetic indicators of a tractor set. J. Terramech. 2010, 47, 395–400. [Google Scholar] [CrossRef]
  24. Battiato, A.; Diseren, E. Influence of tyre inflation pressure and wheel load on the traction performance of a 65 kW MFWD tractor on a cohesive soil. J. Agric. Sci. 2013, 5, 197–215. [Google Scholar] [CrossRef]
  25. Gee-Clough, D.; McAllister, R.M.; Evernden, D.W. Tractive performance of tractor drive tyres. J. Agric. Eng. Res. 1977, 22, 385–395. [Google Scholar] [CrossRef]
  26. Helexa, M. Monitoring the impact of tyre inflation pressure on tensile properties of forest tractor. Res. Agric. Eng. 2014, 60, 127–133. [Google Scholar] [CrossRef] [Green Version]
  27. Forster, M.; Ugarte, C.; Lamandé, M.; Faucon, M.P. Relationships between root traits and soil physical properties after field traffic from the perspective of soil compaction mitigation. Agronomy 2020, 10, 1697. [Google Scholar] [CrossRef]
  28. Malý, V.; Kučera, M. Determination of mechanical properties of soil under laboratory conditions. Res. Agric. Eng. 2014, 60, 66–69. [Google Scholar] [CrossRef] [Green Version]
  29. Malý, V.; Tóth, F.; Mareček, J.; Krčálová, E. Laboratory test of the soil compaction. Acta Univ. Agric. Et Silvic. Mendel. Brun. 2015, 63, 77–85. [Google Scholar] [CrossRef] [Green Version]
  30. Zhang, Y.; Zhang, L.; Wand, W.; Li, Y.; Zhang, Q. Design and implementation of a two-wheel and hopping robot with a linkage mechanism. IEEE Access 2018, 6, 42422–42429. [Google Scholar] [CrossRef]
  31. Ding, L.; Gao, H.; Deng, Z.; Nagatani, K.; Yoshida, K. Experimental study and analysis on driving wheels’ performance for planetary exploration rovers moving in deformable soil. J. Terramech. 2011, 48, 27–45. [Google Scholar] [CrossRef]
  32. Wang, X.L.; Yamazaki, M.; Tanaka, T. Characteristics of soil reactions of an open lugged wheel under paddy soil conditions. J. Terramech. 1995, 32, 115–125. [Google Scholar] [CrossRef]
  33. Salokhe, V.M.; Manzoor, S.; Gee-Clough, D. The measurement of forces on a cage wheel lug when operating in wet clay soil. Soil Tillage Res. 1989, 14, 327–340. [Google Scholar] [CrossRef]
  34. Md-Tahir, H.; Zhang, J.; Xia, J.; Zhou, Y.; Zhou, H.; Du, J.; Sultan, M.; Mamona, H. Experimental investigation of traction power transfer indices of farm-tractors for efficient energy utilization in soil tillage and cultivation operations. Agronomy 2021, 11, 168. [Google Scholar] [CrossRef]
  35. Gasparetto, E.; Febo, P.; Pessina, D.; Rizzato, E. The rolling resistance of narrow steel wheels in Italian paddy fields. J. Agric. Eng. Res. 1992, 52, 91–100. [Google Scholar] [CrossRef]
  36. Hendriadi, A.; Salokhe, V.M. Improvement of a power tiller cage wheel for use in swampy peat soils. J. Terramech. 2002, 39, 55–70. [Google Scholar] [CrossRef]
  37. Fajardo, A.L.; Suministrado, D.C.; Peralta, E.K.; Bato, P.M.; Paningbatan, E.P. Force and puddling characteristics of the tilling wheel of float-assisted tillers at different lug angle and shaft speed. Soil Tillage Res. 2014, 140, 118–125. [Google Scholar] [CrossRef]
  38. Nakanishi, R.; Nakashima, H.; Miyasaka, J.; Ohdoi, K. Tractive performance analysis of a lugged wheel by open-source 3D DEM software. J. Terrramech. 2020, 92, 51–65. [Google Scholar] [CrossRef]
  39. Watyotha, C.; Salokhe, V.M. PM—Power and machinery: Tractive performance of cage wheels with opposing circumferential lugs. J. Agric. Eng. Res. 2001, 79, 389–398. [Google Scholar] [CrossRef]
  40. Triratanasirichai, K.T.; Oida, A.; Honda, M. The performance of cage wheels for small power tillers in agricultural soil. J. Terramech. 1990, 27, 193–205. [Google Scholar] [CrossRef]
  41. Hermawan, W.; Yamazaki, M.; Oida, A. Experimental analysis of soil reaction on a lug of a movable lug wheel. J. Terramech. 1998, 35, 119–135. [Google Scholar] [CrossRef]
  42. Yang, Y.; Yi, S.; Shugen, M. Drawbar pull of a wheel with an actively actuated lug on sandy terrain. J. Terramech. 2014, 56, 17–24. [Google Scholar] [CrossRef]
  43. Wilson, C.A.; Kushwaha, R.L.; Mehta, A.V. Performance of Dyna-bite traction system. SAE Trans. 1993, 102, 265–271. Available online: http://www.jstor.org/stable/44722932 (accessed on 11 October 2021).
  44. Walker, J.T. Dyna-bite tractor tire attachment performance in clay soil. Trans. ASAE 1986, 29, 1213–1217. [Google Scholar] [CrossRef]
  45. Traction Enhancing Device Including Flexible Frame Means for Agricultural Wheeled Tractors and the Like. U.S. 5,242,214; United States Patent and Trademark Office: Alexandria, VA, USA, 1993; Available online: https://patents.google.com/patent/US5242214A/enhttps://www.farmshow.com/a_article.php?aid=9483 (accessed on 11 October 2021).
  46. Kumar, A.; Grover, K.; Budania, B. Optimization of Connecting Rod Parameters Using CAE Tools. Int. J. Latest Trends Eng. Technol. 2012, 3, 1–7. Available online: https://www.ijltet.org/wp-content/uploads/2012/10/15.pdf (accessed on 11 June 2021).
  47. Ghodake, M. Weight optimalization of alloy wheel. Int. J. Eng. Technol. 2017, 4, 547–553. Available online: https://www.irjet.net/archives/V4/i9/IRJET-V4I993.pdf (accessed on 18 June 2021).
  48. Majdan, R.; Abrahám, R.; Tkáč, Z.; Mojžiš, M. Drawbar parameters of tractor with prototypes of driving wheels and standard tyres. Acta Technol. Agric. 2018, 21, 63–68. [Google Scholar] [CrossRef] [Green Version]
  49. Abrahám, R.; Majdan, R.; Drlička, R. Special tractor driving wheels with two modification of spikes inclination angle. Agron. Res. 2019, 17, 333–342. [Google Scholar]
  50. Abrahám, R.; Varga, F.; Majdan, R.; Mojžiš, M. Design of improvement of adhesive properties of tyres on snow, ice and soil. Acta Technol. Agric. 2012, 15, 1–4. [Google Scholar]
  51. STN ISO 789-9; Power Test for Drawbar. Slovak Office of Standards. Metrology and Testing: Bratislava, Slovakia, 1993.
  52. Rasool, S.; Raheman, H. Improving the tractive performance of walking tractors using rubber tracks. Biosyst. Eng. 2018, 167, 51–62. [Google Scholar] [CrossRef]
  53. Varani, M.; Mattetti, M.; Maraldi, M.; Molari, G. Mechanical devices for mass distribution adjustment: Are they really convenient? Agronomy 2020, 10, 1820. [Google Scholar] [CrossRef]
  54. Rasool, S.; Raheman, H.; Upadhyay, G. Development of an instrumentation system for evaluating the tractive performance of walking tractors. Int. J. Curr. Microbiol. Appl. Sci. 2017, 6, 759–770. [Google Scholar] [CrossRef]
  55. Majdan, R.; Abrahám, R.; Tkáč, Z.; Drlička, R.; Matejková, E.; Kollárová, K.; Mareček, J. Static lateral stability of tractor with rear wheel ballast weights: Comparison of ISO 16231-2 (2015) with experimental data regarding tyre deformation. Appl. Sci. 2021, 11, 381. [Google Scholar] [CrossRef]
  56. Badules, J.; Vidal, M.; Boné, A.; Gil, E.; García-Ramos, F.J. CFD models as a tool to analyze the performance of the hydraulic agitation system of an air-assisted sprayer. Agronomy 2019, 9, 769. [Google Scholar] [CrossRef] [Green Version]
  57. Upadhyay, G.; Raheman, H.; Rasool, S. Three dimensional modelling and stress analysis of a powered single acting disc harrow using FEA. Curr. Agric. Res. J. 2017, 5, 203–219. [Google Scholar]
  58. Fernández, R.E.H.; Carranza-Cañadas, P.; García-Salcedo, F.J.; Triviño-Tarradas, P. Parameterisation and optimisation of a hand-rake sweeper: Application in olive picking. Agriculture 2020, 10, 379. [Google Scholar] [CrossRef]
  59. Bader, Q.; Kadum, E. Mean stress correction effects on the fatigue life behavior of steel alloys by using stress life approach theories. Int. J. Eng. Technol. 2014, 14, 50–58. [Google Scholar]
  60. de Jesus, A.M.P.; Matos, R.; Fontoura, B.F.C.; Rebelo, C.; da Silva, L.S.; Veljkovic, M. A comparison of the fatigue behavior between S355 and S690 steel grades. J. Constr. Steel Res. 2012, 79, 140–150. [Google Scholar] [CrossRef]
  61. Watyotha, C.; Gee-Clough, D.; Salokhe, V.M. Effect of circumferential angle, lug spacing and slip on lug wheel forces. J. Terramech. 2001, 38, 1–14. [Google Scholar] [CrossRef]
  62. Irani, R.A.; Bauer, R.J.; Warkentin, A. A dynamic terramechanic model for small lightweight vehicles with rigid wheels and grousers operating in sandy soil. J. Terramech. 2011, 48, 307–318. [Google Scholar] [CrossRef]
  63. Ozaki, S.; Hinata, K.; Senatore, C.; Iagnemma, K. Finite element analysis of periodic ripple formation under rigid wheels. J. Terramech. 2015, 61, 11–22. [Google Scholar] [CrossRef]
  64. Abrahám, R.; Majdan, R.; Kollárová, K.; Tkáč, Z.; Olejár, M.; Matejková, E.; Kubík, Ľ. Frequency spectra analysis of drawbar pulls generated by special driving wheels improving tractive performance. Sensors 2021, 21, 2903. [Google Scholar] [CrossRef] [PubMed]
  65. Henriques, B.; Carvalho, M.; Tavares, S.M.O.; de Castro, P.M.S.T. A comparison of safety factor values for Soderberg and DIN 743 fatigue analyses. U. Porto J. Eng. 2021, 7, 11–21. [Google Scholar] [CrossRef]
  66. DIN 743; Calculation of Load Capacity of Shafts and Axles. German Institute for Standardization: Berlin, Germany, 2012.
Figure 1. Principle of the spike tires: (a) design (spikes in the protruded position), (b) application on tractor wheel (spikes in the base position), and (c) principle of the control lever mechanism. 1—spike segment; 2—spikes; 3—control wire strand; 4—carrier wire strand; 5—control lever mechanism; 6, 11—pins of control lever mechanism; 7—pin for control wire strand; 8—pin for carrier wire strand; 9—groove in tire; 10—safety screw.
Agriculture 12 00471 g001
Figure 2. Principle of the spike tires without pins and wire strands: (a) spikes in the base position, (b) change of spike positions, and (c) spikes in the protruded position. 1—tire; 2—groove in tire; 3—spike segment; 4, 8—hole for pin; 5—hole for pin of the control wire strand; 6—hole for pin of the carrier wire strand; 7—hole for safety screw; 9—control lever mechanism.
Agriculture 12 00471 g002
Figure 3. Spike segments: 1—spikes; 2—horizontal rod; 3—side steel strip.
Agriculture 12 00471 g003
Figure 4. Forces and reactions acting on the spike segment: (a) spike segment with tire, (b) details: FT—tangential force acting on the spike, FN—normal force from soil penetration, RT and RN—tangential and normal reactions in tire tread pattern from the spike segment, RW—reaction in the control wire strand, RC—reaction in the rod of the control mechanism, TL—load moment, TR—reaction moment, S—support, and α—inclination angle of control lever, a, b, and c—the force arms.
Agriculture 12 00471 g004
Figure 5. The system for measuring the drawbar pull of the tractor at 100% wheel slip: 1—test tractor; 2—force sensor; 3—load tractor; D—drawbar pull.
Agriculture 12 00471 g005
Figure 6. Characteristics of a fatigue analysis: (a) zero-based loading and (b) mean stress correction theory (Goodman, Soderberg, and Gerber).
Agriculture 12 00471 g006
Figure 7. Experimental data (1st gear): (a) spike tires and (b) standard tires.
Agriculture 12 00471 g007
Figure 8. Model of the spike segment (actual design): (a) boundary conditions and loads applied, (b) Mesh quality, and (c) Detail of finite element mesh.
Agriculture 12 00471 g008
Figure 9. Results of the fatigue analysis of the spike segment (semilogarithmic scale).
Agriculture 12 00471 g009
Figure 10. Diameter reduction of the horizontal rod (10 mm) at 100,000 load cycles: (a) calculated alternating stress (MPa) with the most stressed places indicated by black arrows and (b) the safety factor.
Agriculture 12 00471 g010
Table 1. Soil properties of the experimental area.
ParameterUnitValue
soil order Chernozem
soil texture loamy sand
gravel%15.3
sand%45.2
silt%35.4
clay%4.1
organic matter%6.62
frictional angle°47.5
cohesionkPa8.4
particle densityg·cm−32.6
moisture content (dry basis)%18.8
Table 2. Penetrometer resistance (MPa).
Depth (cm)
481216202428323640
measurement 10.220.650.801.011.221.241.391.451.691.78
measurement 20.320.860.901.181.241.331.421.541.651.93
measurement 30.390.721.101.201.381.391.561.601.832.11
average0.310.740.931.131.281.321.461.531.721.94
standard deviation0.090.110.150.120.090.080.090.080.090.17
Table 3. Mechanical properties of the spike segment material.
MaterialYoung′s ModulusPoisson′s RatioTensile Yield StrengthUltimate Tensile Strength
(GPa) (MPa)(MPa)
S3552100.3355470
Table 4. Drawbar pulls of four measurements (N).
Wheel TypeGearLevelNumber of Measurements
1234
Standard tires1stMinimum1966213418561893
Spike tiresMaximum4079413636173979
Table 5. Safety factors for various designs of the spike segment.
Connection Rod Diameter (mm)Number of Cycles
100010,000100,0001,000,000
81.040.870.770.67
101.731.441.281.11
122.692.232.011.73
Publisher’s Note: MDPI stays neutral with regard to jurisdictional claims in published maps and institutional affiliations.