Article

Side Deep Fertilizing of Machine-Transplanted Rice to Guarantee Rice Yield in Conservation Tillage

College of Agriculture, Yangtze University, Jingzhou 434025, China
*
Author to whom correspondence should be addressed.
These authors contributed equally to this work.
Agriculture 2022, 12(4), 528; https://doi.org/10.3390/agriculture12040528
Submission received: 14 February 2022 / Revised: 3 April 2022 / Accepted: 3 April 2022 / Published: 8 April 2022
(This article belongs to the Special Issue Innovative Conservation Cropping Systems and Practices)

Abstract

:
Conservation tillage is an environmentally friendly and economical farming method, but its impact on rice yield is controversial. Artificially applied side deep fertilizing of machine-transplanted rice is when fertilizer is applied to the deep soil along with the machine transplantation of rice; this may improve the fertilizer utilization rate and rice yield and eliminate the possible negative effects of conservation tillage on rice yield. Using on machine-transplanted rice, this study aims to compare the effects of side deep fertilizing (SDF). We investigated the effects of artificially applying fertilizer (AAF) on rice growth and yield under conventional tillage (CT), reduced tillage (RT), and no tillage (NT). The rice root activity, root dry weight, leaf area index (LAI), net photosynthetic rate (Pn), chlorophyll content, panicle density, spikelets per panicle, and yield were all ranked as NT > RT > CT and SDF > AAF. The 1000-grain weight was also ranked as SDF > AAF. In addition, under NT conditions, the positive effect of SDF on rice growth and yield was higher than under RT and CT conditions. In general, conservation tillage combined with SDF saved costs and increased rice yield.

1. Introduction

Rice (Oryza sativa L.) is the main food source for more than half of the world’s population and the most important food crop in Asia [1]. Tillage changes the distribution of soil nutrients and the stability of aggregates, reduces soil compactness, and allows air to enter deep soil [2]. Tillage can improve soil properties, promote rice growth, and increase rice yield [3]. However, the long-term use of conventional tillage (CT) has increased the degradation of organic matter, reduced the soil microbial content and enzyme activity, and caused a decline in soil function and soil erosion [4,5]. Since the 21st century, rural depopulation in China has not allowed the long-term development of traditional frequency tillage [6].
Conservation tillage such as reduced tillage (RT) and no tillage (NT) is a tillage technology for the protection of cultivated land. Hart et al. [7] reported that it has become apparent that the concomitant increase in losses of N and P from agricultural land is having a serious detrimental effect on water quality and the environment. Reportedly, conservation tillage promotes rice growth and increases rice yield by protecting soil aggregates [8] and by increasing soil organic matter contents [9], nutrient availability [10], microbial biomass [11,12], and enzyme activity [13]. In addition, conservation tillage has the effects of reducing the input of energy and labor [11] and reducing greenhouse gas emissions [14]. However, there are also reports that under conservation tillage, fertilizers are applied to the soil surface or the shallow soil layer, which increases fertilizer loss and reduces fertilizer use efficiency and rice yield [15].
Agricultural mechanization is an important process used to promote agricultural intensive management, adjust agricultural supply-side reforms, and accelerate the construction of modern agriculture, and it is also the basis for the development of smart agriculture in the future [16]. Machine-transplanted seedlings solve the disadvantages of traditional artificial direct-seeding rice, such as irregular growth, uneven row spacing, and susceptibility to lodging, reduces the labor input and production costs, and increases the planting speed, rice yield, and farmers’ income [17]. Mechanical side deep fertilizing technology ensures that the fertilizer enters the soil cultivation layer, effectively reduces fertilizer loss, and improves fertilizer utilization and rice yield [18]. The side deep fertilizing (SDF) of machine-transplanted rice is an innovative approach, wherein rice seedlings are transplanted and granular fertilizers are applied simultaneously deep in the paddy soils [19]. This technique ensures close contact between nutrients and crop root systems, enhances nutrient absorption and utilization, and improves fertilizer use efficiency [20]. Zhong et al. [21] reported that SDF optimized agronomic traits and yield components, increased grain yield and economic return, and enhanced NPK fertilizer uptake but reduced their application rates. However, the application of SDF in rice production under conservation tillage has not yet been reported.
Aiming at the basal fertilizer application method for machine-transplanted rice, this study compared the effects of side deep fertilizing (SDF), artificially applying fertilizer (AAF), on rice growth and yield under three tillage management systems (CT, RT, and NT); thus, this study provides a reference for the sustainable development of conservation tillage and mechanized rice production.

2. Material and Methods

2.1. Experimental Site

Experiments were conducted during 2017–2019 at the Yangtze University farm, Jingzhou County (112°04′ N–112°05 N, 30°32′ E–30°33′ E), Hubei Province, China. The area belongs to the northern subtropical agricultural climate zone. The annual average temperature was 16.5 °C, the accumulated temperature ≥ 10 °C was 5094.9–5204.3 °C, the annual average precipitation was 1095 mm, and the sunshine time was 1718 h. In the experimental field, the soil texture was clay loam, and the index of the soil agrochemical properties were a pH of 6.02, 32.31 g kg−1 of organic matter, 243.05 mg kg−1 of available N, 11.03 mg kg−1 of available P, and 103.24 mg kg−1 of available K.

2.2. Experimental Design

The experiments were arranged in a split-plot design, with the fertilization methods as the main plot and the tillage managements as subplots, in three replications. The plot size was 5 × 10 m2. Two fertilization methods (SDF and AAF) and three tillage management systems (RT, NT, and CT) were designed, which are briefly introduced as follows.
RT refers to only rotary tillage without plowing as the rice plants were planted; the field was irrigated to 3–4 cm deep after the wheat was harvested so as to prevent weeds (such as barnyard grass and tendon grass); at 3–5 days before rice transplanting, a paddy field stubble burying machine (HUHN RM320, Jining, Shandong, China) was used to press the rice stubble, and a rotary tiller (FENGYUAN 1GZL200, Huzhou, Zhejiang, China) was used to rotate (15 cm deep tillage) once, then field irrigation was performed and a water layer of 1–2 cm was kept in the field until transplanting.
NT means that the soil was not disturbed after the wheat harvest until rice planting. The residue of the wheat straw covered the ground until the rice harvest. At 3 weeks before planting, 60 mL ha−1 Roundup (Organophosphorus herbicides, Monsanto Company, St. Louis, MI, USA) aqua herbicide was sprayed on the field as the soil was drying, and the field had te be kept dry for 5–7 days in order to eliminate weeds; after this, the field was irrigated and kept with a water layer of 1–2 cm until transplanting.
CT is a local conventional tillage method, which is carried out as follows: the paddy field was first soaked with water to a depth of 4–5 cm and then plowed once (with a tillage depth of 25 cm) about 5 days later, and a rotary tillage was conducted (with a tillage depth of 15 cm) 5 days before transplanting; after this, the rice plants were transplanted into the field with a water layer of 1–2 cm.
SDF is completed by an integrated machine used for rice transplanting and fertilizing (Yameike RXA-60TK, Changzhou, Jiangsu, China), by which a basal fertilizer is put at a depth of 20 cm of the topsoil while the rice transplanting is completed. Transplanting and fertilizing are done almost at the same time.
Under the tillage management of CT and RT, AAF is used to apply the basal fertilizer on the day of the rotary tillage, and the basal fertilizer mixes with the soil by rotary tillage, then, the rice seedlings are transplanted by a rice transplanter (Yameike RXA-60TK, Changzhou, China). As NT was adopted, AAF spread the basal fertilizer on the field one day before the mechanical rice transplantation.
Rice was sown on 1 May and transplanted on 1 June in 2019 and 2020. Harvest was on 16 September 2019 and 21 September 2020. The planting density was 25 hills m−2. The experimental plots in which the basal fertilizer was applied to the field using SDF and AAF had the same available nutrient dosage in each plot, with 120 kg ha−1 of N, 59 kg ha−1 of P2O5, and 120 kg ha−1 of K2O, whereas 60% and 40% of N were applied, respectively, as the base fertilizer and tillering fertilizer. All the P2O5 and K2O was applied as base fertilizers. N, P2O5, and K2O were administered in the form of urea, disodium hydrogen phosphate, and potassium chloride, respectively. Rotary tillage was done twice before planting wheat in winter (HUHN RM320, Jining, Shandong, China).

2.3. Measurements

2.3.1. Rice Yield and Its Components

Grain yields and panicle density were measured at maturity by taking 5 m2 plant samples at the center of each plot. The filled grains in each 5 m2 plant sample were separated from the straws. The filled grains were dried in an oven at 70 °C to a stable weight and weighed, and the grain yield was calculated at a 14% moisture content. Rice plant samples plots were taken from 5 planting pits per for the determination of yield components (spikelets per panicle, grain filling rate, and 1000-grain weight).

2.3.2. Root Function

Rice plant samples were selected from 5 planting pits per plot to measure the root dry weight and root activity at the mid-tillering stage, heading stage, grain filling stage, and yellow ripe stage. For each root sample, a cube of soil (25 cm in length × 16 cm in width × 20 cm in depth) around each individual planting pit was removed using a sampling core, and such a cube contains about 95% of total root biomass [22]. The rice plants from 5 planting pits per plot formed a sample at each measurement, and the roots in each cube of soil were carefully rinsed with a hydropneumatic elutriation device (Gillison’s Variety Fabrications, Benzonia, MI, USA). Portions of each root sample were used for the measurement of root activity, which was determined by measuring the oxidation of alpha-naphthylamine (α-NA) [23], whereas the other root samples were dried in an oven at 70 °C to stable weights and weighed. One gram of fresh roots was transferred into a 150 mL flask containing 50 mL of 20 ppm α-NA. The flasks were incubated for 2 h at room temperature in an end-over-end shaker. After this, the aliquots were filtered, and 2 mL of aliquot was mixed with 1 mL of 1.18 mmol−1 NaNO and 1 mL of sulfanilic acid, and the resulting color was measured using a spectrophotometer.

2.3.3. Photosynthetic Properties

Rice plants were selected from 5 planting pits per plot to measure the leaf area index (LAI), net photosynthetic rate (Pn), and total chlorophyll content at the mid-tillering stage, heading stage, grain filling stage, and yellow ripe stage. The LAI of the top fully expanded leaves in the main stem was calculated as the measured leaf area divided by the ground surface area. The Pn of the top fully expanded leaves in the main stem was determined by a gas exchange analyzer (Li-6400, Li-COR Inc., Irving, TX, USA) between 9:30 and 11:00 a.m., when the photosynthetic active radiation above the canopy was 1200 mmol m−2 s−1. After the determination of LAI and Pn, the measured leaves were cut, frozen immediately in liquid nitrogen, and stored at −80 °C for standby. The total chlorophyll content was extracted with about 0.2 g of fresh leaf disks using 25 mL of an alcohol and acetone mixture (v:v = 1:1) for 24 h in the dark at room temperature. The absorbance of the extract was measured at 663, 645, and 470 nm using a UV-VIS spectrophotometer (UV-2600, Shimadzu, Japan) to estimate the total chlorophyll content according to the method reported in [4].

2.4. Statistical Analysis

All the experimental data were collected in 2019 and 2020 and expressed as mean ± standard error (SE) of three replicates. The normal distribution and homogeneity variance of data were tested using Shapiro–Wilk’s test and Levene’s test on SPSS 21.0 (Statistical Product and Service Solutions, IBMLab) [24], respectively. The independent samples t-test was used to compare the differences in the relevant rice indicators between the two years (2019 and 2020). One-way analysis of variance was used to compare the differences between the relevant rice indicators among the tillage methods and fertilization methods, and two-factor analysis of variance was used to compare the impacts of the interaction of the tillage methods and fertilization methods on the rice indicators. In the statistical analysis, two significance levels were set at p < 0.05 and p < 0.01. The diagrams were drawn using the Origin 2017(Origin Lab) mapping software.

3. Results

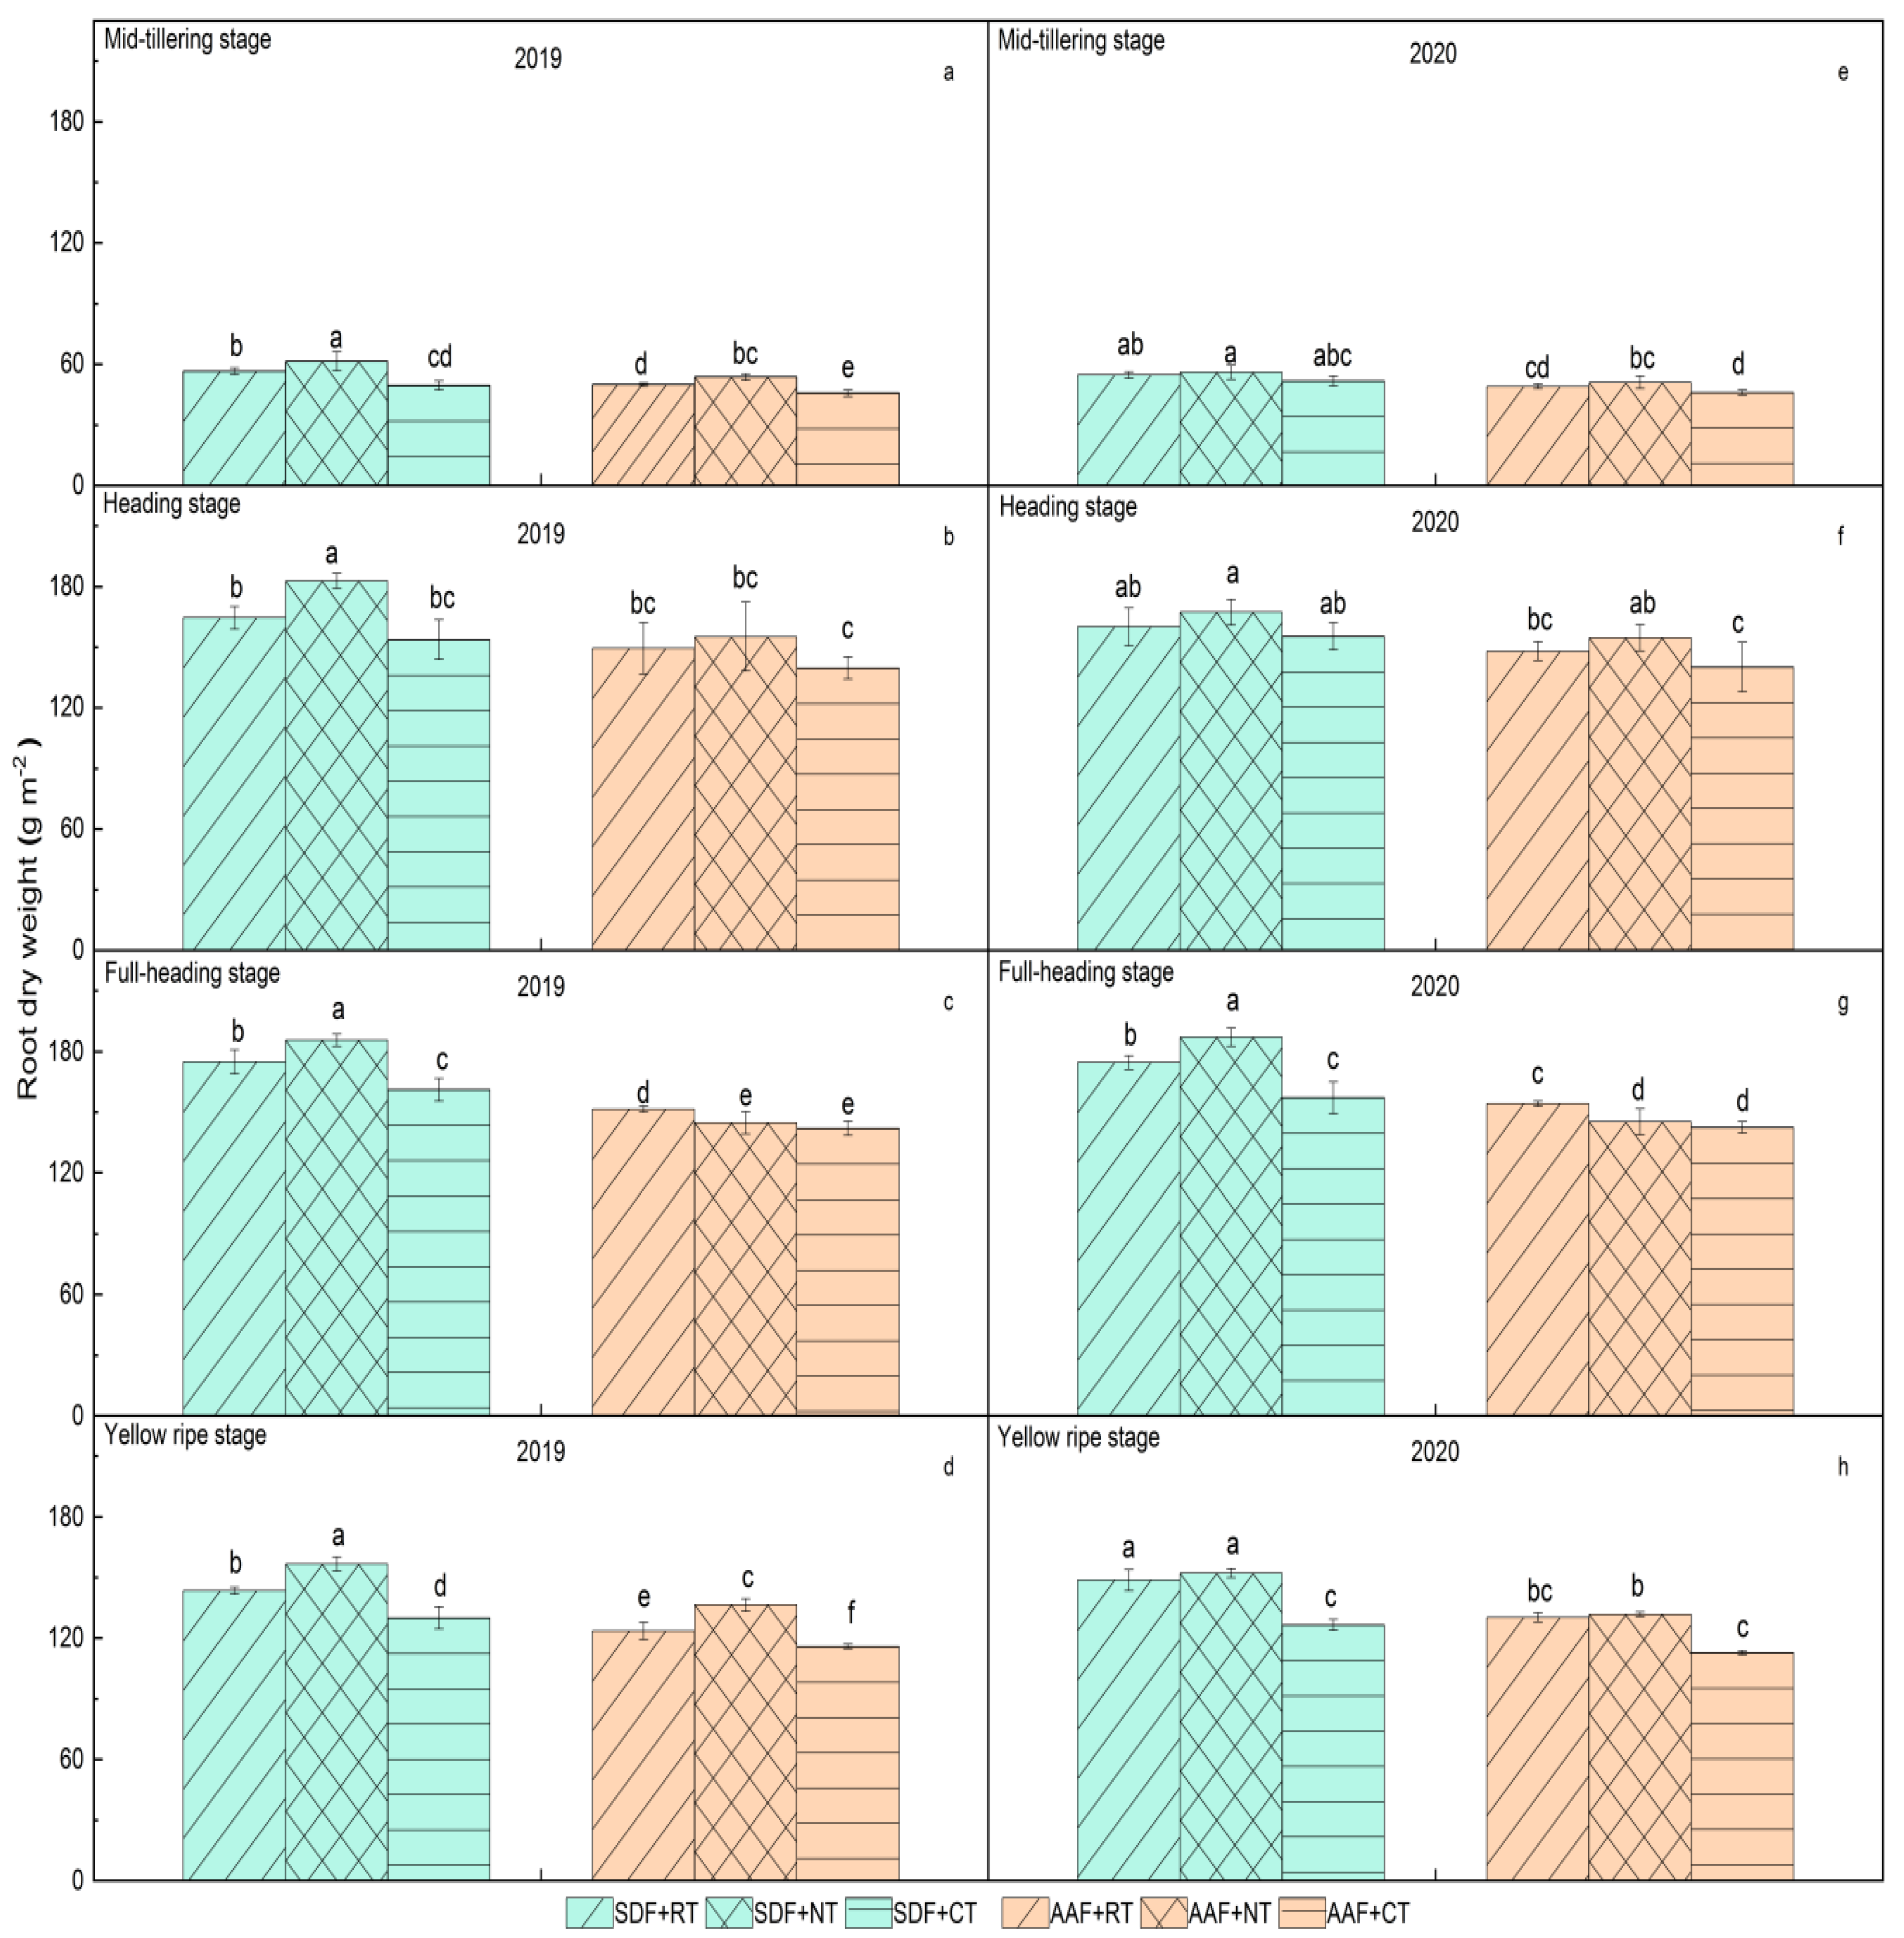
3.1. Root Activity and Root Dry Weight

Figure 1 and Figure 2 show the root activity and root dry weight under different fertilization and tillage systems. The results showed that there was no significant difference in root activity and root dry weight between the two years. With the growth of the rice, the root activity decreased, and the root dry weight increased first and then decreased. Different tillage and fertilization systems had significant effects on root activity and root dry weight. The root activity of SDF + NT was significantly higher than that of the other treatments in the mid-tillering stage, heading stage, full heading stage, and yellow maturity stage. Although AAF + NT was the second highest in the mid-tillering stage, SDF + RT was the second highest in the other growth stages, indicating that the SDF model was helpful in improving rice root activity. In the SDF model, the root activity in each growth stage was ranked as NT > RT > CT; in the AAF model, the root activity in each growth stage was ranked as NT > RT > CT; and the root activity of the NT treatment in the full heading stage and yellow mature stage was significantly higher than that of RT and CT. The results of the two fertilization models show that the NT treatment was helpful in improving the root activity of rice. The root dry weight of the SDF + NT model was significantly higher than that of the other treatments in the mid-tillering stage, heading stage, full heading stage, and yellow maturity stage. In the SDF and AAF models, the root dry weight at each growth stage was ranked as NT > RT > CT. It was concluded that the SDF model is better than the AAF model for rice root growth; the NT model is better than the RT and CT models for rice root growth, and the SDF + NT mode is better for rice root growth in the whole growth period.

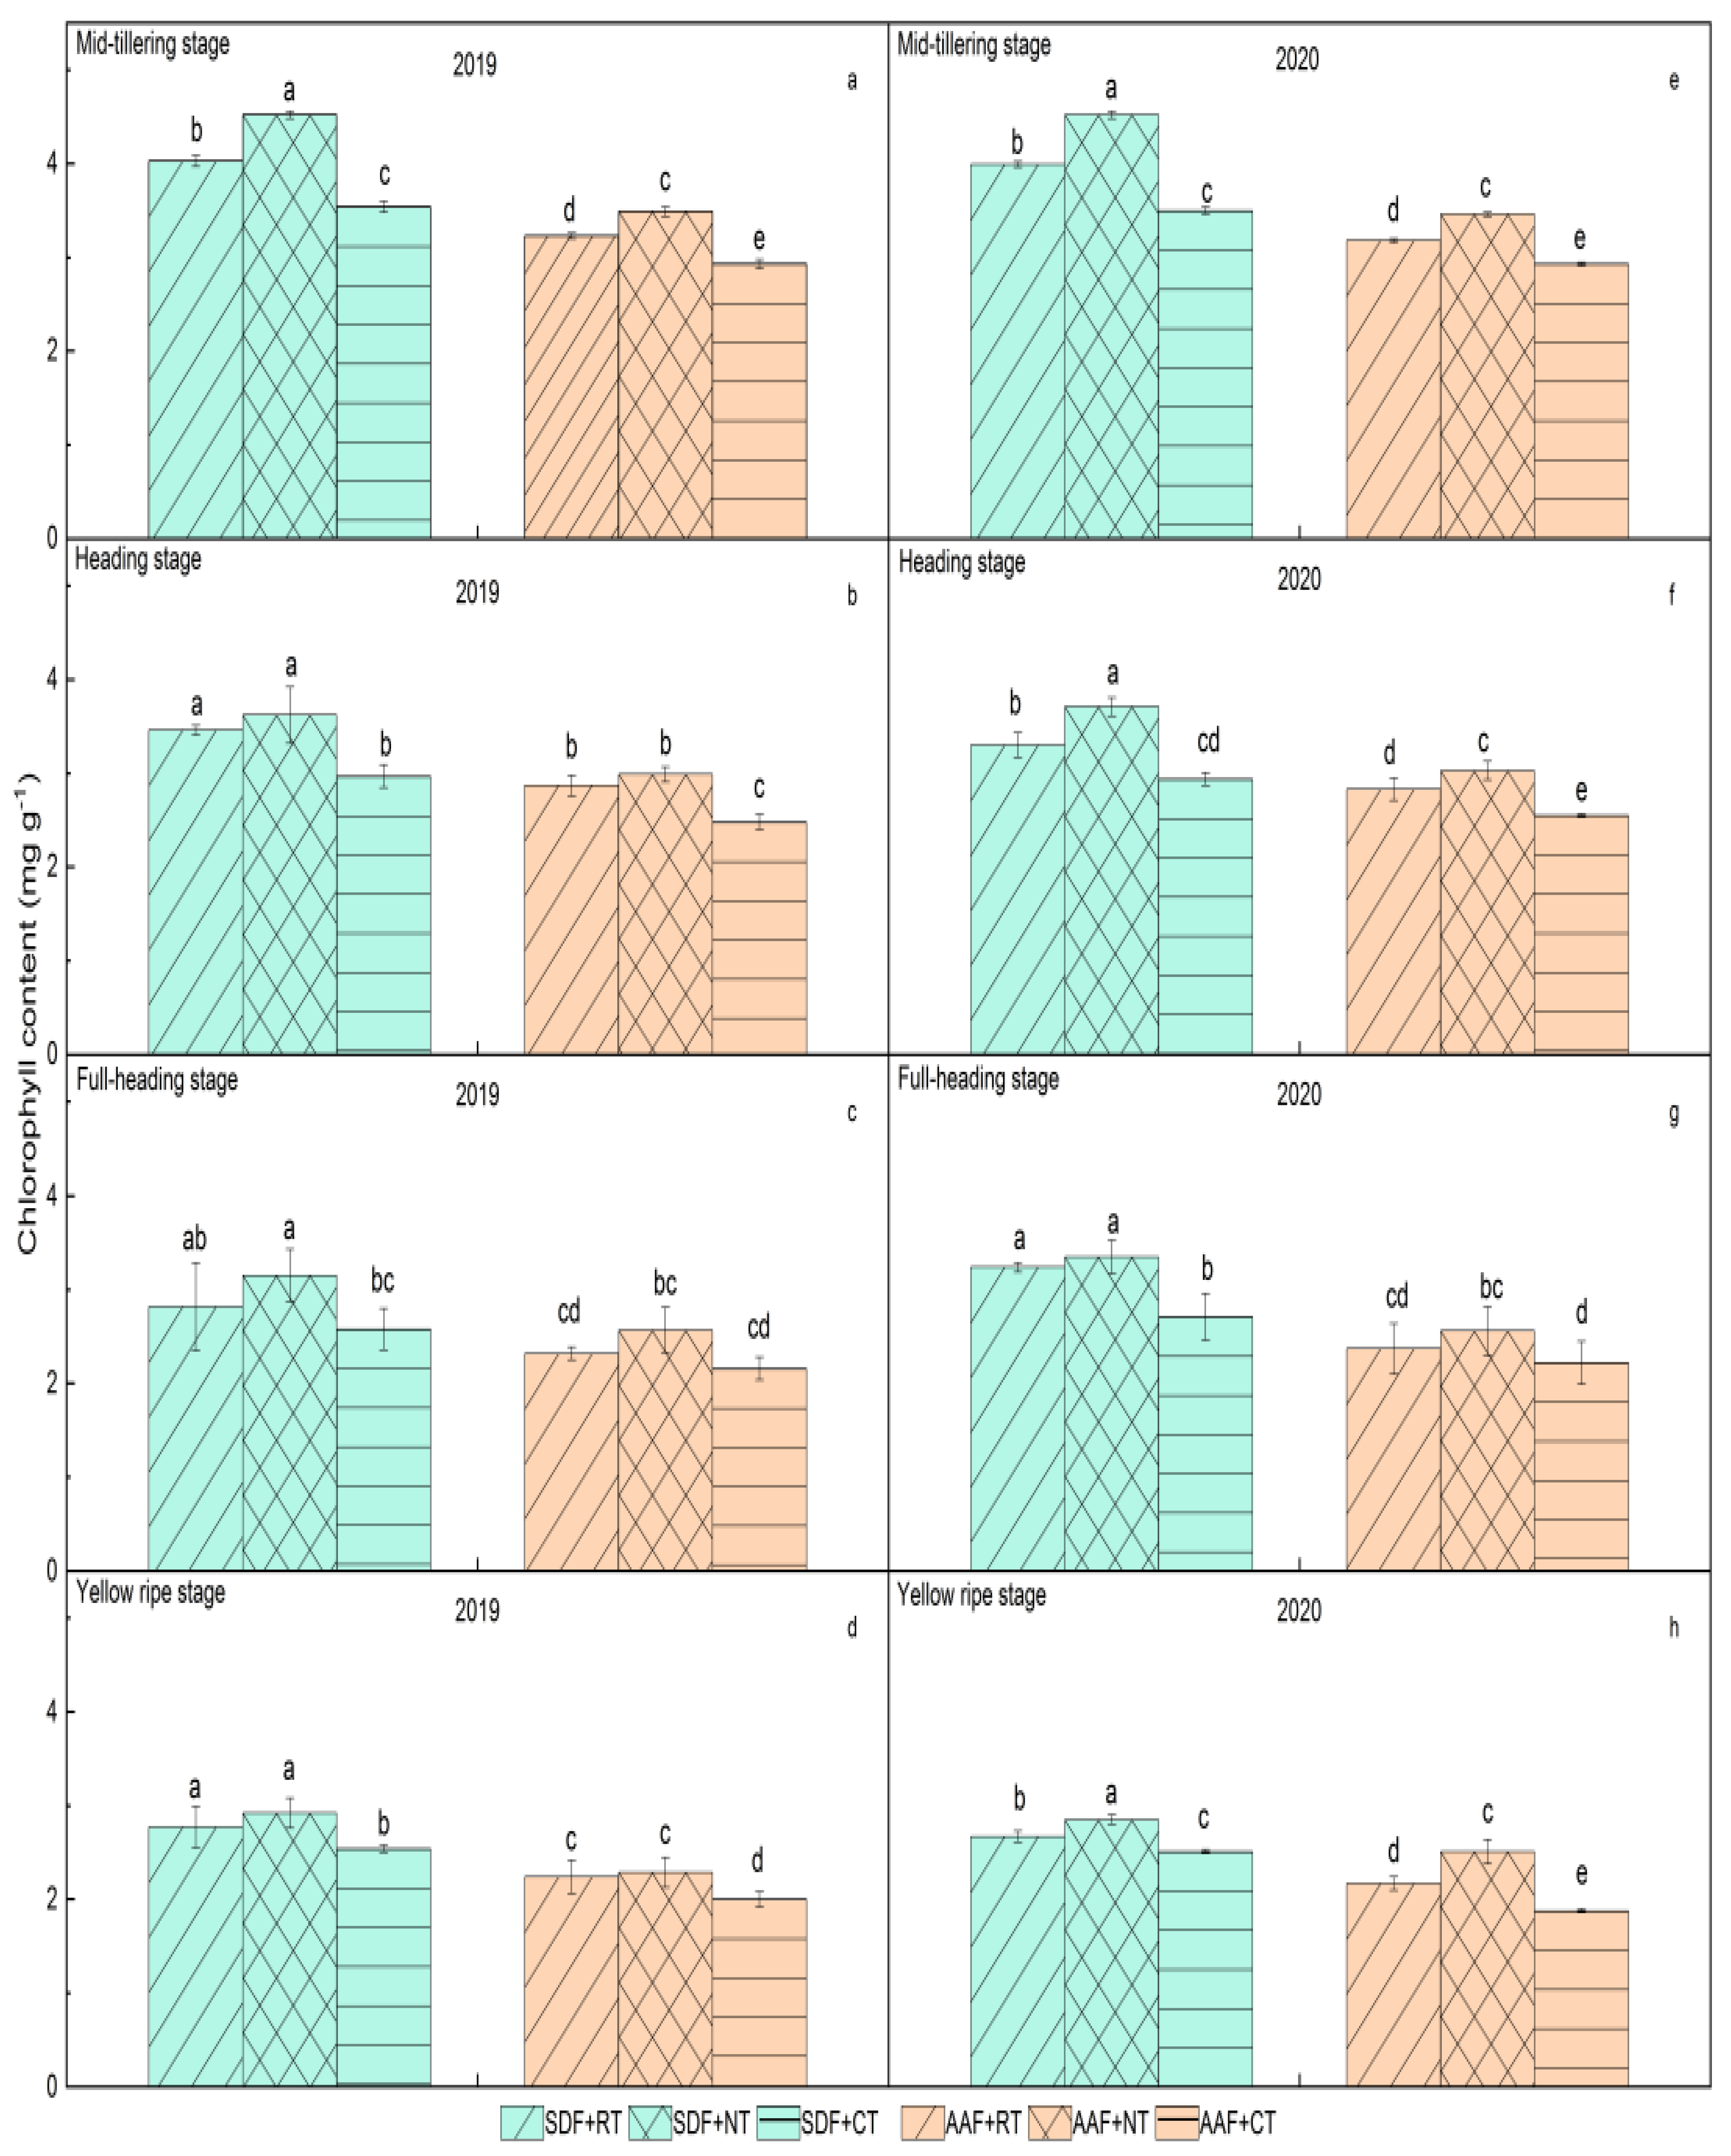
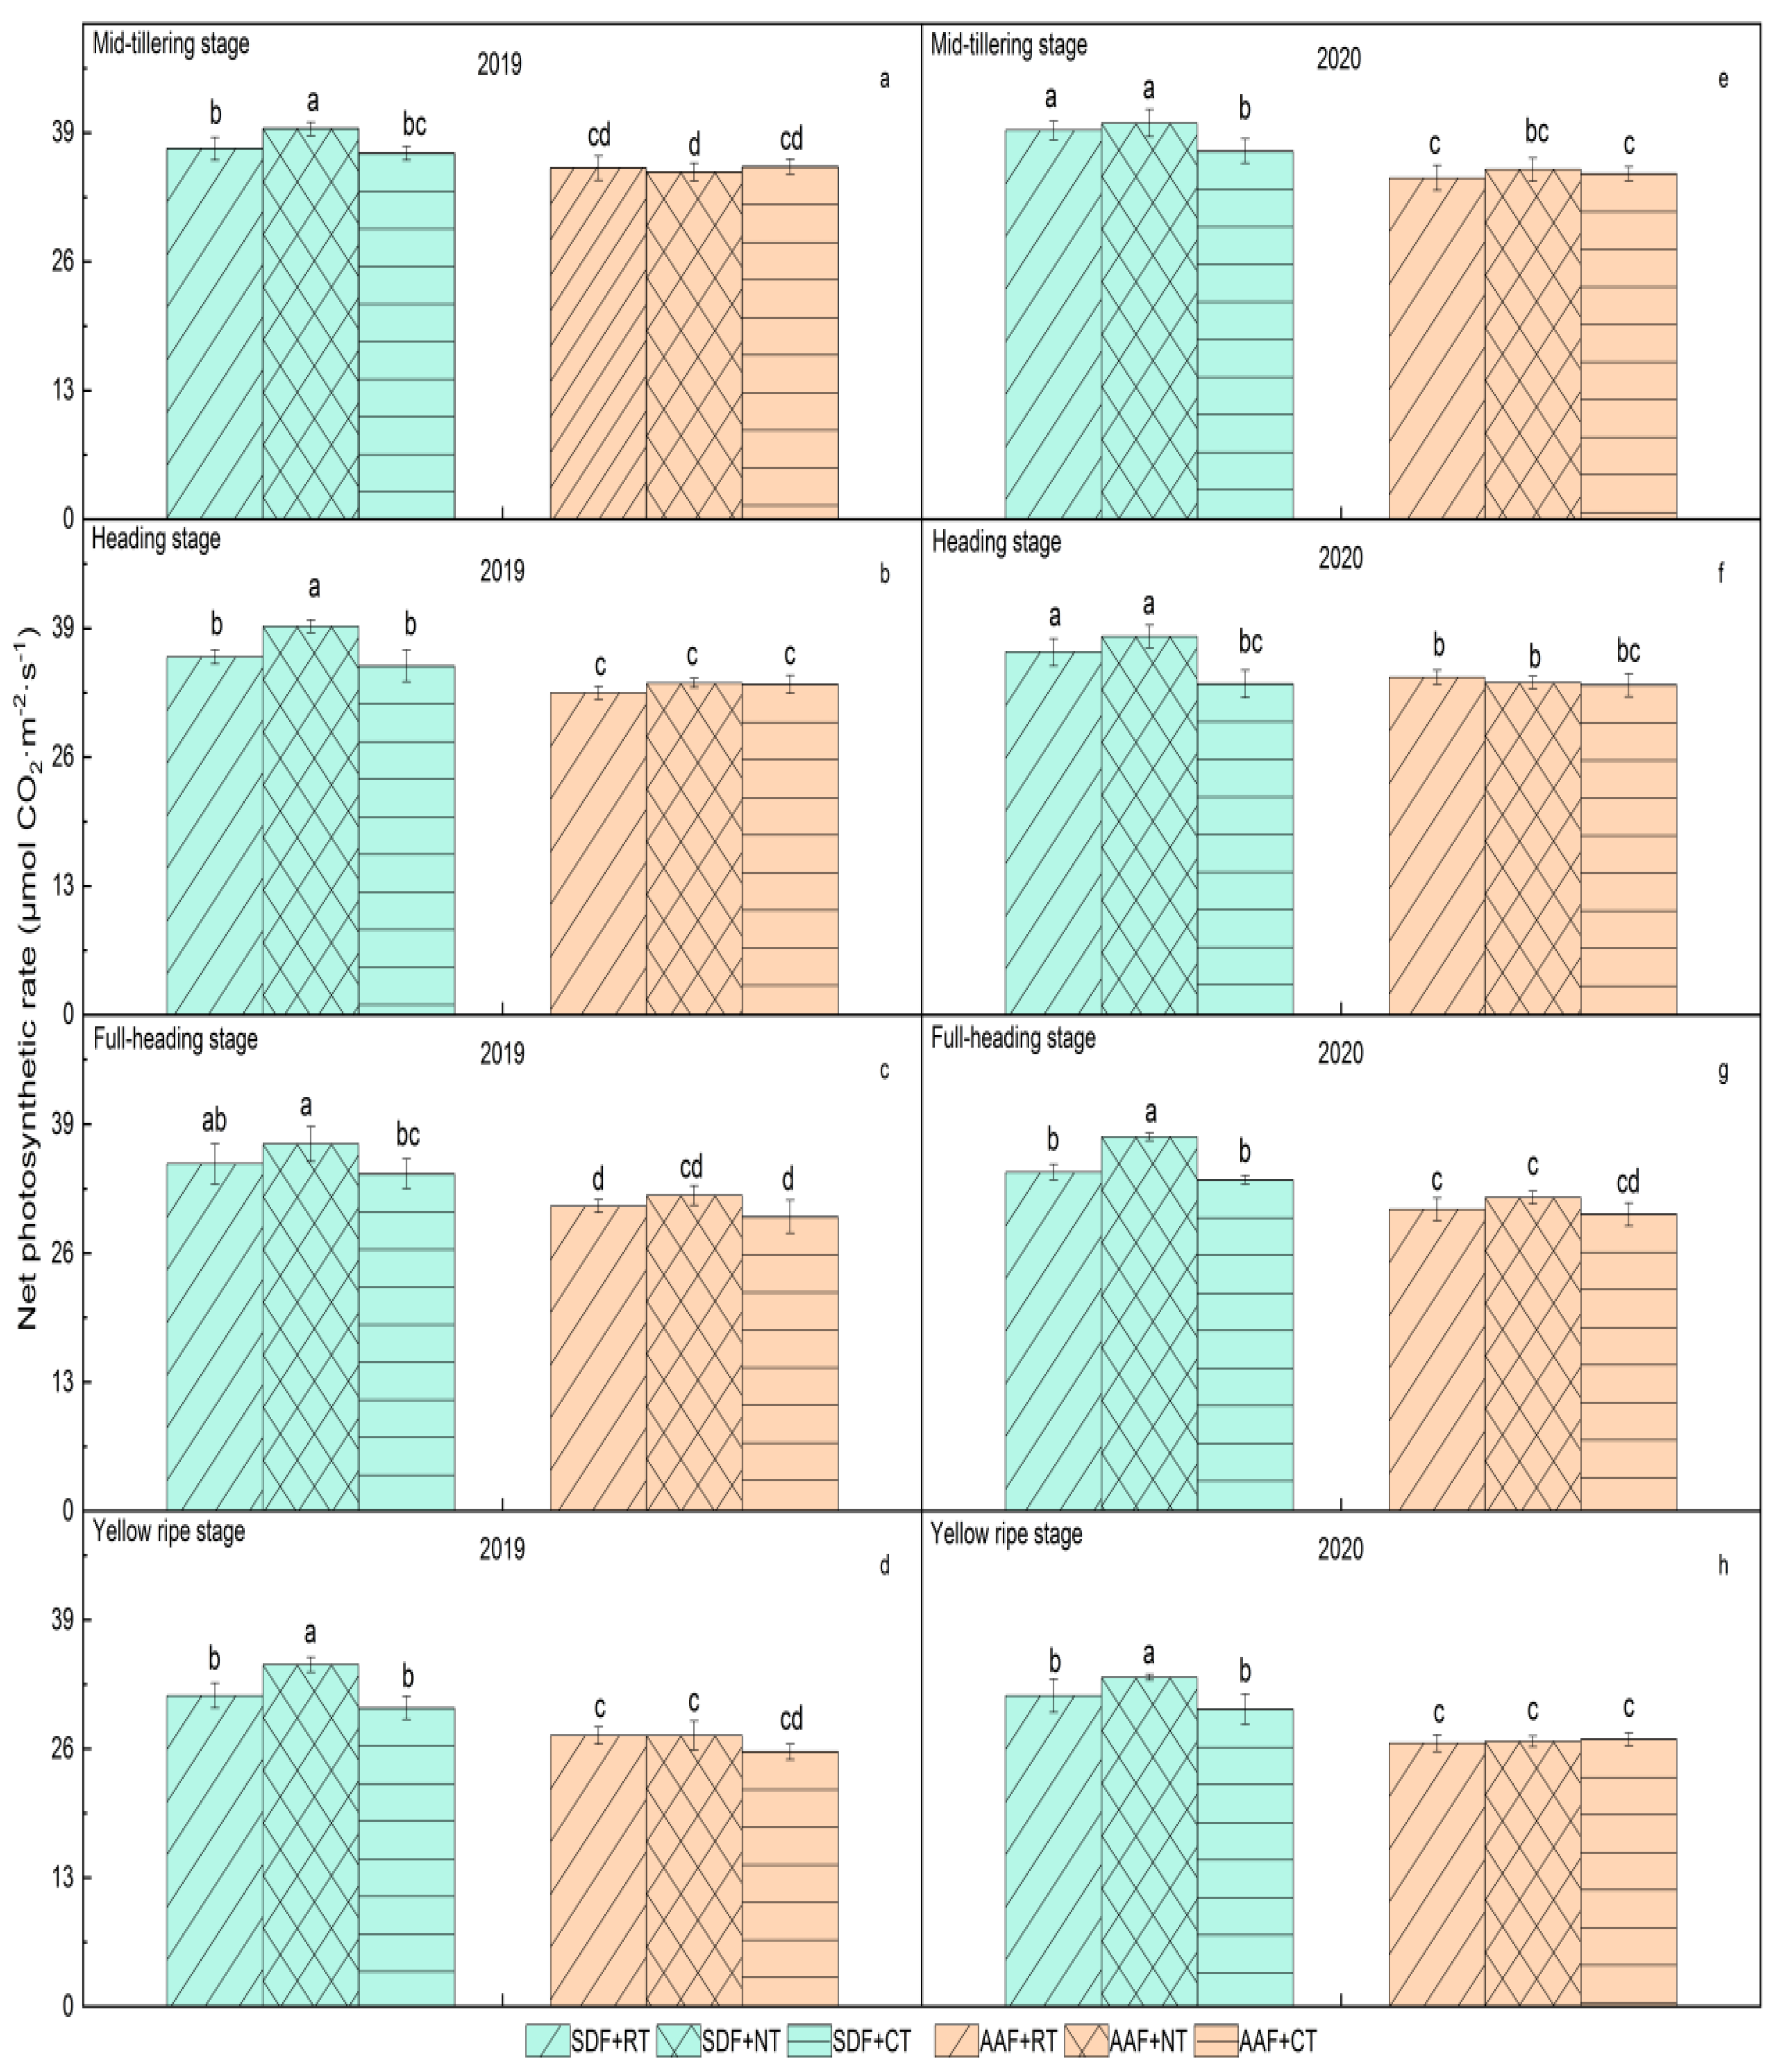
3.2. Leaf Area Index (LAI), Net Photosynthetic Rate (Pn), and Total Chlorophyll Content

As shown in Figure 3, Figure 4 and Figure 5, the interannual differences of LAI, PN, and chlorophyll contents were not significant. With the growth of rice, the photosynthetic rate and chlorophyll content showed a downward trend; the leaf area index first increased and then decreased, and was the highest at the heading stage. The LAI at each growth stage of the SDF and AAF models was ranked as NT > RT > CT, and SDF + NT was the highest. However, there was no significant difference between the mid-tillering stage, SDF + RT, and AAF + NT, and there was no significant difference between the yellow ripening stage and SDF + RT. SDF + NT in the other growth stages was significantly higher than that of the other treatments, indicating that the SDF + NT model was helpful in improving rice leaf growth. In the SDF model, the chlorophyll content in each growth stage was ranked as NT > RT > CT, and NT was significantly higher than RT in the middle growth stage. There was no significant difference between NT and RT in the other growth stages, but they were significantly higher than the CT model. In the AAF model, the chlorophyll content in each growth stage was ranked as NT > RT > CT, and the chlorophyll content in the SDF model was significantly higher than that in AAF under the same tillage model, among which SDF + NT was the highest. However, there was no significant difference between SDF + NT and SDF + RT in the mid-tillering stage and booting stage in 2020; SDF + NT in the other growth stages was significantly higher than that in the other treatments. In the SDF and AAF models, the PN in each growth stage was ranked as NT > RT > CT, and under the same tillage mode, the PN in the SDF model was significantly higher than that in the AAF model. It was concluded that, in the SDF and AAF models, the leaf area index, chlorophyll content, and PN in each growth stage were ranked as NT > RT > CT, and the SDF model is significantly higher than the AAF model, among which the SDF + NT model is the highest, indicating that the SDF + NT model is helpful in improving the rice leaf area and chlorophyll content, so as to improve rice photosynthesis.

3.3. Rice Yield and Its Compositions

Table 1 shows the yield components of rice in 2019 and 2020 under different tillage and fertilization models, and the yield difference between the two years is not significant. The results of the variance analysis showed that the different tillage methods had significant or extremely significant effects on panicle density, grain number per panicle, and yield, and the different fertilization methods had significant effects on panicle density, grain number per panicle, 1000 grain weight, and yield. It can be seen from the data in the table that the yield under the SDF model was significantly higher than that under the AAF fertilization model. The NT yield under the SDF treatment was significantly higher than that of RT and CT, and there was no significant difference in yield among the three tillage methods of AAF treatment. It can be seen that the yield of SDF + NT is the highest, having increased by 14.03~15.17%, 22.06~30.22%, 26.99~30.22%, 19.35~34.43%, and 39.90~40.08%, respectively, compared with SDF + RT, SDF + CT, AAF + RT, and AAF + CT. In terms of yield components, there was no significant difference among the three tillage methods in the SDF model for the panicle density, grain number per panicle, seed setting rate, and 1000 grain weight, whereas NT in the SDF model was significantly higher than RT and CT, indicating that the main reason for the increase in SDF + NT yield was the increase in grain number per panicle.

4. Discussion

4.1. Effects of Tillage and Fertilization Treatments on Root Function

In this study, under different tillage management systems, the root function was ranked in the order of NT > RT > CT. Wang et al. [25] reported that compared with NT, both RT and CT mixed organic matter and fertilizers into deeper soils, which promoted the growth of rice roots in deeper soils. Wang et al. [26] reported that NT reduced the bulk density of the topsoil (0–5 cm) but increased the bulk density of deep soil (>5 cm), and a higher and inconsistent bulk density of deep soil limited root system growth. However, the results of Wang et al. [27] concern long-term (14 years) tillage effects on soil and rice. Long-term NT or RT could increase soil compactness, restrict air from entering deep soil, accumulate reducing substances in deep soil, and limit the growth of rice roots [28]. Das et al. [11] reported that short-term (4 years) NT increased soil organic carbon, microbial biological carbon, and dehydrogenase activity, and provided superior conditions for root growth. This was consistent with our findings, indicating that short-term NT or RT could improve soil conditions and promote root growth, as well as support the finding that the effects of NT were more pronounced than those of RT. The organic matter covering the topsoil in NT decomposes slowly, and the continuously decomposed organic matter also continuously provides nutrients for the rice [8]. In addition, organic matter (rice stalks and dead weeds) cover the topsoil in NT, which could help in maintaining a constant temperature and moisture and improve the growth of microorganisms and the synthesis of soil enzymes [11]. In addition, RT and CT make the organic matter fully integrated with the soil, which promotes the decomposition of organic matter into inorganic nutrients, and the inorganic nutrients unused by plants are lost to the environment [13].
In our study, under different fertilization treatments, the root function was ranked as SDF > AAF, which is consistent with previous studies [29,30]. N is essential to the growth and development of rice, and it participates in many metabolic processes, such as protein hydrolysis and amino acid metabolism [31]. The lack of N in the basal fertilizer limited the supply of nutrients for root growth. Min et al. [30] reported that SDF reduced chemical N fertilizer input without any reductions in yield, whereas it increased nitrogen use efficiency and reduced NH3 volatilization and runoff N losses. In addition, the deep application of the fertilizer could make the fertilizer slowly dissolve in the soil and help retain it in the rice rhizosphere for a longer time such that the fertilizer can provide continuous nutrients for a longer period of time during rice growth [32]. SDF, as compared with AAF, had a better positive effect on root function under NT management, but such an effect did not occur under RT and CT; the reason may be that RT and CT brought organic matter into the deep soil. AAF causes the nutrients of the fertilizer to be retained in the topsoil under NT management, and side deep fertilization may bring fertilizer into the deep soil, which is advantageous for nutrient uptake by plant roots [27]. Therefore, side deep fertilization under NT management is very important for the growth of rice roots.

4.2. Effects of Tillage and Fertilization on Photosynthesis

Generally, under different tillage management systems, the photosynthesis in the four periods was ranked as NT > RT > CT. Our results agree with previous research stating that tillage could cause a decrease in photosynthetic capacity by limiting the nutrient uptake and growth of roots. In this study, under different fertilization treatments, the photosynthesis in the four periods was ranked as SDF > AAF, which is consistent with the findings of a previous study [33]. Leaves accumulated the most N in the plant, and as much as three quarters of leaf N was invested into the photosynthetic apparatus, which was the largest N sink in the plant [34]. It was reported that there was strong positive correlation between photosynthesis and leaf N content [35]. N application in the deep soil layer results in a higher NH4+-N concentration in the soil in the prime stage of rice growth and prolongs the availability of N for 2 months, which improves photosynthesis [36]. In addition, root function is closely related to photosynthesis [37], and higher root activity and root dry weight result in higher LAI, chlorophyll content, and Pn.

4.3. Effects of Tillage and Fertilization Treatments on Rice Yield and Its Compositions

In this study, the spike density, spikelets per panicle, and yield under different tillage management systems were ranked as NT > RT > CT. Conservation tillage, especially NT, may improve soil properties, enhance root function (Figure 1 and Figure 2) and photosynthesis (Figure 3, Figure 4 and Figure 5), increase the absorption of nutrients by the roots and the amount of carbohydrates assimilated by photosynthesis, and promote the formation of yield [38]. Conservation tillage also improves root function and photosynthesis at heading, full heading, and the yellow ripe stage, but only increases the rice “sink capacity” (that is, spikelet density) and does not increase the grain filling rate and 1000-grain weight. The reason may be the mutual restriction between the yield components [38]; the larger storage capacity formed in the early stage requires more carbohydrate filling. Therefore, on the basis of conservation tillage, increasing the nutrient supply in the later stage of rice growth could further increase the yield of rice. In our study, spike density, spikelets per panicle, 1000-grain weight, and yield under different fertilization treatments were ranked as SDF > AAF, which is consistent with the findings of a previous study [31]. The deep placement of N has a catalytic effect on roots, which provides more N in the deep root layer, ensures a longer availability of N, promotes plant N uptake, and increases crop yield [38].

5. Conclusions

From our findings, it can be concluded that under no tillage conditions, the positive effect of side deep fertilizing on rice growth and yield was higher than under reduced tillage and conventional tillage conditions. On the whole, side deep fertilizing under conservation tillage not only retains the advantages of conservation tillage for environmental protection, but also saves costs and maintains the high yield of rice, which is of value as a reference for the sustainable development of agriculture.

Author Contributions

Q.-X.W., B.D. and S.-C.J., conceptualization; Q.-X.W., B.D. and J.-Q.Z., methodology; B.D., S.-C.J. and Q.-X.W., formal analysis; Q.-X.W., B.D. and S.-C.J., investigation/writing—original draft/supervision; B.D., S.-C.J. and H.-W.Z., visualization; H.-W.Z., Q.-X.W. and S.-C.J., data curation; Q.-X.W., B.D. and S.-C.J., writing—review and editing; Q.-X.W., J.-Q.Z., B.D. and S.-C.J., project administration. All authors have read and agreed to the published version of the manuscript.

Funding

This research was funded by the National Natural Science Foundation (U21A2039) and National Key Research and Development Plan (2016YFD0300907).

Conflicts of Interest

The authors declare no conflict of interest.

References

  1. Waqas, A.; Muhammad, Q.; Huang, J.; Dong, W.; Sun, G.; Liu, K.; Meng, Y.; Tang, A.; Sun, M.; Li, C.; et al. Tillage practices improve rice yield and soil phosphorus fractions in two typical paddy soils. J. Soils Sedim. 2020, 20, 850–861. [Google Scholar]
  2. Lav, B.; Jagdish, K.L.; Raj, K.G.; Tirolccadre, S.S.A.; Saharawat, M.; Gathala, Y.S.; Pathak, H. Saving of Water and Labor in a Rice–Wheat System with No-Tillage and Direct Seeding Technologies. Agron. J. 2020, 99, 1288–1296. [Google Scholar]
  3. Das, A.; Lal, R.; Patel, D.; Idapuganti, R.; Layek, J.; Ngachan, S.; Ghosh, P.; Bordoloi, J.; Kumar, M. Effects of tillage and biomass on soil quality and productivity of lowland rice cultivation by small scale farmers in North Eastern India. Soil Tillage Res. 2007, 143, 50–58. [Google Scholar] [CrossRef]
  4. Denardin, L.G.D.O.; Carmona, F.C.; Veloso, M.G.; Martins, A.P.; Freitas, T.F.S.; Carlos, F.S. No-tillage increases irrigated rice yield through soil quality improvement along time. Soil Tillage Res. 2019, 186, 64–69. [Google Scholar] [CrossRef]
  5. Ding, Z.; Kheir, A.S.; Ali, O.A.; Hafez, E.; Elshamey, E.A.; Zhou, Z.; Wang, B.; Lin, X.; Ge, Y.; Fahmy, A.F.; et al. Vermicompost and deep tillage system to improve saline-sodic soil quality and wheat productivity. J. Environ. Manag. 2020, 277, 111388. [Google Scholar] [CrossRef]
  6. Du, B.; Luo, H.W.; He, L.X.; Zheng, A.X.; Chen, Y.L.; Zhang, T.T.; Wang, Z.M.; Hu, L.; Tang, X.R. Deep fertilizer placement improves rice growth and yield in zero tillage. Appl. Ecol. Environ. Res. 2019, 16, 8045–8054. [Google Scholar] [CrossRef]
  7. Hart, M.R.; Quin, B.F.; Nguyen, M.L. Phosphorus runoff from agricultural land and direct fertilizer effects: A review. J. Environ. Qual. 2004, 33, 1954–1972. [Google Scholar] [CrossRef]
  8. Du, B.; He, L.; Lai, R.; Luo, H.; Tang, X. Fragrant rice performances in response to continuous zero-tillage in ma-chine-transplanted double-cropped rice system. Sci. Rep. 2020, 10, 8326. [Google Scholar] [CrossRef]
  9. Huang, M.; Shan, S.; Xie, X.; Cao, F.; Zou, Y. Why high grain yield can be achieved in single seedling ma-chine-transplanted hybrid rice under dense planting conditions? J. Integrat. Agric. 2019, 17, 1299–1306. [Google Scholar] [CrossRef] [Green Version]
  10. Huang, M.; Zhou, X.; Cao, F.; Xia, B.; Zou, Y. No-tillage effect on rice yield in China: A meta-analysis. Field Crops Res. 2018, 183, 126–137. [Google Scholar] [CrossRef]
  11. Huang, M.; Zou, Y.; Feng, Y.; Cheng, Z.; Mo, Y.; Ibrahim, M.; Xia, B.; Jiang, P. No-tillage and direct seeding for super hybrid rice production in rice–oilseed rape cropping system. Eur. J. Agron. 2011, 34, 278–286. [Google Scholar] [CrossRef]
  12. Jiang, M.; Hu, X.; Chunga, J.; Lin, Z.; Fei, R. Does the popularization of agricultural mechanization improve energy-environment performance in China’s agricultural sector? J. Clean. Prod. 2020, 276, 124210. [Google Scholar] [CrossRef]
  13. Jiang, X.; Wright, A.; Wang, J.; Li, Z. Long-term tillage effects on the distribution patterns of microbial biomass and activities within soil aggregates. CATENA 2020, 87, 276–280. [Google Scholar] [CrossRef]
  14. Lampayan, R.M.; Rejesus, R.M.; Singleton, G.; Bouman, B.A. Adoption and economics of alternate wetting and drying water management for irrigated lowland rice. Field Crops Res. 2015, 170, 95–108. [Google Scholar] [CrossRef]
  15. Liang, X.; Zhang, H.; He, M.; Yuan, J.; Xu, L.; Tian, G. No-tillage effects on grain yield, N use efficiency, and nutrient runoff losses in paddy fields. Environ. Sci. Pollut. Res. 2016, 23, 21451–21459. [Google Scholar] [CrossRef]
  16. Liu, X.; Wang, H.; Zhou, J.; Hu, F.; Liu, Y. Effect of N Fertilization Pattern on Rice Yield, N Use Efficiency and Fertilizer–N Fate in the Yangtze River Basin, China. PLoS ONE 2016, 11, e0166002. [Google Scholar] [CrossRef] [Green Version]
  17. Xin, M.; Yang, Y.; Liu, Z.; Sun, Y.; Peng, X. Yield increasing effect of mechanical topdressing of polymer-coated urea mixed with compound fertilizer in cold area rice. J. Plant Nutr. Fertil. 2016, 33, 1095–1103. [Google Scholar]
  18. Modather, M.; Azmi, Y.; Nor, M.; Ahmad, S.; Aimrun, W.; Suha, E. Rotary tillage effects on some selected physical properties of fine textured soil in wetland rice cultivation in Malaysia. Soil Tillage Res. 2017, 194, 104318. [Google Scholar]
  19. Min, J.; Sun, H.; Wang, Y.; Pan, Y.; Kronzucker, H.J.; Zhao, D.; Shi, W. Mechanical side-deep fertilization mitigates am-monia volatilization and nitrogen runoff and increases profitability in rice production independent of fertilizer type and split ratio. J. Clean. Prod. 2019, 316, 128370. [Google Scholar] [CrossRef]
  20. Pandey, D.; Agrawal, M.; Bohra, J.S. Effects of conventional tillage and no tillage permutations on extracellular soil enzyme activities and microbial biomass under rice cultivation. Soil Tillage Res. 2021, 136, 51–60. [Google Scholar] [CrossRef]
  21. Ramasamy, S.; Ten Berge, H.F.M.; Purushothaman, S. Yield formation in rice in response to drainage and nitrogen application. Field Crops Res. 1997, 51, 65–82. [Google Scholar] [CrossRef]
  22. Tang, H.; Li, C.; Shi, L.; Wen, L.; Cheng, K.; Li, W.; Xiao, X. Functional soil organic matter fraction in response to short-term tillage management under the double-cropping rice paddy field in southern of China. Environ. Sci. Pollut. Res. 2021, 28, 48438–48449. [Google Scholar] [CrossRef]
  23. Thakur, A.; Mandal, K.G.; Mohanty, R.K.; Ambast, S.K. Rice root growth, photosynthesis, yield and water productivity improvements through modifying cultivation practices and water management. Agric. Water Manag. 2018, 206, 67–77. [Google Scholar] [CrossRef]
  24. Chaikh, A.; Desgranges, C.; Balosso, J. Statistical methods to evaluate the correlation between measured and calculated dose using a quality assurance method in IMRT. Int. J. Cancer Ther. Oncol. 2015, 3, 3411–3419. [Google Scholar] [CrossRef]
  25. Wang, X.; Qi, J.-Y.; Zhang, X.-Z.; Li, S.-S.; Virk, A.L.; Zhao, X.; Xiao, X.-P.; Zhang, H.-L. Effects of tillage and residue management on soil aggregates and associated carbon storage in a double paddy cropping system. Soil Tillage Res. 2019, 194, 104339. [Google Scholar] [CrossRef]
  26. Wang, X.; Qi, J.; Liu, B.; Kan, Z.; Zhao, X.; Xiao, X.; Zhang, H. Strategic tillage effects on soil properties and agricultural productivity in the paddies of Southern China. Land Degrad. Dev. 2019, 31, 1277–1286. [Google Scholar] [CrossRef]
  27. Yao, Y.; Zhang, M.; Tian, Y.; Zhao, M.; Zhang, B.; Zeng, K.; Zhao, M.; Yin, B. Urea deep placement in combination with Azolla for reducing nitrogen loss and improving fertilizer nitrogen recovery in rice field. Field Crops Res. 2018, 218, 141–149. [Google Scholar] [CrossRef]
  28. Wang, X.; Wang, Y.; Zhang, Y.; Xiang, J.; Zhang, Y.; Zhu, D.; Chen, H. The nitrogen topdressing mode of indi-ca-japonica and indica hybrid rice are different after side-deep fertilization with machine transplanting. Sci. Rep. 2021, 11, 1–15. [Google Scholar]
  29. Chu, G.; Chen, T.; Wang, Z.; Yang, J.; Zhang, J. Morphological and physiological traits of rice roots and their relationships to yield and nitrogen utilization as influenced by irrigation regime and nitrogen rate. Agric. Water Manag. 2021, 203, 385–394. [Google Scholar]
  30. Xue, J.-F.; Liu, S.; Chen, Z.-D.; Chen, F.; Lal, R.; Tang, H.-M.; Zhang, H.-L. Assessment of carbon sustainability under different tillage systems in a double rice cropping system in Southern China. Int. J. Life Cycle Assess. 2014, 19, 1581–1592. [Google Scholar] [CrossRef]
  31. Gulab, S.; Rattan, L.; Ram, S.; Subhash, B.; Anup, D.S.N.B.; Mrinmoy, D.; Jayanta, L.; Poulami, S. Conservation tillage and nutrient management effects on productivity and soil carbon sequestration under double cropping of rice in north eastern region of India. Ecol. Indic. 2019, 105, 303–315. [Google Scholar]
  32. Yang, L.; Wang, Y.; Kobayashi, K.; Zhu, J.; Huang, J.; Yang, H.; Wang, Y.; Dong, G.; Liu, G.; Han, Y.; et al. Seasonal changes in the effects of free-air CO2enrichment (FACE) on growth, morphology and physiology of rice root at three levels of nitrogen fertilization. Glob. Chang. Biol. 2008, 14, 1844–1853. [Google Scholar] [CrossRef]
  33. Zhao, Z.; Gao, S.; Lu, C.; Li, X.; Li, F.; Wang, T. Effects of different tillage and fertilization management practices on soil organic carbon and aggregates under the rice–wheat rotation system. Soil Tillage Res. 2021, 212, 105071. [Google Scholar] [CrossRef]
  34. Zhong, X.; Peng, J.; Kang, X.; Wu, Y.; Luo, G.; Hu, W.; Zhou, X. Optimizing agronomic traits and increasing economic returns of machine-transplanted rice with side-deep fertilization of double-cropping rice system in southern China. Field Crops Res. 2021, 270, 108191. [Google Scholar] [CrossRef]
  35. Zhong, X.; Zhou, X.; Fei, J.; Huang, Y.; Wang, G.; Kang, X.; Hu, W.; Zhang, H.; Rong, X.; Peng, J. Reducing ammonia vo-latilization and increasing nitrogen use efficiency in machine-transplanted rice with side-deep fertilization in a double-cropping rice system in Southern China. Agric. Ecosyst. Environ. 2021, 306, 107183. [Google Scholar] [CrossRef]
  36. Zhu, C.; Xiang, J.; Zhang, Y.; Zhang, Y.; Zhu, D.; Chen, H. Mechanized transplanting with side deep fertilization increases yield and nitrogen use efficiency of rice in Eastern China. Sci. Rep. 2019, 9, 5653. [Google Scholar] [CrossRef] [Green Version]
  37. Zhu, C.; Yang, Y.O.; Diao, Y.; Yu, J.; Luo, X.; Zheng, J.; Li, X. Effects of mechanized deep placement of nitrogen fertilizer rate and type on rice yield and nitrogen use efficiency in Chuanxi Plain, China. J. Integr. Agric. 2021, 20, 581–592. [Google Scholar] [CrossRef]
  38. Jiang, S.; Wang, J.; Luo, H.; Xie, Y.; Feng, D.; Zhou, L.; Shi, L.; Chen, H.; Xu, Y.; Wang, M. Effect of meteorology and soil fertility on direct-seeded rice (Oryza sativa L.) performance in central China. Appl. Ecol. Environ. Res. 2019, 17, 12397–12406. [Google Scholar] [CrossRef]
Figure 1. Root activity at different stages of rice under different tillage and fertilization treatments. (ad) represent the root activity in mid-tillering stage, heading stage, full-heading stage and yellow ripe stage in 2019, respectively. (eh) represent the root activity in mid-tillering stage, heading stage, full-heading stage, and yellow ripe stage in 2020, respectively. SDF + RT: Side Deep Fertilizing and Reduced Tillage. SDF + NT: Side Deep Fertilizing and No Tillage. SDF + CT: Side Deep Fertilizing and Conventional Tillage. AAF + RT: Artificially Applying Fertilizer and Reduced Tillage. AAF + NT: Artificially Applying Fertilizer and No Tillage. AAF + CT: Artificially Applying Fertilizer and Conventional Tillage. Different lowercase letters marked on the histogram mean significant differences among treatments at the 5% level according to Duncan’s multiple-range test (0.05) (similarly hereinafter).
Agriculture 12 00528 g001
Figure 2. Root dry weight at different stages of rice under different tillage and fertilization treatments. (ad) represent the root dry weight in mid-tillering stage, heading stage, and full-heading Scheme 2019, respectively. (eh) represent the root dry weight in mid-tillering stage, heading stage, full-heading stage, and yellow ripe stage in 2020, respectively. Different lowercase letters marked on the histogram mean significant differences among treatments at the 5% level according to Duncan’s multiple-range test (0.05) (similarly hereinafter).
Agriculture 12 00528 g002
Figure 3. Leaf area index (LAI) at different stages of rice under different tillage and fertilization treatments. (ad) represent the leaf area index in mid-tillering stage, heading stage, full-heading stage, and yellow ripe stage in 2019, respectively. (eh) represent the leaf area index in mid-tillering stage, heading stage, full-heading stage, and yellow ripe stage in 2020, respectively. Different lowercase letters marked on the histogram mean significant differences among treatments at the 5% level according to Duncan’s multiple-range test (0.05) (similarly hereinafter).
Agriculture 12 00528 g003
Figure 4. Chlorophyll content at different stages of rice under different tillage and fertilization treatments. (ad) represent the chlorophyll content in mid-tillering stage, heading stage, full-heading stage, and yellow ripe stage in 2019, respectively. (eh) represent the chlorophyll content in mid-tillering stage, heading stage, full-heading stage, and yellow ripe stage in 2020, respectively. Different lowercase letters marked on the histogram mean significant differences among treatments at the 5% level according to Duncan’s multiple-range test (0.05) (similarly hereinafter).
Agriculture 12 00528 g004
Figure 5. Net photosynthetic rate at different stages of rice under different tillage and fertilization treatments. (ad) represent the net photosynthetic rate in mid-tillering stage, heading stage, full-heading stage, and yellow ripe stage in 2019, respectively. (eh) represent the net photosynthetic rate in mid-tillering stage, heading stage, full-heading stage, and yellow ripe stage in 2020, respectively. Different lowercase letters marked on the histogram mean significant differences among treatments at the 5% level according to Duncan’s multiple-range test (0.05) (similarly hereinafter).
Agriculture 12 00528 g005
Table 1. Rice yield and its components under different tillage and fertilization treatments.
YearTreatmentsSpike Density
m2
Spikelets per PanicleGrain Filling Rate
%
1000-Grain Weight
g
Yield
t·ha−1
TillageFertilization
2019SDFRT268.19 ± 10.49 abc177.49 ± 6.45 b74.83 ± 0.76 bcd26.28 ± 1.10 ab9.56 ± 0.33 b
NT279.43 ± 6.10 a194.42 ± 2.29 a73.98 ± 2.00 bcd27.30 ± 0.26 a11.01 ± 0.22 a
CT274.69 ± 16.77 ab172.40 ± 3.69 bc76.06 ± 1.74 abc26.23 ± 1.09 ab9.02 ± 0.93 bc
AAFRT272.58 ± 9.37 abc168.77 ± 2.50 bc75.76 ± 2.65 abcd25.53 ± 0.88 bcd8.67 ± 0.97 bcd
NT256.88 ± 2.2 bcd166.03 ± 4.58 c79.60 ± 2.81 a26.06 ± 0.72 abc8.19 ± 0.16 cde
CT254.47 ± 5.76 cd168.12 ± 8.94 b c71.69 ± 1.87 d24.77 ± 1.50 bcd7.86 ± 0.4 6 de
2020SDFRT262.34 ± 11.52 bc178.32 ± 11.57 b75.4 ± 1.89 a26.41 ± 0.85 ab9.41 ± 0.71 b
NT291.16 ± 11.74 a195.12 ± 9.77 a78.40 ± 2.15 a27.57 ± 0.83 a10.73 ± 0.57 a
CT258.03 ± 13.7 bcd168.28 ± 4.02 bc77.80 ± 5.74 a25.77 ± 1.56 abc8.24 ± 0.53 cd
AAFRT269.2 ± 6.07 b171.13 ± 6.16 bc72.81 ± 1.01 a25.02 ± 1.18 bc8.24 ± 0.50 cd
NT271.28 ± 12.52 b171.40 ± 2.63 bc75.46 ± 0.29 a26.07 ± 1.29 abc8.99 ± 0.74 bc
CT244.07 ± 6.72 def165.59 ± 3.21 c74.12 ± 1.88 a25.40 ± 0.54 bc7.67 ± 0.37 de
Tillage***nsns**
Fertilization****ns****
Tillage × Fertilization*****ns*
Within a column, different lowercase letters following numeric values mean significant differences among treatments at the 5% level according to Duncan’s multiple-range test (0.05). * and ** indicate significant differences at the p < 0.05 and 0.01 levels, respectively. “ns” means not significant between a certain indicator of rice and tillage or fertilization treatment.
Publisher’s Note: MDPI stays neutral with regard to jurisdictional claims in published maps and institutional affiliations.

