1. Introduction
Speculative activity is common among many markets, especially those where transactional costs are minimal and goods traded are standardized and liquid, such as financial markets, including agricultural futures markets. Futures contracts are standardized agreements between two parties to acquire or sell a standardized asset of a certain quantity and quality at a fixed price at a future date. Agricultural commodity producers and consumers, also known as “commercial market participants,” employ them to protect themselves against price movements and volatility. Typically, there is a different amount of demand to hedge against increasing or decreasing prices. This results in a difference between commercial long and commercial short positions, and therefore creates risk premium opportunities, also known as hedging pressure, because commercial hedgers are frequently net short [
1]. Futures market speculators seek to earn these risk premiums. In other words, they take over this price risk in exchange for earning profits. Speculators can also correct price drifts from their fundamental values, as explained by supply and demand factors. For example, according to Du and Dong [
2], who investigated US dairy futures markets, the volatility of both price and trade volume can be explained by flows of new market information. Consequently, it may be argued that some speculative activity is both common and necessary in these markets to make them more efficient and liquid. However, the number of speculators in major international commodity markets has increased considerably in the last two decades because of the market liberalization and financialization of many agricultural commodities, as well as the ability to make cash settlements. However, in some cases, speculative activity can get out of hand when the number of positions held by speculators exceeds the number of positions held by commercial long and short positions. In many cases, even traditional commercial participants engage in speculative activities [
3].
Traditional economic theories that investigate the role and impact of speculation on the price of assets on markets are effective market theories and behavioral finance. Even though speculators bring liquidity and new information, they have, on the other hand, different objectives than typical business users seeking to protect themselves from price risk, and their behavior patterns may result in commodity prices that are not representative of their genuine worth, therefore creating opportunities for price booms and spikes. Recent empirical work on commodity futures has extensively explored futures market volatility and what factors cause it. The cost-of-storage model, which examines inventory quantities, interest rates, and desired profitability to explain price volatility and differences between spot and futures prices, is often used to investigate speculators’ participation in futures markets [
4]. In many studies, it is found that speculation in derivatives markets has no or limited statistically significant effect on price or return volatility and instead benefits the stability of these markets [
5,
6]. Several methodological approaches are used to study the influence of speculation on commodity prices. Granger causality tests and price volatility models (such as the GARCH, stochastic volatility modeling, and others) are used to see if speculation measured by trade volume, commercial-to-noncommercial ratios, or other indicators causes commodity prices or volatility. Researchers are also investigating if speculative comovement across markets is related to product and asset links [
7,
8]. Speculation in the energy market could lead to price spikes and other problems in the grain market because it takes a lot of fuel to make grain.
Typically, less liquid markets, such as livestock products or cotton, have a larger and more statistically significant impact from short-term speculation on return volatility [
9]. In addition, Bohl et al. [
10] observed a short-term speculation impact on return volatility on rapeseed oil, cotton, sugar, and corn traded on Chinese markets. It can be argued that the inclusion of more speculative indicators and more frequent data can better explain prices. Speculation and its price-distorting effects may be especially common in products heavily impacted by global energy prices and utilized as biofuel. This is particularly true when analyzing markets outside of the United States. For example, according to research conducted by Bandyopadhyay et al. [
11], excessive futures market speculation in Indian commodity exchanges increases spot market volatility. Another thing that the results show is that too many short-term investors in the futures market could have a destabilizing impact on these markets.
However, there is less research on European commodity markets that are smaller in size and less liquid or transparent compared to US markets. European agriculture commodity markets, such as the Paris exchange MATIF (Paris, France) and the London exchange LIFFE (London, UK), trade mainly in rapeseed, corn, and milling wheat. Prices in these markets are heavily influenced by commodity prices in the main US markets, but they also attract speculative activity, which may distort pricing during economic turmoil. In their research on products traded on the Paris exchange MATIF, Statnik and Verstraete [
12] argue that exogenous factors influence the behavior of agricultural product prices, as reference markets, market depth, and market regulation may all have an impact on market behavior, pointing out short-term memory effects in return volatility. Other, older studies, such as one conducted by Busse et al. [
13], argue that the increased European rapeseed price is influenced by speculation, characterized by market over-reactions and high volatilities, and increased correlation with crude oil. On the other hand, more recent studies focus more on structural changes in these markets when trading activity has grown dramatically. Price-shock amplification (period-to-period shock transmission) increased in the Paris and London wheat futures markets after 2006 as trade volume increased [
6]. Authors argue that noncommercial positions have been found to stabilize the market during stressful periods. When investigating the London wheat market, Dawson [
14] points out a structural change in these markets as the increase in volatility since June 2007 appears not to be short-lived. Futures prices significantly determine volatility, and volatility is stable and highly persistent. Other studies on the European grain futures market focus on relationships between commodities and other financial markets. For example, Makkonen et al. [
15] observed that the stock market interacts more with the rapeseed futures market during extreme conditions; moreover, when the economy recovers and the rapeseed market is strong, investors’ positive expectations raise the returns even further. According to Zuppiroli and Revoredo–Giha [
16], the US wheat market outperforms European wheat markets in terms of short-term hedging against price movements, making smaller markets more vulnerable to speculative activity and other distortions. This is particularly significant considering the current pandemic-outbreak-caused economic shock.
In the scholarly literature, the influence of the pandemic on agricultural markets has been extensively studied. It has an impact on economic performance, sustainability, and development processes in general [
17]. More specifically, health crises such as these have a detrimental impact on the global economy, globalization, food and job security, supply chains, or even food fraud [
18]. Stricter government rules and lockdowns, for example, raise concerns about food security as a health and economic well-being problem [
19]. Changes in consumer buying behavior, transportation network disruptions, workforce absenteeism, and the closure of major food production businesses have all posed challenges to the food supply chain. [
18]. Authors Falkendal et al. [
20] point out that production losses have only a modest influence on worldwide pricing and supplies; but trade restrictions and precautionary purchases by a few important players might result in global food price increases and catastrophic local food shortages. Consumer purchase behavior shifted as well and was influenced by income impacts, the opportunity cost of time, and longer planning horizons during the COVID-19 pandemic [
18]. According to Coyne [
21], negative externalities are caused by infectious illnesses. Market pricing will not represent the social cost of individual activity if these externalities exist, and as a result, market imbalances are probable. Most recent studies on commodity markets during the pandemic period highlight increases in cross-correlations between commodities and increases in hedging and speculative pressures [
22,
23].
The current COVID-19 situation has had a significant detrimental impact on the European economy in general. In the first quarter of 2020, almost all EU nations saw a drop in exports compared to the previous year [
24]. Furthermore, since Western Europe’s agricultural sector is primarily reliant on Eastern European seasonal laborers who work for low rates, the epidemic is driving companies to consider whether this is a sustainable model and if they should instead seek local people [
25]. Negative impacts were seen across the board in the agricultural commodities trade, although industries and sectors were affected differently according to their size and kind of product [
18]. For example, some farmers who produce particular items (such as grapes and flowers) destroy their unsold supply due to market access issues [
26]. As a result, one of the long-term consequences of any crisis is predicted to be a reduction in farmers’ income. COVID-19 also has an influence on how farmers behave. As a result of the drop in agricultural revenue, farmers lowered their crop-related costs [
26]. Greater opportunities to hedge against price risks in financial markets may have resulted in better options for dealing with falling prices and income instability.
The COVID-19 pandemic was a shock to present agricultural production and distribution systems, food security, and unemployment rates because of company limitations, and it also resulted in economic instability because of business restrictions [
26]. Demand, production, and overall economic activity must be increased to avoid economic stagnation. Therefore, fiscal and monetary policies implemented stimulus packages and announced emergency assistance that were unprecedented in scope and volume, both at the national and European levels [
25,
27]. A drop in wheat production, together with export restrictions in Russian and Ukrainian wheat markets, is especially important to European agricultural markets. The world’s wheat market is controlled by oligopolistic relationships, with eight nations accounting for 95.6 percent of global exports [
28]. Grain prices, on the other hand, remained stable in 2020 due to relatively low energy costs. Researchers on European commodity markets such as Ahmed and Adjemian [
29] claim that following 2015, wheat market leadership shifted from the United States to Europe, implying that the French (MATIF) futures market is the primary source of price discovery and therefore leads other markets [
29]. Farmers, traders, and other market participants have begun to base their decisions and budgeting on European futures markets rather than US futures markets as a result of changes in the trade map, resulting in the United States losing market leadership in wheat to the former Soviet Union and EU countries [
30]. Additional research also indicates that the global wheat market price discovery leadership has shifted from the United States to the French MATIF futures market [
31].
To summarize, European markets are utilized in research on occasion, but they may be explored further by adding extra factors to better understand speculation and its influence on agricultural commodity prices or returns. To begin with, these studies lack concrete measures of speculation, such as short-term or long-term speculation indices and their influence on commodity returns. Second, unlike in energy or metal markets, the models provided do not account for seasonality, which is typical in agriculture markets. Finally, greater focus should be placed on the post-2020 era (the COVID-19 pandemic period) when comovement among different commodity types has risen and prices in major commodities markets have become more volatile. The COVID-19 pandemic, which is still ongoing, has had an unprecedentedly huge impact on the lives, societies, economies, and markets of the affected countries [
32]. Therefore, the primary goal of this study is to strengthen the other authors’ research into the impact of speculation on agricultural prices and return volatility. Using theoretical and empirical derivatives speculation theories, we study the influence of derivatives speculation on European commodity prices. We also emphasize that in the pandemic period, short-term speculation makes these prices even more volatile.
3. Results
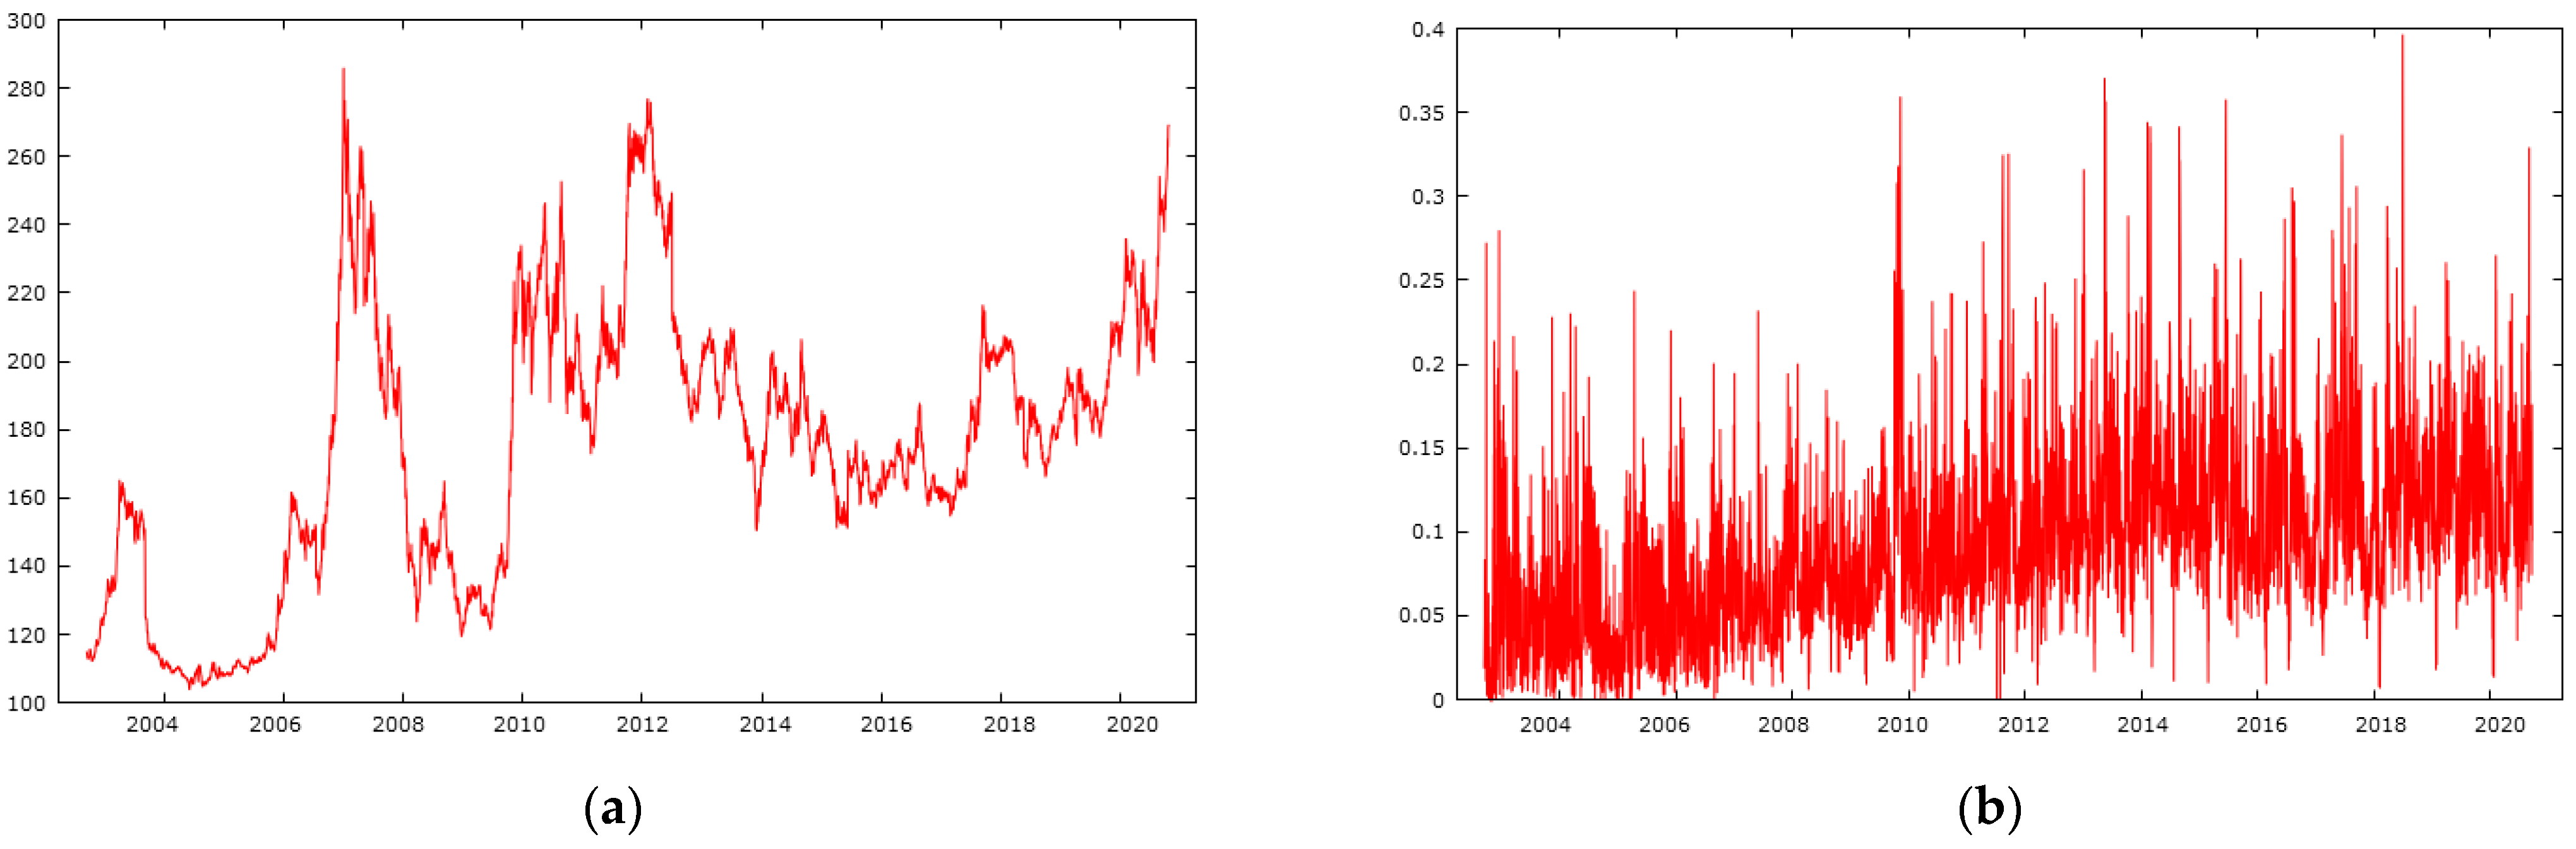
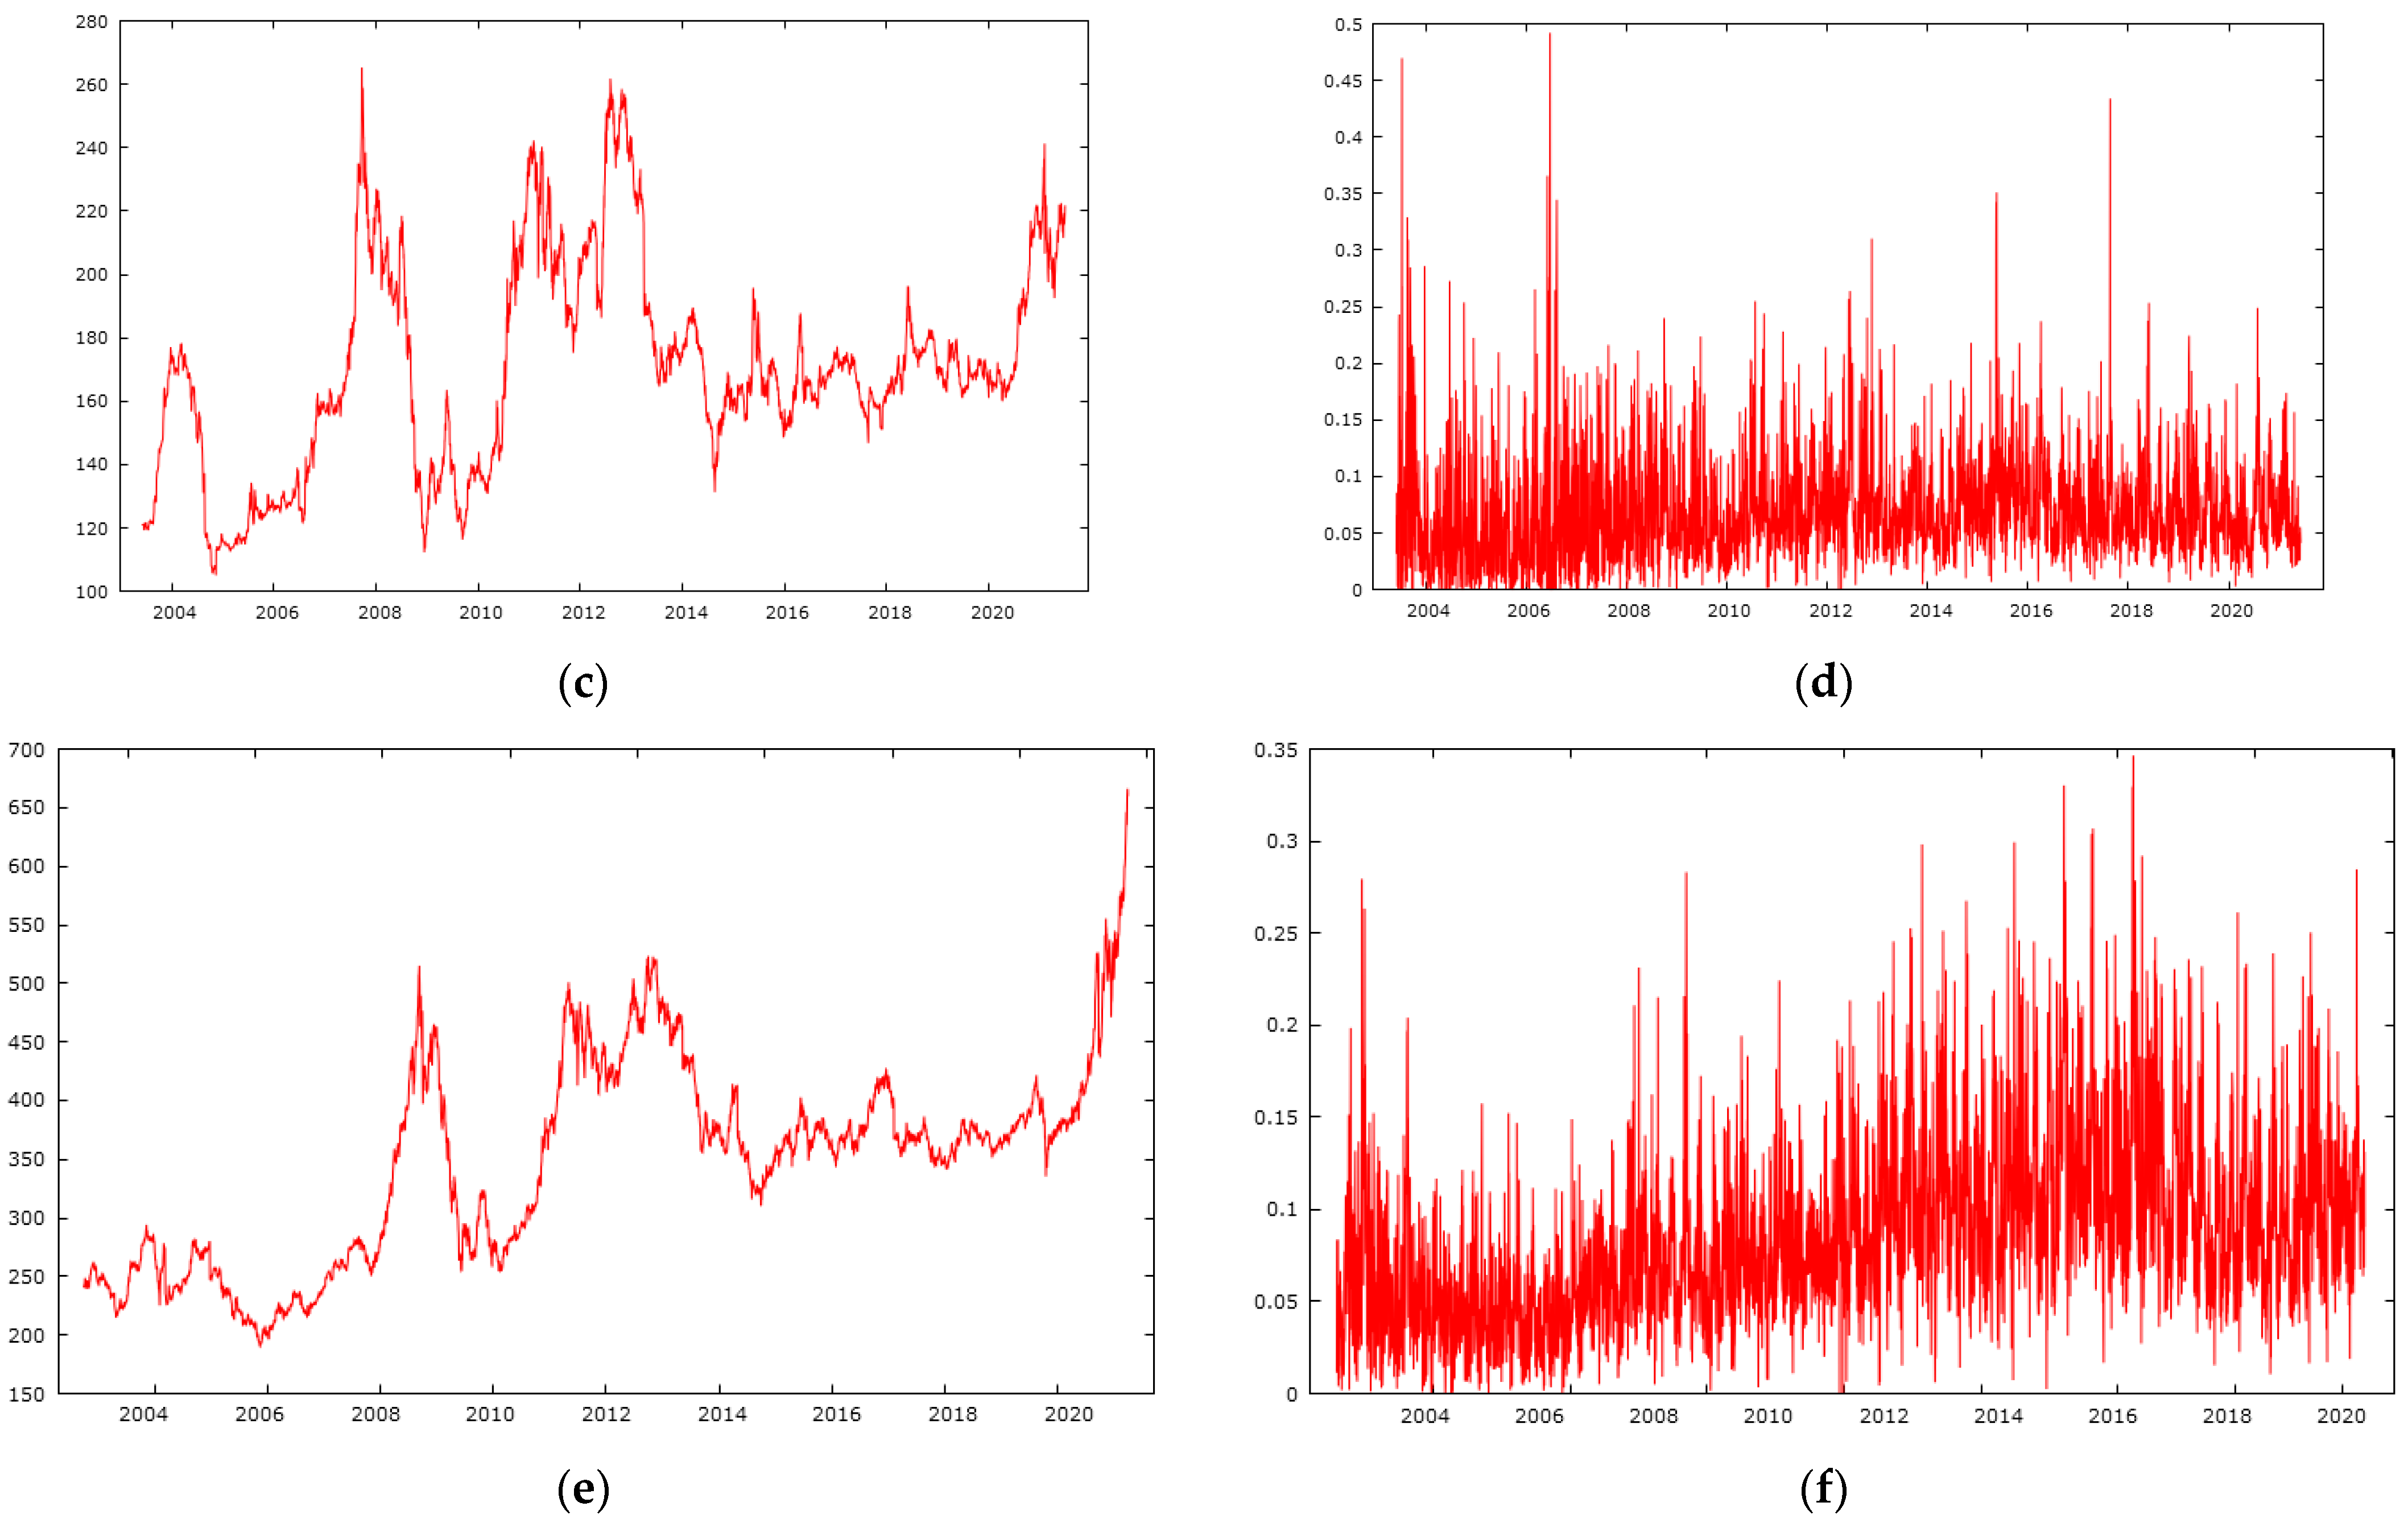
We begin with descriptive statistics for rapeseed, corn, and milling wheat futures traded on the Euronext exchange in Paris (MATIF) (see
Table 1). First, we analyze the full sample data for 2003–2021. The volatility of returns as measured by standard deviation is highest for milling wheat futures (1.299) and lowest for rapeseed futures (1.019). Milling wheat futures have the highest short-term speculative index values (the mean is 0.095), while corn futures have the lowest (0.068).
Next, if we look at the pandemic years of 2020 and after, we can see that the standard deviation of returns is highest for rapeseed (1.317), and it has changed dramatically if compared to full sample results. The standard deviation of returns for corn has remained nearly constant, while it has decreased in milling wheat markets (to 1.206). Short-term speculation index values increased for milling wheat (to 0.128) and rapeseed (to 0.101). However, short-term speculation decreased in the corn market (to 0.066). Mean values of prices are higher in all three commodities during the pandemic years of 2020–2021.
It is also worth noticing that returns do not follow a well-shaped normal distribution. For example, kurtosis is high (>3) for all three commodities using both samples, indicating that many return values are close to the mean or zero. Return skewness is negative for all three commodities in both samples, implying that there are more positive-but-small returns and fewer-but-larger negative returns. To sum up, milling wheat has the highest variation of returns and is the most volatile and risky commodity with the highest short-speculative activity. However, rapeseed futures have changed dramatically in terms of return volatility during the pandemic period, becoming more volatile than milling wheat and having almost the same amount of short-term speculation.
Following that, we present the results of the Augmented Dickey–Fuller (ADF) test using two models: one with only constant and the other with both constant and trend (see
Table 2). The
p-value of price for all three commodities and both ADF models is more than 0.05, indicating that these time series have a unit-root and are nonstationary. However, returns from futures (specified in Formula (1)), which are the first logarithmical difference in price values, have a
p-value for all three commodities smaller than 0.05 using both time samples. With a
p-value of less than 0.05, the short-term speculation index is also stationary for all three commodities in both time samples. To sum up, all of the time series except for prices are stationary; thus, returns can be properly used for further Granger noncausality investigation. Another thing to keep in mind when using a time–trend model is that the returns are more stationary and the
p-values are lower, suggesting that the returns have a time trend throughout this period.
We then present the results of the Granger noncausality test (
Table 3). In most cases, the
p-value of the underlying AR model is greater than 0.05 for all three commodities. Corn and rapeseed futures are the only two exceptions.
Using a one-day lag, we can reject the hypothesis that returns do not cause speculation in rapeseed futures (p-value is 0.0405). This shows that returns better explain speculation than vice versa. Using a two-day lag, we can reject the hypothesis that speculation does not cause the return in the instance of corn futures (p-value is 0.0418), but we cannot reject the opposite hypothesis (p-value is 0.6065). If we look at the total lag one-directional effect, it is only significant in the corn market (p-value is 0.0053), where returns are better explained by speculation than vice-versa. This shows some evidence of speculation having an impact on returns in corn markets. It is also worth noting that in this scenario, the coefficient values are positive, indicating that speculation increases returns. In the case of the milling wheat market, none of the p-values are above 0.05. This demonstrates that time series are only loosely related to one another. However, the second hypothesis, that speculation does not cause returns, has higher p-values. Other observations are that the p-value is smaller when using a one-day lag, except for corn futures, so more time lags can be added for further investigation.
When using pandemic period p-values for all commodities and time lags, they are all above 0.05. This shows that there is no statistically significant direction from speculation to returns or vice versa. However, p-values during the pandemic period are higher for speculation than returns, showing that returns explain speculation better than vice versa. Even though returns better explain speculation, in the case of corn futures, the opposite is true.
Following that, we investigate the GARCH month-selection model using time dummy variables for months (
Table 4). We look at when these markets are the most volatile. We also take note of cases when
p-values are above 0.05 but below 0.10. We are concerned about the
p-values for models and their coefficients.
Milling wheat and corn both have a statistically significant effect in January, with a p-value between 0.05 and 0.10 (parameter estimations are 0.0312 and 0.0398). However, this effect is relatively small compared to other months. Milling wheat also has a statistically significant impact in June (estimated value is 0.0257) and in August (estimated value is −0.0051, with a p-value below 0.05). However, during April, this effect is estimated to be 0.2950 even though its p-value is higher than 0.10.
On the other hand, corn has a statistically significant and stronger (compared to milling wheat) month’s impact in May (estimated value is 0.1609), July (estimated value is 0.0857), and October (estimated value is 0.1747, with a p-value below 0.05). However, the strongest effect in this market is during April, estimated to be 0.1919, with a p-value above 0.10.
In the rapeseed market, only August (coefficient estimated to be −0.0137) and October (coefficient estimated to be −0.0125) are statistically significant, with p-values below 0.10. However, these values are negative, showing that returns from these futures contracts are less volatile during these months. Rapeseed markets are found to be most volatile in March (coefficient estimated to be 0.0649), but this effect is smaller than it is in milling wheat and corn markets during April and with a p-value above 0.10.
It is evident that all three agricultural commodities have increased return volatility during sowing and before harvest, mostly in the spring months: March–April for milling wheat, April–July for corn, and February–March for rapeseed futures. For further analysis, we select April for milling wheat and corn, and March for rapeseed futures. Even though the p-values are above 0.10 for these months, we will revisit the p-values in our revisited Framework II.
Then, we examine the outcomes of the basic GARCH and threshold TGARCH models to see if speculation has an impact on return conditional volatility as described in our methodology (
Table 5). The TGARCH model shares the same characteristics as the GARCH model, except that it also includes an asymmetry factor (a dummy variable
). In this table, we only show GARCH and TGARCH models that are based on Framework I, with only short-term speculation as an exogenous element.
When analyzing full sample data, mean equation parameter values for all three commodities are statistically insignificant or close to zero, which can reflect the fact that these time series are stationary and previous returns do not explain the further ones. Next, we can look further into the variance equation where we put the speculation index as an exogenous factor. Residual volatility is statistically significant (p-value is below 0.05), so we can reject the hypothesis that this parameter is equal to zero. This is present in all cases except for rapeseed when using the TGARCH model (estimated value of lagged residual volatility to current volatility is 0.1149). This shows that volatility closely reflects its lagged values, as evidenced by residuals. The volatility effect is statistically significant for all three commodities, indicating that their return volatility is clustered. In other words, the market activity timeline can be grouped into high and low volatility periods. For all three commodities, the asymmetry coefficient is nonsignificant, indicating that there is no asymmetry for positive or negative return to increase volatility. Constants are close to zero or statistically insignificant in both mean and variance equations. When using the GARCH model in the milling wheat market and both the GARCH and TGARCH models in the corn market, the speculation effect on volatility is statistically significant and increases volatility. This effect is higher in the corn market than in milling wheat; it is especially high when using the basic GARCH model (estimated value is 2.2663). In the milling wheat market, this effect is only significant under a p-value greater than 0.05 and lower than 0.10. When modeling rapeseed returns, the information criteria are discovered to be the lowest. When modeling the milling wheat market, the information criteria are found to be the highest. The information criteria are smaller for TGARCH estimates.
When using the post-2020 data, we see that only TGARCH model estimates show statistically significant mean equation estimations (p-values are below 0.05) in the mean equation for both milling wheat and rapeseed futures. The residual is statistically significant only when using the TGARCH model and for all three commodities. Volatility is statistically significant for all three commodities using both models. The asymmetry factor, unlike in full sample data, is statistically significant in the milling wheat futures market but is negative (−0.3229), indicating that positive returns are followed by increased volatility. The speculation index is only statistically significant in the corn market using both models (estimations are 3.4420 and 1.8786). As we see, this effect is stronger than compared to full sample results. The information criteria for the corn market are the smallest, while those for milling wheat are the largest. Information criteria for GARCH and TGARCH models are similar, but are smaller in TGARCH models. To sum up, speculation increases volatility in the corn market using both models, and this effect has become stronger during the post-2020 era.
Following that, we provide further estimates with extra exogenous variables put into the mean equation, which may better explain movements of agricultural commodity returns (see
Table A1). We employ log differences of the S&P 500, GSCI Energy, Euro Stoxx 50, and 3-month Eurodollar indexes to depict the economic environment, namely, economic growth and energy prices. This leads to some important observations. The GSCI energy index exhibits a statistically significant influence with
p-values of less than 0.05 for all three products when considering the whole sample and for rapeseed futures when analyzing post-2020 data as well. Coefficient values are positive, indicating that rising energy prices enhance agricultural futures returns and vice versa. This demonstrates that energy costs have a significant impact on agricultural commodity returns. In more cases than the S&P 500 index, the Euro Stoxx 50 is statistically significant and has positive coefficients. In all circumstances, the Euro Stoxx 50 index is statistically significant in the rapeseed market. This demonstrates that the Eurozone stock market has a greater influence on agricultural prices than the S&P 500, which is composed of companies based in the United States. This suggests that rising European stock market returns are correlated with rising agricultural commodity prices traded on the MATIF. The 3-month Eurodollar index is statistically significant and has negative coefficients except for the corn market when analyzing full sample data. The higher the implied 3-month U.S. dollar LIBOR interest rate, the lower this index value. Therefore, when interest rates grow, returns from agricultural commodity futures grow as well, and vice versa. Other estimates are comparable to those in models where there are no extra variables in the mean equation. Even though all models indicate statistically significant volatility effects, a statistically significant asymmetry component is detected in the corn market (the coefficient is 0.1591 when analyzing the full sample and −0.659 when analyzing post-2020 data). However, in the corn market, short-run speculation is merely statistically significant. When both techniques and time samples are used, the information criterion for all three commodities is slightly smaller.
Then, we examine the outcomes of the GARCH and TGARCH models to see if speculation has an impact on price conditional volatility when the month is also taken into consideration (
Table 6). These models have an additional two exogenous variables: a dummy variable
representing the most volatile month, and speculation multiplied by this dummy variable
. As the month-selection model shows, milling wheat and corn futures returns are the most volatile in April, and rapeseed futures returns are the most volatile in March.
As in our previous models based on Framework I, mean equation parameters are close to zero, yet here they are more statistically significant. The residual and volatility effects from the variance equation are statistically significant in all cases, including rapeseed. This again shows that return volatility is clustered in these markets and that current volatility closely follows its previous values. Then again, constants are close to zero or statistically insignificant in both mean and variance equations. The asymmetry factor is only significant in the corn market (estimated to be 0.2031), showing that negative returns are followed by increased volatility. Negative news affects corn futures volatility when using this improved model. Next, we analyze the impact of exogenous factors on return volatility. Neither speculation nor month had a statistically significant effect on milling wheat returns, even though milling wheat, when analyzing descriptive statistics, was found to be the most volatile and had the highest speculation-index mean value. Speculation increases return volatility throughout the year in the corn market using both the GARCH model (parameter estimation is 0.9835) and the TGARCH model (parameter estimation is 0.6988). Month and combined effect are statistically significant only in TGARCH estimates, and season speculation amplifies return volatility (parameter estimation is 4.1949) while month alone reduces volatility (parameter estimation is −0.1679). In the rapeseed market, speculation reduces volatility throughout the years, but this effect is only statistically significant in the TGARCH model (which is estimated to be negative −0.0899). Month reduces volatility (effects are estimated to be −0.1364 and −0.0575) and the combined effect increases volatility (effects are estimated to be 2.8548 and 1.1661) in both models.
Information criteria are estimated to be the smallest when modelling corn returns with the GARCH approach and rapeseed returns with the TGARCH approach, and largest when modelling the milling wheat market. GARCH estimates have a lower information value only in the corn market. The information criteria are smaller than in the previous model for all three commodities. We focus on these results because the GARCH model for corn has a lower information criterion. In the rapeseed market, there is evidence that during more volatile time periods, speculation increases volatility. Seasonal volatility is amplified in the corn market as well as the rapeseed market.
Following that, we present estimates for Framework II models that integrate economic variables such as the S&P 500, GSCI Energy, Euro Stoxx 50, and 3-month Eurodollar indices into the mean equation (see
Table A2). The GSCI energy index was statistically significant for all three items except wheat when using the GARCH model, with a
p-value of less than 0.10. Positive coefficient values indicate that increasing energy prices improve agriculture futures returns and vice versa. When using the GARCH approach and having positive coefficients, the Euro Stoxx 50 is statistically significant in all cases except the wheat market. When employing the TGARCH technique, the S&P 500 index is only statistically significant in the corn market but has a negative coefficient. Only in the maize and rapeseed markets, particularly when using the TGARCH model, is the 3-month Eurodollar index statistically significant. The coefficient value in the corn market is positive, but it is negative in the rapeseed market. Other estimates are comparable to those in models where there are no extra variables in the mean equation. However, when employing the TGARCH technique in the wheat market, there is a statistically significant influence from short-run speculation multiplied by month on returns (−0.4103). Short-run speculation, in this sense, lessens volatility during the more volatile month of April. Asymmetry may also be seen in the wheat market. However, it has a negative coefficient (−0.1192). Most of the time, when both methodologies and time samples are used, the information criteria values are slightly smaller.
We conclude in the following section that GARCH approaches can be effectively used to analyze realized futures returns in European commodity markets. Time series are stationary and, in most cases, residual and volatility effects are present under a p-value of 0.05. This shows that returns are clustered, and volatility follows its lagged values. Therefore, European agricultural futures trading activity can be split into periods of high and low volatility. The asymmetry factor has no or mixed results, as it is only statistically significant when using a month-based model for the corn market or a basic model for milling wheat during the pandemic period. This shows that negative information is not necessarily destabilizing these markets. Corn markets, on the other hand, showed good evidence that speculation was having a significant and growing effect on return volatility.
5. Conclusions
This research investigates the above-mentioned connection for the Paris Exchange MATIF, which is motivated by disagreement among empirical results in the literature concerning the stabilizing or destabilizing influence of speculative activity in futures markets. We used realized, daily returns on rapeseed, milling wheat, and corn futures traded on the European commodity exchange MATIF. We investigated data from 2003 to 2021. This time encompasses various events connected to financialization and commodities market globalization, as well as more than a year of the pandemic period. We observed that these commodities have increased in their return volatility, or speculative activity, over this time. The speculation index, which is calculated by dividing trade volume by open interest, is a proxy for speculative behavior in our research. We, like many other authors, use this speculation measure based on the assumption that speculators engage in short-term trading activity attempting to gain profits from price changes. In our research, we analyze the volatility of three agricultural commodities using extended autoregressive conditional heteroskedasticity GARCH models as well as Granger noncausality testing. Seasonal effects, and whether speculation makes returns more volatile during volatile months, were added to the GARCH model. Dummy variables were also added to the model.
Our study provides three important findings. First, we uncover evidence that short-term speculation drives corn market returns; moreover, speculation causes these markets to be more volatile. Corn markets, on the other hand, are neither more volatile nor have higher levels of short-term speculation than milling wheat or rapeseed. Second, the influence of short-term speculation on return volatility in the corn market has risen over the pandemic era, indicating that speculation may have skewed this market during the COVID-19-induced economic shock. Finally, there are insights that this influence is exacerbated in the corn market during the more volatile month of April since this month is known to be the most volatile, and more new information enters these markets considering that season’s crop. However, according to our study, there is not enough data to back up the destabilizing hypothesis for all agricultural commodities.
Our study’s results have important policy implications. Because of financial speculation, futures commodity exchange regulators have proposed limiting trading activities. Our results, like those of other authors, indicate that financial speculation has a limited influence on price levels and volatility in agricultural markets and that, in certain cases, speculators help to bring new information and correct prices. Another thing to take into consideration is that restrictions on commodity trading can make these markets less liquid and prevent them from effectively hedging against price risks. However, we demonstrate that if short-term speculation is destabilizing these markets, this effect is only observable in corn markets. Therefore, it should be investigated whether energy costs impact not just corn prices, but also encourage speculation, and whether the connectivity of the corn and oil markets makes them more vulnerable to adverse speculative repercussions. Future studies should focus more on long-term speculation and its effects on the return volatility on European agricultural commodity markets once more information about noncommercial traders’ positions becomes available.


