Article

Developmental and Physiological Responses of Pisum sativum L. after Short- and Long-Time Cadmium Exposure

1
Department of Plant Physiology, Genetics and Biotechnology, University of Warmia and Mazury in Olsztyn, Oczapowskiego 1A, 10-719 Olsztyn, Poland
2
Experimental Education Unit, University of Warmia and Mazury in Olsztyn, Plac Łódzki 1, 10-721 Olsztyn, Poland
3
Department of Soil Science and Microbiology, University of Warmia and Mazury in Olsztyn, Plac Łódzki 3, 10-727 Olsztyn, Poland
4
Department of Animal Anatomy and Physiology, University of Warmia and Mazury in Olsztyn, Plac Łódzki 3, 10-727 Olsztyn, Poland
*
Author to whom correspondence should be addressed.
Agriculture 2022, 12(5), 637; https://doi.org/10.3390/agriculture12050637
Submission received: 30 March 2022 / Revised: 23 April 2022 / Accepted: 26 April 2022 / Published: 28 April 2022

Abstract

:
Cadmium (Cd) as a toxic element has a significant effect on plants. The presented study was focused on the analysis of the differences between the short- (one day) and long-time (7 and 28 days) effects of Cd (10, 50, 100 and 200 μM CdSO4) on P. sativum L. The analysis showed that Cd treatment generally reduced the accumulation of Ca, K and Mn in pea plants. The elevation of the photosynthesis rate was observed after one day of Cd treatment. However, the opposite effect after 7 and 28 days of Cd treatment was noticed, and it was similar for all Cd concentrations used during the experiment. The influence of the Cd application on the development was observed after 28 days of treatment. The delay of the flowering time and stress-induced flowering (increase of the total number of flowers that did not develop the matured pods) evoked by Cd, except for plants treated with the lowest Cd concentration, was noticed. Interestingly, the highest Cd concentration increased root length but changed its structure and increased the ratio of the number of internodes to the shoot length. These results indicate that Cd actions substantially differ after 1, 7 and 28 days of treatment. Moreover, the raise or inhibition of physiological responses and development highly depends on Cd concentration.

1. Introduction

Cadmium (Cd) is one of the toxic elements existing in the environment as a result of natural processes and human activity [1,2]. Its complex effect on plant development is investigated especially because it can affect plant development and thus crop production. Plants do not require Cd for growth and reproduction. However, the bioaccumulation index of Cd in plants is high and may exceed that of many essential elements [2]. The pea (Pisum sativum L.) is a widely cultivated plant, especially for the edible seeds. Therefore, the effect of Cd toxicity on the seed production is important for plant science but also for agriculture practice and human health. It has been shown that Cd exposure can lead to Cd retention in fruits, hence posing a serious risk of food-chain transfer [3]. It is known that correct flowering time is crucial for successful reproduction [4]. The effect of Cd on germination and vegetative growth was excessively investigated [5,6,7,8,9], unlike the flowering [10]. There are only a few studies describing this issue [11,12,13,14,15]. In the presented study, we analyzed both the short- and long-time effect of Cd on the vegetative growth and also on the flowering time and seed production. Cd is accumulated in plants during Cd exposure, but the absorption rate changes with exposure time [2]. That is why we presumed that the Cd effect on plant development, gas exchange and mineral accumulation might be different after a short- and long-time treatment. The studies describing the Cd influence on plants often state the delay or inhibition of growth [6,8,11,16,17,18]. However, there are only few examples where both the short- and long-time effects of Cd were studied [6,11,18]. The negative effect of Cd on plant growth was frequently correlated with the reduction of gas exchange (i.e., photosynthesis rate, transpiration rate), chlorophyll content and fluorescence [18,19,20]. Moreover, the Cd-treatment affects the absorption of water by plants, which is essential for various metabolic activities—for example, as mentioned earlier, photosynthesis. The aim of the present study was to analyze the short- (one day) and long-time (7 and 28 days) influence of Cd on pea plants. The effects of Cd on different morphological and physiological variables were also studied. The present results should add substantially to our understanding of the mechanism of Cd-stress effects on pea plants.

2. Materials and Methods

2.1. Plant Material and Experimental Design

The seeds of P. sativum L. ‘Pegaz’ (Torseed, Poland) were surface sterilized with 75% ethanol for 5 min, followed by 1% sodium hypochlorite for 10 min, washed in water and sown in a wet perlite. Plants were grown in a greenhouse with a day/night temperature of 24 (± 2) °C, watered, when needed (not during the Cd application), with distilled water and once a week with the water solution of half-strength Murashige & Skoog [21] basal salt mixture (not during the Cd application). The 4-week-old plants were supplemented with 10, 50, 100 and 200 µM CdSO4 for one week (three times a week—30 mL, 30 mL and 40 mL, with a total 100 mL of solution per pot—ϕ15 cm, each pod with 5 plants). At the same time, control plants received equal quantities of distilled water [22]. All plants were harvested for further analysis after 1, 7 and 28 days since the first application of cadmium. The experiment was carried out in three replicates.

2.2. Analysis of the Development of P. sativum L

The root and the shoot length as well as a sum of leaves and internodes of the P. sativum L. after 1, 7 and 28 days after Cd-treatment were analyzed. The time of flowering, number of flowers and pods per plant were counted during the experiment. The summarized number of flowers or pods after the first, second or third week after Cd-treatment was analyzed. The pods were classified as the senescent pods (small, wilted pods—Figure 1A—the left image), the matured pods (with visible large seeds—Figure 1A—the middle image and Figure 1B) and pods (pods without visible large seeds and without wilting symptoms—Figure 1A—the right image). Moreover, the size of pods (Figure 1A) and seeds in the pods (Figure 1B) were measured for each treatment of the experiment after 28 days of Cd-treatment (Figure 1). Pods and seeds were imaged with Leica M205 C microscopy.

2.3. Water Content (WC) on a Dry Weight Basis Measurement

The roots and shoots of all treatments of the experiment were weighed (FW—fresh weight) and then oven-dried at 90 °C for 24 h (SLW58EC, POL-EKO-APARATURA sp.j.). After drying, the samples were re-weighed (DW—dry weight) and the water content (WC) of the tissues was determined. WC on a dry weight basis was measured as a ratio between the water and the dry mass in tissues [23]. WC was calculated from Formula (1):
WC(g/g DW) = (FW − DW)/DW
WC—water content; FW—fresh weight; DW—dry weight

2.4. Measurement of Gas Exchange

The measurements of gas exchange were conducted on seedlings after 1, 7 and 28 days after cadmium treatment. These experiments were conducted using the LI-6400 steady state photosynthesis system (Li-Cor, Inc, Lincoln, NE, USA) equipped with the 6 cm2 cuvette. The measurements were taken at saturating irradiance (1000 μmol m−2 s−1 PAR) provided by a red/blue LED light source (model LI-6400-02B; Li-Cor). The CO2 concentrations in the cuvette were regulated using a CO2 mixer and injector system (Model LI-6400-01; Li-Cor) and cartridges of compressed CO2. Inlet air CO2 concentrations were set to 400 μmol mol−1 for measurements in the ambient plots [24]. The data obtained as a part of the gas exchange measurements included area-based light-saturated net photosynthetic CO2 assimilation. A total of 10 measurements per plant of each treatment of the experiment were analyzed.

2.5. Measurement of Chlorophyll Fluorescence Ratio

The mean fluorescence intensity of chlorophyll was measured with laser scanning confocal microscopy Leica TCS SP5 (Leica Microsystems, Wetzlar, Germany) and the LAS application (Leica Application Suite 2.0.2 build 2038). The ratio between the values of Fr and Ffr (Fr/Ffr ratio) was calculated according to the modified method of Pfündel & Neuboh [25] and Gouveia-Neto et al. [26]. The dark acclimated fresh leaves faced an adaxial surface up on the slide. The fluorescence was excited by a 488 nm line of the argon laser and collected in 10 nm bands at 5 nm intervals from 650 to 790 nm [27]. Chlorophyll fluorescence was separated into two wavebands below 700 nm and above 700 nm (Fr and Ffr fluorescence, respectively). The Fr/Ffr ratio was analyzed for every treatment of the experiment. Additionally, we calculated and analyzed the F690/F735 ratio as a possible stress indicator [28]. The three fluorescence ratios were determined per one leaf (always the middle leaf of the plant) and averaged. We always analyzed at least three leaves per each treatment of the experiment.

2.6. Analysis of the Stomatal Opening

The open stomata frequency (OSFq) was analyzed using scanning electron microscopy (SEM). The samples of at least three leaves (always the middle leaf of the plant) were fixed in a 2.5% glutaraldehyde solution overnight at 4 °C. The fixed material was rinsed two times for 20 minutes in PBS (pH = 7.4). The samples were dehydrated in a graded series of ethanol concentrations of 30%, 50%, 70%, 80% and 96% for ten minutes in each solution and twice for 30 minutes in 99.8% ethanol. After dehydration, the samples were dried at the critical point of CO2 (CPD 030, BALTEC, Schalksmühle, Germany), placed on copper tables and sputter-coated with gold in an argon atmosphere in an ionic coater (Fine Coater, JCF-1200, JEOL, Tokyo, Japan). The sputter-coated material was placed in an SEM column (JSM-5310LV, JEOL, Japan) and analyzed at 5 or 10 kV. The sum of open (OS) and closed stomata (CS) was estimated from an average of at least 15 images per adaxial and also abaxial surface of a leaf (the total number of analyzed images was 530). The frequency of open stomata (OSFq) was calculated from Formula (2):
OSFq = OS/(OS + CS)
OSFq—open stomata frequency; OS—open stomata; CS—closed stomata.

2.7. Determination of Macronutrients and Micronutrients Concentration

The perlite or whole plants were collected after 1, 7 and 28 days of Cd-treatment for the determination of macronutrients and micronutrients content. Samples were ground in an agate mortar, and 0.5 g of perlite or plant were mineralized in 5 mL of 65% HNO3 using a microwave mineralizer (UltraWAVE Milestone). Digests were diluted with demineralized water to 100 mL. Element concentration was measured by an optical emission spectrometer with inductively coupled plasma (iCAP 7000 Series ICP-OES, Thermo Scientific, Newington, CT, USA).

2.8. Statistical Analysis

The analysis of variance (ANOVA) was performed in order to determine differences between groups followed by a Duncan’s test with the level of significance set at p < 0.05 (lower case letters in the figures) or p < 0.01 (upper case letters in the figures). Pearson’s correlation coefficients (R) were estimated between quantitative parameters and Cd concentration used during the experiment. The statistical analysis was carried out using STATISTICA (ver. 13.1 Dell Inc. Tulsa, OK, USA).

3. Results

3.1. Macroelements and Microelements Content Analysis

A total of 16 (9 microelements and 7 macroelements) elements in the plant and perlite samples were analyzed (Tables S1 and S2). The results showed that Co, Cr, Ni and Pb were detected neither in the plant tissues nor in the perlite. Moreover, Cd, Cu and Zn were detected only in the plant samples, while Cd was noticed only after 28 days of Cd-treatment (Figure 2A; Table S2B) but never in the perlite (Table S1B). Ba, Mn and all of the macroelements were detected in the plant and perlite samples after 1, 7 and 28 days of Cd-treatment. The abundance of macroelements in the perlite was observed as follows: Na > K > Fe > Al > Ca > Mg > P (Table S1A), whereas the abundance of macroelements in the plant was observed as follows: K > P > Na > Ca > Mg > Fe > Al (Table S2A). There were correlations between the Cd-treatment and the content of some elements in the plants but not in the perlite. Cd was noticed only in the 50, 100 and 200 µM CdSO4 (R = 0.48, p < 0.05) treated plants (Figure 2A) after 28 days of Cd-treatment. Moreover, a negative correlation with the Ca, Mn and K in plant samples (R = −0.31; R = −0.46 and R = −0.55; respectively, p < 0.05) and Cd-treatment during the experiment was observed (Figure 2B–D).

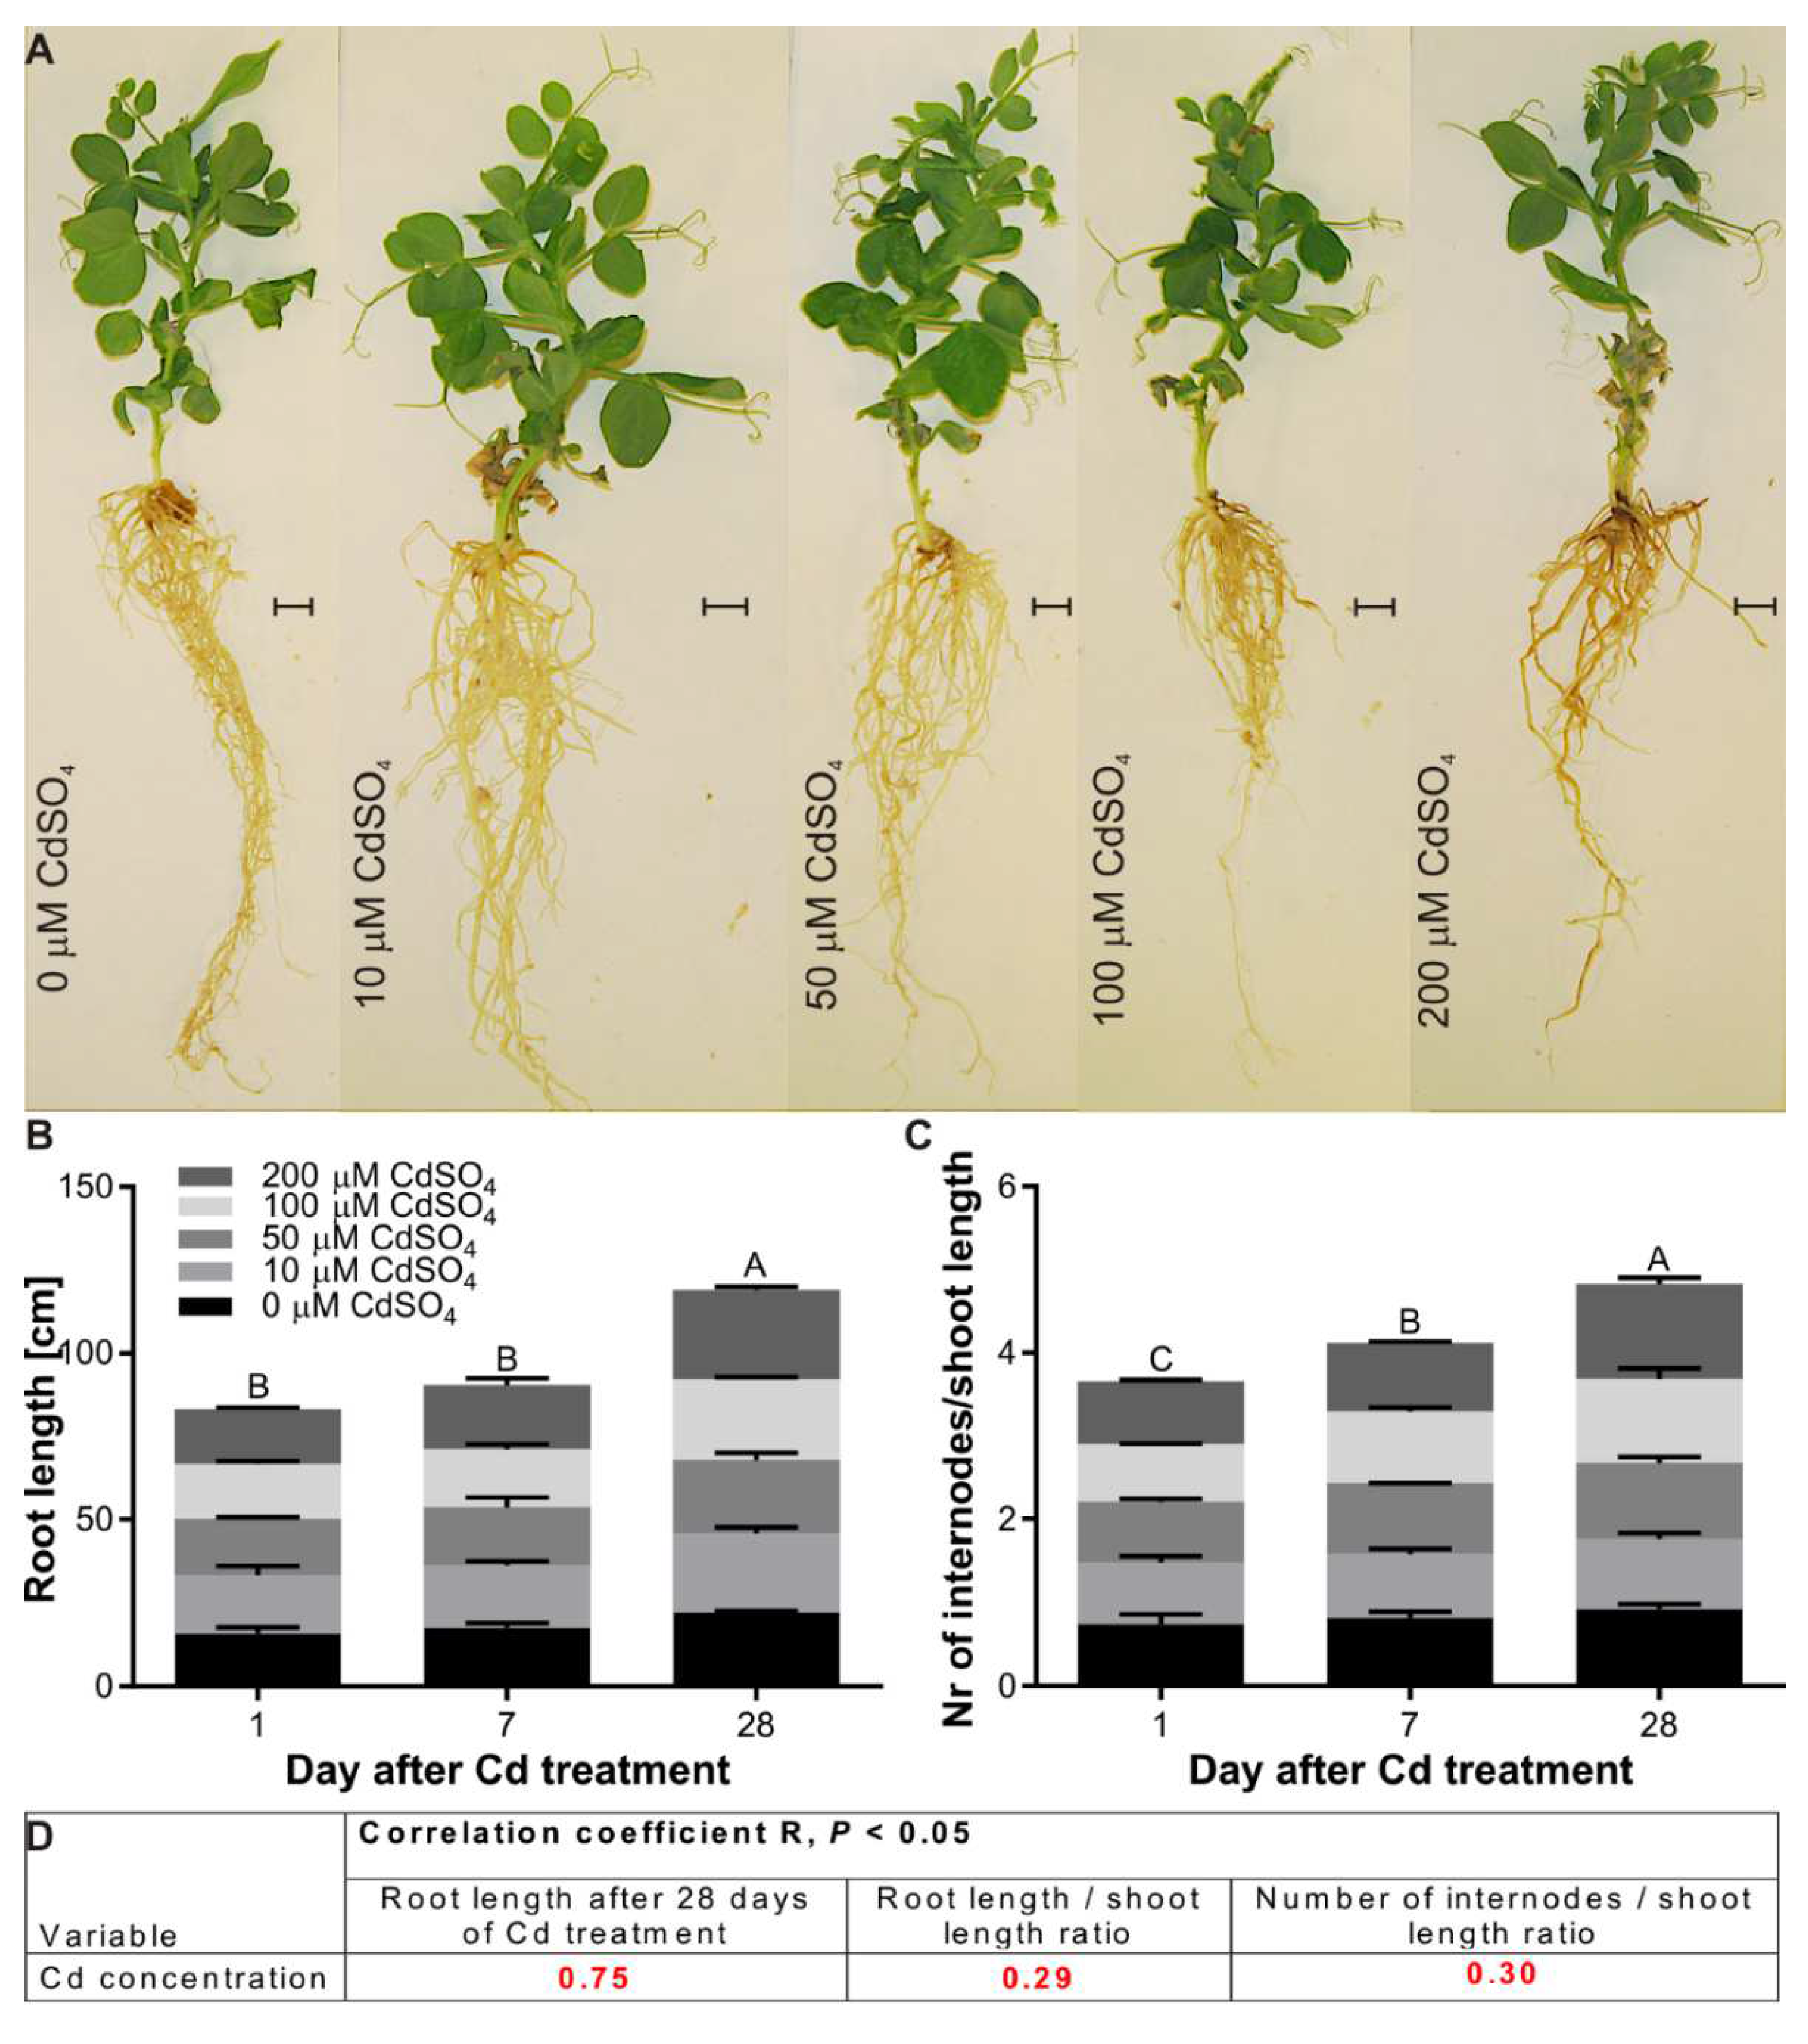
3.2. Effect of Cd on the Growth of P. sativum L

The analysis of the growth of the control and Cd-treated plants (Figure 3; Table S3) showed that while the length of root and the number of internodes were positively correlated with the duration of the experiment, they were not correlated with Cd-treatment. However, we observed statistically significant differences between the root length and Cd-treatment after long-time (28 days) Cd-treatment (Figure 3B; Table S3). It was a positive correlation with R = 0.75 (p < 0.05) (Figure 3D), although the Cd-treated roots, especially those treated with 100 and 200 µM CdSO4, developed a relatively compact and dense root system with a characteristic brown color (Figure 3A). Moreover, detailed analysis of the pea growth showed that the ratio of the root to shoot length and the ratio of the number of internodes to the shoot length were positively correlated (R = 0.29 and R = 0.30, respectively, p < 0.05) with Cd-treatment (Figure 3C,D; Table S3).

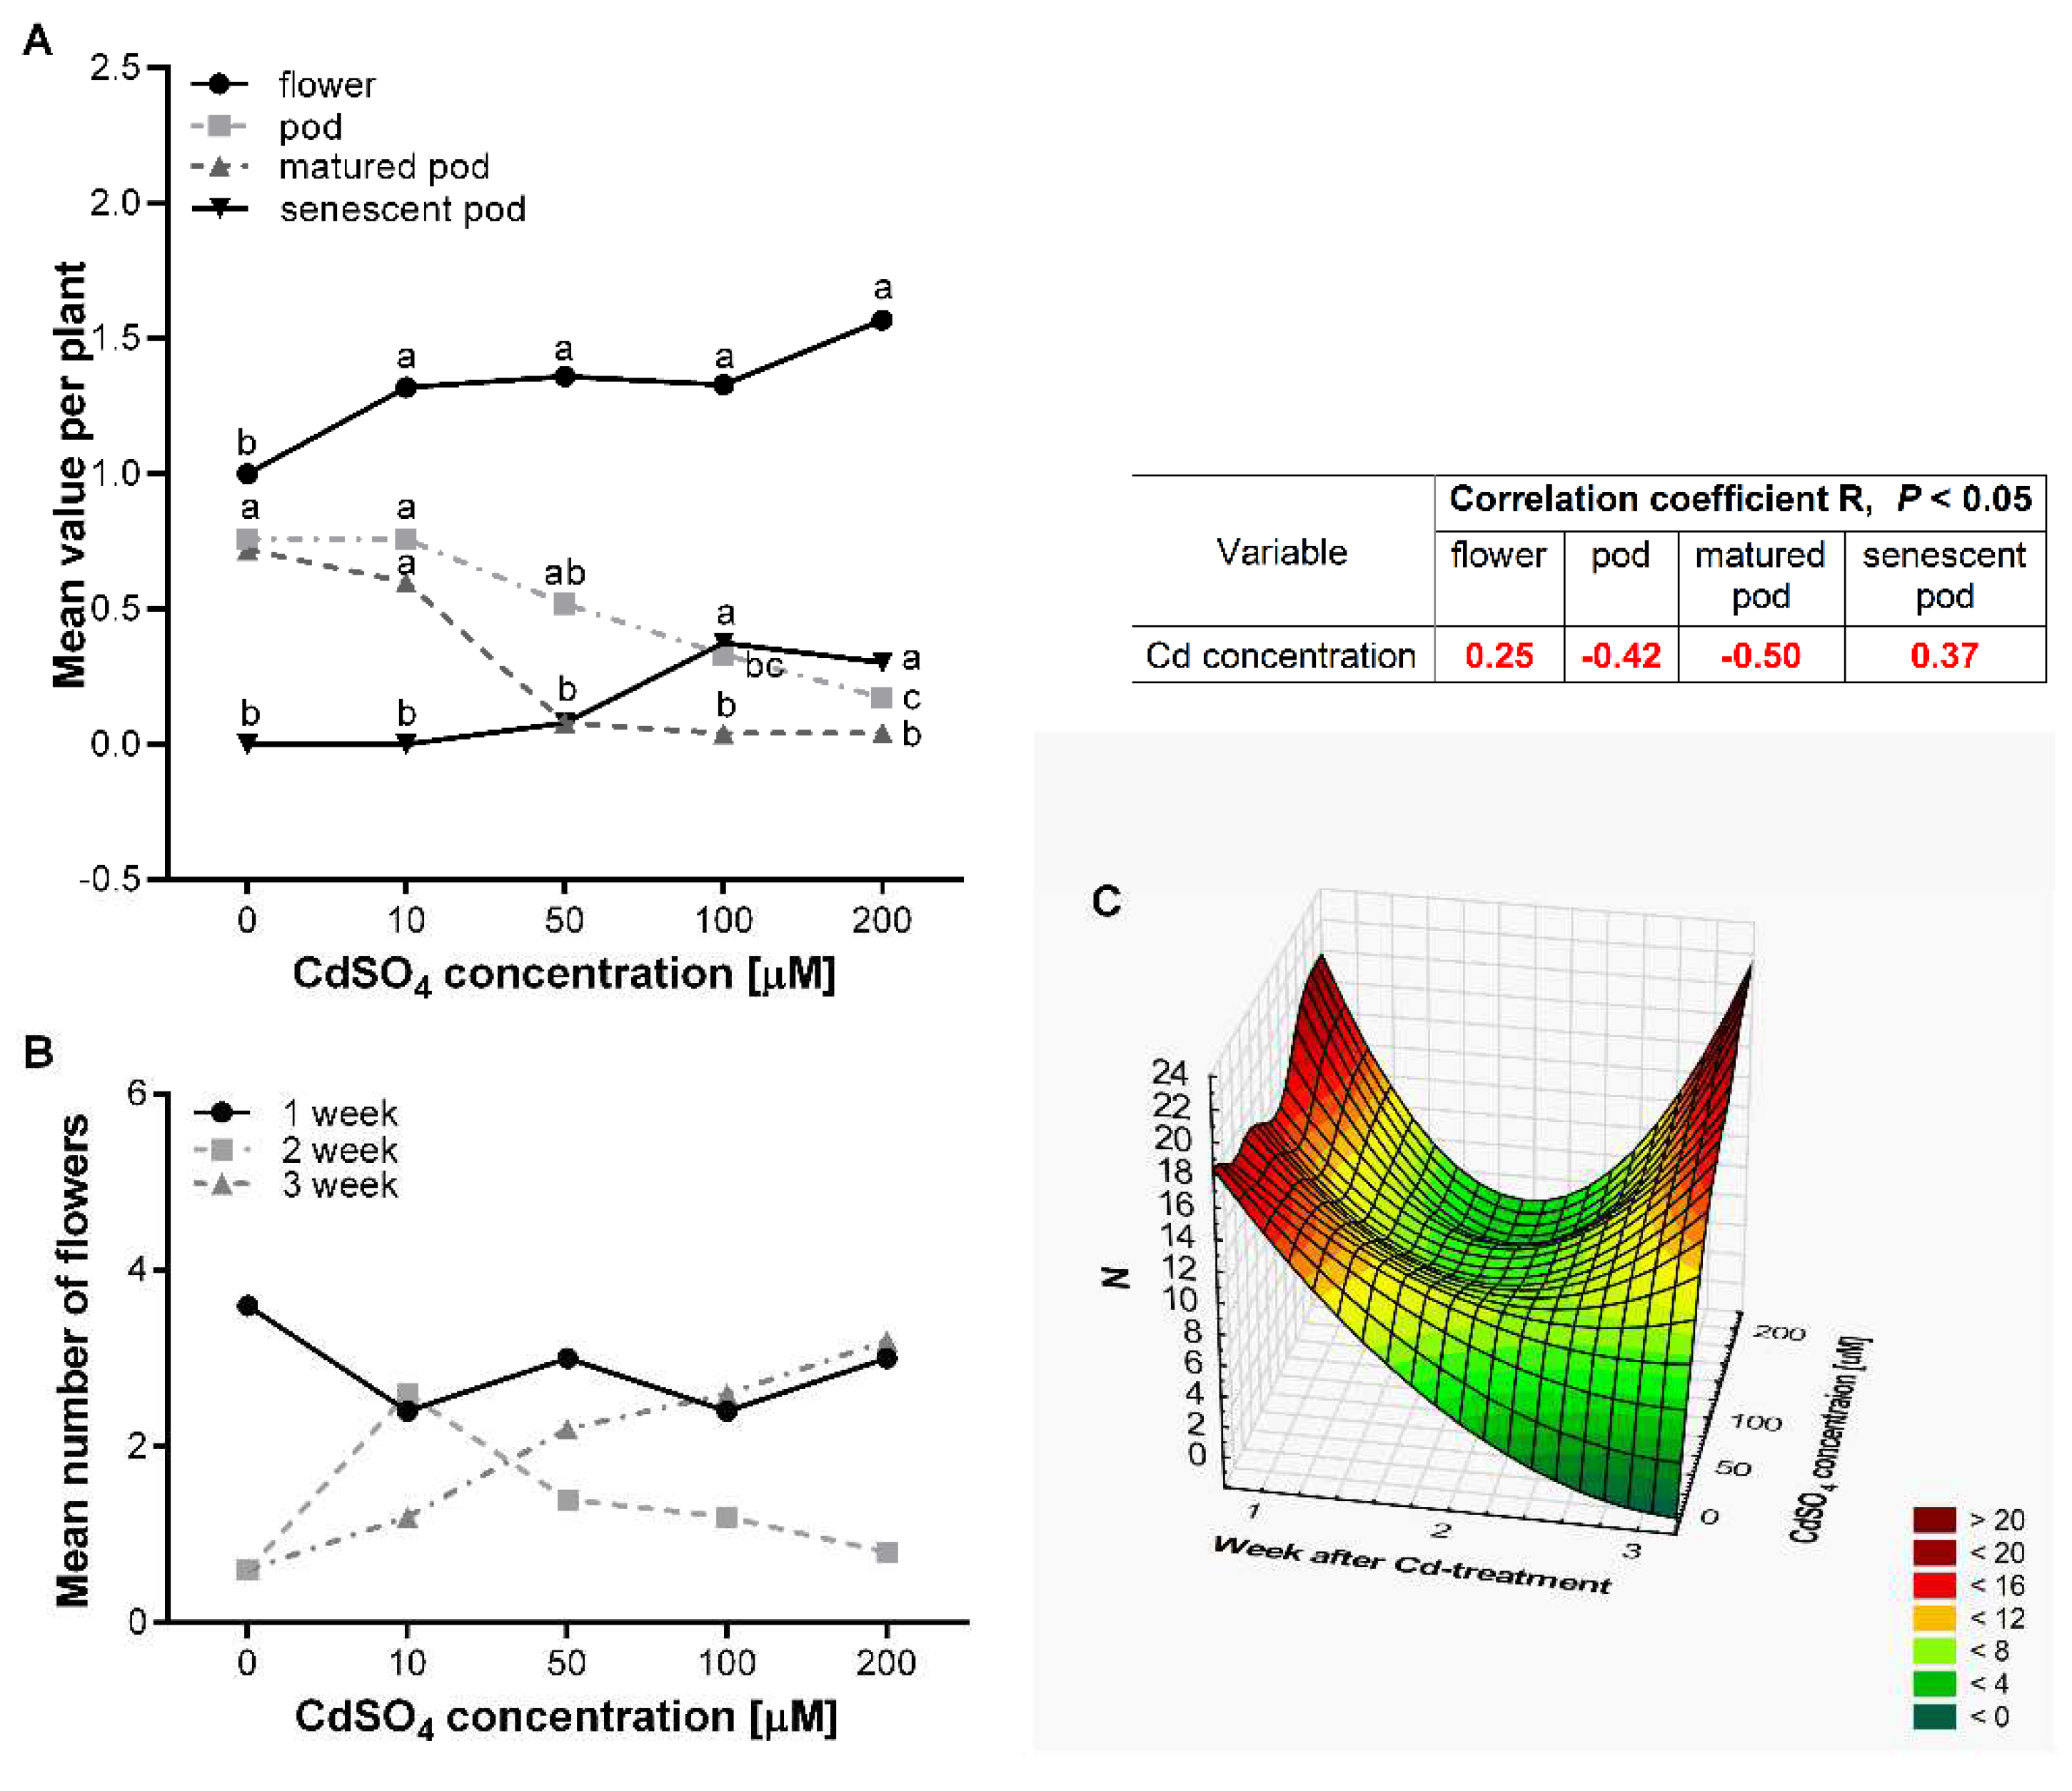
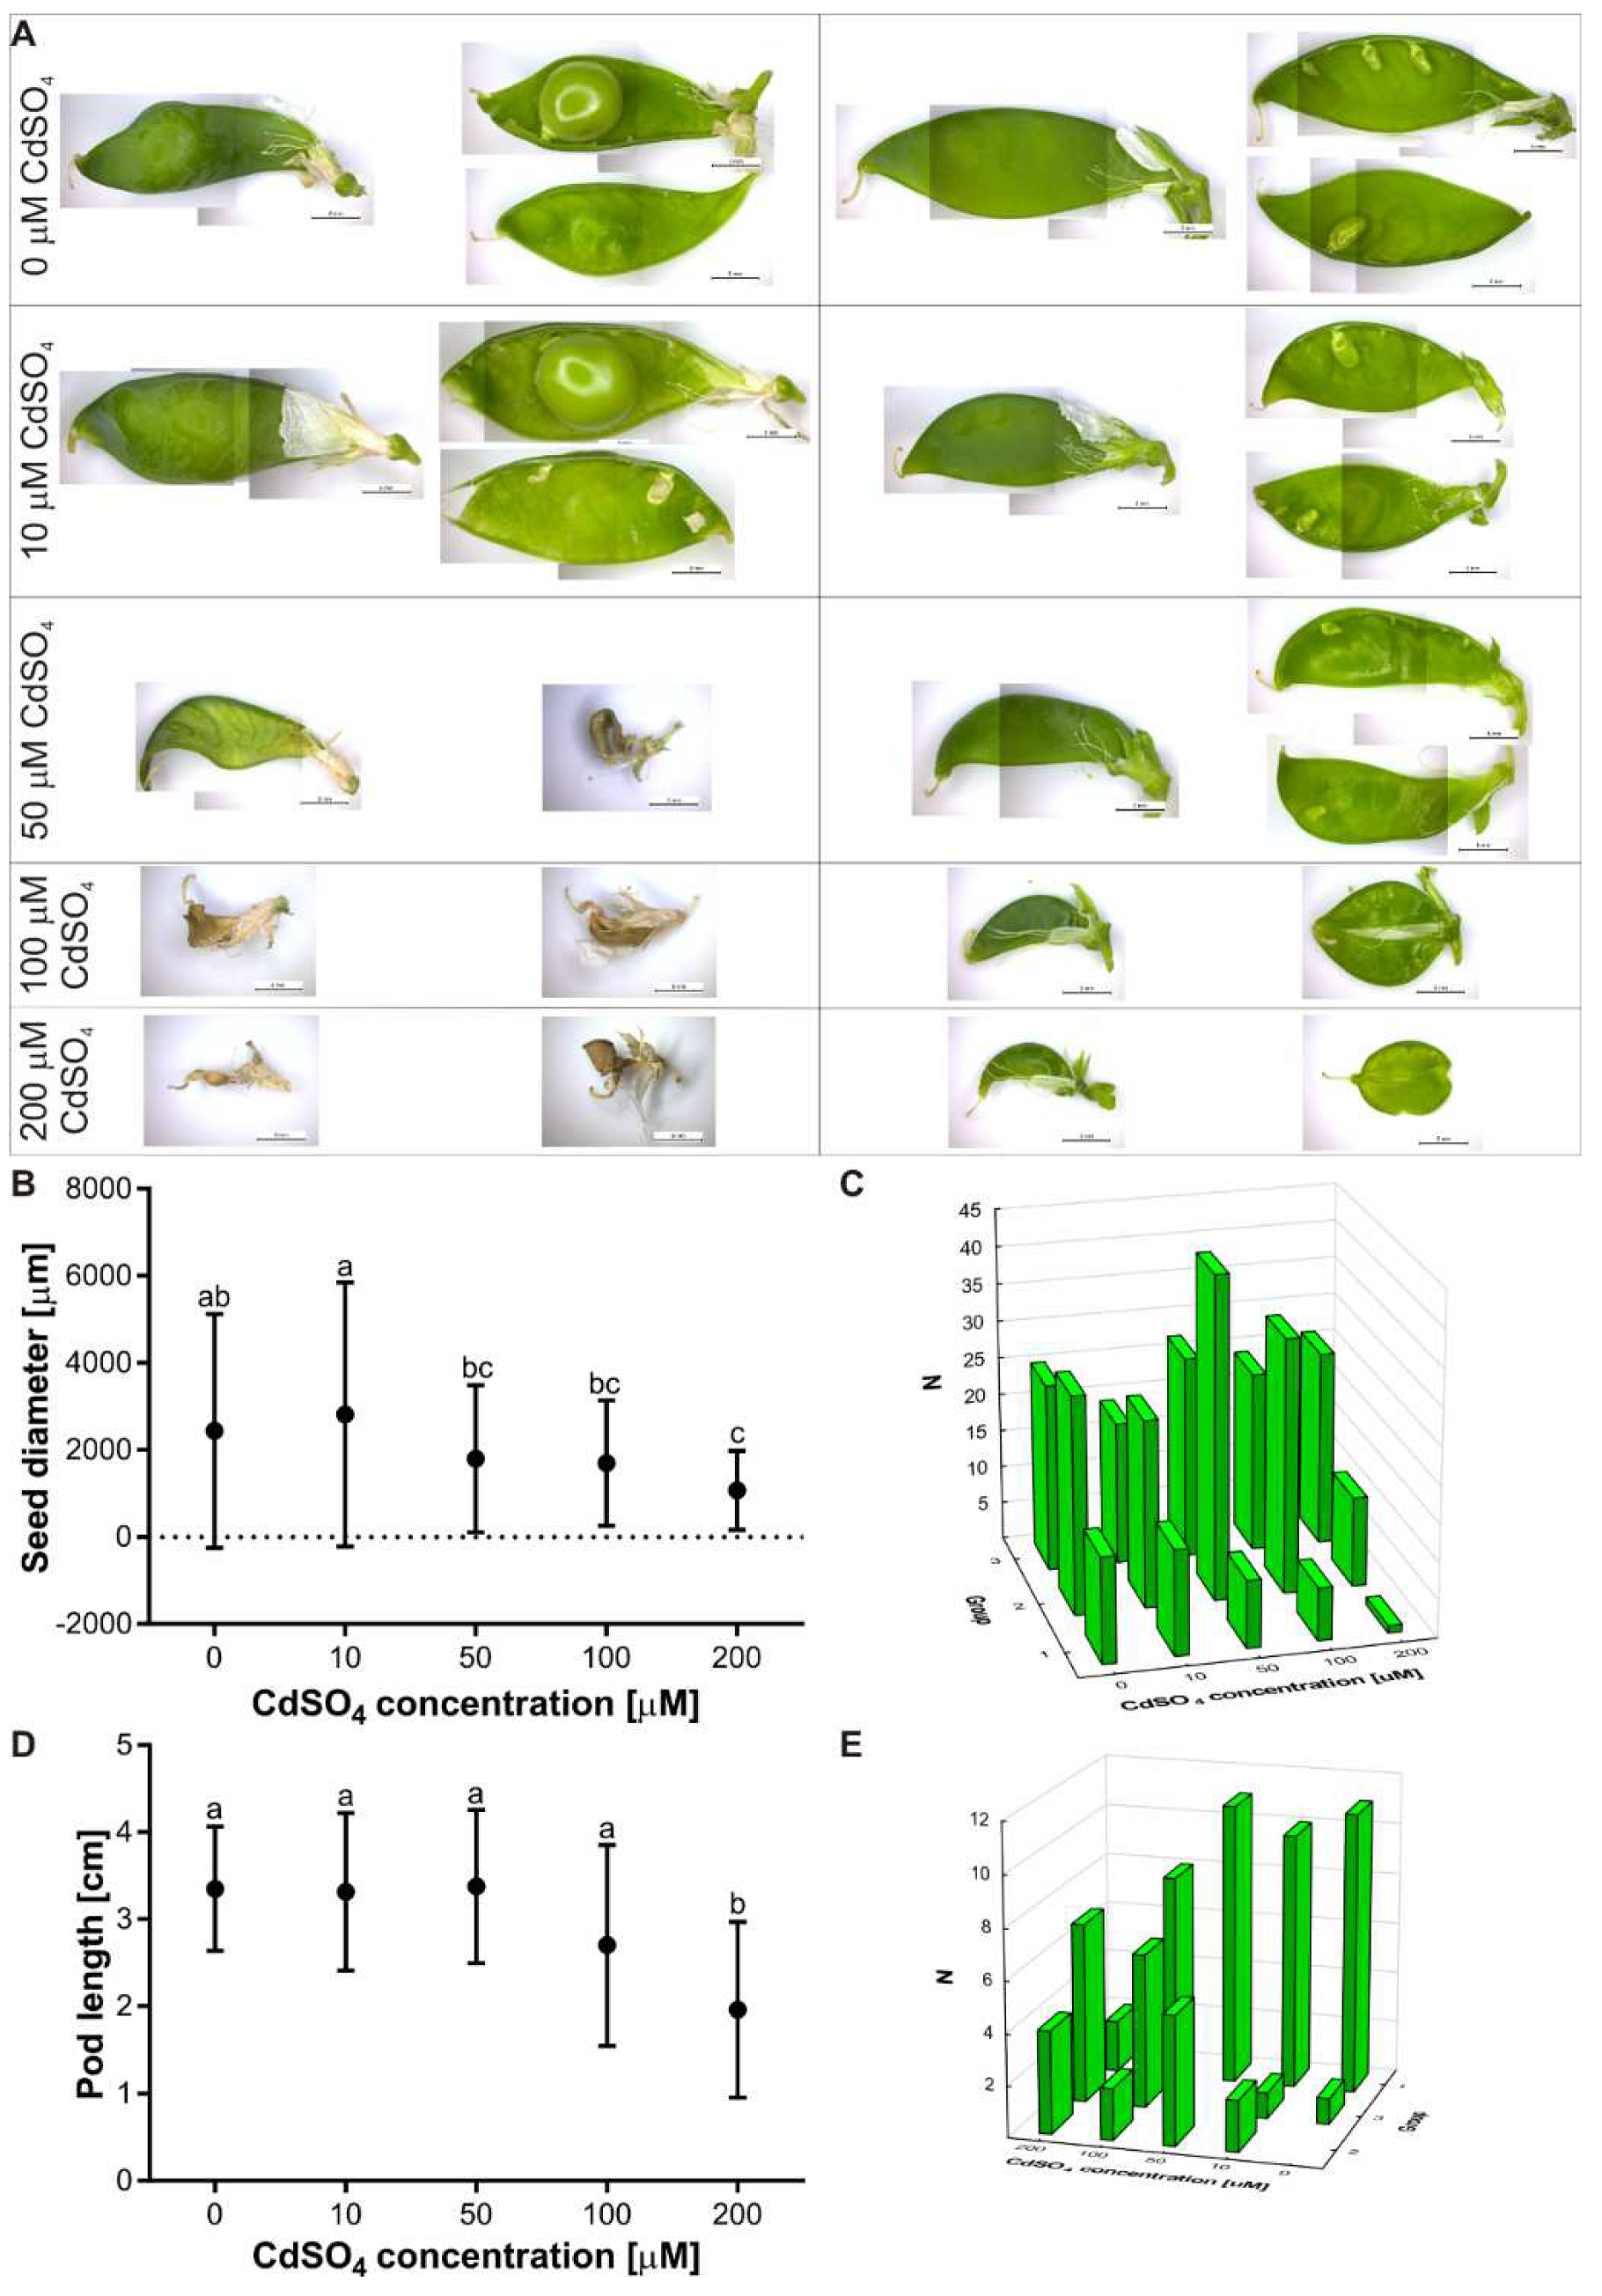
3.3. Effect of Cd on the Flowering and Seed Production of P. sativum L

The analysis of the flower, pod, matured pod and senescent pod production (Figure 4A) during the experiment showed statistically significant correlations with Cd-treatment (p < 0.05). The flower and senescent pod numbers were positively correlated with Cd-treatment (R = 0.25 and R = 0.37, respectively, p < 0.05), whereas the pod and matured pod numbers were negatively correlated with Cd treatment (R = −0.42 and R = −0.50, respectively, p < 0.05) (Figure 4A). Furthermore, the detailed analysis of the flowering time showed more differences between the control and the Cd-treated plants (Figure 4B,C). The non-treated plants produced flowers during the first week (Figure 4B,C; Table S4). Interestingly, the plants treated with the highest Cd concentration (100 and 200 µM CdSO4) produced a number of flowers comparable to the non-treated plants during the first and the third weeks after Cd-treatment. Nonetheless, they produced the lowest number of flowers during the second week after Cd-treatment. In contrast to this, the plants treated with the lowest Cd concentration (10 µM CdSO4) produced the highest number of flowers both during the first and the second week and the lowest during the third week after Cd-treatment. The plants treated with 50 µM CdSO4 produced the highest number of flowers after the first week and the lowest after the third week of the Cd-treatment (Figure 4B,C; Table S4).
The Cd-treatment affected the development of the pods and seeds (Figure 5). We noticed that the seed and pod lengths were negatively correlated with Cd-treatment (R = −0.23 and R = −0.49, respectively). Moreover, the mean seed sizes of the control and the 10 µM CdSO4 plants were bigger than those produced by the plants treated with 50, 100 and 200 µM CdSO4 (Figure 5A,B). We divided the seeds into three groups regarding their length to analyze the distribution of seeds in each treatment of the experiment. The first group seeds were longer than 3.00 mm, the second group seeds were 2.99–1.00 mm long and, finally, the third group seeds were shorter than 0.99 mm. The distribution of seed groups produced by the control and the 10 µM Cd treated plants was similar (Figure 5C). It was 4.5% of the first group seeds, from 9.4% to 8.1% of the second group seeds and the third group was 8.1% and 6.1% of all seeds formed in the pods of the control and the 10 µM Cd-treated plants, respectively. Different distribution of the group seeds was observed in the treatment of the 50 and 100 µM Cd-treated plants (Figure 5C). In this case, the most abundant group was also the second class (13.9% and 11.0% of all seeds), but it was almost 5 times larger than the first group and 1.5 times larger than the third group of seeds. Unlike in the control and the plants treated with 10, 50 and 100 µM Cd, the analysis of the distribution of seeds formed by 200 µM Cd-treated plants showed that the most abundant group of seeds was the third group (8.4% of all seeds), while the second group was less abundant (3.9% of all seeds). Consequently, the first group of seeds (0.3% of all seeds) of the 200 µM Cd-treated plants was the least abundant group of all seeds (Figure 5C).
Regarding pods size, we established that the mean length of the control plants and the plants treated with 10, 50 and 100 µM CdSO4 was statistically higher than that produced by the plants treated with 200 µM CdSO4 (Figure 5D). Furthermore, similarly to the seeds analysis, we divided the pods into three groups regarding their length to investigate the distribution of pods in each treatment of the experiment (Figure 6E). The first group of pods were longer than 3.0 cm, the second group pods were 2.9–2.0 cm long and, finally, the third group of pods were shorter than 1.9 µm. The distribution of pod groups produced by the control, 10 and 50 µM CdSO4 treated plants showed that they were mostly the first group pods, and it was 15.7%, 14.2% and 15.7% of all pods, respectively (Figure 5E). However, it should be noted that plants treated with 100 µM CdSO4 also produced the first group pods (11.4% of all pods) and the third group pods (8.6% of all pods). We observed a totally opposite distribution of pods in the group of plants treated with 200 µM CdSO4. These plants produced mostly the third group pods (10.0% of all pods), almost twice less the second group pods (5.7% of all pods) and 2.9% (of all pods) of the first group pods (Figure 5E).

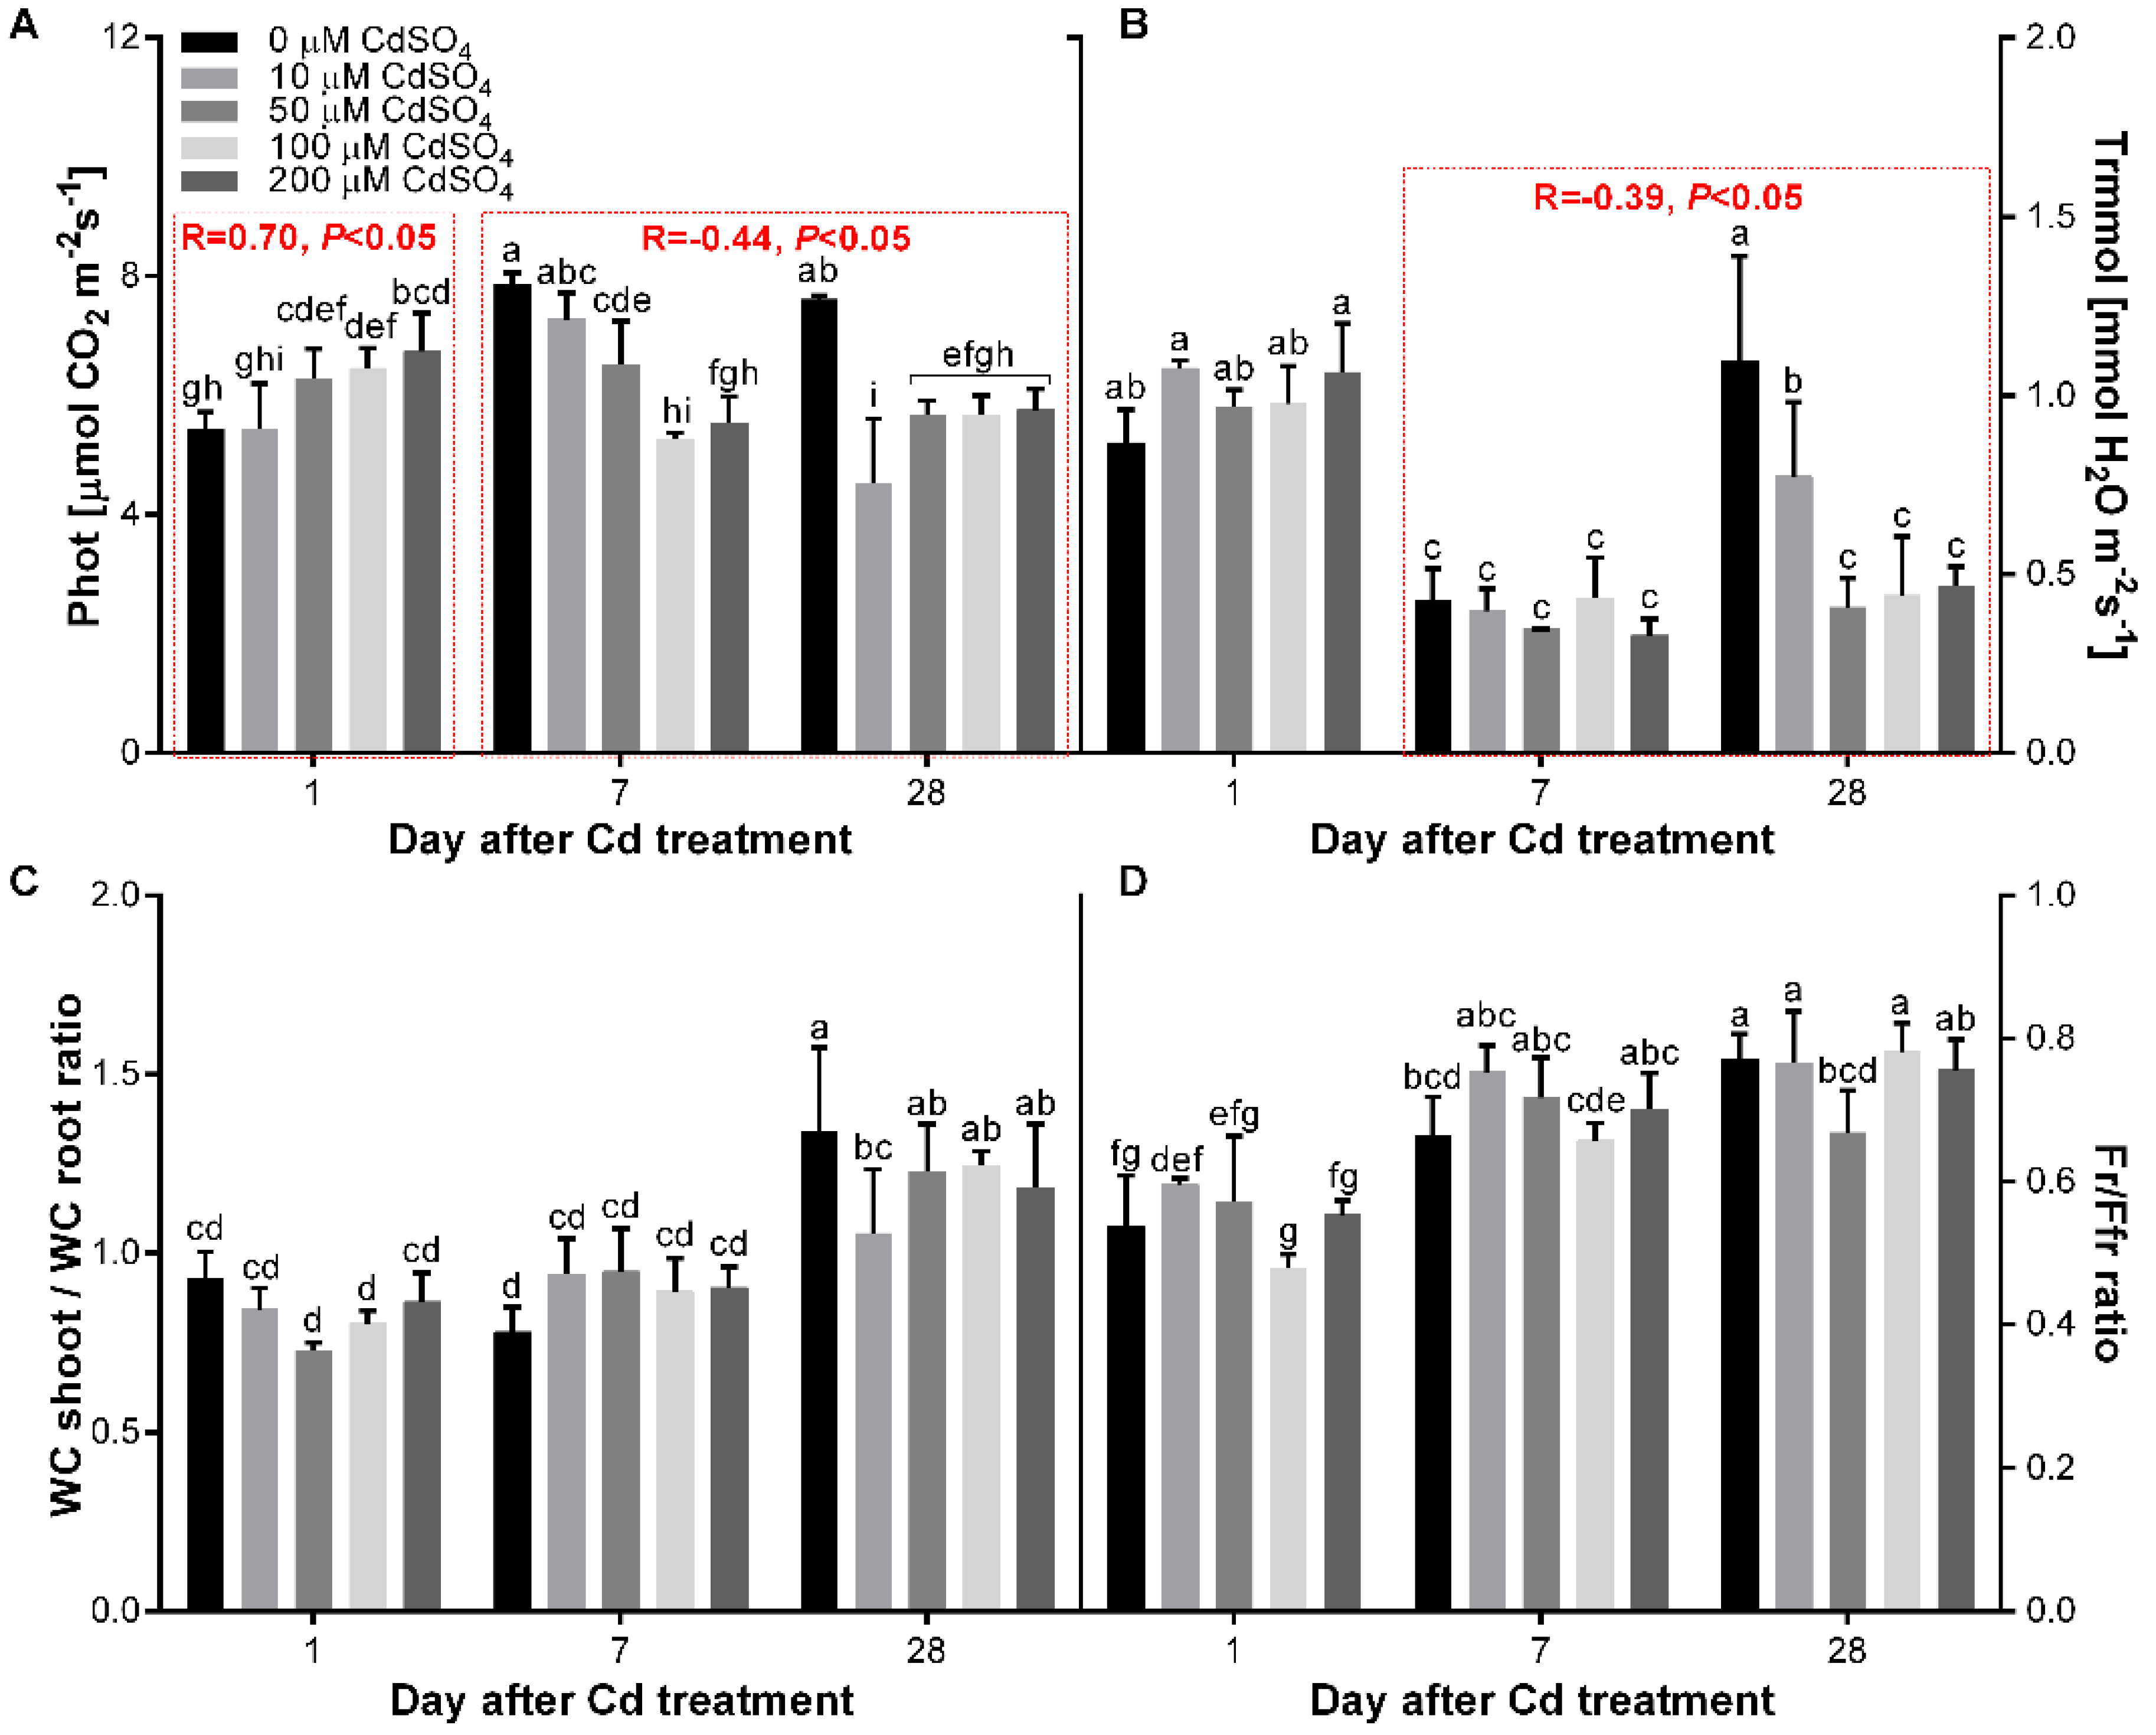
3.4. Effect of Cd on the Gas Exchange and Water Content of P. sativum L

The analysis of the photosynthesis rate (Phot) showed differences between 1, 7 and 28 days of Cd-treatments (Figure 6A), which resulted in statistically significant correlations (p < 0.05). We established that after a short-time of Cd-treatment (1 day), the photosynthesis rate increased (R = 0.70, p < 0.05) (Figure 6A). However, after 7 and 28 days (long-time Cd-treatment), we observed a decrease in the photosynthesis rate (R = −0.44, p < 0.05) (Figure 6A). In contrast to this, the transpiration rate (Trmmol) was more stable during the experiment (Figure 6B). However, also in the case of the transpiration rate, we observed a negative correlation with Cd-treatment, but only after 7 and 28 days (R = −0.39, p < 0.05) (Figure 6B). The analysis of WC of the shoot and the root showed that the WC decreased almost two times after 28 days of Cd-treatment (Table S5). Interestingly, the ratio between WC of the shoot and WC of the root did not show differences between Cd-treated and non-treated plants after 1 and 7 days of Cd-treatment (Figure 6C). Moreover, the fluctuations observed after 28 days of Cd-treatment were not significant, except for the plants treated with 10 µM Cd. However, we noticed that the photosynthesis rate (Figure 6A) and the WC of the shoot/WC of the root ratio (Figure 6C) were positively correlated (R = 0.93, p < 0.05), but only after 28 days of Cd-treatment (Table 1A). The results we obtained for the Fr/Ffr and F690/F735 ratio were also positively correlated (R = 0.99, p < 0.05) (Table 1A). The analysis of the Fr/Ffr and F690/F735 ratio did not show significant differences between Cd-treated and non-treated plants during the experiment (Figure 6D, Table S5). Nevertheless, the Fr/Ffr and F690/F735 ratio was lower after 1 day of Cd-treatment than after 7 and 28 days of Cd-treatment. Furthermore, the Fr/Ffr ratio was correlated with transpiration rate (R = −0.54, p < 0.05) but not with the photosynthesis rate (Table 1B). There was also a correlation between the Fr/Ffr ratio and the WC of the shoot/WC of the root ratio (R = 0.68, p < 0.05) (Table 1B). The F690/F735 ratio was positively correlated only with the WC of the shoot/WC of the root ratio (R = 0.72, p < 0.05) (Table 1B).
The response of stomatal opening/closure was analyzed as a calculated OSFq for the adaxial and abaxial surface of the leaf (Figure 7). The highest OSFq was observed after 1 day, whereas the lowest was observed after 28 days of Cd-treatment both on the adaxial (Figure 7A) and the abaxial (Figure 7B) surface of leaves. Similar results were also observed in control plants. However, there were differences in the OSFq after short (1 day) and long-time (7 and 28 days) Cd-treatment (Figure 7A,B). In this case, the lowest OSFq was observed on the leaves treated with 100 and 200 µM Cd, both on the adaxial and abaxial surfaces after 1 day of C-treatment (Figure 7A,B). The highest number of open stomata (Figure 7C–arrow) was counted on the surfaces of the leaves treated with 50 (adaxial) and 10 µM Cd (abaxial) after 1 day of Cd application (Figure 7A,B). The OSFq was almost on the same low level in all treatments of the experiment both after 7 and 28 days (long-time) of Cd-treatment (Figure 7A,B). The OSFq for the adaxial and abaxial surfaces of the leaf were positively correlated (R = 0.91, p < 0.05) during the experiment (Table 1B). Moreover, positive correlations between the OSFq of the adaxial surface of the leaf and the transpiration rate (R = 0.55, p < 0.05) and also between the F690/F735 and Fr/Ffr ratios (R = −0.54, R = −0.61, respectively, p < 0.05) were observed during the experiment (Table 1B).
It should be noted that pea plant response on Cd application was different after short and long-time treatment. The short-time Cd-treatment (1 day after the first Cd application) induced the elevation of the photosynthesis rate or no significant changes in the transpiration rate and flower production. However, long-time treatment (7 and 28 days after the first Cd application) induced different responses, i.e., a decrease in the photosynthesis and transpiration rates. Furthermore, as we anticipated, the effect of the Cd application on the growth and development was noticed after 7 and/or 28 days. In this case, the Cd-induced increase in the flower production was observed during the second and third weeks after Cd-treatment. Nevertheless, the increased numbers of flowers did not convert to develop mature pods with seeds, and most of them were aging before achieving the maturity. Interestingly, the lowest (10 µM CdSO4) concertation of the Cd that we used during our experiment did not cause this effect. It is also significant that Cd was not detected in the plant tissues treated with 10 µM CdSO4. Moreover, we noticed that the toxic effect of Cd on the flowering time, matured pods and seed number was triggered by 50, 100 and 200 µM CdSO4. Furthermore, the highest concentration (200 µM CdSO4) used during our experiment generated a lowering of the pod length. It also generated increasing root length, which changed its structure and the ratio between the number of internodes and the shoot length. On the other hand, the toxic effect of Cd on the gas exchange after 28 days of Cd-treatment was similar for all Cd concentrations used during our experiment.

4. Discussion

The goal of our study was to determine the short and long-time effect of Cd on the development of P. sativum L. The presented results confirmed that the response of plants to Cd fluctuates and depends on the Cd concentration used during the experiment and the time of treatment. The analysis of the Cd effect on P. sativum L. showed that some of the investigated parameters were affected after short-time (one day) treatment and some after long-time (7 and/or 28 days) treatment. Moreover, positive correlations observed after short-time treatment often changed to negative after long-time treatment and vice versa. Nevertheless, it should be noted that some of the investigated parameters were correlated with Cd-treatment regardless of the time of treatment, e.g., macroelements and microelements concentration. In this case, we observed the reduced accumulation of Mn, K and Ca in the plants after Cd-treatment. Other studies correspond with our results and show that long-term Cd (100 µM) exposure leads to a significant decrease in Mn, K and Ca content in all plant organs of Solanum lycopersicum [29]. A similar tendency was also reported for the aerial part of Lycopersicon esculentum [30] and for the shoot and root of potato plantlets grown in vitro [31], although the latter were submitted to higher concentrations of Cd than in our experiment. It is known that Cd competes with Ca for Ca channels [19]; that is why a decrease in Ca content may be described as one of the characteristic effects of Cd on plants [29].
The effect of Cd on plants also resulted in an alteration of the growth, flower and seed production and physiology of P. sativum L. We established that Cd induced the root growth, although the lateral root system of Cd-treated plants (100 and 200 µM) was underdeveloped (Figure 3A,B). Contrary to our observations, some of the other results showed the inhibition of the root and the hypocotyl growth of Lupinus luteus and L. angustifolius [6]. However, Xie et al. [32] and Wang et al. [33] confirmed that Cd induced the inhibition of the lateral root formation, similar to our results. Moreover, in our studies, we observed that Cd did not affect the length of the stem, but long-time Cd-treatment induced the internodes formation (Figure 3C). Similarly, Djebali et al. [34] observed a reduction in the internode length and diameter of Cd-treated Solanum lycopersicum L. plants. Mayonde et al. [35] also showed the reduction of height, shoot growth and biomass production. Additionally, Elobeid et al. [36] showed that Cd inhibited the elongation of poplar plants by depleting the pool of active auxin from the stem elongation zones.
Furthermore, the analysis of the flowering dynamics and seed production also showed some interesting results (Figure 4). First, we established that Cd-treated plants produced more flowers (Figure 4A). In opposition to this, Cd at 40 mg·dm3 lowered the number of inflorescences of Salvia Splendens Sello ‘Torreador’ [37]. The lower number of flowers of Tagetes erecta L. [15] and P. sativum [10] after Cd-treatment was also described. During our experiment, we noticed that Cd inhibited flowering during the first and second (except plants treated with 10 μM Cd) weeks after treatment (Figure 4B,C), whereas it promoted flowering during the third week of the experiment, but mostly when plants were treated with higher doses of Cd (50, 100 and 200 μM Cd). Similar to our results, the Cd-induced delay of the flowering time was observed in the case of Salvia Splendens Sello ‘Torreador’ at concentrations of 10, 20 and 40 mg·dm3 [37]. Interestingly, Maistri et al. [12] showed that the transition from vegetative to reproductive development is not influenced by Cd. However, they also showed that the presence of Cd affects the expression of Arabidopsis clock genes (i.e., ELF4-EARLY FLOWERING4) immediately after the Cd-treatment. Moreover, the ELF4-overexpressing plants showed a delay in the flowering time, although Cd-treatment (10 μM Cd) of the wild-type and ELF4-overexpressing Arabidopsis plants did not affect their flowering time [12]. Furthermore, Cd (50, 100 μM Cd) promoted a flowering in Arabidopsis [14], and Cd-treatment (50, 75 μM Cd) of Arabidopsis Cd-resistant mutant (cdr3-1D) also induced an early flowering compared with the wild type [38]. Taken together, Cd treatment affects the flower production and flowering time, which are correlated with the duration of the exposure as well as with the concentration of the Cd. Stress-induced flowering was previously reported for the different plants and stresses [39,40]. We observed that after a long-time Cd treatment, the pod and seed development and maturation were inhibited when treated with high doses of Cd (50, 100 and 200 μM Cd) but mostly unaffected when treated with 10 μM Cd (Figure 5). Unfortunately, there is only limited information about the long-time Cd treatment influence on seed or fruit production [10,29]. Nevertheless, this problem is very important for crop production and can be a great threat to human health because of the possible accumulation of Cd in the seeds, even without visible toxic effects to the plant [3]. Interestingly, other studies showed that seeds of the Arabidopsis Cd-resistant mutant (cdr3-1D) were larger than those of the wild type [13].
In the present study, we investigated some physiological characteristics of the P. sativum L. that may describe Cd influence on its development. It has been shown that the increase of the fluorescence intensity ratio F685/F735 is a good stress indicator for the plants and may be applied in remote sensing of the physiological state of the plants [41]. It is also strongly correlated with the photosynthetic pigments content (total chlorophyll and carotenoids) and their ratios [41]. Even though our results of the Fr/Ffr and F690/F735 ratios did not show correlation with Cd treatment nor with the photosynthesis rate, they were positively correlated with the transpiration rate and the OSFq of the adaxial surface of the leaf (Figure 7). The analysis of the gas exchange showed that Cd induced photosynthesis rate after one day of Cd-treatment. In contrast, a decrease in the photosynthesis rate and transpiration rate after one week and four weeks of Cd-treatment was detected. Similarly, the negative effects of cadmium stress on photosynthesis in sassafras seedlings were presented [42]. Moreover, it has been shown that Cd had photosynthesis-promoting effects at low concentrations and photosynthesis-suppressing effects at high concentrations [42]. On the other hand, other studies showed both Cd-induced significant reductions in chlorophyll and a decline in the net rate of photosynthesis when aquatic fern [43] or high (mM) Cd concentrations were used [38,44,45]. It should be noted that, firstly, our results showed the different short-time (one day) and long-time (7 and 28 days) effects of Cd on the photosynthesis rate and transpiration rate. Secondly, our results indicate that the Cd effects on P. sativum L. gas exchange, especially the photosynthesis rate, were more related with a stomatal than a non-stomatal limitation. The stomatal opening/closure analysis showed that the transpiration rate and the F690/F735 and Fr/Ffr ratios were correlated with the frequency of the open stomata on the adaxial surface of the leaf.

5. Conclusions

The results of our study show that the reduced accumulation of Mn, K and especially Ca in the plants after Cd-treatment can be described as one of the characteristic effects of Cd on plants. Moreover, short- and long-time responses of P. sativum L. after Cd exposure depend on Cd concentration. Long-time Cd treatment, when plants were treated with higher concentrations of Cd, induced the internodes formation, inhibited lateral root development, induced flowering and affected pods and seeds maturation. In contrast, plants treated with lower Cd concentrations were still able to maintain normal development. Furthermore, it is important to point out that the Cd effect on gas exchange is quite complex, as it changes from induction to inhibition after short- and long-time exposure, respectively.

Supplementary Materials

The following supporting information can be downloaded at: https://www.mdpi.com/article/10.3390/agriculture12050637/s1, Table S1. Accumulation of macroelements (A) and microelements (B) in the perlite samples during the experiment. Each value is the mean of three replicates ± SD. Different letters represent significant differences (p < 0.05). Table S2. Accumulation of macroelements (A) and microelements (B) in the plant samples during the experiment. Each value is the mean of three replicates ± SD. Different letters represent significant differences (p < 0.05). Table S3. Dynamic of changes of the shoot length, the root length, the number of internodes, the number of leaves and the ratio of the number of internodes to the shoot length during the experiment. Each value is the mean of three replicates ± SD. Different letters represent significant differences (p < 0.05). Table S4. Time of the flowering during the 1, 2 and 3 weeks after the Cd-treatment. Each value is the mean of three replicates ± SD. Different letters represent significant differences (p < 0.05). Table S5. Water contents in the shoot, in the root and the ratio of the chlorophyll relative fluorescence below (Fr) and above 700 nm (Ffr) after 1, 7 and 28 days of the Cd-treatment. Each value is the mean of three replicates ± SD. Different letters represent significant differences (p < 0.05)

Author Contributions

Conceptualization, K.G.; methodology, K.G., J.O., P.S. and B.K.; validation, K.G., J.O., P.S. and B.K.; formal analysis, K.G; investigation, K.G., J.O., P.S. and B.K.; resources, K.G., J.O., P.S. and B.K.; data curation, K.G.; writing—original draft preparation, K.G; writing—review and editing, K.G. and J.N.; visualization, K.G.; supervision, K.G.; project administration, K.G. All authors have read and agreed to the published version of the manuscript.

Funding

This research received no external funding.

Institutional Review Board Statement

Not applicable.

Data Availability Statement

Not applicable.

Acknowledgments

The authors would like to thank Sylwia Okorska for the help with the plant cultivation and the pea growth analysis.

Conflicts of Interest

The authors declare no conflict of interest.

References

  1. Di Sanità Toppi, L.; Gabbrielli, R. Response to cadmium in higher plants. Environ. Exp. Bot. 1999, 41, 105–130. [Google Scholar] [CrossRef]
  2. Kabata-Pendias, A.; Pendias, H. Trace Elements in Soils and Plants, 3rd ed.; CRC Press: Boca Raton, FL, USA, 2001; ISBN 0849315751. [Google Scholar]
  3. Gusmão Lima, A.I.; Pereira, S.I.A.; de Almeida Figueira, E.M.; Caldeira, G.C.N.; Caldeira, H.D.Q. Cadmium Uptake in PEA Plants under Environmentally-Relevant Exposures: The Risk of Food-Chain Transfer. J. Plant Nutr. 2006, 29, 2165–2177. [Google Scholar] [CrossRef]
  4. Simpson, G.G.; Dean, C. Arabidopsis, the Rosetta Stone of Flowering Time? Science 2002, 296, 285–289. [Google Scholar] [CrossRef] [PubMed] [Green Version]
  5. Szőllősi, R.; Varga, I.S.; Erdei, L.; Mihalik, E. Cadmium-induced oxidative stress and antioxidative mechanisms in germinating Indian mustard (Brassica juncea L.) seeds. Ecotoxicol. Environ. Saf. 2009, 72, 1337–1342. [Google Scholar] [CrossRef] [PubMed]
  6. Możdżeń, K.; Zagata, P.; Migdałek, G.; Rut, G.; Rzepka, A. Effect of cadmium nitrate on morphological parameters of Lupinus luteus L. and L. angustifolius L. Mod. Phytomorphology 2015, 7, 75–79. [Google Scholar] [CrossRef]
  7. Liu, S.; Yang, C.; Xie, W.; Xia, C.; Fan, P. The Effects of Cadmium on Germination and Seedling Growth of Suaeda salsa. Procedia Environ. Sci. 2012, 16, 293–298. [Google Scholar] [CrossRef] [Green Version]
  8. Haider, F.U.; Liqun, C.; Coulter, J.A.; Cheema, S.A.; Wu, J.; Zhang, R.; Wenjun, M.; Farooq, M. Cadmium toxicity in plants: Impacts and remediation strategies. Ecotoxicol. Environ. Saf. 2021, 211, 111887. [Google Scholar] [CrossRef]
  9. Kastori, R.; Maksimovic, I.; Putnik-Delic, M.; Momcilovic, V.; Rajic, M. Effect of cadmium on germination and growth of wheat. Zb. Matice Srp. Za Prir. Nauk. 2019, 136, 57–68. [Google Scholar] [CrossRef] [Green Version]
  10. Almuwayhi, M.A. Effect of cadmium on the molecular and morpho-physiological traits of Pisum sativum L. Biotechnol. Biotechnol. Equip. 2021, 35, 1374–1384. [Google Scholar] [CrossRef]
  11. Keunen, E.; Truyens, S.; Bruckers, L.; Remans, T.; Vangronsveld, J.; Cuypers, A. Survival of Cd-exposed Arabidopsis thaliana: Are these plants reproductively challenged? Plant Physiol. Biochem. 2011, 49, 1084–1091. [Google Scholar] [CrossRef]
  12. Maistri, S.; DalCorso, G.; Vicentini, V.; Furini, A. Cadmium affects the expression of ELF4, a circadian clock gene in Arabidopsis. Environ. Exp. Bot. 2011, 72, 115–122. [Google Scholar] [CrossRef]
  13. Wang, Y.; Zong, K.; Jiang, L.; Sun, J.; Ren, Y.; Sun, Z.; Wen, C.; Chen, X.; Cao, S. Characterization of an Arabidopsis cadmium-resistant mutant cdr3-1D reveals a link between heavy metal resistance as well as seed development and flowering. Planta 2011, 233, 697–706. [Google Scholar] [CrossRef]
  14. Wang, W.Y.; Xu, J.; Liu, X.J.; Yu, Y.; Ge, Q. Cadmium induces early flowering in Arabidopsis. Biol. Plant. 2012, 56, 117–120. [Google Scholar] [CrossRef]
  15. Eid, R.A.; Mazher, A.A.M.; Khalifa, R.K.M.; Shaaban, S.H.A. Effect of cadmium concentrations on the vegetative growth, flowering and chemical constituents of Tagets erecta L. plant. Int. J. PharmTech Res. 2016, 9, 18–24. [Google Scholar]
  16. Sandalio, L.M.; Dalurzo, H.C.; Gómez, M.; Romero-Puertas, M.C.; Del Río, L.A. Cadmium-induced changes in the growth and oxidative metabolism of pea plants. J. Exp. Bot. 2001, 52, 2115–2126. [Google Scholar] [CrossRef]
  17. Nada, E.; Ferjani, B.A.; Ali, R.; Bechir, B.R.; Imed, M.; Makki, B. Cadmium-induced growth inhibition and alteration of biochemical parameters in almond seedlings grown in solution culture. Acta Physiol. Plant 2007, 29, 57–62. [Google Scholar] [CrossRef]
  18. Liu, L.; Sun, H.; Chen, J.; Zhang, Y.; Li, D.; Li, C. Effects of cadmium (Cd) on growth, chlorophyll content, and photosynthesis of cotton seedlings (Gossypium hirsutum L.). Plant Omics 2014, 7, 284–290. [Google Scholar]
  19. Perfus-Barbeoch, L.; Leonhardt, N.; Vavasseur, A.; Forestier, C. Heavy metal toxicity: Cadmium permeates through calcium channels and disturbs the plant water status. Plant J. 2002, 32, 539–548. [Google Scholar] [CrossRef]
  20. Shi, G.; Liu, C.; Cai, Q.; Liu, Q.; Hou, C. Cadmium accumulation and tolerance of two safflower cultivars in relation to photosynthesis and antioxidative enzymes. Bull. Environ. Contam. Toxicol. 2010, 85, 256–263. [Google Scholar] [CrossRef]
  21. Murashige, T.; Skoog, F. A revised medium for rapid growth and bioassays with tobacco tissue cultures. Physiol. Plant 1962, 15, 473–497. [Google Scholar] [CrossRef]
  22. Głowacka, K.; Źróbek-Sokolnik, A.; Okorski, A.; Najdzion, J. The Effect of Cadmium on the Activity of Stress-Related Enzymes and the Ultrastructure of Pea Roots. Plants 2019, 8, 413. [Google Scholar] [CrossRef] [PubMed] [Green Version]
  23. Yang, C.; Chong, J.; Li, C.; Kim, C.; Shi, D.; Wang, D. Osmotic adjustment and ion balance traits of an alkali resistant halophyte Kochia sieversiana during adaptation to salt and alkali conditions. Plant Soil 2007, 294, 263–276. [Google Scholar] [CrossRef]
  24. Gunderson, C.A.; Sholtis, J.D.; Wullschleger, S.D.; Tissue, D.T.; Hanson, P.J.; Norby, R.J. Environmental and stomatal control of photosynthetic enhancement in the canopy of a sweetgum (Liquidambar styraciflua L.) plantation during 3 years of CO2 enrichment. Plant Cell Environ. 2002, 25, 379–393. [Google Scholar] [CrossRef]
  25. Pfündel, E.; Neubohn, B. Assessing photosystem I and II distribution in leaves from C4 plants using confocal laser scanning microscopy. Plant Cell Environ. 1999, 22, 1569–1577. [Google Scholar] [CrossRef]
  26. Gouveia-Neto, S.A.; Silva-Jr, E.A.; Cunha, P.C.; Oliveira-Filho, R.A.; Silva, L.H.M.; Da Costa, E.B.; Câmara, T.J.R.; Willadino, L.G. Abiotic Stress Diagnosis via Laser Induced Chlorophyll Fluorescence Analysis in Plants for Biofuel: 1. In Biofuel Production; Bernardes, M.A.d.S., Ed.; IntechOpen: Rijeka, Croatia, 2011. [Google Scholar]
  27. White, R.G. Using Chlorophyll Fluorescence to Rapidly Discriminate C3 from C4 Photosynthesis in Plants. 2012. Available online: http://www.emc2012.org.uk/documents/Abstracts/Abstracts/EMC2012_1121.pdf (accessed on 8 June 2018).
  28. Lichtenthaler, U.; Rinderle, H.K. The Chlorophyll Fluorescence Ratio F690/F735 as a Possible Stress Indicator. In Applications of Chlorophyll Fluorescence in Photosynthesis Research, Stress Physiology, Hydrobiology and Remote Sensing; Lichtenthaler, H.K., Ed.; Springer Netherlands: Dordrecht, The Netherlands, 1988; pp. 189–196. [Google Scholar]
  29. Hédiji, H.; Djebali, W.; Belkadhi, A.; Cabasson, C.; Moing, A.; Rolin, D.; Brouquisse, R.; Gallusci, P.; Chaïbi, W. Impact of long-term cadmium exposure on mineral content of Solanum lycopersicum plants: Consequences on fruit production. S. Afr. J. Bot. 2015, 97, 176–181. [Google Scholar] [CrossRef]
  30. Carvalho Bertoli, A.; Gabriel Cannata, M.; Carvalho, R.; Ribeiro Bastos, A.R.; Puggina Freitas, M.; dos Santos Augusto, A. Lycopersicon esculentum submitted to Cd-stressful conditions in nutrition solution: Nutrient contents and translocation. Ecotoxicol. Environ. Saf. 2012, 86, 176–181. [Google Scholar] [CrossRef]
  31. Gonçalves, J.F.; Antes, F.G.; Maldaner, J.; Pereira, L.B.; Tabaldi, L.A.; Rauber, R.; Rossato, L.V.; Bisognin, D.A.; Dressler, V.L.; de Moraes Flores, É.M.; et al. Cadmium and mineral nutrient accumulation in potato plantlets grown under cadmium stress in two different experimental culture conditions. Plant Physiol. Biochem. 2009, 47, 814–821. [Google Scholar] [CrossRef]
  32. Xie, Y.; Wang, J.; Zheng, L.; Wang, Y.; Luo, L.; Ma, M.; Zhang, C.; Han, Y.; Beeckman, T.; Xu, G.; et al. Cadmium stress suppresses lateral root formation by interfering with the root clock. Plant Cell Environ. 2019, 42, 3182–3196. [Google Scholar] [CrossRef]
  33. Wang, H.-Q.; Xuan, W.; Huang, X.-Y.; Mao, C.; Zhao, F.-J. Cadmium Inhibits Lateral Root Emergence in Rice by Disrupting OsPIN-Mediated Auxin Distribution and the Protective Effect of OsHMA3. Plant Cell Physiol. 2021, 62, 166–177. [Google Scholar] [CrossRef]
  34. Djebali, W.; Hédiji, H.; Abbes, Z.; Barhoumi, Z.; Yaakoubi, H.; Zoghlami, L.B.; Chaïbi, W. Aspects on growth and anatomy of internodes and leaves of cadmium-treated Solanum lycopersicum L. plants. J. Biol. Res. 2010, 13, 75–84. [Google Scholar]
  35. Mayonde, S.; Cron, G.V.; Glennon, K.L.; Byrne, M.J. Effects of cadmium toxicity on the physiology and growth of a halophytic plant, Tamarix usneoides (E. Mey. ex Bunge). Int. J. Phytoremediat. 2021, 23, 130–138. [Google Scholar] [CrossRef]
  36. Elobeid, M.; Göbel, C.; Feussner, I.; Polle, A. Cadmium interferes with auxin physiology and lignification in poplar. J. Exp. Bot. 2012, 63, 1413–1421. [Google Scholar] [CrossRef] [Green Version]
  37. Nowak, J. Effects of cadmium and lead concentrations and arbuscular mycorrhiza on growth, flowering and heavy metal accumulation in scarlet sage (Salvia splendens Sello ‘torreador’). Acta Agrobot. 2012, 60, 79–83. [Google Scholar] [CrossRef]
  38. Chen, X.; Wang, J.; Shi, Y.; Zhao, M.Q.; Chi, G.Y. Effects of cadmium on growth and photosynthetic activities in pakchoi and mustard. Bot. Stud. 2011, 52, 41–46. [Google Scholar]
  39. Wada, K.C.; Takeno, K. Stress-Induced Flowering. In Abiotic Stress Responses in Plants; Ahmad, P., Prasad, M., Eds.; Springer: New York, NY, USA, 2012; pp. 331–345. ISBN 978-1-4614-0633-4. [Google Scholar]
  40. Takeno, K. Stress-induced flowering: The third category of flowering response. J. Exp. Bot. 2016, 67, 4925–4934. [Google Scholar] [CrossRef] [Green Version]
  41. Maurya, R.; Prasad, S.M.; Gopal, R. LIF technique offers the potential for the detection of cadmium-induced alteration in photosynthetic activities of Zea Mays L. J. Photochem. Photobiol. C Photochem. Rev. 2008, 9, 29–35. [Google Scholar] [CrossRef]
  42. Zhao, H.; Guan, J.; Liang, Q.; Zhang, X.; Hu, H.; Zhang, J. Effects of cadmium stress on growth and physiological characteristics of sassafras seedlings. Sci. Rep. 2021, 11, 1–11. [Google Scholar] [CrossRef]
  43. Deng, G.; Li, M.; Li, H.; Yin, L.; Li, W. Exposure to cadmium causes declines in growth and photosynthesis in the endangered aquatic fern (Ceratopteris pteridoides). Aquat. Bot. 2014, 112, 23–32. [Google Scholar] [CrossRef]
  44. Chugh, L.K.; Sawhney, S.K. Photosynthetic activities of Pisum sativum seedlings grown in presence of cadmium. Plant Physiol. Biochem. 1999, 37, 297–303. [Google Scholar] [CrossRef]
  45. Datta, J.K.; Ghosh, D.; Banerjee, A.; Mondal, N.K. Studies on the impact of cadmium on growth, yield attributes, yield and biochemistry of mung bean (Vigna radiata L. Wilczek) under natural field condition, burdwan, west bengal. Sci. Agric. 2016, 14, 202. [Google Scholar] [CrossRef]
Figure 1. The type of pod (A) and the scheme of the measurement of pods and seeds (B) after 28 days of Cd-treatment. The pod and seed size were determined according to its length—black line indicator.
Agriculture 12 00637 g001
Figure 2. Accumulation of Cd (A), Mn (B), Ca (C) and K (D) in the plants during the experiment and Cd-treatment. Each value is the mean of three replicates ± SD. Different letters represent significant differences (p < 0.05). The statistically significant results of the correlation analysis are presented as Pearson’s correlation coefficients (R).
Agriculture 12 00637 g002
Figure 3. The growth of P. sativum L. during the experiment and after Cd-treatment. (A)—Representative images of P. sativum L. 28 days after Cd-treatment. The picture shows the control plant (0 µM CdSO4) and the plant treated with 10, 50, 100 and 200 µM CdSO4. Scale bar: 1 cm. (B,C)—The root length (B) and the ratio of the number of internodes to shoot length (C) changes during the experiment. Each value is the mean of three replicates ± SD. Different letters represent significant differences (p < 0.01). (D). The statistically significant results of the correlation analysis are presented as Pearson’s correlation coefficients (R).
Agriculture 12 00637 g003
Figure 4. Flowering and pod production of peas during the experiment and Cd-treatment (AC). (A)—The number of flowers, pods, matured pods and senescent pods after Cd-treatment. Each value is the mean of three replicates ± SD. Different letters represent significant differences (p < 0.05); The statistically significant results of the correlation analysis are presented as Pearson’s correlation coefficients (R). (B,C)—Mean (B) and sum (C) of flowers produced after 1, 2 and 3 weeks of Cd-treatment.
Agriculture 12 00637 g004
Figure 5. The pod and seed development during the experiment and Cd-treatment. (A)—Representative images of the pods of the control plants and the plants treated with 10, 50, 100, and 200 µM CdSO4 (A). The pictures in the left panel show pods developed from flowers formed during the first week after Cd-treatment, whereas the pictures in the right panel show pods developed from flowers formed during the third week of the experiment. (B,C)—The length (B) and distribution (C) of seeds in the pea pods after 28 days of Cd-treatment. The distribution of the three groups of seeds (1—the first, 2—the second and 3—the third) after 0, 10, 50, 100 and 200 µM CdSO4 treatment (C). (D,E)—The length (D) and distribution (E) of the pea pods after 28 days of Cd-treatment. The distribution of the three groups of pods (1—the first, 2—the second and 3—the third) after 0, 10, 50, 100 and 200 µM CdSO4 treatment (E). Each value is the mean of three replicates ± SD. Different letters represent significant differences (p < 0.05). Sale bar: 5 mm.
Agriculture 12 00637 g005
Figure 6. The photosynthesis rate ((A)—Phot), the transpiration rate ((B)—Trmmol), the ratio of the WC of the shoot/WC of the root (C) and the Fr/Ffr ratio (D) after 1, 7 and 28 of Cd-treatment. Each value is the mean of three replicates ± SD. Different letters represent significant differences (p < 0.05). The statistically significant results of the correlation analysis are presented as Pearson’s correlation coefficients (R).
Agriculture 12 00637 g006
Figure 7. The response of stomatal opening during the experiment and Cd-treatment. OSFq on the adaxial (A) and abaxial (B) surfaces of pea leaves after 1, 7 and 28 days of Cd treatment. Each value is the mean of three replicates ±SD. Different letters represent significant differences (p < 0.05). Representative images of the adaxial surface of the pea leaf after 1 day of Cd-treatment. The open stomata is indicated with an arrow (C). Scale bar: 50 µm.
Agriculture 12 00637 g007
Table 1. (A,B). The statistically significant results of the correlation analysis presented as Pearson’s correlation coefficients (R).
A
VariableCorrelation Coefficient R, p < 0.05
Photosynthesis Rate after 28 Days of Cd Treatment
WC of the shoot/WC of the root ratio after 28 days of Cd treatment0.93
B
VariableCorrelation Coefficient R, p < 0.05
Fr/Ffr RatioF690/F735 RatioTranspiration RateWC of the Shoot/WC of the Root RatioOSFq Abaxial
Fr/Ffr ratio-0.99−0.540.68ns
F690/F735 ratio0.99-ns0.72ns
OSFq adaxial−0.61−0.540.55ns0.91
ns: not significant.
Publisher’s Note: MDPI stays neutral with regard to jurisdictional claims in published maps and institutional affiliations.

