Article

Effect of Astragalus membranaceus Root on the Serum Metabolome of Preweaning Dairy Calves

1
Department of Clinical Veterinary Medicine, College of Veterinary Medicine, Sichuan Agricultural University, Chengdu 611130, China
2
Key Laboratory of Coarse Cereal Processing, Ministry of Agriculture and Rural Affairs, Chengdu University, Chengdu 610106, China
3
Institute of Biodiversity, Animal Health & Comparative Medicine, College of Medical, Veterinary & Life Sciences, University of Glasgow, Glasgow G611QH, UK
*
Authors to whom correspondence should be addressed.
Agriculture 2022, 12(6), 744; https://doi.org/10.3390/agriculture12060744
Submission received: 18 April 2022 / Revised: 19 May 2022 / Accepted: 23 May 2022 / Published: 24 May 2022
(This article belongs to the Section Farm Animal Production)

Abstract

:
The effect of the Astragalus membranaceus root (AMR) on the serum metabolic profiles of preweaning calf were investigated in this study. Sixteen preweaning Holstein calves were randomly allocated into two groups with eight calves per group, and offered a control basal diet (CON group) or supplemented with 20 g superfine powder of AMR (AMR group) for 14 day. Serum samples were collected from calves on day 0, 7 and 14. Serum albumin, globulin, total protein, glucose, reduced glutathione and superoxide dismutase were evaluated. Serum metabolic profiling was analyzed using ultra-high-performance liquid chromatography–time-of-flight mass spectrometry. The results demonstrated that there were no significantly difference of total protein, glucose, reduced glutathione and superoxide dismutase between the CON group and AMR group (p > 0.05), while within the CON group and AMR group, serum glucose showed a continuous upward trend from 0 day to 14 day (p < 0.001). Untargeted metabolomics analysis found the metabolism of preweaning calf was considerably changed during growth, mainly including amino acid metabolism and carbohydrate metabolism and showed an increasing in protein synthesis and gluconeogenesis. 19 differential metabolites have been screened after supplementing AMR for 14 day, nine of which were up-regulated, including ornithine, L-pyroglutamic acid, L-proline and D-proline, and 10 down-regulated, containing L-kynurenine, 5-hydroxyindoleacetate, linoleic acid and 4-pyridoxic acid. Pathway analysis found these metabolites mainly participated in three primary pathways: arginine and proline metabolism, tryptophan metabolism and glutathione metabolism (p < 0.05), while linoleic acid metabolism and vitamin B6 metabolism were also enriched (0.1 < p < 0.05). Such metabolic changes reflected the enhancement of the antioxidant and anti-inflammatory capacity of preweaning calves.

1. Introduction

Preweaning calf rearing is a key part in calf management as calves experience a great physiological and metabolic transition from milk to a solid diet, and from being nominal monogastric organisms to functional ruminants during this period [1]. Due to the immaturity of the digestive system and immune system [2,3], they are susceptible to the external environment. Both changes in their diet and environment can be stressors to induce stress responses, thus increasing the risk of being attacked by various pathogens, causing diarrhea [4], bovine respiratory disease (BRD) [5] or other diseases, further leading to the growth retardation or even death of calves, causing great economic losses to pastures. Therefore, a healthy transition from birth to wean is of vital importance for dairy farms. Antibiotic and chemotherapeutics used to prevent these diseases bring a series of issues such as antibiotic residues and drug-resistance [6], as well as resulting in the dysbiosis of gastrointestinal flora [7], thus promoting the development of antibiotic substitutes.
Astragalus membranaceus, also called “Huang Qi” in traditional Chinese medicine, is usually used as a traditional tonic for “Qi tonifying” [8]. It was first recorded in Shen Nong’s Classic of Materia Medica in 200AD [9]. Huang Qi contains various chemical constituents including saponins, folic acid, polysaccharides and flavonoids, and has a broad range of bioactivities such as antidiabetic, antiviral, immunomodulatory, antioxidant and anti-inflammatory [10]. There is evidence that Huang Qi extract, Astragalus Polysaccharide (APS), was beneficial to improve growth performance and reduce immunological stress caused by lipopolysaccharides (LPS) in piglets [6]. APS also improved the production performance and egg quality in Chongren hens [11]. In addition, Astragalus membranaceus root (AMR) extract has been demonstrated to improve growth performance, antioxidant capacity and immunity in early-weaned yak calves [12]. Therefore, we assumed AMR has the potential to be used in dairy farms to ensure the healthy growth of newborn calves. The AMR used in this study was processed by superfine preparation; in this way, the plant’s cell walls were highly disrupted and the solubility of its intracellular contents were improved. Moreover, the superfine powder of AMR appeared to produce a more rapid positive response on various immune parameters in sea cucumbers compared to conventional fine powder due to the smaller particle size and easier absorption in the gastrointestinal tract [13].
AMR has been widely used in livestock, however, less is known about the effect of it on calves. In this study, we used an untargeted metabolomics approach to analyze the effect of AMR on the serum metabolite profile in preweaning dairy calf, aiming at exploring the application potential of it in calf rearing from the perspective of metabolism.

2. Materials and Methods

2.1. Animal Management

All animal experiments were conducted in strict accordance with guidelines for the Care and Use of Laboratory Animals of China, and all procedures were approved by the Animal Care and Use Committee of Sichuan Agricultural University (No. 2013-028). Sixteen preweaning Holstein calves (20 ± 5 days of age) were selected from a dairy farm in Ziyang, Sichuan Province, China. All calves participating in the experiment were housed in individual hutches and fed with pasteurized milk at 0800 h and 1630 h every day, the feeding amount was 6 L/day at the age of 2–10 days and 8 L/day at the age of 11–42 days. All calves were offered ad libitum concentrate supplement (8751-20, COFCO feed (Chengdu) Co., Ltd., Chengdu, China) and clean water, any remaining feed was collected at 0800 h every day.

2.2. Experimental Design and Sample Collection

Sixteen calves were randomly assigned to two treatments with 8 calves per group and fed with a control basal diet (CON group) or a control basal diet supplemented with 20 g/day superfine powder of AMR (AMR group), according to the dosage of our previous study [14] and Wu et al. [15]. The superfine powder of AMR was purchased from Gansu Minxian Ronghe Traditional Chinese Medicine Co., Ltd., Dingxi, Gansu, China (with particle size < 15 μm, containing ≥20% astragalus polysaccharide, ≥0.02% astragaloside IV) and was mixed in pasteurized milk when feeding, the feeding period lasted for 14 day. Blood samples of both CON group and AMR group were collected via the jugular vein on day 0, 7 and 14, marked CON0, CON7 and CON14 and AMR0, AMR7 and AMR14, respectively, then centrifuged at 1500× g for 10 min at 25 °C. The serum samples were then isolated and frozen at −80 °C for further analysis.

2.3. Serum Parameter’s Analysis

Serum concentrations of albumin (ALB), globulin (GLB), total protein (TP) and glucose (GLU) were measured by commercial kits (Chengdu Pulitai Biotechnology Co., Ltd., Chengdu, China) using an automated analyzer (Chengdu Smart Technology Co., Ltd., Chengdu, China, SMT-120V). Serum activities of reduced glutathione (GSH) and superoxide dismutase (SOD) were measured using commercially available test kits from Nanjing Jiancheng Bioengineering Institute, Nanjing, China (#A006–2-1 and #A001-3-1, respectively). All testing procedures were performed in strict accordance with the manufacturer’s instructions.

2.4. Sample Pretreatment and Metabolic Profiling Analysis

Serum samples were slowly dissolved at 4 °C, from each sample a 100 μL aliquot was taken, then 400 μL pre-cooled methanol acetonitrile solution (1:1, v/v) was added, vortexed for 60 s and placed at −20 °C for 1 h to precipitate protein. Then samples were centrifuged at 14,000× g and 4 °C for 20 min. The supernatant was lyophilized and stored at −80 °C until analyzed. Additionally, quality control (QC) samples were prepared by mixing an equal amount of each sample, which were used to determine system stability over the entire experiment before testing.
After pretreatment, serum samples were separated using an ultra-high-performance liquid chromatography (UHPLC) system (1290 Infinity II, Agilent Technologies) incorporating a hydrophilic interaction chromatography column (2.1 × 100 mm, 1.7 μm; Waters). Mass spectrometry analysis was performed using a triple time-of-flight (TOF) 6600+ system (AB SCIEX) equipped with an electrospray ionization source used in positive and negative ion modes. The UHPLC-TOF-MS was performed by Shanghai Applied Protein Technology Co., Ltd. (Shanghai, China).

2.5. Data Processing and Statistical Analyses

Serum ALB, GLB, TB, GLU, GSH and SOD concentrations were analyzed by one-way analysis of variance (ANOVA) test, and the data at different time points were compared by post hoc Fisher’s Least Significant Difference (LSD) test using SPSS version 17.0 (SPSS Software). The results were expressed as means ± standard errors. The threshold of significance was set at p < 0.05; trends were declared at 0.05 ≤ p < 0.10. Graphs were created using GraphPad Prism version 8.0.2 (GraphPad Software).
In the metabolomics analysis, all row dates processing and identification of metabolites were consistent with the methods used in our previous study [16], with mass error set within 25 ppm. Differential metabolites were screened by the combination of the variable importance in the projection (VIP) values obtained from orthogonal partial least squares discrimination analysis (OPLS-DA) model and p-values from Student’s t-test. Metabolites with VIP > 1, and p < 0.05 were set as significantly differential metabolites, while these with VIP > 1, and 0.05 ≤ p < 0.1 were considered as metabolites with different trends. The fold change (FC) analysis was used to show the change of expression levels of metabolites. Principal component analysis (PCA) was conducted to evaluate differences between samples within groups and between groups, and measured the test stability, with model parameters R2X > 0.5 indicating that models in the experiment were reliable. Kyoto Encyclopedia of Genes and Genomes (KEGG) pathway analysis was processed and analyzed using MetaboAnalyst 5.0 (https://www.metaboanalyst.ca/, accessed on 10 February 2022).

3. Results

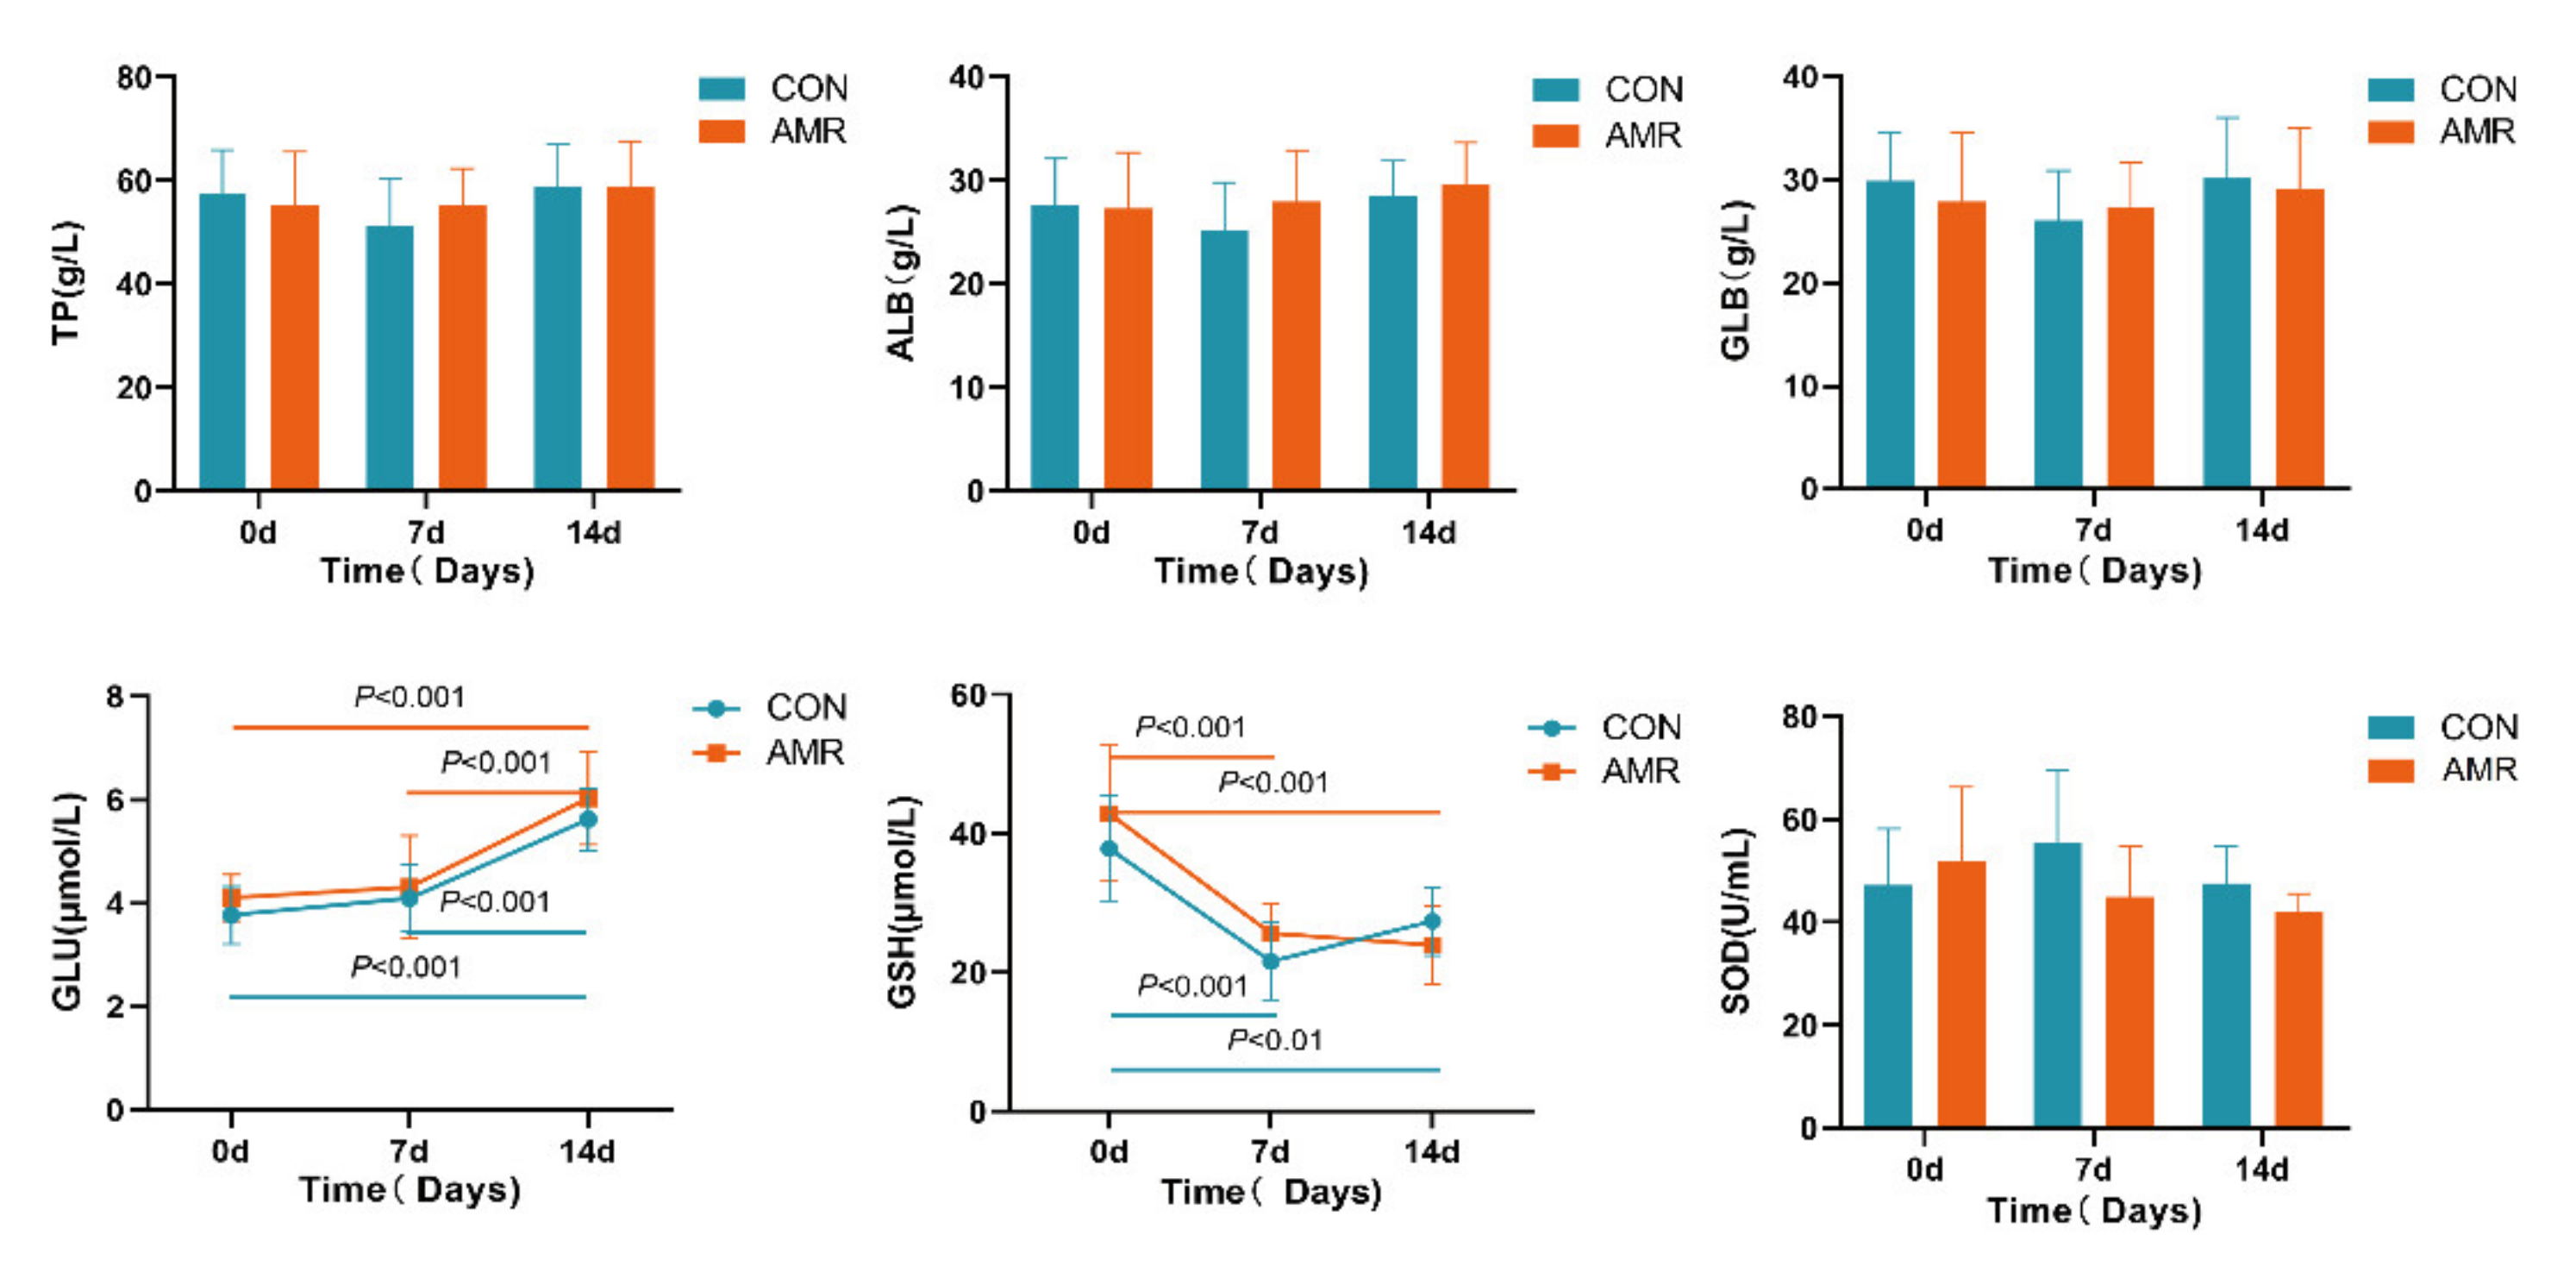
3.1. Serum Parameter’s Analysis

As show in Figure 1, compared to the CON group, there were no significant differences (p > 0.05) of the serums ALB, GLB, TP, GLU, GSH and SOD after supplementation with AMR. However, within the group, the serum levels of GLU were continuously increased in both the CON group and the AMR group during the experiment, and showed a sharper increase (p < 0.001) on day 14 than on day 7 and day 0 in both of the two groups. Serum GSH content was found to show a decreasing tendency in both the CON group and the AMR group; it was dramatically down-regulated (p < 0.001) on day 7, while it had a slight increase on day 14 in the CON group. The serum activity of SOD showed a decreasing tendency from 0 daay to 7 day in the AMR group, was slightly higher (p > 0.05) than the CON group at 0 day and lower (p > 0.05) at 7 day and 14 day.

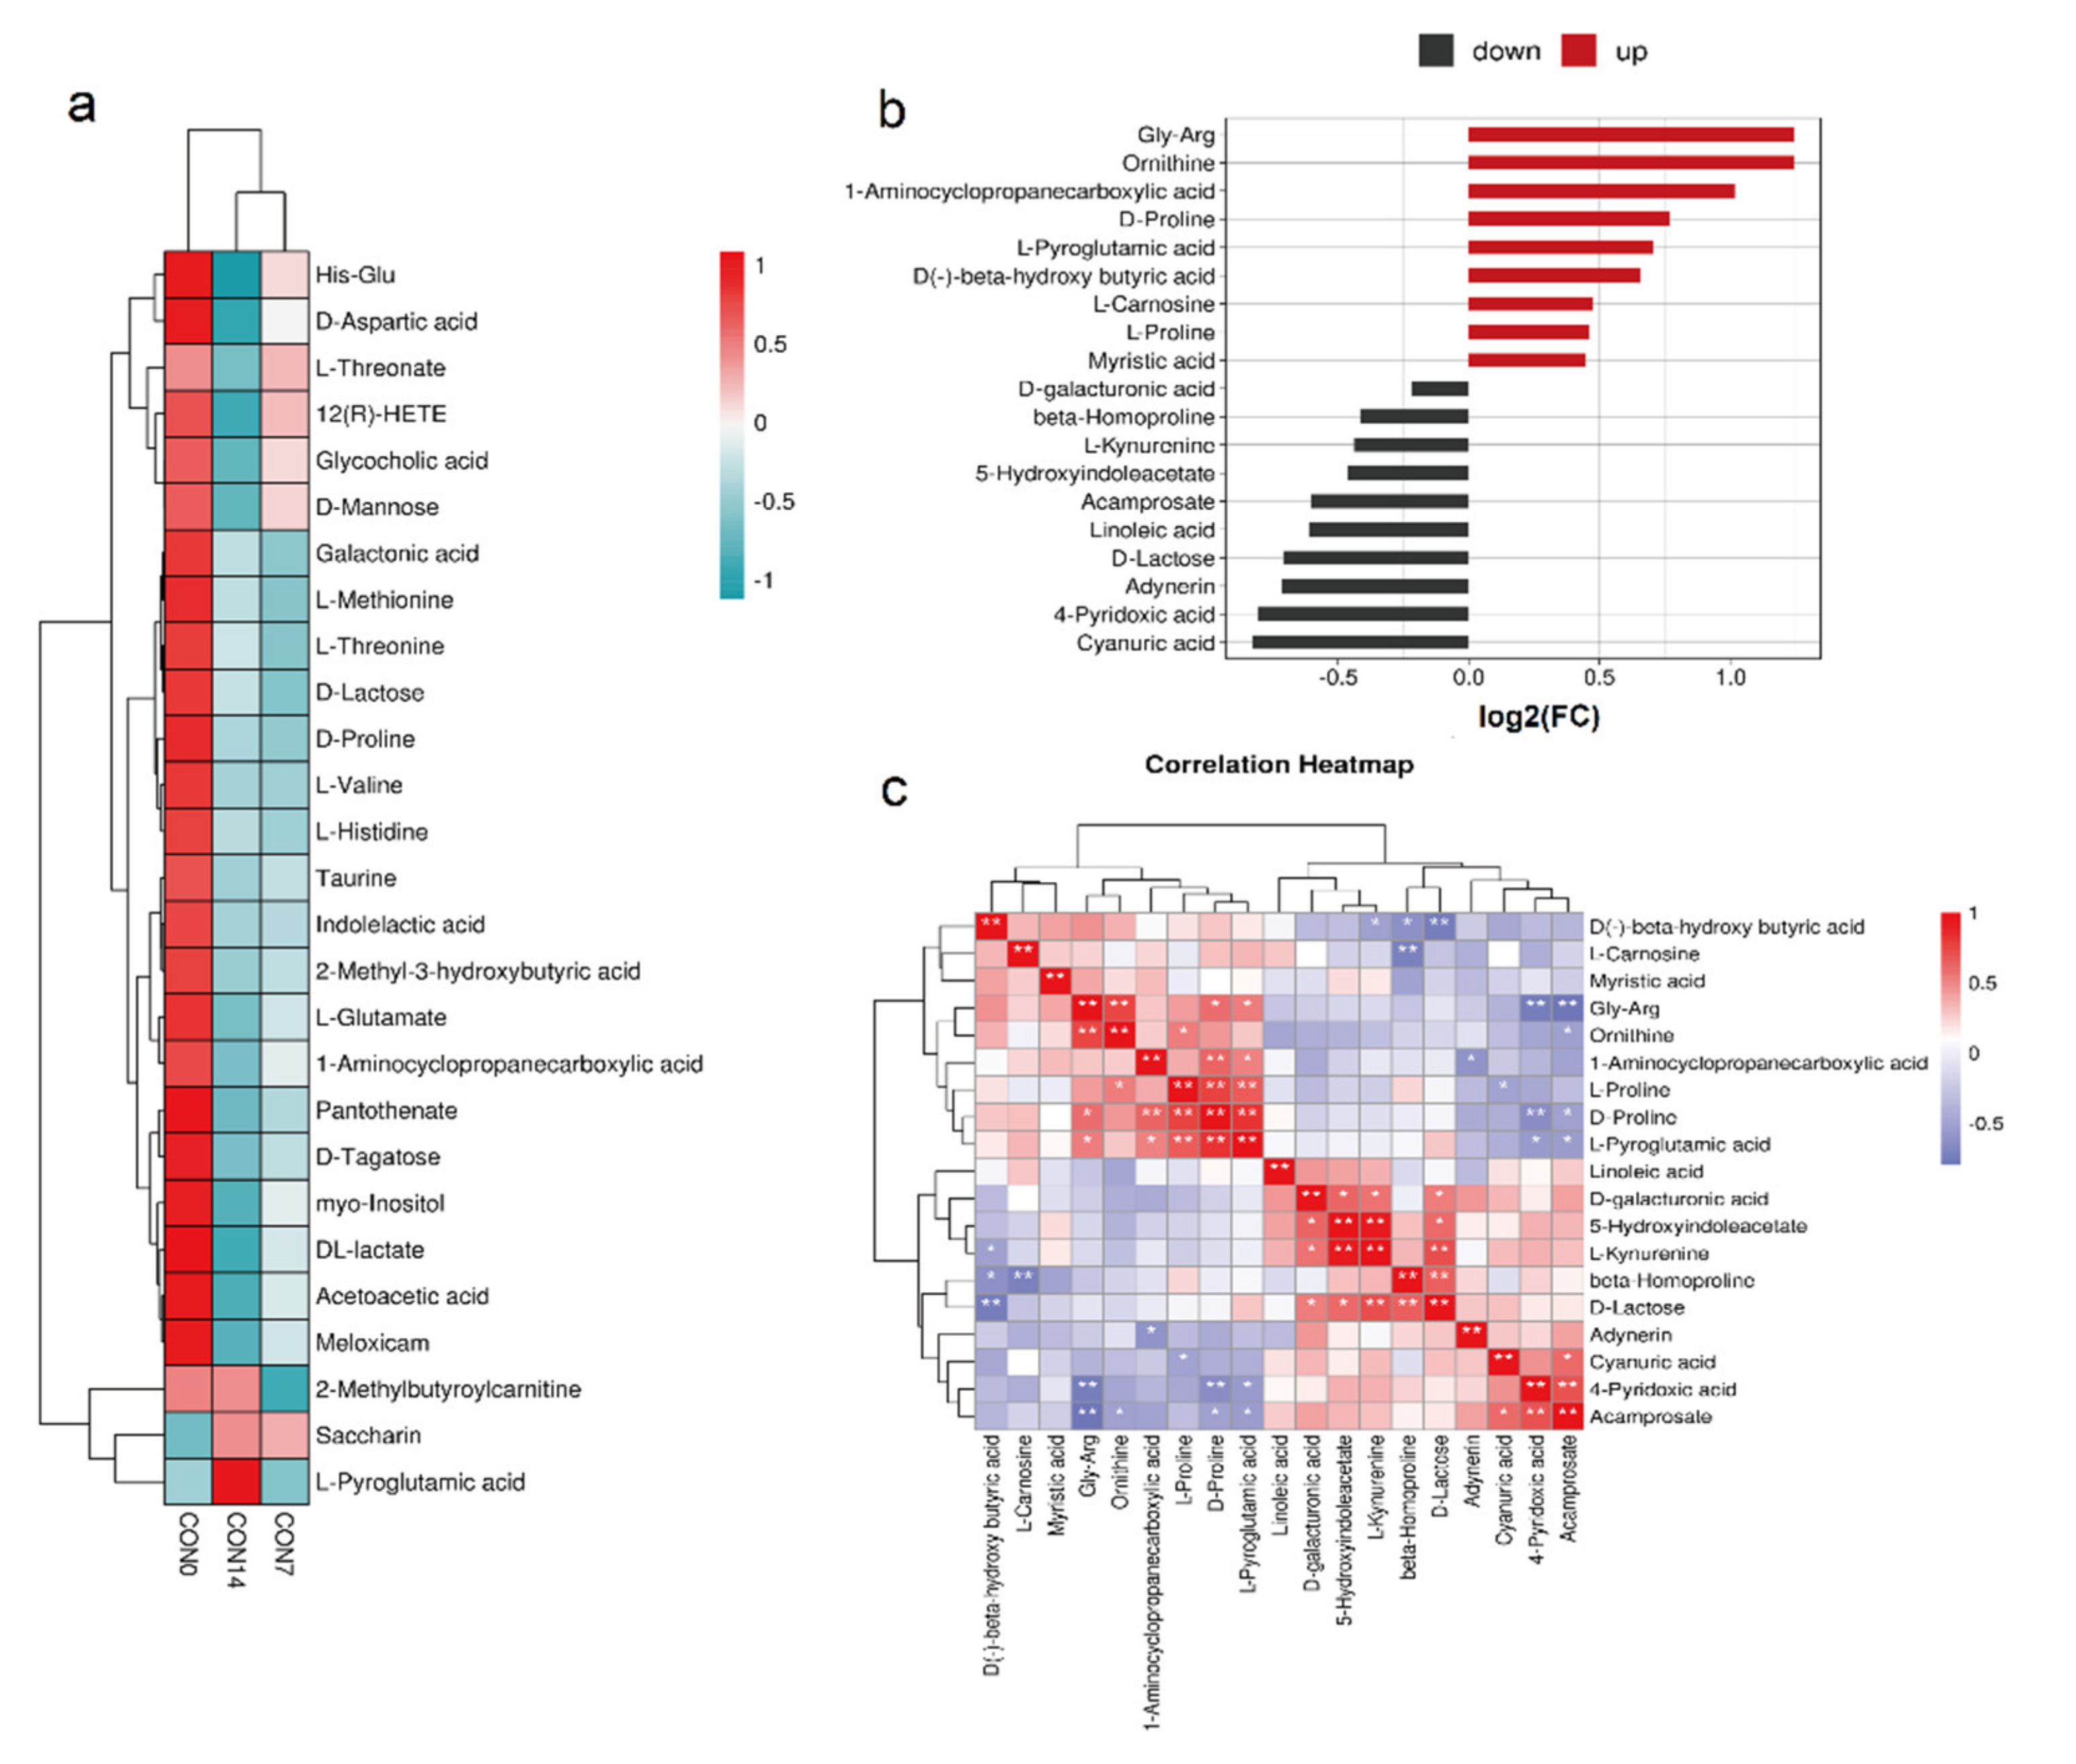
3.2. Serum Metabolite Profiles

We compared the total ion chromatograms (TIC) of four QC samples in positive and negative ion modes, the results showed the overlap of the retention time (RT) and intensity of each chromatographic peak, indicating the high stability of the instrument system (Figure S1). After the data integrity check, 13,781 and 11,250 ion peaks were obtained in positive and negative ion modes, respectively. Among them, 3144 and 2296 ion peaks were significantly changed (p < 0.05) in positive and negative ion models, respectively. The PCA parameters R2X of CON0 versus CON7 groups, CON7 versus CON14 groups and CON14 versus AMR14 groups were 0.558, 0.533 and 0.547 in negative ion modes, and 0.525, 0.511 and 0.598 in positive ion modes. The model parameters R2X > 0.5 between each group, indicating that the model established in this experiment is reliable and can be used for further analysis. The OPLS-DA model plots showed that the samples between groups were well-separated (Figure S2). The permutation tests for the model of each group showed Q2 intercept <0.05, indicating that there was no overfitting (Figure S2).

3.3. Screening Differential Metabolites

A total of 50 metabolites that differed between CON0 and CON7 groups and 68 metabolites that differed between CON7 and CON14 groups have been identified based on VIP > 1 and p < 0.05. To further elucidate the dynamic metabolic changes of preweaning calves during the experiment, all metabolites that differed among the groups were analyzed. We screened 27 significantly differential metabolites that were shared by CON0, CON7 and CON14 groups, many of these metabolites being amino acids and their derivatives, including L-methionine, D-proline, D-aspartic acid, L-threonine, L-histidine, L-valine, L-glutamate and L-threonate (Figure S3, Table S1). The heatmap shows changes in the same 27 metabolites among the three groups. As shown in Figure 2a, serum 2-methylbutyroylcarnitine and L-pyroglutamic acid levels decreased at 7 day and then increased at 14 day, while serum saccharin showed an increase tendency from 0 day to 14 day. Except for these three metabolites, all the remaining 24 metabolites continuously decreased during this period.
After feeding superfine powder of AMR for 14 day, 19 metabolites that differed between the CON14 and AMR14 groups were screened (Table S2). Among them, 10 metabolites were significantly differential metabolites (p < 0.05), while nine were metabolites with different trends (0.05 ≤ p < 0.1). FC analysis found the levels of 10 metabolites were down-regulated, including L-kynurenine, D-lactose, beta-homoproline, 5-hydroxyindoleacetate, 4-pyridoxic acid, cyanuric acid, adynerin, D-galacturonic acid, linoleic acid and acamprosate, and 9 metabolites were up-regulated, containing Gly-Arg, 1-aminocyclopropanecarboxylic acid, L-pyroglutamic acid, ornithine, L-proline, D-proline, D(-)-beta-hydroxy butyric acid, myristic acid and L-carnosine (Figure 2b). We then performed correlation analysis of these differential metabolites using the Pearson Correlation Coefficient and the results were embodied in Figure 2c. Most metabolites were significantly correlated (p < 0.05).

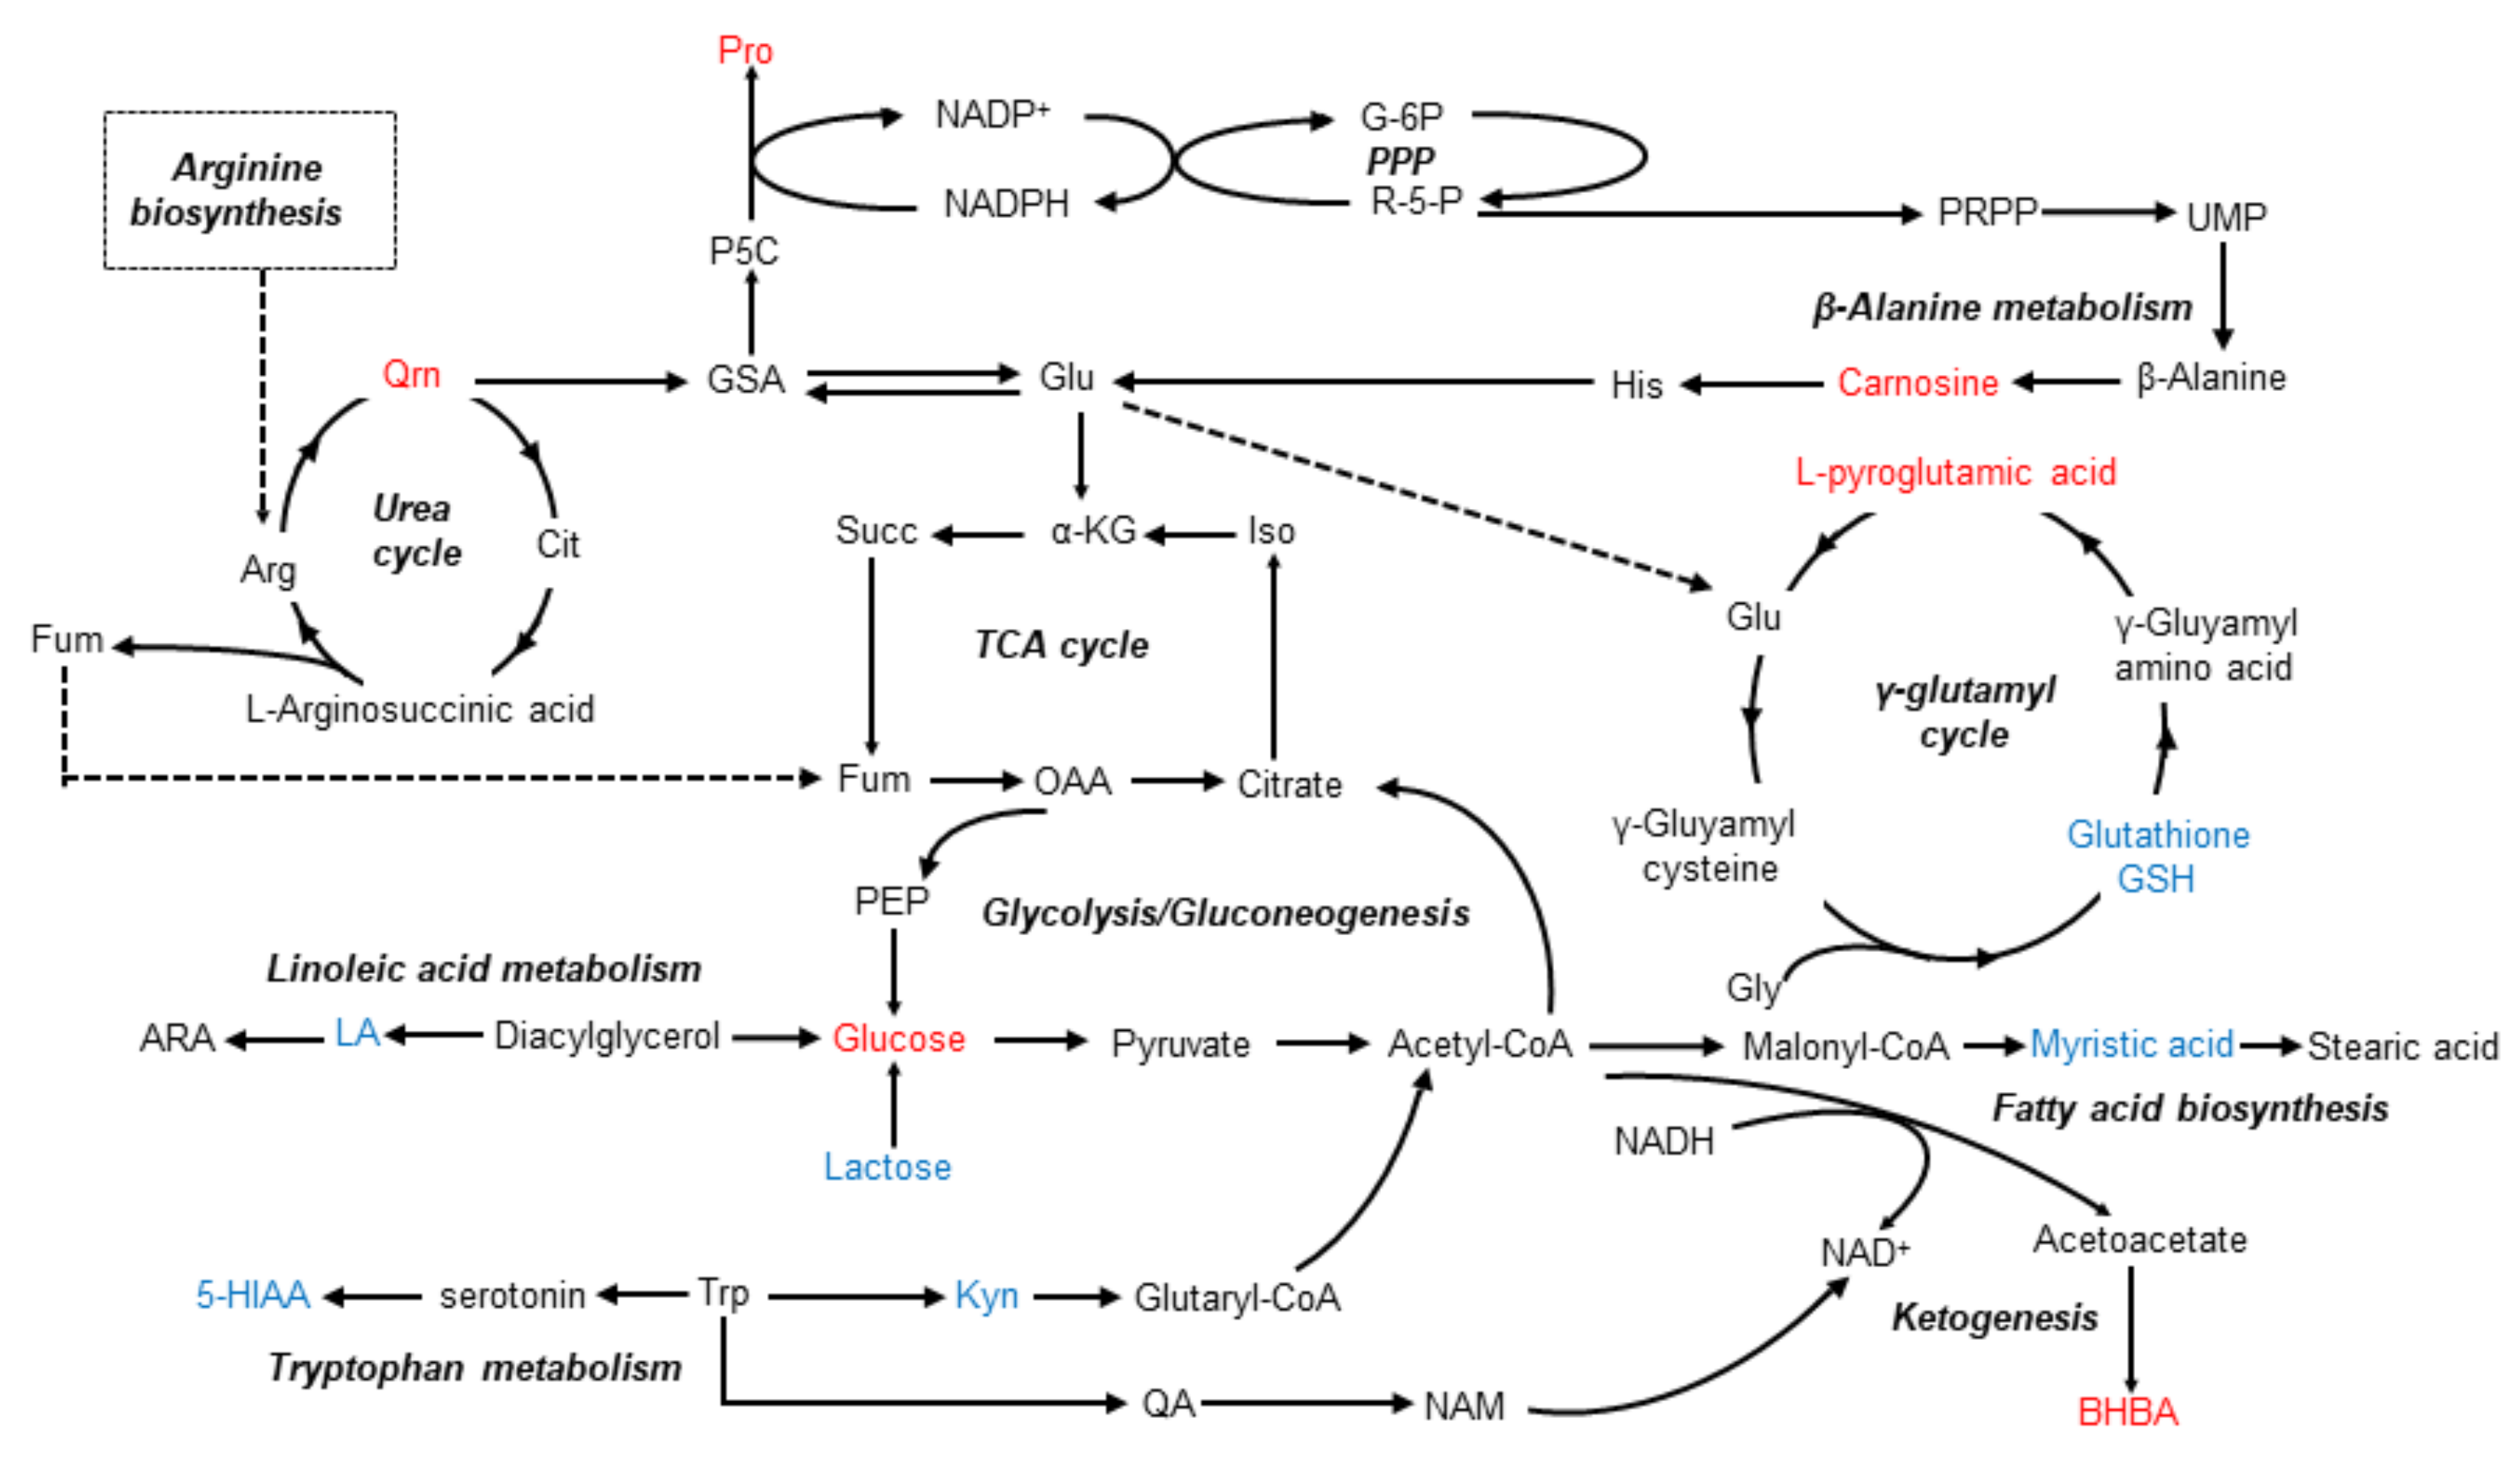
3.4. Metabolic Pathway Analysis

In this study, 27 differential metabolites that were shared by the CON0, CON7 and CON14 groups were enriched based on KEGG metabolic enrichment pathway analysis, which found that these metabolites mainly participated in amino metabolism and carbohydrate metabolism. To further analyze the changes in these pathways, five primary pathways (p < 0.05) were identified, involving aminoacyl-tRNA biosynthesis, D-glutamine and D-glutamate metabolism, valine, leucine and isoleucine biosynthesis, butanoate metabolism, histidine metabolism and pantothenate and CoA biosynthesis (Figure 3a). Following administration with AMR for 14 day, three primary pathways (p < 0.05) were identified and compared with pathways in the CON group (Figure 3b). This involved arginine and proline metabolism, tryptophan metabolism and glutathione metabolism, while linoleic acid metabolism and vitamin B6 metabolism were also enriched (0.1 < p < 0.05). We subsequently queried these differential metabolites in the KEGG pathway database and searched previous articles for data relating to the overall metabolism pathway; the results are shown in Figure 4. According to Figure 4, arginine and proline metabolism, beta-Alanine metabolism, gluconeogenesis and ketogenesis would be enhanced, while tryptophan metabolism, linoleic acid metabolism and fatty acid biosynthesis decreased after supplementation with AMR.

4. Discussion

The preweaning calf rearing is crucial when it comes to rumen development and preparation for weaning. Animals in the neonatal period experience fast-growing, and most of this growth depends on the growth of skeletal muscle. In this period, calves can use dietary amino acids for protein synthesis, while skeletal muscle protein increases faster than other tissue proteins, which results in a significant increase in the proportion of skeletal muscle protein in the body protein pool [17]. It was generally assumed that indispensable amino acids are primarily responsible for muscle protein synthesis of dietary protein [18]. In our study we have enriched the valine, leucine and isoleucine biosynthesis pathways, and these three amino acids belong to branched-chain amino acids (BCAAs). Previous studies found that BCAAs are mainly catabolized in the skeletal muscles and play a vital role in stimulating muscle protein synthesis and promoting muscle growth via activating the mammalian target of rapamycin (mTOR) [19]. L-valine and L-threonine, involved in BCAAs’ biosynthesis, were down-regulated in the present study. In addition, we also enriched aminoacyl-tRNA biosynthesis, which was related to protein synthesis, and indispensable amino acids such as L-methionine, L-valine, L-threonine, L-glutamate and L-histidine (which is considered as an essential amino acid supplement for young animals) that participated in this pathway were also down-regulated. This might be partly due to the fact that free amino acids in the serum were preferentially used to synthesize proteins to respond to the growth needs of calves. On the other hand, amino acids also likely serve as glycogenic precursors participating in glucose production via the gluconeogenesis pathway in the liver to support the animal’s glucose requirements. Additionally, it was found that lactate is mainly metabolized to glucose in preruminating calves [20], which might explain the increase of GLU during the experiment. Acetoacetic acid is an intermediate product of ketogenesis and it was down-regulated in present study. In the liver, acetoacetic acid is generated in the mitochondria with a series of specific enzymes and further producing ketones, such as beta-hydroxybutyric acid (BHBA) [1]. For young ruminants, rumen ketogenesis is the key factor to promote rumen development and maturity. When rumen develops to a certain extent, epithelial cells absorb volatile fatty acids (VFAs) and utilize them to produce energy for the body [20]. Butyric acid and a small amount of acetic acid are transformed into acetoacetic acid in the mitochondria of epithelial cells via the acetyl CoA pathway, and then this is converted to BHBA [21]. The decrease of acetoacetic acid might be related to the lack of its precursor, but it still requires further research. In conclusion, our results suggested that adequate energy should be given to meet the calves’ nutritional requirements.
In this study, superfine powder of AMR supplementation did not affect the serums TP, ALB and GLB. Serums TP and ALB reflect the metabolic status of protein in the body and the synthetic function and damage of the liver to a certain extent, while serum GLB is related to the immune level of the body [22]. Our results perhaps showed there was no bad effect of AMR on the calves’ health.
Additionally, we found the metabolism of calves changed after feeding AMR. Studies have indicated that preweaning calves were vulnerable to various stresses brought by nutrition, the environment and groups before weaning, and faced a situation of being in stress. It was usually associated with inflammation and an imbalance in redox homeostasis when it comes to stress in calves [23,24,25]; our study found AMR might alleviate such a status.
In this experiment, we enriched the arginine and proline metabolism pathway after supplementation with AMR. Proline is the only amino acid in mammals that plays an antioxidant role by combating some intracellular reactive oxygen species (ROS) and protecting antioxidant enzyme activities (such as GSH) [26]. A study found that the ability of proline in plants to protect against oxidative stress appears to rely on its low ionization potential and the secondary amine of the pyrrolidine ring in its molecule [27]. In mammals, researchers also found proline could protect boar sperm against ROS stress through the secondary amine structure of pyrrolidine and proline dehydrogenase-mediated metabolism [28]. In our study, the concentration of both L-proline and D-proline increased in the AMR group. Proline could be converted from ornithine through the sequential activities of aminotransferase (OAT) and pyrroline-5-carboxylate(P5C) reductase (PYCR), and, in the last step of the reaction, PYCR used reduced nicotinamide adenine dinucleotide phosphate (NADPH) as a cofactor to catalyze P5C to produce proline. NADP+ was produced at the same time and it conversely participated in the pentose phosphate pathway (PPP) to produce an amount of NADPH for cellular redox defense [29]. In the present study, the level of L-ornithine increased significantly in the AMR group, indicating that AMR might promote proline biosynthesis via the ornithine pathway, thereby improving the antioxidant ability of the body. L-Pyroglutamic acid (PyroGlu), also called 5-oxoproline, is an endogenous molecule derived from glutamate by the γ-glutamyl cycle. On one hand, the γ-glutamyl cycle serves a function in amino acid transport [30], and on the other hand, it is used to synthesize GSH [31]. GSH is widely present in mammalian tissues and helps to maintain and regulate tissue redox homeostasis [32], thus the decreasing tendency of GSH might mean a reduced antioxidant capacity of the calf during the experiment. A previous study found that the increase in PyroGlu is mainly related to the increase in GSH consumption, but it can also be due to the fact that a deficiency in cysteine or glycine required in the glutamyl cycle leads to the issue of being unable to use the PyroGlu produced by the body to synthesize GSH [33]. In this experiment, the level of serum PyroGlu in the AMR group increased significantly, while serum dipeptide Gly-Arg also increased significantly, which at least showed that the up-regulation of PyroGlu in the AMR group was not caused by the decrease of glycine synthesis in the body. In addition, there were no remarkable changes in the levels of other intermediate metabolites (including cysteine) involved in the γ-glutamyl cycle, but serum 4-pyridoxic acid (PA)’s content showed a remarkable decrease. PA is a metabolite of VitB6, and the synthesis of cysteine from homocysteine by the homocysteine cycle requires the participation of VitB6. In the Vitamin B6 metabolism, PA is formed from pyridoxal (PL) by aldehyde oxidase (AOX) or aldehyde dehydrogenase (ALDH) [34], while the expression of AOX and ALDH increases under oxidative or aldehyde stress [35,36]. Correlation analysis showed that serum PA was significantly negatively correlated with PyroGlu and extremely significantly negatively correlated with Gly-Arg; however, we did not detect significant changes in other metabolites which could reflect the VitB6 level in the body, while the serum GSH concentration of calves in the AMR group slightly decreased, which seems to be conflict with the previous study. Based on the above changes of serum metabolites, we speculated that in the AMR group, calves consumed much more GSH to respond to oxidative stress, which resulted in the increase in the serum PyroGlu. The decreased serum PA might reflect the suppression of the oxidative stress in the AMR group. SOD usually acts as a component of the first-line defense system against ROS. Previous studies found that median serum superoxide dismutase 1(SOD1) and superoxide dismutase 1(SOD2) concentrations were significantly increased in lung cancer patients [37,38], while lung cancer is strongly associated with chronic inflammatory and redox status disturbances [38,39]. Therefore, the decreased tendency of serum SOD activity in the AMR group at 7 day and 14 day might further reflect the alleviation of the oxidative stress status.
Additionally, we also found serum PA was positively associated with L-kynurenine, which was consistent with the previous study by Ulvik et al., who demonstrated that plasma PA showed a positive association with the kynurenine to tryptophan ratio (KTR) in patients with stable angina pectoris [40]. KTR is considered as a useful marker of cellular immune activation [41], and the ratio of it reflects the activation of indoleamine 2,3-dioxygenase (IDO) [42], an enzyme that converts tryptophan to kynurenine. Previous studies found that IDO can be activated by various inflammatory cytokines (especially those mediated Th1 immune responses) and under redox control [43,44]. Hence, the down-regulation of L-kynurenine might further reflect the alleviation of the inflammatory condition in the AMR group. Such a result could also be supported by the down-regulation of linoleic acid (LA). LA is considered as a precursor of arachidonic acid via dehydrogenase catalysis and a major ω-6 polyunsaturated fatty acid, and it plays an important role in inflammation initiation and pro-inflammation [16]. Furthermore, kynurenine can induce the up-regulation of mitochondrial very-long chain acyl-CoA dehydrogenase (VLCADm) in muscle and cause lipid peroxidation [45], thus the decrease of kynurenine is beneficial to the growth of muscle tissue in calves. We also noted 5-Hydroxyindoleacetate (5HIAA) was significantly decreased in the AMR group; 5HIAA is a metabolite of tryptophan via the serotonin pathway [46], and serum 5HIAA usually serves as a biomarker of neuroendocrine tumors [47]. The decrease of 5HIAA further reflected the change of the tryptophan metabolism. In brief, our results provides evidence that AMR could improve the antioxidant and anti-inflammatory capacity of preweaning calves from the perspective of metabolism.
Compared with the control group, a significantly elevated circulating level of BHBA was found in calves administrated with AMR. BHBA is identified as an energy substrate and signal molecule which participates in the growth and development of animals. We speculated the up-regulation of BHBA was related to the enhancement of ketogenesis in ruminal epithelial cells of young ruminants, and the ketogenic activity of ruminal epithelial cells is considered as a biomarker of the maturity of rumen [20]. Our study suggested that the supplementation of AMR might be helpful to promote rumen development in Holstein calves, but this needs profound investigation. One hypothesis is that it can regulate rumen microbiota fermentation to produce more VFAs, and can then stimulate the proliferation of rumen epithelial cells.

5. Conclusions

The metabolism of preweaning calves changed considerably during growth, mainly including the increase of protein synthesis and gluconeogenesis. However, serum GSH showed a decreasing tendency, which might reflect a decreased antioxidant capacity of calves during this period. Untargeted metabolomics analysis found that AMR markedly altered 19 serum metabolites and 5 related metabolic pathways in preweaning calf. Our findings suggest that AMR might enhance the calves’ antioxidant capacity, mainly by up-regulating the levels of D-proline, L-pyroglutamic acid and ornithine and down-regulating the level of 4-pyridoxic acid, and improve their anti-inflammatory capacity mainly by down-regulating the levels of L-kynurenine and linoleic acid, thus improving their ability to cope with changes in the environment and nutritional patterns. Moreover, the up-regulation of BHBA indicated that AMR might be helpful to promote rumen development. Integrative analysis of metabolome and microbiome would be expected to further explore the internal mechanism.

Supplementary Materials

The following supporting information can be downloaded at: https://www.mdpi.com/article/10.3390/agriculture12060744/s1, Figure S1: Total ion chromatograms (TIC) of QC samples; Figure S2: Orthogonal partial least square discriminant analysis (OPLS-DA) of scores and permutation test plots; Figure S3: Venn diagram showing metabolites that differed among CON0, CON7 and CON14 group; Table S1: Differential common metabolites identified of CON0 vs. CON7 and CON7 vs. CON14 in the positive and negative mode; Table S2: Differential metabolites identified of CON14 vs. AMR14 in the positive and negative mode.

Author Contributions

Conceptualization, L.M., Z.L., J.C., Z.D., T.Z., Y.H., X.Y., L.S., S.Y. X.S. and S.C.; methodology, L.M., Z.L., J.C., Z.D., T.Z., Y.H., X.Y., L.S., S.Y., X.S. and S.C.; software, L.M. and Z.L.; validation, X.S. and S.C.; formal analysis, L.M. and Z.L.; investigation, L.M., Z.L. and J.C.; resources, X.S. and S.C.; data curation, X.S. and S.C.; writing—original draft preparation, L.M., Z.L., J.C., Z.D., T.Z., Y.H., X.Y., L.S., S.Y., X.S. and S.C.; writing—review and editing, L.M., Z.L., J.C., Z.D., T.Z., Y.H., X.Y., L.S., S.Y., X.S. and S.C.; visualization, L.M.; supervision, X.S. and S.C.; project administration, X.S. and S.C.; funding acquisition, X.S. and S.C. All authors have read and agreed to the published version of the manuscript.

Funding

This study was funded by the Key R&D Program Supported by the Department of Science and Technology of Gansu Province (No. 20YF8NA029) and the Sichuan Department of Science and Technology Support Project (2019YJ0671).

Institutional Review Board Statement

The animal study protocol was approved by animal care and use committee of Sichuan Agricultural University (project number 2013-028).

Informed Consent Statement

Not applicable.

Data Availability Statement

Not applicable.

Acknowledgments

We thank Shanghai Applied Protein Technology Co., Ltd. (Shanghai, China) for the UHPLC-TOF/MS analysis.

Conflicts of Interest

The authors declare no conflict of interest.

References

  1. Aiello, R.J.; Kenna, T.M.; Herbein, J.H. Hepatic Gluconeogenic and Ketogenic Interrelationships in the Lactating Cow. J. Dairy Sci. 1984, 67, 1707–1715. [Google Scholar] [CrossRef]
  2. Chase, C.; Hurley, D.J.; Reber, A.J. Neonatal immune development in the calf and its impact on vaccine response. Vet. Clin. North Am. Food Anim. Pract. 2008, 24, 87–104. [Google Scholar] [CrossRef] [PubMed]
  3. Diao, Q.-Y.; Zhang, R.; Tu, Y. Current research progresses on calf rearing and nutrition in China. J. Integr. Agric. 2017, 16, 2805–2814. [Google Scholar] [CrossRef]
  4. Cho, Y.I.; Yoon, K.J. An overview of calf diarrhea-Infectious etiology, diagnosis, and intervention. J. Vet. Sci. 2014, 15, 1–17. [Google Scholar] [CrossRef] [Green Version]
  5. Dubrovsky, S.A.; Van Eenennaam, A.L.; Aly, S.S.; Karle, B.M.; Rossitto, P.V.; Overton, M.W.; Lehenbauer, T.W.; Fadel, J.G. Preweaning cost of bovine respiratory disease (BRD) and cost-benefit of implementation of preventative measures in calves on California dairies: The BRD 10K study. J. Dairy Sci. 2020, 103, 1583–1597. [Google Scholar] [CrossRef]
  6. Wang, K.; Zhang, H.; Han, Q.; Lan, J.; Chen, G.; Cao, G.; Yang, C. Effects of astragalus and ginseng polysaccharides on growth performance, immune function and intestinal barrier in weaned piglets challenged with lipopolysaccharide. J. Anim. Physiol. Anim. Nutr. 2020, 104, 1096–1105. [Google Scholar] [CrossRef]
  7. Penati, M.; Sala, G.; Biscarini, F.; Boccardo, A.; Bronzo, V.; Castiglioni, B.; Cremonesi, P.; Moroni, P.; Pravettoni, D.; Addis, M.F. Feeding Pre-weaned Calves with Waste Milk Containing Antibiotic Residues Is Related to a Higher Incidence of Diarrhea and Alterations in the Fecal Microbiota. Front. Vet. Sci. 2021, 8, 650150. [Google Scholar] [CrossRef]
  8. Sheik, A.; Kim, K.; Varaprasad, G.L.; Lee, H.; Kim, S.; Kim, E.; Shin, J.Y.; Oh, S.Y.; Huh, Y.S. The anti-cancerous activity of adaptogenic herb Astragalus membranaceus. Phytomedicine 2021, 91, 153698. [Google Scholar] [CrossRef]
  9. Fu, J.; Wang, Z.; Huang, L.; Zheng, S.; Wang, D.; Chen, S.; Zhang, H.; Yang, S. Review of the Botanical Characteristics, Phytochemistry, and Pharmacology of Astragalus membranaceus (Huangqi). Phytother. Res. 2014, 28, 1275–1283. [Google Scholar] [CrossRef]
  10. Su, H.F.; Shaker, S.; Kuang, Y.; Zhang, M.; Ye, M.; Qiao, X. Phytochemistry and cardiovascular protective effects of Huang-Qi (Astragali Radix). Med. Res. Rev. 2021, 41, 1999–2038. [Google Scholar] [CrossRef]
  11. Lv, H.; Tang, Y.; Zhang, H.; Li, S.; Fan, Z. Astragalus polysaccharide supplementation improves production performance, egg quality, serum biochemical index and gut microbiota in Chongren hens. Anim. Sci. J. 2021, 92, e13550. [Google Scholar] [CrossRef] [PubMed]
  12. Wei, H.; Ding, L.; Wang, X.; Yan, Q.; Jiang, C.; Hu, C.; Wang, G.; Zhou, Y.; Henkin, Z.; Degen, A.A. Astragalus root extract improved average daily gain, immunity, antioxidant status and ruminal microbiota of early weaned yak calves. J. Sci. Food. Agric. 2021, 101, 82–90. [Google Scholar] [CrossRef] [PubMed]
  13. Wang, T.; Sun, Y.; Jin, L.; Xu, Y.; Wang, L.; Ren, T.; Wang, K. Enhancement of non-specific immune response in sea cucumber (Apostichopus japonicus) by Astragalus membranaceus and its polysaccharides. Fish Shellfish Immunol. 2009, 27, 757–762. [Google Scholar] [CrossRef] [PubMed]
  14. Shen, Y.J.; Zhou, J.W.; Wang, B.; Li, J.S.; Shen, L.H.; Yu, S.M.; Cao, S.Z. Effect of Astragalus polysaccharides on the Activity of Antioxidant Enzyme in Lactating Holstein cows. Nat. Prod. Res. Dev. 2014, 26, 244–247. (In Chinese) [Google Scholar] [CrossRef]
  15. Wu, X.; Cao, N.; Zhou, Z.; Beck, P.A.; Wu, H.; Meng, Q. Effect of anti-inflammatory compounds or antibiotic administration on receiving performance and physiological responses of transported heifers. J. Anim. Sci. 2020, 98, skaa036. [Google Scholar] [CrossRef] [PubMed]
  16. Luo, Z.Z.; Shen, L.H.; Jiang, J.; Huang, Y.X.; Bai, L.P.; Yu, S.M.; Yao, X.P.; Ren, Z.H.; Yang, Y.X.; Cao, S.Z. Plasma metabolite changes in dairy cows during parturition identified using untargeted metabolomics. J. Dairy Sci. 2019, 102, 4639–4650. [Google Scholar] [CrossRef] [Green Version]
  17. Davis, T.A.; Fiorotto, M.L. Regulation of muscle growth in neonates. Curr. Opin. Clin. Nutr. Metab. Care 2009, 12, 78–85. [Google Scholar] [CrossRef] [Green Version]
  18. Columbus, D.A.; Fiorotto, M.L.; Davis, T.A. Leucine is a major regulator of muscle protein synthesis in neonates. Amino Acids 2015, 47, 259–270. [Google Scholar] [CrossRef] [Green Version]
  19. Harper, A.E.; Miller, R.H.; Block, K.P. Branched-chain amino acid metabolism. Annu. Rev. Nutr. 1984, 4, 409–454. [Google Scholar] [CrossRef]
  20. Baldwin, R.L.; McLeod, K.R.; Klotz, J.L.; Heitmann, R.N. Rumen Development, Intestinal Growth and Hepatic Metabolism in the Pre- and Postweaning Ruminant. J. Dairy Sci. 2004, 87, E55–E65. [Google Scholar] [CrossRef] [Green Version]
  21. Lane, M.A.; Baldwin, R.; Jesse, B.W. Developmental changes in ketogenic enzyme gene expression during sheep rumen development. J. Anim. Sci. 2002, 80, 1538–1544. [Google Scholar] [CrossRef] [PubMed]
  22. Geng, A.L.; Zhang, Y.; Zhang, J.; Zeng, L.C.; Chang, C.; Wang, H.H.; Yan, Z.X.; Chu, Q.; Liu, H.G. Effects of light regime on the hatching performance, body development and serum biochemical indexes in Beijing You Chicken. Poult. Sci. 2021, 100, 101270. [Google Scholar] [CrossRef] [PubMed]
  23. Abuelo, A.; Hernandez, J.; Benedito, J.L.; Castillo, C. Redox Biology in Transition Periods of Dairy Cattle: Role in the Health of Periparturient and Neonatal Animals. Antioxidants 2019, 8, 20. [Google Scholar] [CrossRef] [PubMed] [Green Version]
  24. Kim, M.H.; Yang, J.Y.; Upadhaya, S.D.; Lee, H.J.; Yun, C.H.; Ha, J.K. The stress of weaning influences serum levels of acute-phase proteins, iron-binding proteins, inflammatory cytokines, cortisol, and leukocyte subsets in Holstein calves. J. Vet. Sci. 2011, 12, 151–157. [Google Scholar] [CrossRef] [PubMed] [Green Version]
  25. Cuervo, W.; Sordillo, L.M.; Abuelo, A. Oxidative Stress Compromises Lymphocyte Function in Neonatal Dairy Calves. Antioxidants 2021, 10, 255. [Google Scholar] [CrossRef]
  26. Krishnan, N.; Dickman, M.B.; Becker, D.F. Proline modulates the intracellular redox environment and protects mammalian cells against oxidative stress. Free Radic. Biol. Med. 2008, 44, 671–681. [Google Scholar] [CrossRef] [Green Version]
  27. Matysik, J.; Alia, A.; Bhalu, B.; Mohanty, P. Molecular mechanism of quenching of reactive oxygen species by proline under stress in plants. Curr. Sci. 2002, 82, 525–532. [Google Scholar] [CrossRef]
  28. Feng, C.W.; Zhu, Z.D.; Bai, W.J.; Li, R.N.; Zheng, Y.; Tian, X.; Wu, D.; Lu, H.Z.; Wang, Y.J.; Zeng, W.X. Proline Protects Boar Sperm against Oxidative Stress through Proline Dehydrogenase-Mediated Metabolism and the Amine Structure of Pyrrolidine. Animals 2020, 10, 1549. [Google Scholar] [CrossRef]
  29. Liu, W.; Phang, J.M. Proline dehydrogenase (oxidase) in cancer. Biofactors 2012, 38, 398–406. [Google Scholar] [CrossRef]
  30. Orlowski, M.; Meister, A. The γ-Glutamyl Cycle: A Possible Transport System for Amino Acids. Proc. Natl. Acad. Sci. USA 1970, 67, 1248–1255. [Google Scholar] [CrossRef] [Green Version]
  31. Inoue, M. Glutathionists in the battlefield of gamma-glutamyl cycle. Arch. Biochem. Biophys. 2016, 595, 61–63. [Google Scholar] [CrossRef] [PubMed]
  32. Sreekumar, P.G.; Ferrington, D.A.; Kannan, R. Glutathione Metabolism and the Novel Role of Mitochondrial GSH in Retinal Degeneration. Antioxidants 2021, 10, 661. [Google Scholar] [CrossRef] [PubMed]
  33. Gamarra, Y.; Santiago, F.C.; Molina-López, J.; Castaño, J.; Herrera-Quintana, L.; Domínguez, Á.; Planells, E. Pyroglutamic acidosis by glutathione regeneration blockage in critical patients with septic shock. Crit. Care 2019, 23, 162. [Google Scholar] [CrossRef] [PubMed] [Green Version]
  34. Ueland, P.M.; McCann, A.; Midttun, Ø.; Ulvik, A. Inflammation, vitamin B6 and related pathways. Mol. Aspects Med. 2017, 53, 10–27. [Google Scholar] [CrossRef] [PubMed]
  35. Maeda, K.; Ohno, T.; Igarashi, S.; Yoshimura, T.; Yamashiro, K.; Sakai, M. Aldehyde oxidase 1 gene is regulated by Nrf2 pathway. Gene 2012, 505, 374–378. [Google Scholar] [CrossRef] [Green Version]
  36. Vasiliou, V.; Nebert, D.W. Analysis and update of the human aldehyde dehydrogenase (ALDH) gene family. Hum. Genom. 2005, 2, 138–143. [Google Scholar] [CrossRef] [Green Version]
  37. Ighodaro, O.M.; Akinloye, O.A. First line defence antioxidants-superoxide dismutase (SOD), catalase (CAT) and glutathione peroxidase (GPX): Their fundamental role in the entire antioxidant defence grid. Alexandria J. Med. 2018, 54, 287–293. [Google Scholar] [CrossRef] [Green Version]
  38. Skorska, K.B.; Placzkowska, S.; Prescha, A.; Porebska, I.; Kosacka, M.; Pawelczyk, K.; Zablocka-Slowinska, K. Serum Total SOD Activity and SOD1/2 Concentrations in Predicting All-Cause Mortality in Lung Cancer Patients. Pharmaceuticals 2021, 14, 1067. [Google Scholar] [CrossRef]
  39. Zabłocka-Słowińska, K.; Płaczkowska, S.; Prescha, A.; Pawełczyk, K.; Porębska, I.; Kosacka, M.; Pawlik-Sobecka, L.; Grajeta, H. Serum and whole blood Zn, Cu and Mn profiles and their relation to redox status in lung cancer patients. J. Trace Elem. Med. Biol. 2018, 45, 78–84. [Google Scholar] [CrossRef]
  40. Ulvik, A.; Midttun, O.; Pedersen, E.R.; Nygard, O.; Ueland, P.M. Association of plasma B-6 vitamers with systemic markers of inflammation before and after pyridoxine treatment in patients with stable angina pectoris. Am. J. Clin. Nutr. 2012, 95, 1072–1078. [Google Scholar] [CrossRef] [Green Version]
  41. Fuchs, D.; Möller, A.A.; Reibnegger, G.; Werner, E.R.; Werner-Felmayer, G.; Dierich, M.P.; Wachter, H. Increased endogenous interferon-gamma and neopterin correlate with increased degradation of tryptophan in human immunodeficiency virus type 1 infection. Immunol. Lett. 1991, 28, 207–211. [Google Scholar] [CrossRef]
  42. Schrocksnadel, K.; Wirleitner, B.; Winkler, C.; Fuchs, D. Monitoring tryptophan metabolism in chronic immune activation. Clin. Chim. Acta. 2006, 364, 82–90. [Google Scholar] [CrossRef] [PubMed]
  43. Mandi, Y.; Vecsei, L.; Vécsei, L.; Vécsei, L. The kynurenine system and immunoregulation. J. Neural Transm. 2011, 119, 197–209. [Google Scholar] [CrossRef] [PubMed]
  44. Yeung, A.W.; Terentis, A.C.; King, N.J.; Thomas, S.R. Role of indoleamine 2,3-dioxygenase in health and disease. Clin. Sci. 2015, 129, 601–672. [Google Scholar] [CrossRef]
  45. Kaiser, H.; Yu, K.; Pandya, C.; Mendhe, B.; Isales, C.M.; McGee-Lawrence, M.E.; Johnson, M.; Fulzele, S.; Hamrick, M.W. Kynurenine, a Tryptophan Metabolite That Increases with Age, Induces Muscle Atrophy and Lipid Peroxidation. Oxid. Med. Cell Longev. 2019, 2019, 1–9. [Google Scholar] [CrossRef] [Green Version]
  46. Comai, S.; Bertazzo, A.; Brughera, M.; Crotti, S. Tryptophan in health and disease. Adv. Clin. Chem. 2020, 95, 165–218. [Google Scholar] [CrossRef]
  47. Becker, A.; Schalin-Jantti, C.; Itkonen, O. Comparison of Serum and Urinary 5-Hydroxyindoleacetic Acid as Biomarker for Neuroendocrine Neoplasms. J. Endocr. Soc. 2021, 5, bvab106. [Google Scholar] [CrossRef]
Figure 1. The concentration of TP, ALB, GLB, GLU, GSH and SOD in CON and AMR group at different time points.
Agriculture 12 00744 g001
Figure 2. (a) Heatmap visualization of the 27 metabolites that differed between the CON7 versus CON0 groups and CON14 versus CON7 groups. (b) Fold change analysis of 19 metabolites that differed between the CON14 and AMR14 group. The X axis represents the log2 function of FC, and Y axis represents differential metabolites. log2(FC) > 0 indicates the level of metabolite in AMR group was higher than that in CON group, log2(FC) < 0 indicates the level of metabolite in AMR group was lower than that in CON group. (c) Heatmap of correlation analysis for group CON versus AMR. The red indicates positive correlation and blue indicates negative correlation. * p < 0.05; ** p < 0.01.
Agriculture 12 00744 g002
Figure 3. (a) The KEGG enrichment analysis of 27 common differential metabolites in the control group. (b) The KEGG enrichment analysis of 19 differential metabolites between CON14 group and AMR14 group. Bubble size indicates the number of metabolites in the pathway; bubble color indicates the p-value—the darker the color (red), the smaller the p-value; the lighter the color (yellow), the higher the p-value.
Agriculture 12 00744 g003
Figure 4. Metabolic pathway for differential metabolites. The red font indicates higher concentrations after administrating with AMR for 14 day. The blue font indicates lower concentrations than those in CON14 group. Orn = ornithine; Cit = citrulline; Arg =arginine; Pro = proline; P5C = pyrroline-5-carboxylate; GAS = glutamic-gamma-semialdehyde; NADPH = reduced nicotinamide adenine dinucleotide phosphate; NADP+ = nicotinamide adenine dinucleotide phosphate; NADH = reduced nicotinamide adenine dinucleotide; NAD+ = nicotinamide adenine dinucleotide; G-6P = glucose 6- phosphate; R-5-P = ribulose 5-phosphate; PPP = pentose phosphate pathway; PRPP = 5-phosphoribosyl 1-pyrophosphate; UMP = uridine monophosphate; His = histidine; Glu = glutamate; Iso = isocitrate; α-KG = α-ketoglutaric acid; Succ = succinate; Fum = fumarate; OAA = oxaloacetate; TCA = tricarboxylic acid; Gly = glycine; PEP = Phosphoenolpyruvate; LA = = linoleic acid; ARA = arachidonic acid; Kyn = kynurenine; Trp = tryptophan; 5-HIAA = 5-Hydroxyindoleacetate; QA = quinolinic acid; NAM = nicotinamide mononucleotide; BHBA = beta-hydroxybutyric acid.
Agriculture 12 00744 g004
Publisher’s Note: MDPI stays neutral with regard to jurisdictional claims in published maps and institutional affiliations.

