Abstract
In the field of computer vision, 3D reconstruction of crops plays a crucially important role in agriculture. On-ground assessment of geometrical features of vineyards is of vital importance to generate valuable information that enables producers to take the optimum actions in terms of agricultural management. A training system of vines (Vitis vinifera L.), which involves pruning and a trellis system, results in a particular vine architecture, which is vital throughout the phenological stages. Pruning is required to maintain the vine’s health and to keep its productivity under control. The creation of 3D models of vineshoots is of crucial importance for management planning. Volume and structural information can improve pruning systems, which can increase crop yield and improve crop management. In this experiment, an RGB-D camera system, namely Kinect v2, was used to reconstruct 3D vine models, which were used to determine shoot volume on eight differentiated vineyard training systems: Lyre, GDC (Geneva Double Curtain), Y-Trellis, Pergola, Single Curtain, Smart Dyson, VSP (Vertical Shoot Positioned), and the head-trained Gobelet. The results were compared with dry biomass ground truth-values. Dense point clouds had a substantial impact on the connection between the actual biomass measurements in four of the training systems (Pergola, Curtain, Smart Dyson and VSP). For the comparison of actual dry biomass and RGB-D volume and its associated 3D points, strong linear fits were obtained. Significant coefficients of determination (R2 = 0.72 to R2 = 0.88) were observed according to the number of points connected to each training system separately, and the results revealed good correlations with actual biomass and volume values. When comparing RGB-D volume to weight, Pearson’s correlation coefficient increased to 0.92. The results reveal that the RGB-D approach is also suitable for shoot reconstruction. The research proved how an inexpensive optical sensor can be employed for rapid and reproducible 3D reconstruction of vine vegetation that can improve cultural practices such as pruning, canopy management and harvest.
1. Introduction
The European Union (EU) accounts for 45% of global wine-growing areas totaling more than three million cultivated hectares [1]. Hence, the importance of the wine industry, which represents a sizable portion of EU agriculture [2]. The worldwide enormous economic, social, and environmental importance of viticulture and wine industries [3,4,5] drives the development and deployment of novel technology targeted at vineyard monitoring in order to improve grape and wine quality [6,7]. Furthermore, increased mechanization and automation of vineyard and winery tasks are required due to labor shortages [8], soaring wage costs [9] and a tendency towards larger wineries [10]. Thus, the trellis system should be adapted to the particular conditions required for every agronomical management. A trellis system supports and accommodates the vines, allowing for a variety of training systems designed to maximize productivity and fruit quality. Trellis systems are often characterized according to their ability to handle shoot development. The optimal training strategy for a vineyard is determined largely by growth habit and the requirement for optimal fruit exposure as it is influenced by vine vigor and winter hardiness. Training a grapevine includes reshaping the vine. Adopting an appropriate training system for a vineyard is a critical decision that will affect future production and profitability. The research on training systems is interdisciplinary. A full system evaluation includes the understanding of grape photosynthesis, sugar and acid metabolism, and micrometeorology. This explains why training systems differ greatly worldwide [11], and thus the necessity of gaining a better insight, particularly in the light of climate change [10,12]. This represents the short-term effects on wine quality and style, as well as long-term issues including varietal appropriateness and the economic viability of traditional wine production areas [12,13]. Monitoring training systems is vital for properly assessing local biomass, especially in vineyards, where knowledge of variability may be used to assess the health of the vines and grapes.
Wood volume assessment is a key statistic in vineyards for assessing biomass output, as well as carbon storage and cycle. Transient biomass (canes/shoots and fruit) is increasingly being recorded as pruning mass and crop yield per surface area [14]. Weighing the winter cane pruning during the dormancy period of a vine for one growing season is one approach to measure vine vigor [15]. The counting and weighing of one-year-old wood (shoot/canes) at pruning is the most useful method of determining vine balance in viticulture, and it is widely employed by grape producers for management purposes [16,17]. Moreover, it is also used as an input for variable management approaches or medium and long-term efficiency forecasts. Indeed, understanding biomass variability can be helpful not only for estimating the plant local health status, but also as a key input to variable rate management [18,19]. Furthermore, the optimal balance between vegetative growth in terms of shoot and leaf growth and grape production is the key to improving grape yield and quality. The vine’s production capacity, considering vine vigor, crop load, and crop level, determines vine balance and optimal vine performance. In terms of vine vigor and crop load, there are three different ratios: yield/shoot weight, yield/leaf surface, and shoot weight/leaf surface, the goal of which is to quantify vine vigor. However, there is within vineyard variability. Thus, even though vines are of the same age, clone, and even management, spatial variance in vine vigor can occur [15]. Moreover, grapevines with extreme vegetative vigor are more likely to produce less fruit of worse quality, whereas vines with insufficient vigor may have their yield potential hindered. In this regard, pruning and trellis design are arguably the most popular ways of controlling shoot vigor in vines [20].
The assessment of vine biomass is a complex and difficult task. Due to the intricacy of woody crops, geometric characteristics are often measured manually, therefore commercial applications have been restricted to a few simple metrics i.e., height and width [19]. Manual measurements are also labor-intensive and time-consuming, so measuring plant structure for management purposes is not economically viable. The continuous robotic and automation research employing sensors, imaging and non-imaging technologies has given a wide range of plant characterization applications. Using non-invasive technology to accurately measure plant attributes means that physiological parameters can be assessed in a non-destructive manner [21]. Consequently, repeated and consistent measurements can be taken to design a more robust statistical analysis and modeling. Numerous studies have been undertaken in recent years to enable the three-dimensional reconstruction of plants, while also benefiting from the ongoing downsizing of sensors and the acceleration of data processing [22]. Optical sensors are the most promising options currently available on the market for obtaining data for the reconstruction of three-dimensional representations of a scene and can be used, to digitize the 3D components of crops. RGB cameras have been extensively employed to plant geometric characterization by estimating LAI [23], lateral growth as a measure of canopy expansion [24], canopy volume [25] and aboveground biomass for fertilization dosage [26]. Unlike the RGB methodology for extracting plant biophysical parameters, time-of-flight distance sensors can directly acquire the third dimension by employing different techniques in order to improve the accuracy of 3D models [27]. Light detection and ranging (LiDAR) have been explored in a myriad of possibilities. In terms of ground-based research, these range from the ability to differentiate pests [28], obtaining vineyard productivity maps [29], estimating vine biomass [30,31], leaf area [32], tree row volume [33] and parameters such as canopy porosity and crown surface [34]. Among these imaging techniques, RGB-D sensors—also called range imaging cameras, can function on three main operating principles: structured light (SL), time-of-flight (ToF), and active infrared stereoscopy (AIRS) i.e., with the support of unstructured light illumination to gather information even on low-textured surfaces [35]. SL and AIRS are both based on the same triangulation principle, while ToF provides a direct measurement. In outdoor applications, ToF, though affected, has good enough performance even under strong illumination conditions to estimate depth [36], while AIRS is also sensitive to high lighting environments or even unable as SL sensors [37]. Intel has recently launched the Realsense series, resuming the R200 family through D400 series [38], based on AIRS superseding the Kinect generation in terms of popularity [39]. Nevertheless, these cameras have not yet been generally adopted in agriculture. The research has been limited to certain applications [40]: in detecting apples [41] and in vineyards [42], these cameras are suited to fruit localization tasks [35,43], particularly for object size estimation in close-range outdoor applications [44]. For example, Milella et al. [42], studying grapevine phenotyping through deep learning, installed a R200 as an AIRS depth camera on an agricultural vehicle to detect and count the grapevine bunches and measure canopy volume. It is worth noting that the depth camera election must be based on the application, in balance, especially in terms of the lighting conditions and the distance at which the camera will be used.
Similar in scope and cost [42], though less expensive, the ToF Kinect v2 was never intended for field operations by the manufacturer. Although being discontinued in 2015, the high number of devices in circulation allows for continuous usage in precision agriculture. The inexpensive Microsoft Kinect v2 sensor, due to its robustness and higher performance, particularly when compared to SL Kinect v1, has gained prominence in recent years as an amenable device to generate 3D reconstructions. The cost is lower than that of LiDAR systems, and the extra information supplied by the low-cost Kinect v2 makes it a viable alternative to expensive laser-based sensors [45]. Additionally, it has a better resolution and is capable of processing a greater volume of data while maintaining a broader field of vision [46]. Moreover, 3D-point clouds obtained via LiDAR are intrinsically dependent on the GPS systems that are employed in order to geo-position the sensor within the crop. Therefore, the receiver inaccuracy is transferred (i.e., the associated error) to the LiDAR scans and, consequently, to plant characteristics [47]. In contrast, the use of Kinect v2 sensors avoids using this technology when measuring small areas [48], thus lowering the research budget and easing postprocessing calculations. These features indicate why the Kinect v2 has proven to be so popular as a low-cost alternative to LiDAR systems for 3D crop characterization [49], being employed in vineyards to estimate above-ground biomass [26,48] and dormant pruning weight [16].
Thus, geometric characteristics and plant structure in assessing vineshoot biomass through wood volume calculation, may be assessed on the complete agricultural field utilizing contactless and non-destructive optical technologies. Using more precise crop sensing and reconstruction methodologies would allow information to be extracted from 3D models, thereby improving decision-making. Estimating yearly transient vineshoot volume as a surrogate of biomass and geometrical structure can improve training systems and thereby pruning systems and trellis constructions, improving crop output and management. In addition, the producer can benefit from comprehending within-vineyard variability according to each training system by concentrating on attaining balanced vegetative growth and reproductive development for each vine within a vineyard. Using 3D characterization with contactless sensing techniques could be beneficial for monitoring vineshoot volume in a non-destructive and unbiased manner. Furthermore, due to the fact that dormant pruning must be performed during the winter months, it requires arduous labor in frequently harsh weather conditions. Therefore, the aim of this study is to assess the performance and suitability of the Kinect v2 in terms of geometric characterization. The system was tested on different grapevine training systems through the calculation of vineshoot volume, i.e., estimating dormant pruning weight.
2. Materials and Methods
2.1. Site Location
All experiments were performed in a 1 ha vineyard field located at the Madrid region (Spain 40°8′ N, 3°22′ W; altitude 750 m a.s.l.) and managed by IMIDRA. The variety was Cabernet Sauvignon (Vitis vinifera L.) in every training system. Field measurements were made in January 2020 during the phenological period of dormancy and vines were completely defoliated. The vineyard belonging to the geographical indication of Vinos de Madrid was planted in 1999 with an inter and intra row distance of 2.5 m × 1.2 m and the vine rows were oriented from north-to-south. The annual precipitation ranges from 350 to 600 mm. The site is characterized by an average annual temperature of 14 °C, being within the optimum for the cultivation of the vine (11–18 °C). The soil is deep enough that vine roots can develop conveniently, and it also has an appropriate water absorption capacity due to its loamy-clayey composition. The field was divided into the most common training systems in Spain. As a result of the various training systems, which include pruning and trellis systems, a wide variety of vine architectures is presented. Plantation geometry is also a key component of vine architecture since the space between vines and rows indicates the density of plantation. The percentage of leaf area that can be exposed to the light on a constant basis is a critical factor in selecting a training system. These techniques are primarily targeted at disposing perennial wood and canes in such a way that the exposed leaf area is maximized for light interception, resulting in increased production potential, better quality, and enhanced disease management and optimized leaf area to fruit ratio.
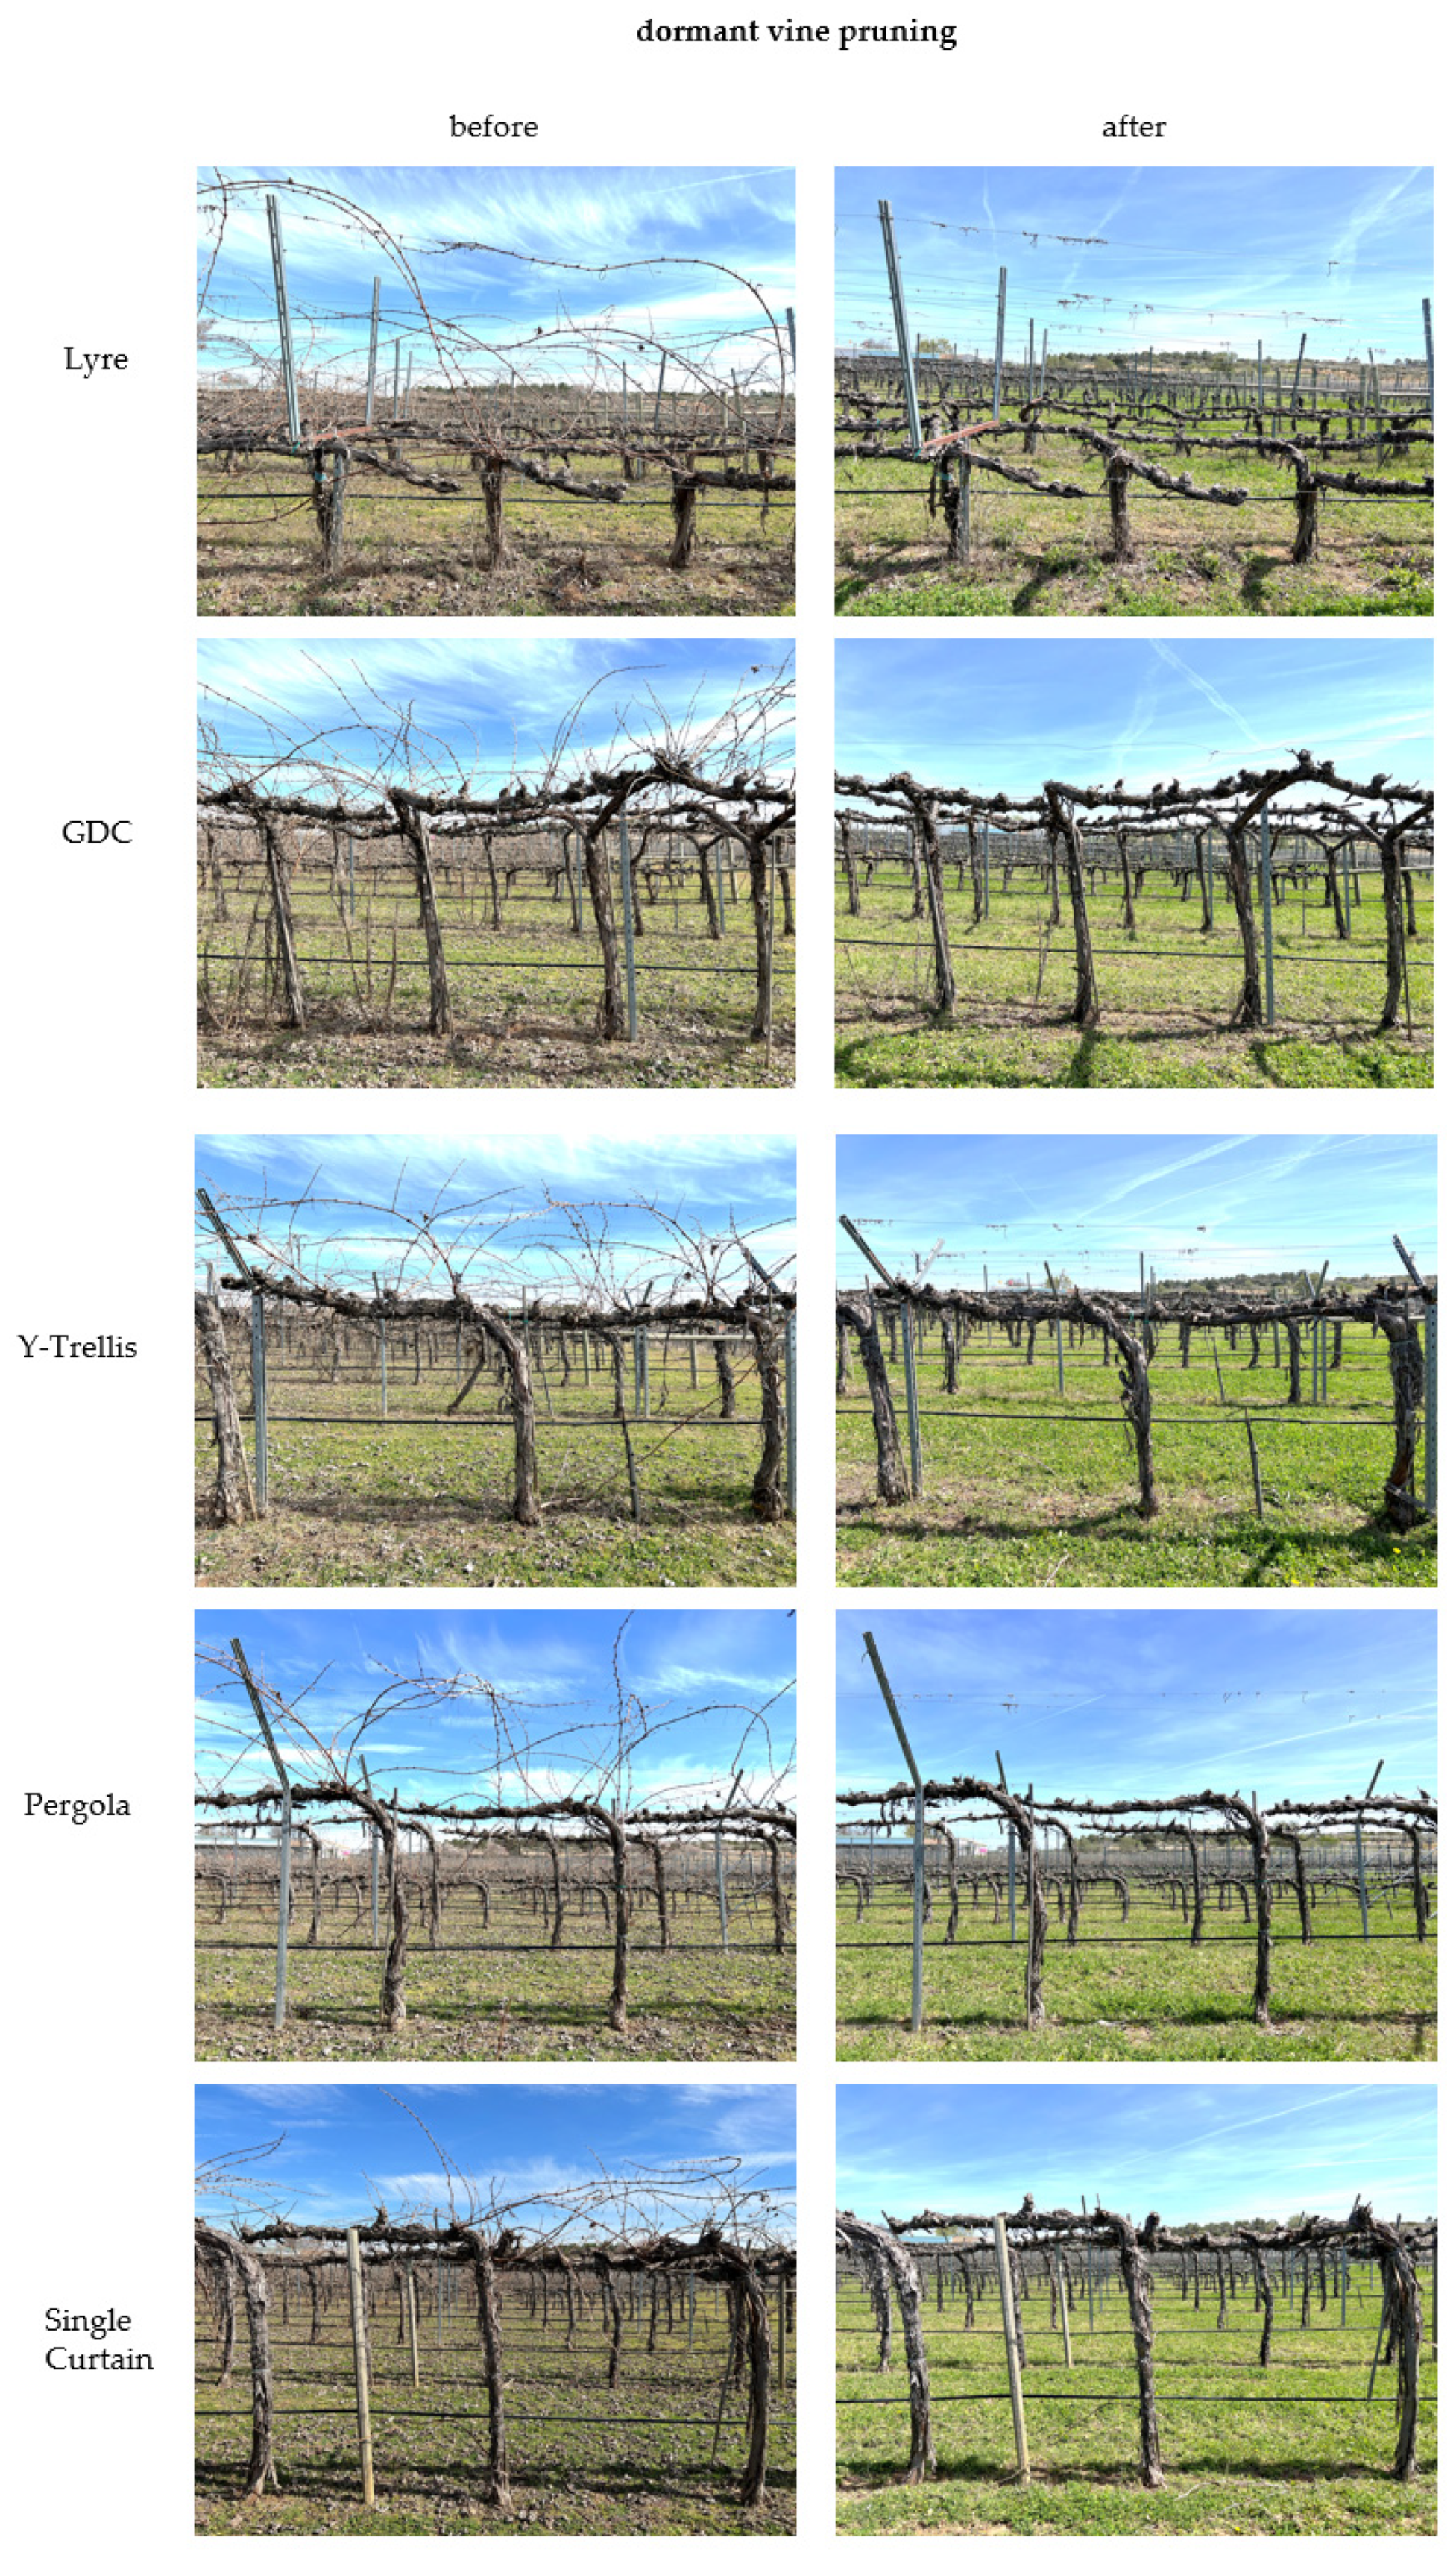
In this manner, the field was assessed according to eight training systems. Seven of them are trellised and one is head-trained: Pergola, Curtain, Smart Dyson, Lyre, Geneva Double Curtain abbreviated to GDC, T-Trellis, Vertical Shoot Positioned (VSP) and Gobelet (Figure 1). The vine spacing within and between rows was different according to each training system (Table 1). The trellis configuration is inherent to the training system, with the one head-trained, i.e., Gobelet, featuring a simpler vessel training with the help of wooden posts. Conversely, the trellised systems need the installation of metal structures, wires and posts. The eight training systems were measured separately. Each training system grew in separated areas formed by three rows. The sampling was conducted in the central row. The samples were taken in 11-vine consecutive batches, i.e., replicates. The 11 vine batches were used for 3D reconstruction, and its comparison with ground truth. Ground truth was based in the dry biomass of the pruned branches. In total, 88 vines were shoot pruned and analyzed separately. The research areas were pruned towards the end of February. Over the previous seasons, vines were pruned in the same manner and no differential treatments were applied. The branches of every training system were collected together. The pruned branches were immediately sent to the laboratory for dry biomass assessment. Dry branches were physically weighed both within the vineyard and following the drying operation. Grapevine shoots corresponding to each training system were individually dried during 48 h at +80 °C. After the samples had dried, they were weighed to determine the weight of the pruned branches of every training system. Then, the dry biomass values that were collected were utilized to be contrasted with the volume values that were obtained from the three-dimensional model of the different training systems.

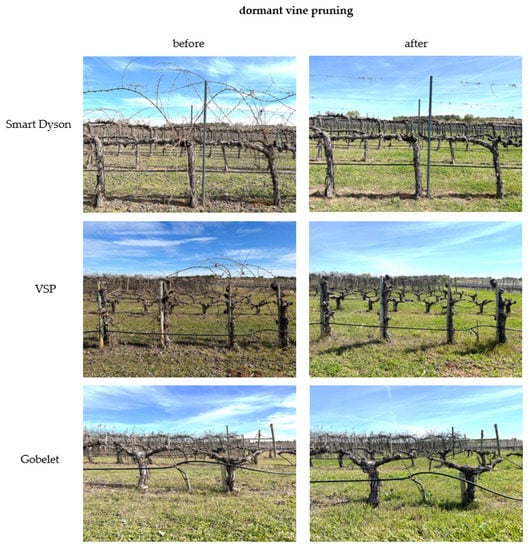
Figure 1.
Training systems depicting before and after dormant vine pruning operations. Training systems divided into horizontally divided canopy (Lyre, GDC and Y-Trellis), vertical canopy (Pergola, Single Curtain, Smart Dyson and VSP) and head-trained (Gobelet).

Table 1.
Basic geometric characteristics of the different training systems. Height is measured from the bottom of the trunk to where cordons spread laterally or are pruned.
2.2. Sampling System
A data collection system was set up using a Kinect v2 as an RGB-D sensor-based system. The Kinect v2 employs an approach known as continuous wave (CW) intensity modulation, which is most prevalently adopted in ToF cameras. Light from an amplitude modulated light source is backscattered by objects within the camera FoV, and the phase delay of the amplitude envelope is measured between the emitted and reflected light in a CW [50]. For each pixel in the imaging array, the phase difference is converted into a distance measurement. Notwithstanding that the Kinect for Windows v2 sensor uses a different technology than the Kinect v1, it can still acquire depth, color and infrared information. The RGB camera records color data at a resolution of 1920 × 1080 pixels, whereas the IR camera captures depth maps and also IR data in real time at a resolution of 512 × 424 pixels. The entire acquisition process can be completed at a framerate of up to 30 Hz. The depth sensing field of vision opens 70 degrees horizontally and 60 degrees vertically, offering a working range from 0.5 m to 4.5 m. Even though the previous Kinect was not adapted for daylight outdoor acquisitions, Kinect v2 is still less affected under the influence of the very bright conditions providing that the sensor’s lenses are not directly exposed to sunrays [50,51]. The sensor operating range meets the vineyard row inspection criteria, whilst non-interesting objects, such as those that are extremely close and those in remote places that normally encompass adjacent vineyard rows, are disregarded. The sensor was attached sideways to an on-ground electric platform allowing data acquisition (Figure 2). An on-board computer (Intel Core i7-4771@3.5GHz processor, Santa Clara, (CA) USA, 16 GB RAM, NVIDIA GeForce GTX 660 graphic card) was used to connect the Kinect v2 sensor.
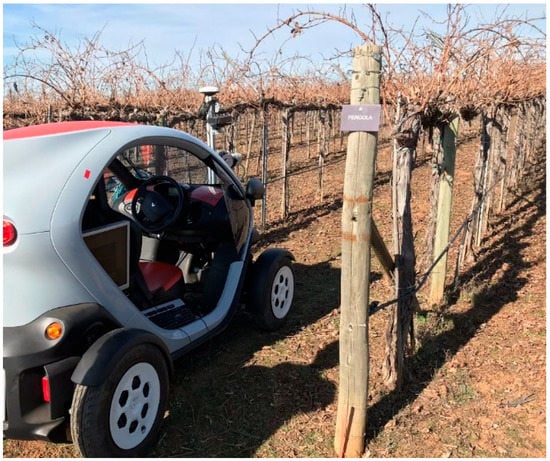
Figure 2.
Kinect v2 as an RGB-D camera attached to an on-board mobile platform acquiring depth information along the vine rows according to the different training systems.
The vehicle followed a straight path, parallel to the vine row and through the inter-row space. In front of the platform an extruded aluminum profile held the sensor in a height adjustable manner. This platform is based on the Twizy Urban model (Renault, Boulogne-Billancourt, France), a compact commercial electric car with extremely compact dimensions suited for sampling most crops and adjusted to vineyard plantations. Due to the fact that data resolution is substantially affected by the speed of the mobile platform, the electric motor results in negligible vibrations since it supports very low speeds, below 3 km/h, which is a vital aspect in acquiring high-quality data.
2.3. 3D Modelling Process
The algorithm developed by [52] was used to process the acquired RGB-D data from the Kinect v2 in order to obtain the 3D reconstruction of the vineshoots according to eight different grapevine training systems. This approach achieves satisfactory results when reconstructing large zones using the information provided by the Kinect sensor. The approach further develops the algorithm proposed by [53] in order to model large areas by fusing multiple overlapping depth pictures, saving information solely on the voxels nearest to the identified item, and retrieving the stored information through a hash table. This eliminates the need for a whole regular voxel grid to be kept in memory, resulting in significant computational savings. By virtue of its simplicity, the ray-casting method [54] is used to find the voxels in the 3D model that are intersected by each ray from the camera sensor, since its position is known. Thus, the depth voxels are determined. The information collected from the ray-casting approach is used to compute the camera’s position and orientation (six degrees of freedom) per each scene surface obtained. The ultimate estimation is carried out using a variation of the iterative closest point (ICP) algorithm [55], which outputs a point cloud. This approach generated 3D models of sampled vineyard plots using a desktop computer (Intel Core i7-6900K@3.2 GHz processor, 64 GB of RAM, NVIDIA GeForce GTX Titan X graphics card). Once the volumes were computed, the next step was to filter the point cloud to remove the unsought points. The output data can be visualized in the form of a 3D point cloud using Cloud Compare (CloudCompare 2.9.1 GNU License, Paris, France) to manually delete the training structures, i.e., trellis systems and wooden posts and the fixed physical references that marked the starting and ending points of the vineyard rows. The step consisted in automatically filtering isolated points. If the average distance between a point and its 64 nearest neighbors is more than the standard deviation of the distance between all points, the point is termed as an outlier. The 3D model reconstruction was simplified as a result of this computation procedure, and plant volume could be determined for every sampled plot using these models.
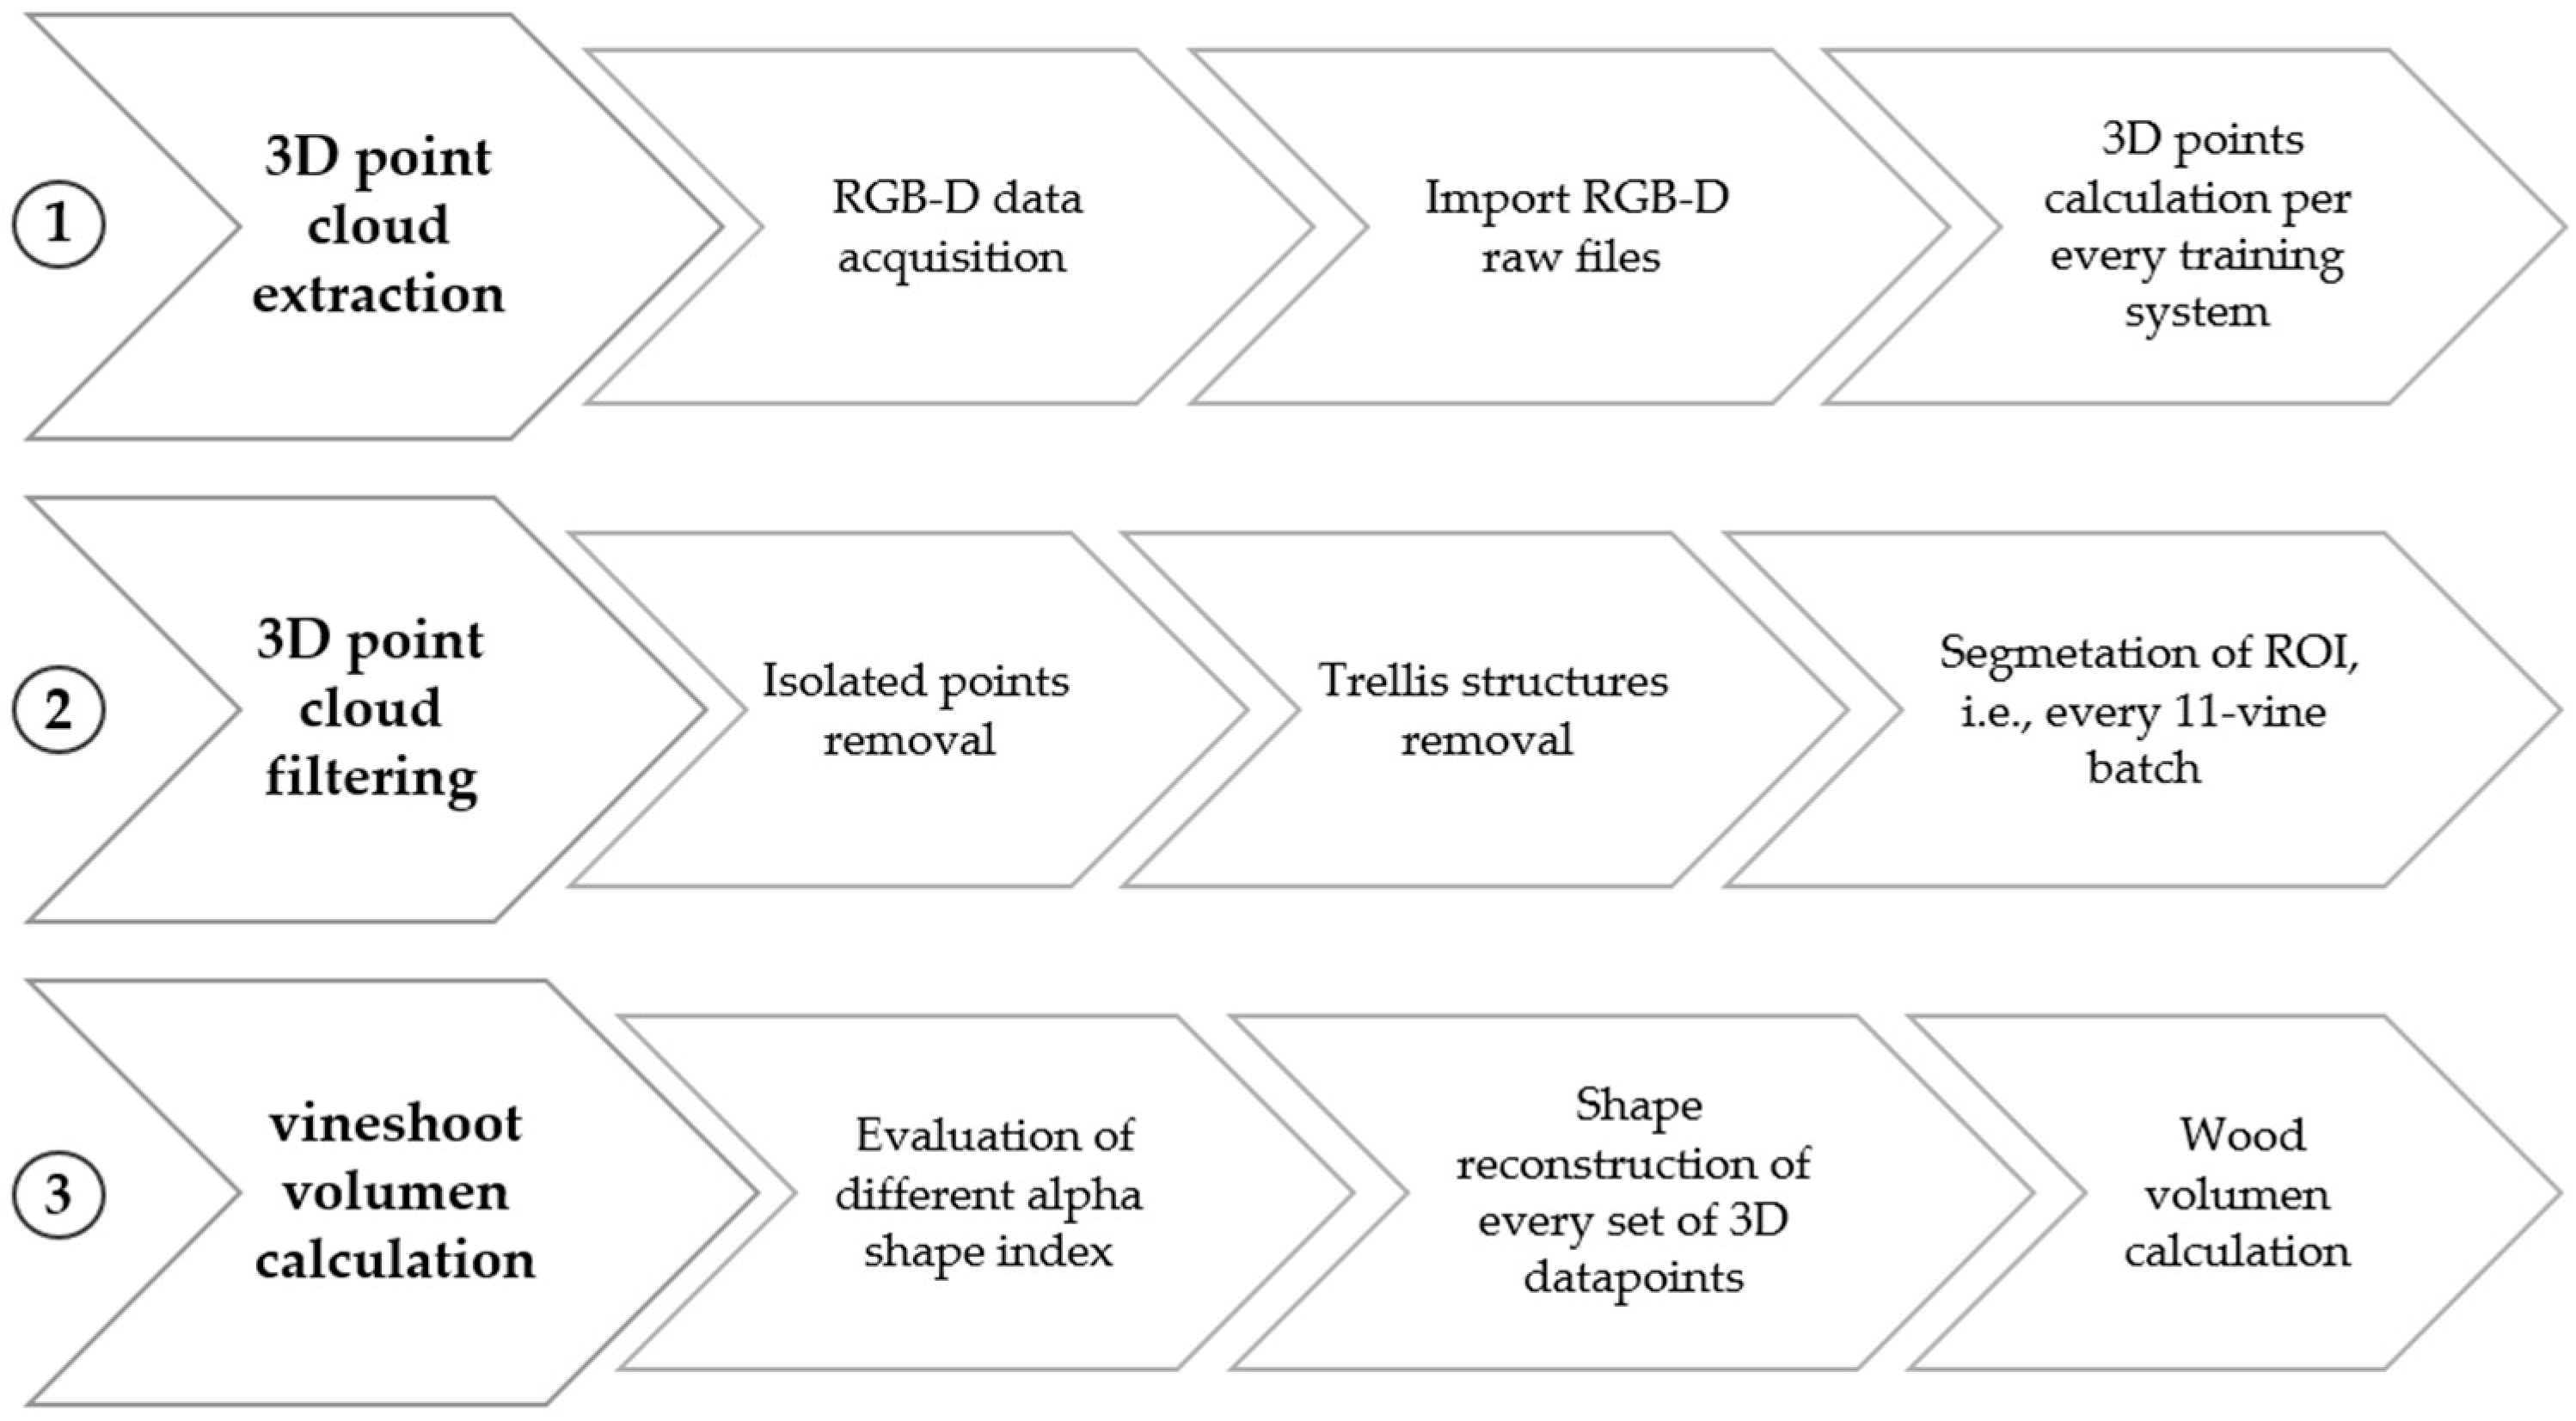
In order to calculate the volume enclosed by the vineshoots from the different pruning systems, the alpha shape [56] algorithm was utilized to wrap the set of the corresponding 3D points due to its accurate performance [16,57,58]. The alpha-shape indicates how tightly the body fits the points and represents the contour that envelopes a set of 3D points [16,48,58]. The fitness level is determined by the index. The tighter the surface to encapsulate a group of 3D points, the closer the shape matches the points as the value decreases. The goal of this research was to obtain a solid, free of voids, while enclosing the smallest volume. The determination of an optimum value for α is absolutely critical for volume calculation. Variations in alpha-shape were also evaluated using index values of 0.1, 0.3, 0.5, 0.7 and 0.9 to calculate the most proper shape of the vineshoot. To address this calculation, the R package alphashape3d [59] was employed to compute volumes according to a specific α index. Higher values resulted in looser shapes, whereas lower values led to tighter shapes. The vineshoot volume was automatically retrieved by the algorithm. The entire 3D modeling process can be seen in Figure 3.

Figure 3.
Process flow diagram indicating the 3D modelling process.
2.4. Statistical Analysis
Actual field measurements of plant dry biomass, i.e., ground truth, were compared with the RGB-D-based 3D models according to each vine training system. Therefore, the dataset was processed statistically to assess the capabilities of the system for crop characterization in terms of geometric reliability, i.e., vineshoot 3D modeling. Least squares regression analyses were used to assess the prospective capabilities of the system for quantifying the dry biomass derived from the pruned shoots. Therefore, on all the training systems, simple linear regressions were used to determine the Pearson’s correlation coefficients, as well as their related standard errors in the assessment of best fit. ANOVA was used to test the effect of the number of 3D points and volumes measured with the Kinect v2 on ground truth values, i.e., to establish a relationship between the RGB-D information and the actual volume and dry biomass parameters. A series of F-tests at significant alpha level of 0.05 were run to eliminate non-significant factors on the regression parameters. Furthermore, this approach was used to produce an estimated 95 percent confidence interval (CI), which allowed for a more direct assessment of the different training systems and regression coefficients. Influential observations exerting an undue effect on the regression models were filtered according to standardized Difference in Fits (DFFITS) criterion used as a cutoff. In contrast, leverage outliers applying a strong influence were not flagged in accordance with the Mahalanobis index. Analyses were performed on SPSS v28 (IBM SPSS Statistics).
3. Results and Discussion
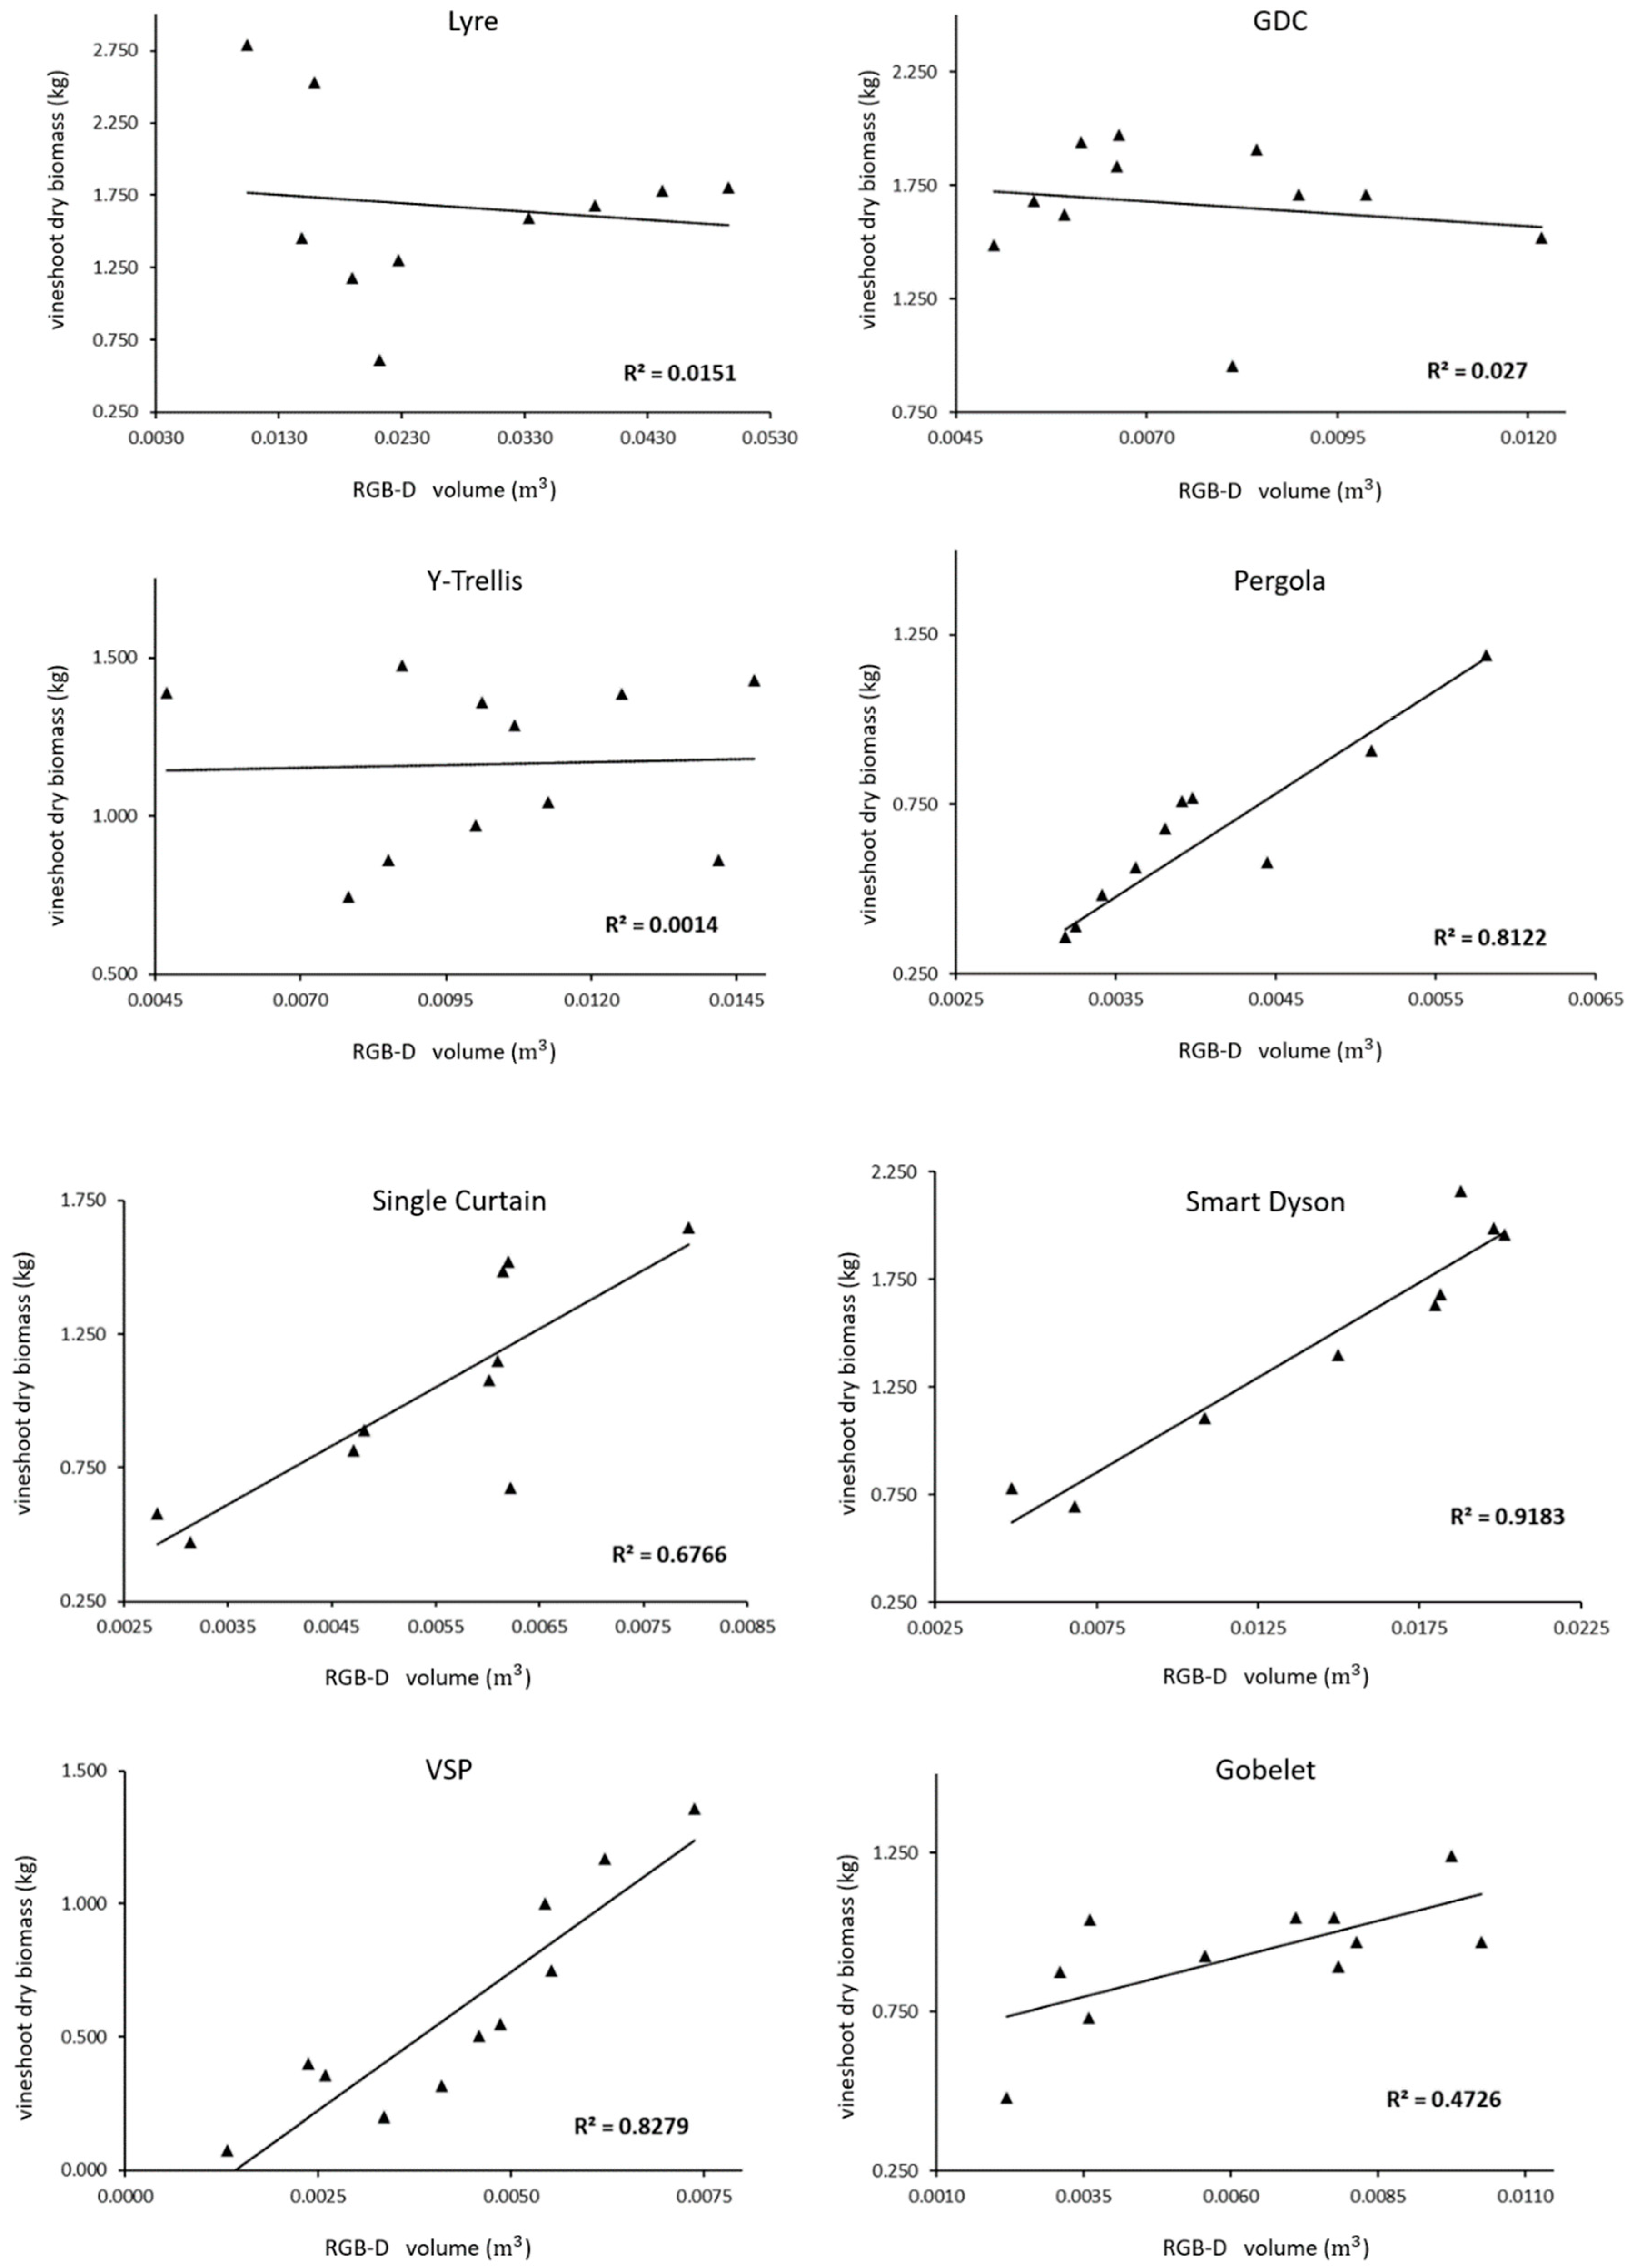
Three-dimensional modelling is of high value since the architecture of vines varies within the same training system and significantly from one form of training to another. The use of a digital system for geometric reconstruction is of vital importance for further decision-making processes. The evaluation of several training systems was evaluated with differential results. Despite these geometrical intricacies, the RGB-D-based statistics and dry biomass measurements were in most cases significant. Therefore, geometrical complexity constitutes a great hindrance to accurate measurements. However, despite these geometrical intricacies, the RGB-D-based statistics and dry biomass measurements were in most cases significant at p < 0.05, so regression models showed a good fit (Table 2). Thus, the increasing number of 3D points, associated with their respective point clouds and higher volume values, corresponding to the increasing biomass values, i.e., ground truth. Regarding volume calculation, multiple evaluations were carried out with various values of α index, revealing that the alpha-shape formed with 0.1 was the most accurate representation of the vineshoots’ true contour. The training systems had a varying effect on the relationship between the investigated parameters, mainly distinguishing between horizontally divided canopy, non-horizontally divided canopy (vertical canopy) and the head-pruned vines that form a kind of goblet shape as a special form of training. Gobelet is planted with no trellis wires, just one supportive stake per vine, producing a trunk crowned by vineshoots. Therefore, the measured vineshoot dry biomass versus the calculated volumes and 3D points linked to each volume were explained by linear models stating noticeable differences in slope and intercepts with regard to each training system (Table 2). In accordance with the regression models between Kinect v2 volume, RGB-D volume onwards, and vineshoot dry biomass, linear relationships revealed significant but also inconsistent correlations. When data were analyzed according to each training system, it was observed that while some linear models showed very strong correlations (R2 > 0.90) others corresponded worse with the RGB-D measurements, i.e., vineshoot volume, and dry biomass values (R2 < 0.50 and even close to 0.001).
Table 2.
Basic statistics of the intercepts and estimates of the linear regression analysis by training systems with their corresponding standard error (SE) and significance levels (p-value) of the F-tests and 95% confidence intervals. Dataset faithful at 0.05 significance level.
Additionally, the GDC relationship had a negative slope, which contradicts the system’s expected assessing function and also depicted a subhorizontal line for the Y-Trellis (Figure 4). The regression models were significant at p < 0.05, with the exception of the Lyre, GDC and T-Trellis, indicating that a higher vineshoot volume corresponded to the increasing measured ground truth with an R2 up to 0.92. Even for the free-standing Gobelet training system, due to the width of the 95% CI for the slope parameter, it demonstrated a significant correlation between RGB-D volume and dry biomass despite the weak correlation coefficient (R2 = 0.47).
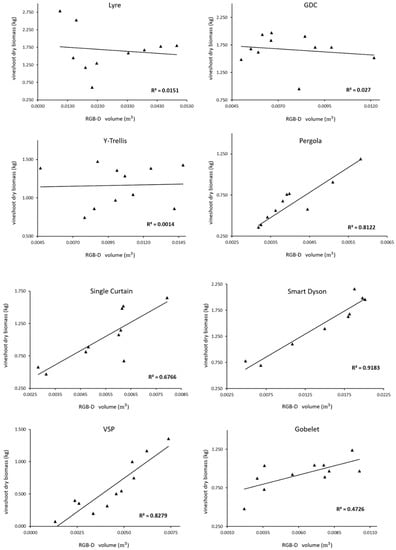
Figure 4.
Regression analyses comparing actual vineshoot biomass (measured ground truth) versus RGB-D vineshoot volume per each training system.
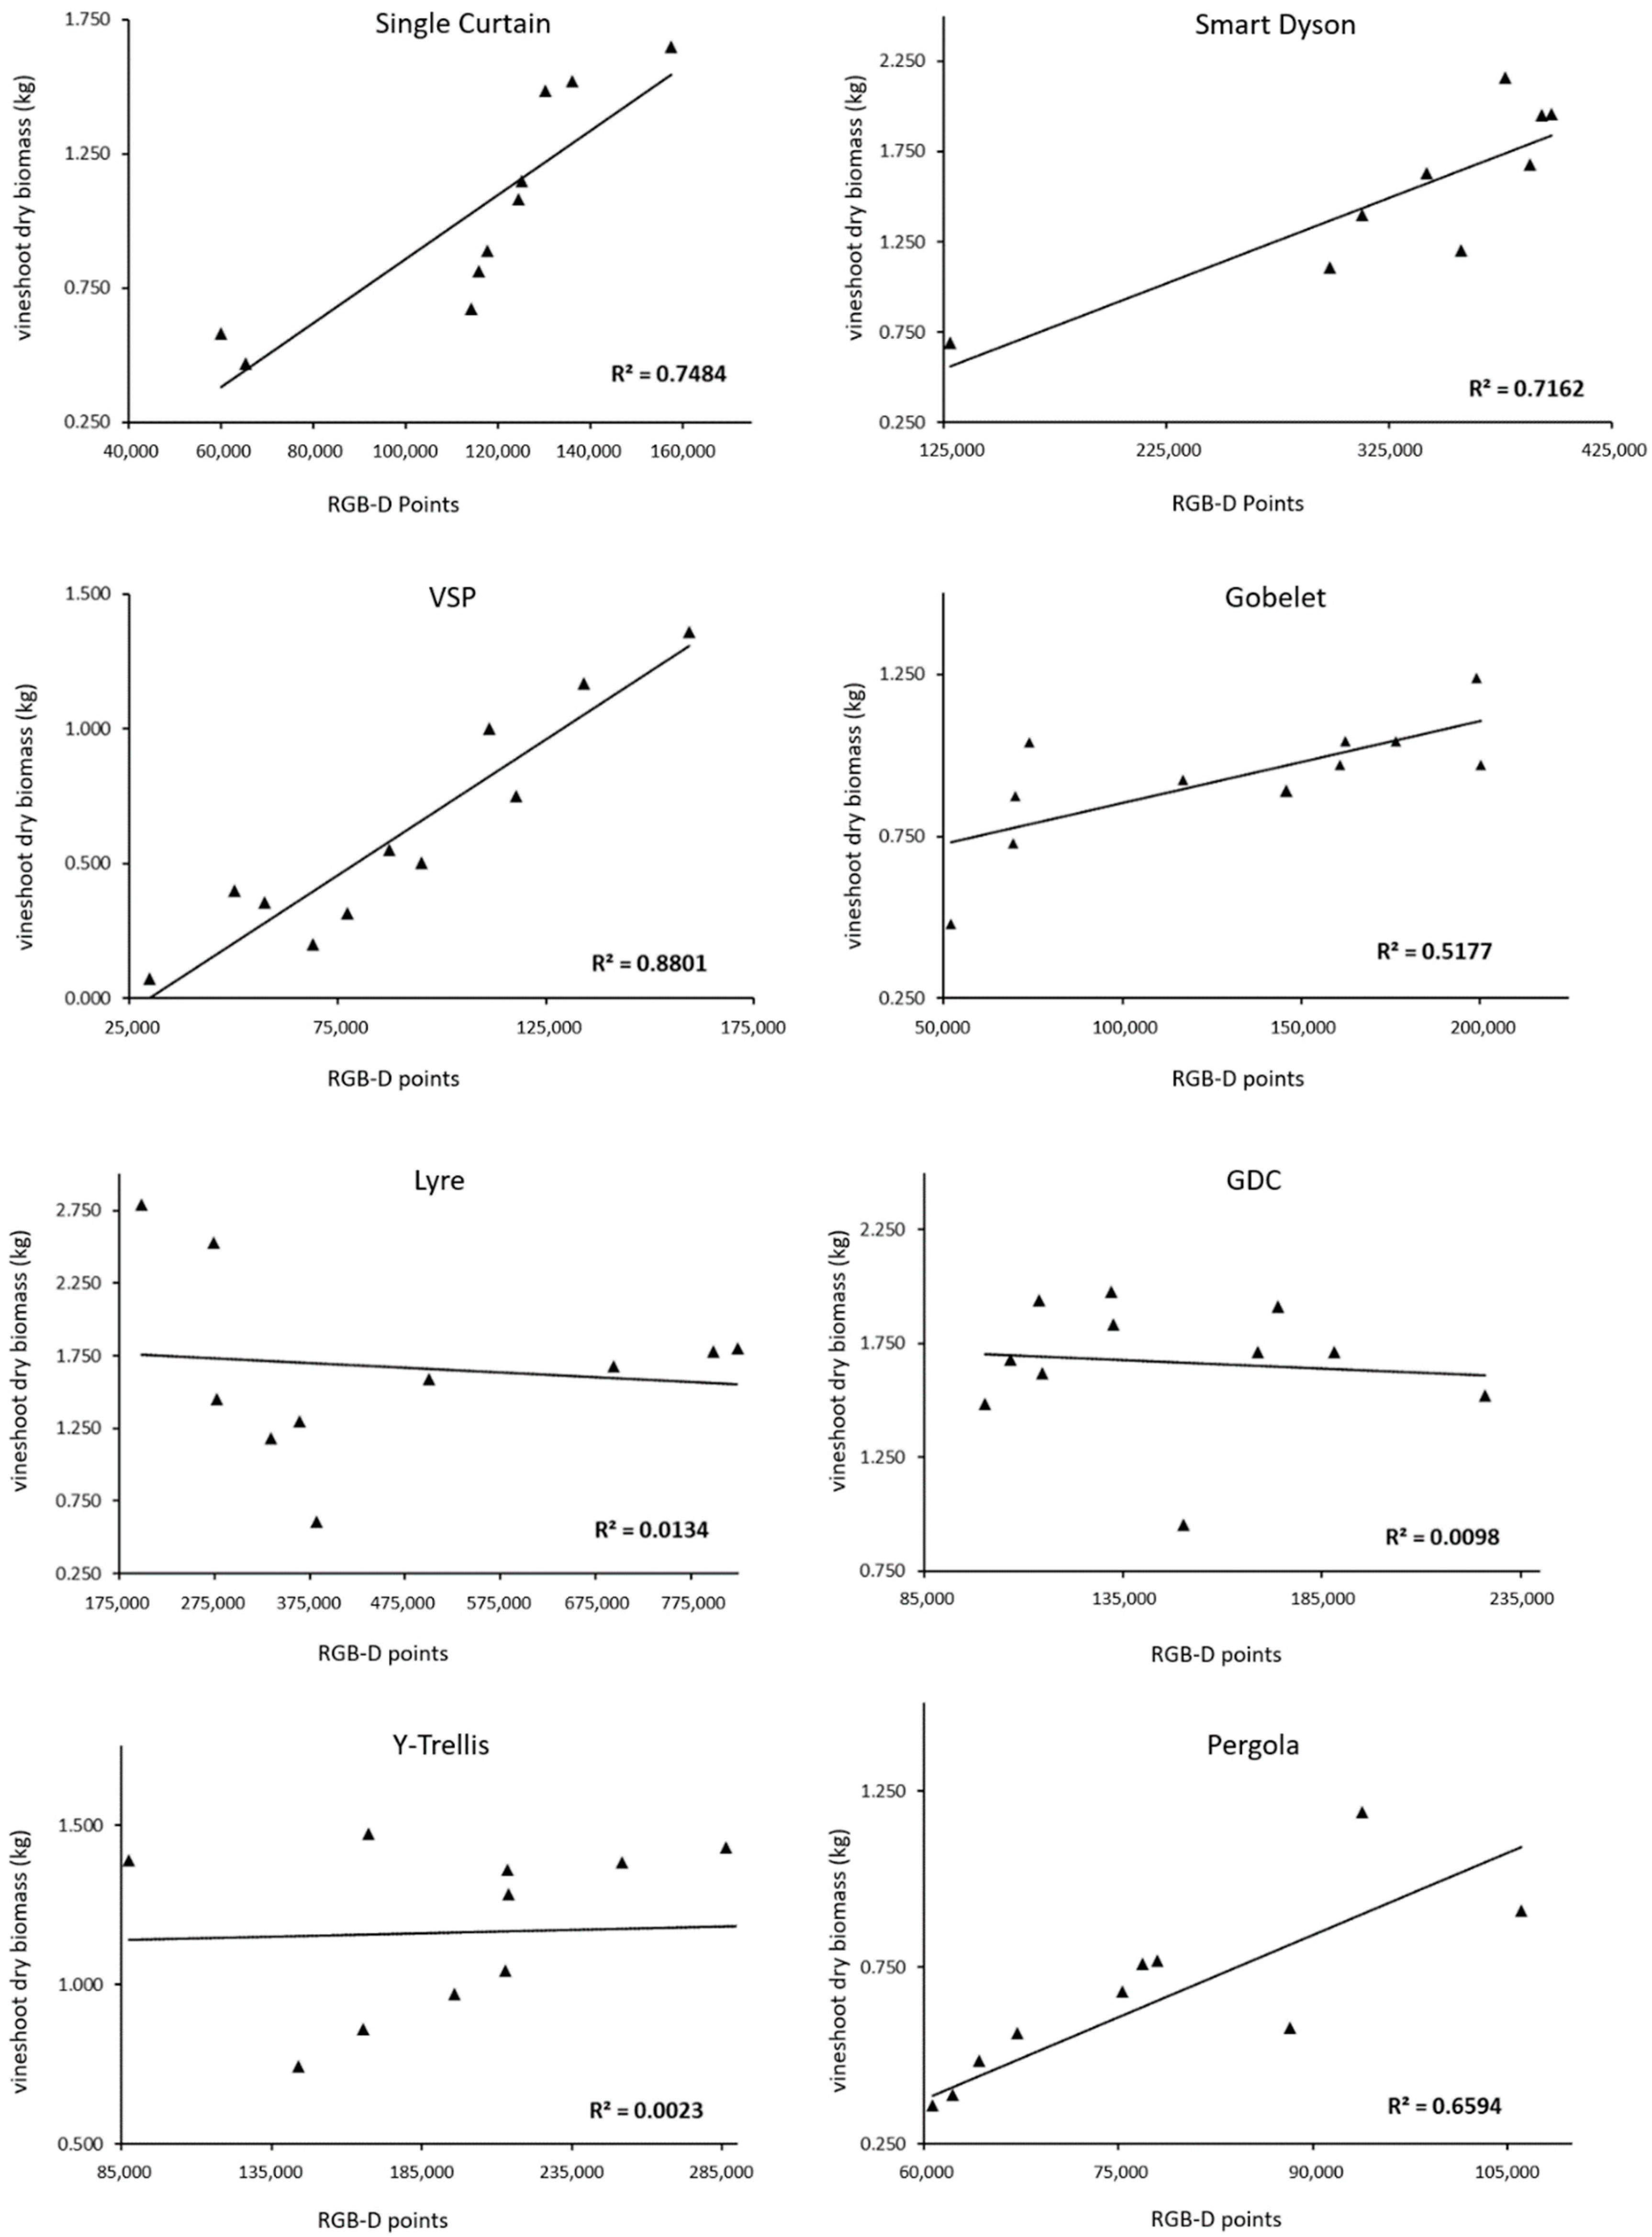
Analogously, for the linear model between RGB-D 3D points (Kinect v2 3D points) and dry biomass, a similar situation was seen (Figure 5). In this instance, the system demonstrated discriminating capabilities for the training systems Curtain, VSP, and even for Pergola and Smart Dyson, with a relatively high degree of agreement (0.66 < R2 < 0.88). Additionally, even though the Gobelet-trained vines correlation is low (R2 = 0.51) when comparing the number of 3D points versus the dry biomass, the system showed a meaningful relationship (Table 2). It is worth noting with reference to the Kinect v2 predecessor that one of the primary shortcomings of the Kinect v1 was its absolute blindness in strong daylight. This issue occurred since Kinect v1 measures depth by triangulating the position of an infrared pattern of points projected onto the scene. Marinello et al. [60] proposed employing a Kinect v1 as a technique for quickly determining the three-dimensional structure of a grapevine canopy. Despite the fact that the v2 outperformed the functioning due to sunlight conditions, they found significant linear relationships. Experiments demonstrated a high degree of concordance between the outcomes of digital analysis and manual measurements for two distinct grapevine varieties, having a coefficient of determination of R2 = 0.76. In contrast, Kinect v2 employs a completely different measurement principle (time-of-flight) that should at least partially alleviate the problem of daylight interference. Nevertheless, although Kinect v2 outperformed its predecessor [61] the sensor showed its limits in broad daylight when the RGB-D measures were taken, worsening its effects in the assessment of horizontally divided vines. GDC bears a divided canopy with branches trained downward into two different horizontal parallel free-hanging curtains. Comparably, the Lyre system is a horizontally divided inverted GDC. Y-Trellis also divides the canopy using the arms of Y-shaped posts, i.e., the vineshoots are allowed to trail on wires fixed apart on the inclined surface of ‘Y’.
Thus, they are similar in terms of using trellises aimed at separating the vine’s canopy, thereby increasing sun exposure to grape bunches. However, this architecture builds up two curtains of vineshoots which are spaced apart, i.e., opposite, at the base out of the Kinect v2 effective functioning range. Despite the fact that the depth nominal operating range of the sensor is 0.5–4.5 m [62], the maximum depth accuracy lowers when used outside [63]. In particular, experiments undertaken outdoors under varying daylight illumination conditions indicate that the sensor is capable of acquiring correct depth readings up to 1.9 m on sunny days and up to 2.8 m on cloudy days [51]. Since the mobile platform proceeded parallel to the row across the inter-row area, the raw data was comprised of RGB-D measurements of the vine rows’ lateral surface. Hence, elements positioned further than the operative range resulted in sparse 3D reconstructions. Owing to this particular trellis system, this behavior might have been expected, especially these vines trained to Lyre, GDC and Y-trellis according to their low R2 (Table 2). Furthermore, not only was the real depth range lower during the RGB-D readings, but the occlusion of the overlapped vineshoots also might have contributed to generate poor 3D models. This is explained by the fact that the two divided canopies were in an elevation view from the side of the sensor, and therefore the opposite canopy become hidden while the Kinect v2 was measuring. However, it is noted that factors such as temperature fluctuations or color variations with varying reflectance may impair the reliability of depth determinations. This issue was mitigated since the surveyed vines were leafless during the field trials, leaving only wooden components visible without foliage, resulting in a uniform 3D color environment [64].
Similarly, as mentioned above, Gobelet-trained vines led to some inconsistencies either when comparing dry biomass with volume and 3D points (R2 = 0.47 and 0.52 respectively). Although Gobelet is the very simplest trellis, and is merely a stake in the ground that is tied with minimal training, the vine is crowned by vineshoots bending down pointing towards the sensor.
Consequently, the mobile platform had to offset the move from the center of the alley. In order to avoid null RGB-D values, the sensor had to move back from the path, i.e., not equidistant from the center, more than 0.5, the official value, since the minimum operative distance ranges from 0.6 m to 0.75 m [65]. This resulted in a lack of 3D digitized information from those vineshoots that were hanging further on the other, opposite side of the Gobelet vines since they were out of the reach of the effective RGB-D measuring distance capacity. A possible solution to assess these horizontally divided training systems, including the head-trained vines, could be by scanning both sides of the crop rows.
By way of contrast, the vertical canopy training systems correlated well in both cases when comparing RGB-D volume and RGB-D 3D points against measured dry biomass ground-truth. Pearson’s correlation coefficients varied from 0.67, reaching a top value of 0.92 (Figure 4 and Figure 5). This could be explained by the architecture of these training systems since the canopy, thus the vineshoots, are virtually contained in a plane, i.e., a curtain parallel or at an angle to the movement direction of the sensor. These systems allow the vineshoots to grow within only one side of the trellis, in contrast to horizontally divided canopies. In the case of the Single Curtain, the upward growth of the shoots is supported by stakes promoting a similar branch architecture. In a similar manner, Smart Dyson uses a high-low approach, with upward and downward shoots facing the direction of the Kinect v2. Shoots that grow from upward-facing spurs are vertically oriented upward, whereas those that develop from downward-facing spurs are similarly oriented downward. Though these systems form a desirable geometry, when assessing the linear regressions, influential points were flagged according to the DFFITS criterion.
The regression model conforming to Single Curtain was optimized from R2 = 0.51 to 0.67 and R2 = 0.58 to a more meaningful correlation (R2 = 0.75) when comparing dry biomass against estimated volume and RGB-D 3D points, respectively. On the other hand, the regression models associated with Smart Dyson ranged in magnitude between R2 = 0.44, increasing substantially to 0.92 and R2 = 0.64 to 0.72 in the same manner as stated above. However, the number of measured vines could influence this tendency. A higher number of sampling points may fit the requirements to validate the system. A significant relationship was found for both systems (p < 0.05) which can be attached to the theory that increasing the number of RGB-D measurements correlates with increasing ground truth vineyard biomass. On the other hand, Pergola consists of a series of metal vertical poles positioned at an angle to support the branches hanging free and pointing towards the sensor. This trellis also manipulates the form of the vine in an adequate 3D orientation for the sensor position while RGB-D measuring, resulting in a high square-R of 0.81 when comparing volume and dry biomass, decreasing to 0.66 in consonance with the RGB-D 3D points. The vertical shoot-positioned trellis type maintains a canopy form and foliage separation in narrow-row spacings. Shoots emerging from spurs are directed upward between the sets of training wires on the trellis. Therefore, this geometry led to the most consistent relationship with dry biomass, whether estimated volume or three-dimensional points. Thus, a strong correlation was observed between the estimated parameters by the RGB-D digital model and their actual ground truth. The squared R values ranged from 0.82 to 0.88 for each correlation. Although the vineshoots are relatively thin, these trellising systems aid in avoiding the non-visible parts as an inherent limitation in this type of optical measurement. Furthermore, readings were acquired from defoliated canopies, which is a significant benefit when RGB-D imaging the vine structure to minimize leaf occlusion as a significant constraint on 3D reconstruction [31,66]. In addition, even though only one side was RGB-D measured, this architectural structure enabled a high correlation while avoiding sparse 3D models and significantly reducing isolated points. A further approach independent of the training system, to enhance the RGB-D sensor performance, can be taken by increasing the scene time lapse. The Kinect v2 sensor has been designed as a ToF camera, so each pixel of the collected depth maps contains a depth measurement according to the nearest objects. Moreover, it is not feasible to act on the modulation frequency or the integration time of the Kinect v2 compared to other RGB-D cameras [67]. This results in increasing the standard deviation within the range for the measured distances.
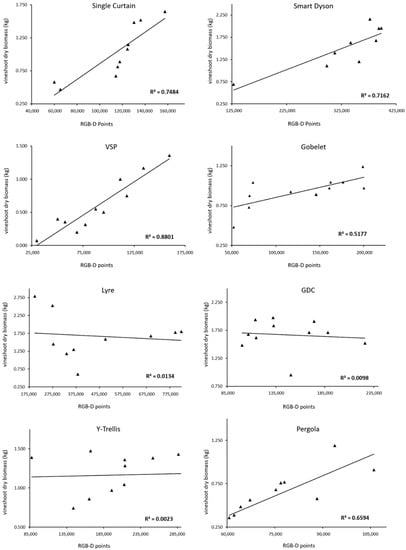
Figure 5.
Regression analyses comparing actual vineshoot biomass (measured ground truth) versus RGB-D 3D vineshoot points per each training system.
Figure 5.
Regression analyses comparing actual vineshoot biomass (measured ground truth) versus RGB-D 3D vineshoot points per each training system.
Nonetheless, with today’s technology, due to the increased computing capacity, to cope with this distance inhomogeneity, the traveling speed of the sensor could be lowered in order to obtain more robust data through averaging redundant data, i.e., integrating more RGB-D information for the same scene.
In the light of these results, a significant degree of agreement was identified between ground truth dry biomass as a surrogate of RGB-D vineshoot volume and 3D points associated with the correspondent point clouds. These outcomes proved that a system combining RGB-D volume and 3D points results in a more robust approach to assessing the geometrical structure of vineshoots. Nonetheless, the typical shoot average diameter is 10 mm, so depth cameras are unable to measure them properly, resulting in poor or non-existent reconstructions. Moreover, it is stressed that for all the training systems, the terminal parts of the shoots are so much thinner than the Kinect v2 cannot properly acquire RGB-D information [67], hence losing input information for the regression models. However, although in this study the RGB-D data was captured at full field of view (FoV), the Kinect v2 allows for the selection of ranges of FoV, then varying the sensor performance. Similarly, García-Fernández et al. [68] using photogrammetric procedures i.e., structure from motion (SfM), determined the pruning weight in two vineyards with satisfactory results. The vegetation volume was determined from the generated 3D point clouds, and the pruning weight was estimated using linear regression analysis, with R2 ranging from 0.66 to 0.71 and 0.56 to 0.68 for the two research vineyards. In the present study, although end-details of vineshoots were difficult to be 3D modeled, the RGB-D-based system showed its powerful ability to estimate accurate vineshoot dry biomass. The system demonstrates the ability to discriminate four out of the eight of the studied training systems in terms of volume and 3D point estimation. It can be differentiated between horizontally divided (Lyre, GDC and T-Trellis) and non-horizontally divided canopy vines (Pergola, Curtain, Smart Dyson and VSP) standing alone in the particular head-trained system Gobelet. This procedure was aimed at obtaining 3D information, and thus indirectly dry biomass reveals the capabilities of this low-cost sensor for obtaining three-dimensional information. Moreover, multiple environmental factors, such as soil parameters and access to nutrients and water, influence the length and width of dormant vineshoots in vines [69], so gaining more insight would allow map-based variable rate application or water management programs to be obtained. It can be stated that the Kinect v2 sensor for this purpose is a trustworthy proximal sensing technology due to its capabilities of 3D reconstructing of large crop areas in a high geometrical resolution. Thus, pruning wood estimation can be a valuable alternative for assessing vine vigor spatial variability in order to perform site-specific input application i.e., irrigation or fertilization, and to adapt vineyard management operations such as pruning to improve vine balance and grape quality outcomes [14]. This can aid in the mapping of vine vigor in vineyards by adding an additional layer of data that can be utilized to demarcate management zones. Furthermore, the results demonstrated that the Kinect v2 as an RGB-D camera can be utilized to rapidly and accurately 3D digitize winter dormant shoots prior to pruning. This study contributes to the assessment of the capabilities of this RGB-D camera to obtain reliable 3D information. This can also help to gain insight into pruning practices, since a way to measure the vigor of a vine is by weighing its winter cane pruning for one growing season. Thus, if a certain biomass is then assigned to each shoot, the optimal number of shoots per vine based on its current vigor can be calculated. Thus, shoot density can be altered by thinning unnecessary shoots or by adjusting the degree of pruning [15]. Moreover, using proper algorithms for feature extraction of other prospective precision agriculture practices can be implemented while performing other monitoring tasks such as robotic pruning, i.e., accurate estimation of the cut-points on the branches for automation of dormant pruning [70] or bunch detection and counting [42]. An accurate 3D model of crop biophysical characteristics would therefore allow approaches such as automated pruning, irrigation systems and variable rate technologies to be implemented.
4. Conclusions
Proximal 3D sensing characterization can help to assess dormant shoot pruning weight as a good estimate of vigor, and then foresee the expected yield, thereby casting light on other tasks such as pruning directives or delimitating management zones considering vine vigor. The proposed methodology can help to achieve the aim of developing a 3D model of an entire crop in high detail. A self-developed mobile platform used a Kinect v2 as a low-cost RGB-D camera that accomplished the objective of 3D reconstructing the vineshoot structure according to eight different training systems when vines were completely defoliated during winter dormancy. The architectural reconstruction of the training systems based on vertical trellises showed strong correlations in both analysis when comparing vineshoot dry biomass and calculated RGB-D volume and the associated 3D points. Dense point clouds significantly influenced the relationship between ground truth dry biomass measurements in four out of eight training systems (Pergola, Single Curtain, Smart Dyson and VSP). The potential capabilities of the Kinect v2 sensor as an RGB-D camera used in this method lead to the conclusion that the election of the approach must be based on the target. A further approach should focus on acquiring more depth information and fusing an additional series of tridimensional point clouds from other angles. Thus, the density of the point clouds can be increased in order to improve the 3D reconstruction, which could be a faster alternative to measuring both sides of the vine rows. To improve the efficacy of the proposed method, additional research must be undertaken to determine the optimal measurement settings such as sensor height, distance to crop rows or vehicle speed to adapt them to the training system.
Author Contributions
Conceptualization, D.A. and H.M.; methodology, D.A. and H.M.; software, J.B.-G.; validation, D.A. and H.M.; formal analysis, D.A. and H.M.; investigation, D.A. and H.M. resources, A.R. and D.A.; data curation, D.A. and H.M.; writing—original draft preparation, D.A. and H.M.; writing—review and editing, D.A. and H.M.; visualization, D.A. and H.M.; supervision, D.A. and H.M.; project administration, D.A.; funding acquisition, D.A. and A.R. All authors have read and agreed to the published version of the manuscript.
Funding
This research was funded by AEI, grant number PID2020-113229RBC43/AEI/10.13039/501100011033.
Institutional Review Board Statement
Not applicable.
Informed Consent Statement
Not applicable.
Data Availability Statement
Not applicable.
Acknowledgments
El Socorro Viticulture Research Centre belonging to the Instituto Madrileño de Desarrollo Rural Agrario y Alimentario (IMIDRA) in the southwest of the Madrid Region for facilitating their fields and establishing training systems.
Conflicts of Interest
The authors declare no conflict of interest.
References
- Navrátilová, M.; Brož, D.; Beranová, M. Vine growing and production in global context. SHS Web Conf. 2021, 92, 07042. [Google Scholar] [CrossRef]
- Pomarici, E.; Sardone, R. EU wine policy in the framework of the CAP: Post-2020 challenges. Agric. Food Econ. 2020, 8, 17. [Google Scholar] [CrossRef]
- Kariyapperuma, N.; Collins, E. Family logics and environmental sustainability: A study of the New Zealand wine industry. Bus. Strategy Environ. 2021, 30, 3626–3650. [Google Scholar] [CrossRef]
- Bresciani, S.; Giacosa, E.; Broccardo, L.; Culasso, F. The family variable in the French and Italian wine sector. EuroMed J. Bus. 2016, 11, 101–118. [Google Scholar] [CrossRef]
- Bresciani, S.; Ferraris, A.; Santoro, G.; Nilsen, H. Wine Sector: Companies’ Performance and Green Economy as a Means of Societal Marketing. J. Promot. Manag. 2016, 22, 251–267. [Google Scholar] [CrossRef]
- Santesteban, L.G. Precision viticulture and advanced analytics. A short review. Food Chem. 2019, 279, 58–62. [Google Scholar] [CrossRef]
- Diago, M.-P.; Correa, C.; Millán, B.; Barreiro, P.; Valero, C.; Tardaguila, J. Grapevine Yield and Leaf Area Estimation Using Supervised Classification Methodology on RGB Images Taken under Field Conditions. Sensors 2012, 12, 16988–17006. [Google Scholar] [CrossRef] [Green Version]
- Schuh, B.; Maucorps, A.; Brkanovic, S.; Dwyer, J.; Vigani, M.; Khafagy, A.; Deschellette, P.; López, A.; Severini, S.; Antonioli, F. The EU Farming Employment: Current Challenges and Future Prospects Policy Department for Structural and Cohesion Policies Directorate-General for Internal Policies PE The EU Farming Employment: Current Challenges and Future Prospects. Technical Report; European Parliament Think Tank Publications Office: Brussels, Belgium, 2019. [Google Scholar]
- Liu, B.; Bruch, R. Weed Detection for Selective Spraying: A Review. Curr. Robot. Rep. 2020, 1, 19–26. [Google Scholar] [CrossRef] [Green Version]
- Schäfer, J.; Friedel, M.; Molitor, D.; Stoll, M. Semi-Minimal-Pruned Hedge (SMPH) as a Climate Change Adaptation Strategy: Impact of Different Yield Regulation Approaches on Vegetative and Generative Development, Maturity Progress and Grape Quality in Riesling. Appl. Sci. 2021, 11, 3304. [Google Scholar] [CrossRef]
- Reynolds, A.G.; Vanden Heuvel, J.E. Influence of Grapevine Training Systems on Vine Growth and Fruit Composition: A Review. Am. J. Enol. Vitic. 2009, 60, 251–268. [Google Scholar]
- Tissot, C.; Rouan, M.; Renan, L.R.; Neethling, E.; Rességuier, L.; Petitjean, T.; Cornelis, V.; Quénol, H.; Liviu Mihai, I.; Patriche, C. Simulating the Impact of Climate Change on Grapevine Behaviour and Viticultural Activities; OENO ONE: Villenave d’Ornon, France, 2017. [Google Scholar]
- Naulleau, A.; Gary, C.; Prevot, L.; Berteloot, V.; Fabre, J.-C.; Crevoisier, D.; Gaudin, R.; Hossard, L. Participatory modeling to assess the impacts of climate change in a Mediterranean vineyard watershed. Environ. Model. Softw. 2022, 150, 105342. [Google Scholar] [CrossRef]
- Tagarakis, A.C.; Koundouras, S.; Fountas, S.; Gemtos, T. Evaluation of the use of LIDAR laser scanner to map pruning wood in vineyards and its potential for management zones delineation. Precis. Agric. 2018, 19, 334–347. [Google Scholar] [CrossRef]
- Steyn, J.; Aleixandre Tudo, J.; Aleixandre Benavent, J.L. Grapevine vigour and within vineyard variability: A review. Int. J. Sci. Eng. Res. 2016, 7, 1056–1065. [Google Scholar]
- Moreno, H.; Rueda-Ayala, V.; Ribeiro, A.; Bengochea-Guevara, J.; Lopez, J.; Peteinatos, G.; Valero, C.; Andújar, D. Evaluation of Vineyard Cropping Systems Using on-Board RGB-Depth Perception. Sensors 2020, 20, 6912. [Google Scholar] [CrossRef]
- Smart, R.; Robinson, M. Sunlight into Wine: A Handbook for Winegrape Canopy Management; Winetitles: Adelaide, Australia, 1991. [Google Scholar]
- Umeda, H.; Mochizuki, Y.; Saito, T.; Higashide, T.; Iwasaki, Y. Diagnosing Method for Plant Growth using a 3D Depth Sensor; International Society for Horticultural Science (ISHS): Leuven, Belgium, 2018; pp. 631–636. [Google Scholar]
- Escolà, A.; Martínez-Casasnovas, J.A.; Rufat, J.; Arnó, J.; Arbonés, A.; Sebé, F.; Pascual, M.; Gregorio, E.; Rosell-Polo, J.R. Mobile terrestrial laser scanner applications in precision fruticulture/horticulture and tools to extract information from canopy point clouds. Precis. Agric. 2016, 18, 111–132. [Google Scholar] [CrossRef] [Green Version]
- Dry, P.R.; Loveys, B.R. Factors influencing grapevine vigour and the potential for control with partial rootzone drying. Aust. J. Grape Wine Res. 1998, 4, 140–148. [Google Scholar] [CrossRef]
- Nabwire, S.; Suh, H.-K.; Kim, M.S.; Baek, I.; Cho, B.-K. Review: Application of Artificial Intelligence in Phenomics. Sensors 2021, 21, 4363. [Google Scholar] [CrossRef]
- Kerry, R.; Escolà, A.; Mulla, D.; Gregorio Lopez, E.; Llorens Calveras, J.; Lopez, A.; De Castro, A.; Biswas, A.; Hopkins, A.; Stenberg, B.; et al. Sensing Approaches for Precision Agriculture; Springer Nature: Cham, Switzerland, 2021. [Google Scholar] [CrossRef]
- Islam, S.; Reza, M.N.; Chowdhury, M.; Islam, M.N.; Ali, M.; Kiraga, S.; Chung, S.O. Image processing algorithm to estimate ice-plant leaf area from RGB images under different light conditions. IOP Conf. Ser. Earth Environ. Sci. 2021, 924, 012013. [Google Scholar] [CrossRef]
- Sarkar, S.; Cazenave, A.-B.; Oakes, J.; McCall, D.; Thomason, W.; Abbott, L.; Balota, M. Aerial high-throughput phenotyping of peanut leaf area index and lateral growth. Sci. Rep. 2021, 11, 21661. [Google Scholar] [CrossRef]
- Maimaitijiang, M.; Sagan, V.; Sidike, P.; Maimaitiyiming, M.; Hartling, S.; Peterson, K.T.; Maw, M.J.W.; Shakoor, N.; Mockler, T.; Fritschi, F.B. Vegetation Index Weighted Canopy Volume Model (CVMVI) for soybean biomass estimation from Unmanned Aerial System-based RGB imagery. ISPRS J. Photogramm. Remote Sens. 2019, 151, 27–41. [Google Scholar] [CrossRef]
- Andújar, D.; Moreno, H.; Bengochea-Guevara, J.M.; de Castro, A.; Ribeiro, A. Aerial imagery or on-ground detection? An economic analysis for vineyard crops. Comput. Electron. Agric. 2019, 157, 351–358. [Google Scholar] [CrossRef]
- Vázquez-Arellano, M.; Griepentrog, H.W.; Reiser, D.; Paraforos, D.S. 3-D Imaging Systems for Agricultural Applications—A Review. Sensors 2016, 16, 618. [Google Scholar] [CrossRef] [PubMed] [Green Version]
- Andújar, D.; Rueda-Ayala, V.; Moreno, H.; Rosell-Polo, J.R.; Escolá, A.; Valero, C.; Gerhards, R.; Fernández-Quintanilla, C.; Dorado, J.; Griepentrog, H.-W. Discriminating Crop, Weeds and Soil Surface with a Terrestrial LIDAR Sensor. Sensors 2013, 13, 14662–14675. [Google Scholar] [CrossRef] [PubMed] [Green Version]
- Moura, P.; Ribeiro, D.; dos Santos, F.N.; Gomes, A.; Baptista, R.; Cunha, M. Estimation of Vineyard Productivity Map Considering a Cost-Effective LIDAR-Based Sensor; Springer International Publishing: Cham, Switzerland, 2019; pp. 121–133. [Google Scholar]
- Keightley, K.E.; Bawden, G.W. 3D volumetric modeling of grapevine biomass using Tripod LiDAR. Comput. Electron. Agric. 2010, 74, 305–312. [Google Scholar] [CrossRef]
- Moreno, H.; Valero, C.; Bengochea-Guevara, J.M.; Ribeiro, Á.; Garrido-Izard, M.; Andújar, D. On-Ground Vineyard Reconstruction Using a LiDAR-Based Automated System. Sensors 2020, 20, 1102. [Google Scholar] [CrossRef] [Green Version]
- Del-Moral-Martínez, I.; Rosell-Polo, J.R.; Company, J.; Sanz, R.; Escolà, A.; Masip, J.; Martínez-Casasnovas, J.A.; Arnó, J. Mapping Vineyard Leaf Area Using Mobile Terrestrial Laser Scanners: Should Rows be Scanned On-the-Go or Discontinuously Sampled? Sensors 2016, 16, 119. [Google Scholar] [CrossRef] [Green Version]
- Sanz, R.; Llorens, J.; Escolà, A.; Arnó, J.; Planas, S.; Román, C.; Rosell-Polo, J.R. LIDAR and non-LIDAR-based canopy parameters to estimate the leaf area in fruit trees and vineyard. Agric. For. Meteorol. 2018, 260, 229–239. [Google Scholar] [CrossRef]
- Pfeiffer, S.A.; Guevara, J.; Cheein, F.A.; Sanz, R. Mechatronic terrestrial LiDAR for canopy porosity and crown surface estimation. Comput. Electron. Agric. 2018, 146, 104–113. [Google Scholar] [CrossRef]
- Fu, L.; Gao, F.; Wu, J.; Li, R.; Karkee, M.; Zhang, Q. Application of consumer RGB-D cameras for fruit detection and localization in field: A critical review. Comput. Electron. Agric. 2020, 177, 105687. [Google Scholar] [CrossRef]
- Kuan, Y.W.; Ee, N.O.; Wei, L.S. Comparative Study of Intel R200, Kinect v2, and Primesense RGB-D Sensors Performance Outdoors. IEEE Sens. J. 2019, 19, 8741–8750. [Google Scholar] [CrossRef]
- Halmetschlager-Funek, G.; Suchi, M.; Kampel, M.; Vincze, M. An Empirical Evaluation of Ten Depth Cameras: Bias, Precision, Lateral Noise, Different Lighting Conditions and Materials, and Multiple Sensor Setups in Indoor Environments. IEEE Robot. Autom. Mag. 2019, 26, 67–77. [Google Scholar] [CrossRef]
- Xu, H.; Xu, J.; Xu, W. Survey of 3D modeling using depth cameras. Virtual Real. Intell. Hardw. 2019, 1, 483–499. [Google Scholar] [CrossRef]
- Giancola, S.; Valenti, M.; Sala, R. A Survey on 3D Cameras: Metrological Comparison of Time-of-Flight, Structured-Light and Active Stereoscopy Technologies. In Springer Briefs in Computer Science; Springer: Cham, Switzerland, 2018. [Google Scholar] [CrossRef] [Green Version]
- Polic, M.; Tabak, J.; Orsag, M. Pepper to fall: A perception method for sweet pepper robotic harvesting. Intell. Serv. Robot. 2022, 15, 193–201. [Google Scholar] [CrossRef]
- Kang, H.; Chen, C. Fruit detection, segmentation and 3D visualisation of environments in apple orchards. Comput. Electron. Agric. 2020, 171, 105302. [Google Scholar] [CrossRef] [Green Version]
- Milella, A.; Marani, R.; Petitti, A.; Reina, G. In-field high throughput grapevine phenotyping with a consumer-grade depth camera. Comput. Electron. Agric. 2019, 156, 293–306. [Google Scholar] [CrossRef]
- Neupane, C.; Koirala, A.; Wang, Z.; Walsh, K.B. Evaluation of Depth Cameras for Use in Fruit Localization and Sizing: Finding a Successor to Kinect v2. Agronomy 2021, 11, 1780. [Google Scholar] [CrossRef]
- Vit, A.; Shani, G. Comparing RGB-D Sensors for Close Range Outdoor Agricultural Phenotyping. Sensors 2018, 18, 4413. [Google Scholar] [CrossRef] [Green Version]
- Martínez-Casasnovas, J.A.; Sandonís-Pozo, L.; Escolà, A.; Arnó, J.; Llorens, J. Delineation of Management Zones in Hedgerow Almond Orchards Based on Vegetation Indices from UAV Images Validated by LiDAR-Derived Canopy Parameters. Agronomy 2022, 12, 102. [Google Scholar] [CrossRef]
- Andújar, D.; Dorado, J.; Fernández-Quintanilla, C.; Ribeiro, A. An Approach to the Use of Depth Cameras for Weed Volume Estimation. Sensors 2016, 16, 972. [Google Scholar] [CrossRef] [Green Version]
- Guevara, J.; Auat Cheein, F.A.; Gené-Mola, J.; Rosell-Polo, J.R.; Gregorio, E. Analyzing and overcoming the effects of GNSS error on LiDAR based orchard parameters estimation. Comput. Electron. Agric. 2020, 170, 105255. [Google Scholar] [CrossRef]
- Bengochea-Guevara, J.M.; Andújar, D.; Sanchez-Sardana, F.L.; Cantuña, K.; Ribeiro, A. A Low-Cost Approach to Automatically Obtain Accurate 3D Models of Woody Crops. Sensors 2018, 18, 30. [Google Scholar] [CrossRef] [Green Version]
- Gregorio, E.; Llorens, J. Sensing Crop Geometry and Structure. In Sensing Approaches for Precision Agriculture; Kerry, R., Escolà, A., Eds.; Springer International Publishing: Berlin/Heidelberg, Germany, 2021; pp. 59–92. [Google Scholar]
- Tölgyessy, M.; Dekan, M.; Chovanec, L.; Hubinský, P. Evaluation of the Azure Kinect and Its Comparison to Kinect V1 and Kinect V2. Sensors 2021, 21, 413. [Google Scholar] [CrossRef] [PubMed]
- Fankhauser, P.; Bloesch, M.; Rodriguez, D.; Kaestner, R.; Hutter, M.; Siegwart, R. Kinect v2 for Mobile Robot Navigation: Evaluation and Modeling. In Proceedings of the 2015 International Conference on Advanced Robotics (ICAR), Istanbul, Turkey, 27–31 July 2015. [Google Scholar] [CrossRef] [Green Version]
- Nießner, M.; Zollhöfer, M.; Izadi, S.; Stamminger, M. Real-time 3D Reconstruction at Scale using Voxel Hashing. ACM Trans. Graph. (TOG) 2013, 32, 1–11. [Google Scholar] [CrossRef]
- Curless, B.; Levoy, M. A volumetric method for building complex models from range images. In Proceedings of the 23rd Annual Conference on Computer Graphics and Interactive Techniques, New York, NY, USA, 4–9 August 1996. [Google Scholar]
- Roth, S.D. Ray casting for modeling solids. Comput. Graph. Image Processing 1982, 18, 109–144. [Google Scholar] [CrossRef]
- Chen, Y.; Medioni, G. Object modelling by registration of multiple range images. Image Vis. Comput. 1992, 10, 145–155. [Google Scholar] [CrossRef]
- Edelsbrunner, H.; Mucke, E. Three-Dimensional Alpha Shapes. In Proceedings of the 1992 Workshop on Volume Visualization, Boston, MA, USA, 19—20 October 1992; pp. 75–82. [Google Scholar] [CrossRef] [Green Version]
- Colaço, A.F.; Trevisan, R.G.; Molin, J.P.; Rosell-Polo, J.R.; Escolà, A. A Method to Obtain Orange Crop Geometry Information Using a Mobile Terrestrial Laser Scanner and 3D Modeling. Remote Sens. 2017, 9, 763. [Google Scholar] [CrossRef] [Green Version]
- Rueda-Ayala, V.; Peña-Barragán, J.M.; Höglind, M.; Bengochea-Guevara, J.; Andújar, D. Comparing UAV-Based Technologies and RGB-D Reconstruction Methods for Plant Height and Biomass Monitoring on Grass Ley. Sensors 2019, 19, 535. [Google Scholar] [CrossRef] [Green Version]
- Lafarge, T.; Pateiro-Lopez, B. Alphashape3d: Implementation of the 3D Alpha-Shape for the Reconstruction of 3D Sets from a Point Cloud, Version 1.3. 2017. Available online: http://cran.nexr.com/web/packages/alphashape3d/alphashape3d.pdf (accessed on 10 May 2022).
- Marinello, F.; Pezzuolo, A.; Meggio, F.; Martínez-Casasnovas, J.A.; Yezekyan, T.; Sartori, L. Application of the Kinect sensor for three dimensional characterization of vine canopy. Adv. Anim. Biosci. 2017, 8, 525–529. [Google Scholar] [CrossRef] [Green Version]
- Andújar, D.; Dorado, J.; Bengochea-Guevara, J.M.; Conesa-Muñoz, J.; Fernández-Quintanilla, C.; Ribeiro, Á. Influence of Wind Speed on RGB-D Images in Tree Plantations. Sensors 2017, 17, 914. [Google Scholar] [CrossRef] [Green Version]
- Pagliari, D.; Pinto, L. Calibration of Kinect for Xbox One and Comparison between the Two Generations of Microsoft Sensors. Sensors 2015, 15, 27569–27589. [Google Scholar] [CrossRef] [Green Version]
- Gené-Mola, J.; Llorens, J.; Rosell-Polo, J.R.; Gregorio, E.; Arnó, J.; Solanelles, F.; Martínez-Casasnovas, J.A.; Escolà, A. Assessing the Performance of RGB-D Sensors for 3D Fruit Crop Canopy Characterization under Different Operating and Lighting Conditions. Sensors 2020, 20, 7072. [Google Scholar] [CrossRef] [PubMed]
- Wasenmüller, O.; Stricker, D. Comparison of Kinect V1 and V2 Depth Images in Terms of Accuracy and Precision; Springer International Publishing: Berlin/Heidelberg, Germany, 2017; pp. 34–45. [Google Scholar]
- Jiao, J.; Yuan, L.; Tang, W.; Deng, Z.; Wu, Q. A Post-Rectification Approach of Depth Images of Kinect v2 for 3D Reconstruction of Indoor Scenes. ISPRS Int. J. Geo Inf. 2017, 6, 349. [Google Scholar] [CrossRef] [Green Version]
- Bailey, B.N.; Mahaffee, W.F. Rapid measurement of the three-dimensional distribution of leaf orientation and the leaf angle probability density function using terrestrial LiDAR scanning. Remote Sens. Environ. 2017, 194, 63–76. [Google Scholar] [CrossRef] [Green Version]
- Lachat, E.; Macher, H.; Landes, T.; Grussenmeyer, P. Assessment and Calibration of a RGB-D Camera (Kinect v2 Sensor) Towards a Potential Use for Close-Range 3D Modeling. Remote Sens. 2015, 7, 13070–13097. [Google Scholar] [CrossRef] [Green Version]
- García-Fernández, M.; Sanz-Ablanedo, E.; Pereira-Obaya, D.; Rodríguez-Pérez, J.R. Vineyard Pruning Weight Prediction Using 3D Point Clouds Generated from UAV Imagery and Structure from Motion Photogrammetry. Agronomy 2021, 11, 2489. [Google Scholar] [CrossRef]
- Bates, T.R. Mechanical crop control in New York ’Concord’ vineyards target desirable crop load levels. Acta Hortic. 2017, 1177, 259–264. [Google Scholar] [CrossRef]
- Elfiky, N.M.; Akbar, S.A.; Sun, J.; Park, J.; Kak, A. Automation of dormant pruning in specialty crop production: An adaptive framework for automatic reconstruction and modeling of apple trees. In Proceedings of the 2015 IEEE Conference on Computer Vision and Pattern Recognition Workshops (CVPRW), Boston, MA, USA, 7–12 June 2015; pp. 65–73. [Google Scholar]


Publisher’s Note: MDPI stays neutral with regard to jurisdictional claims in published maps and institutional affiliations. |
© 2022 by the authors. Licensee MDPI, Basel, Switzerland. This article is an open access article distributed under the terms and conditions of the Creative Commons Attribution (CC BY) license (https://creativecommons.org/licenses/by/4.0/).