
Evaluation of Artificial Neural Network to Model Performance Attributes of a Mechanization Unit (Tractor-Chisel Plow) under Different Working Variables


Abstract
:1. Introduction
2. Materials and Methods
2.1. Plowing-Field Experiment
2.2. Formulas Used
2.3. Literature Data Collection
2.4. Building the ANN Model
2.5. Building MLR Model
2.6. Statistical Criteria for Models Evaluation
3. Results
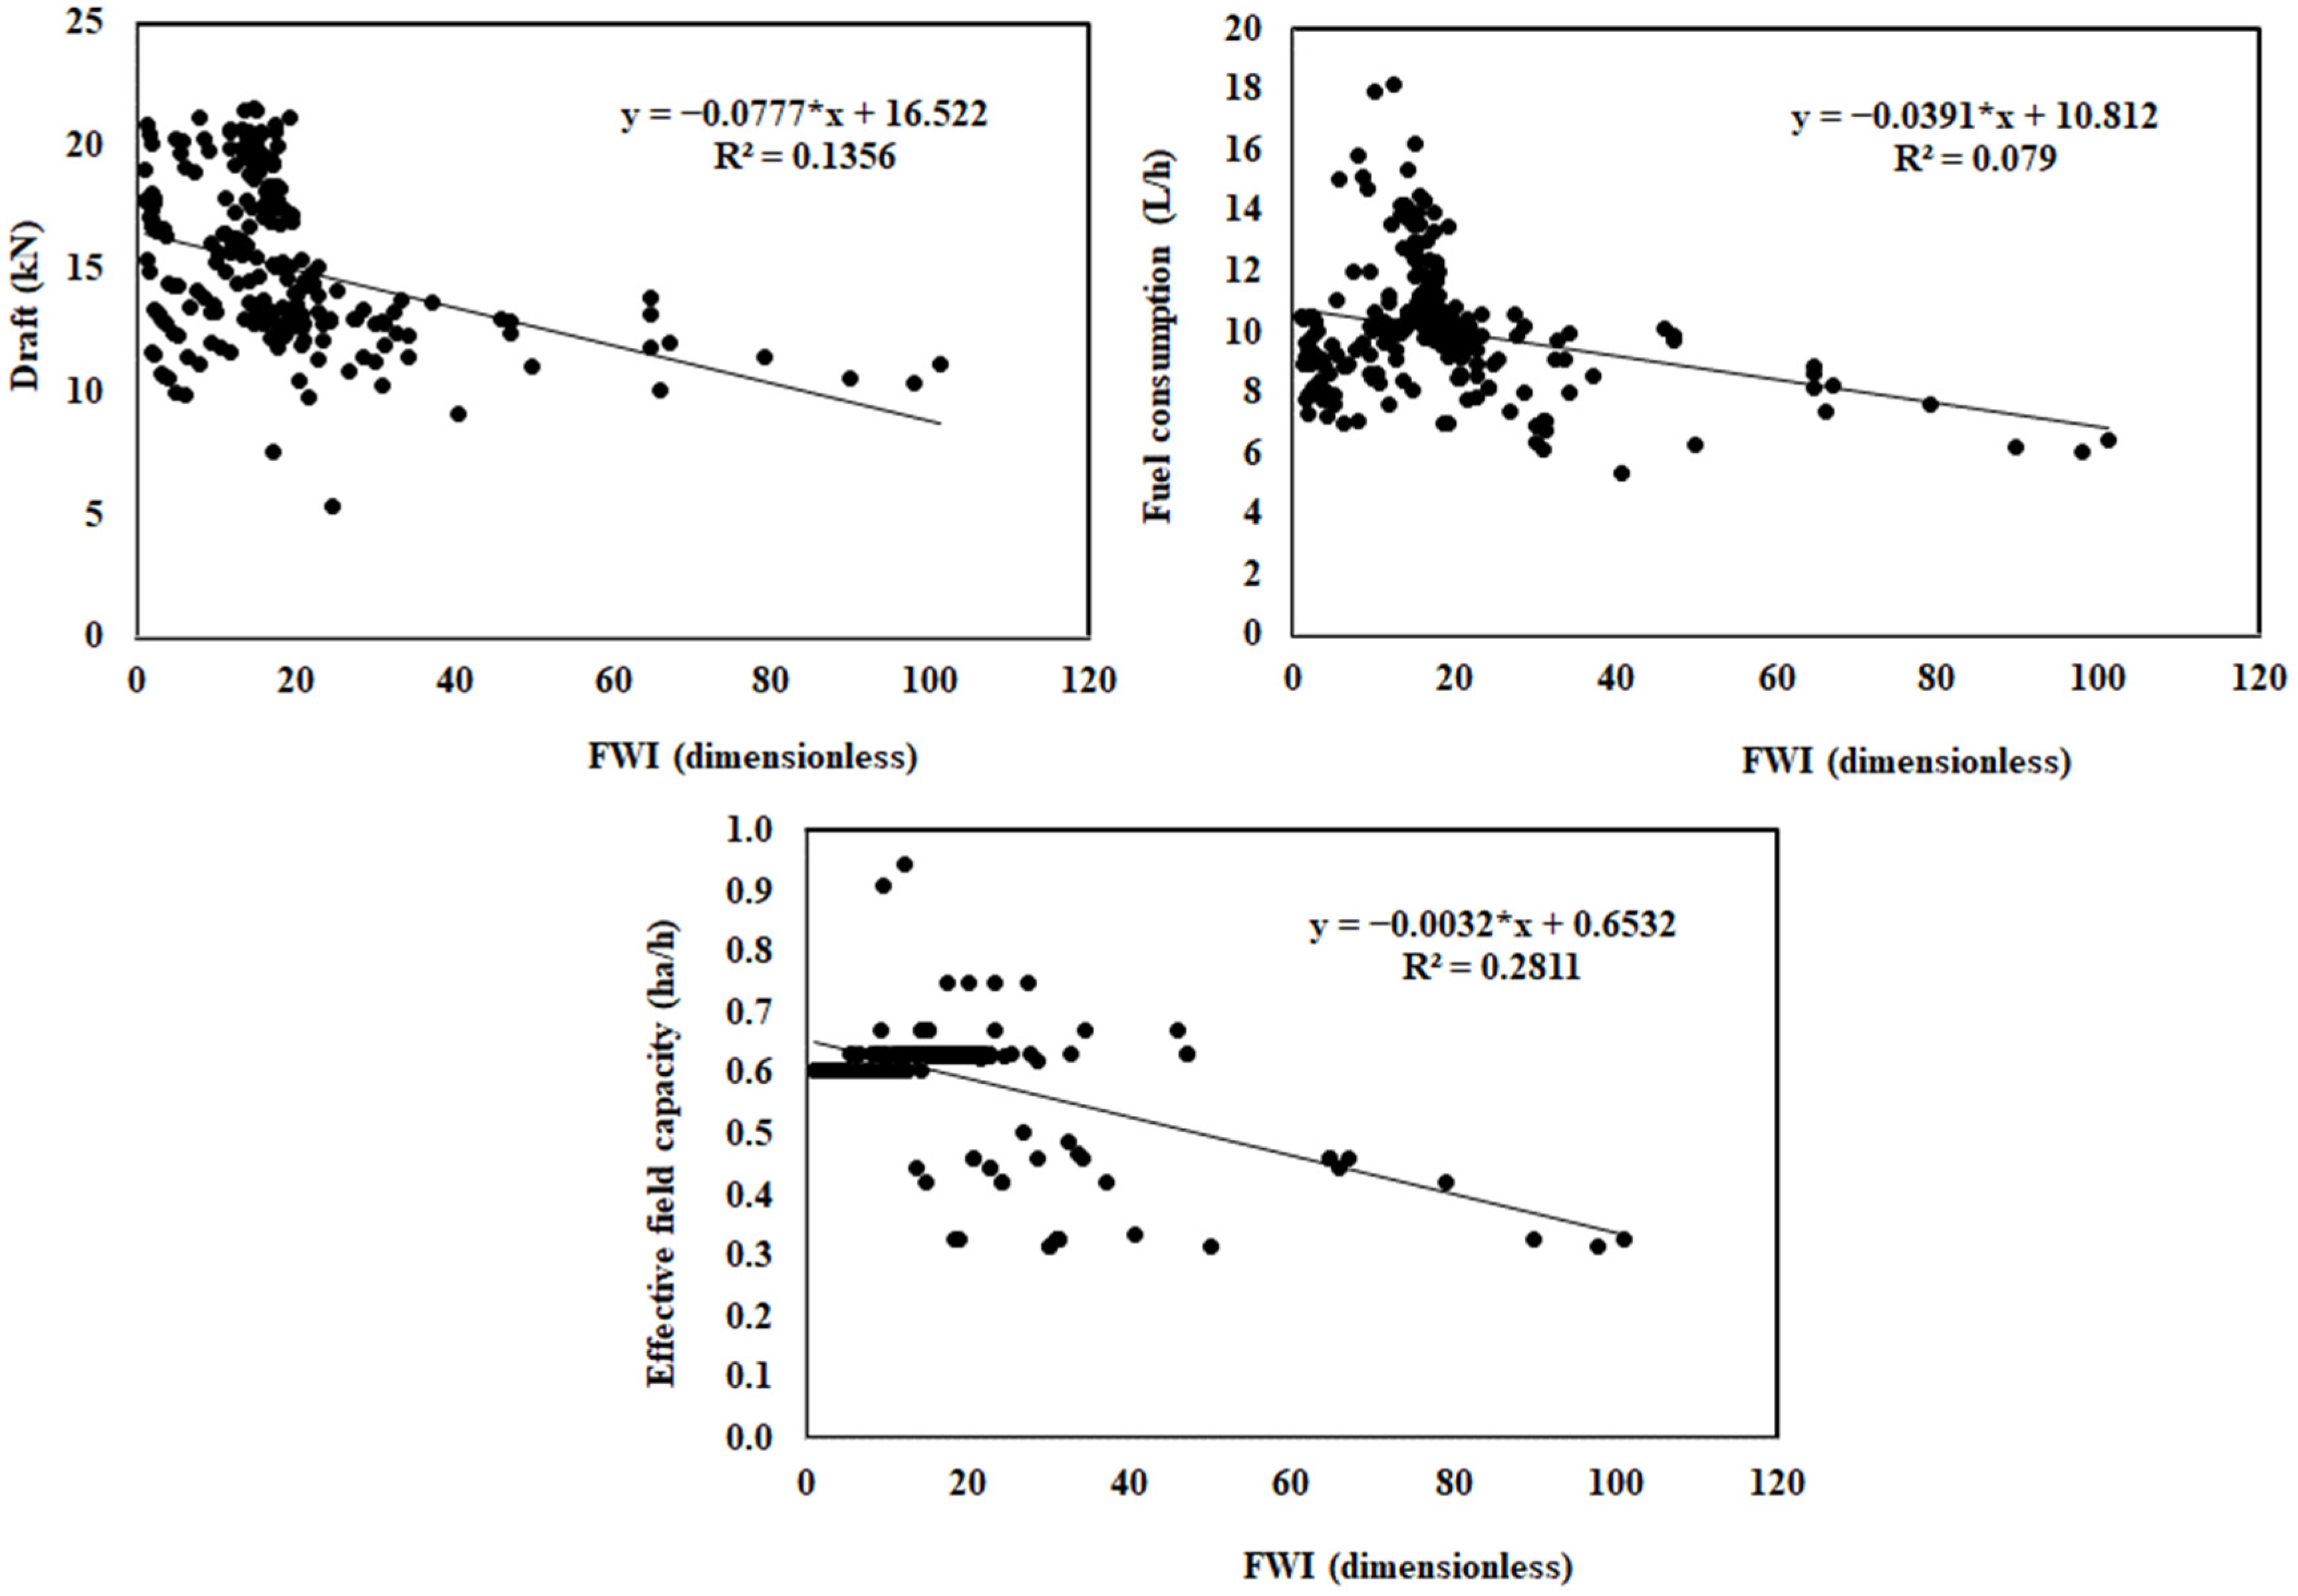
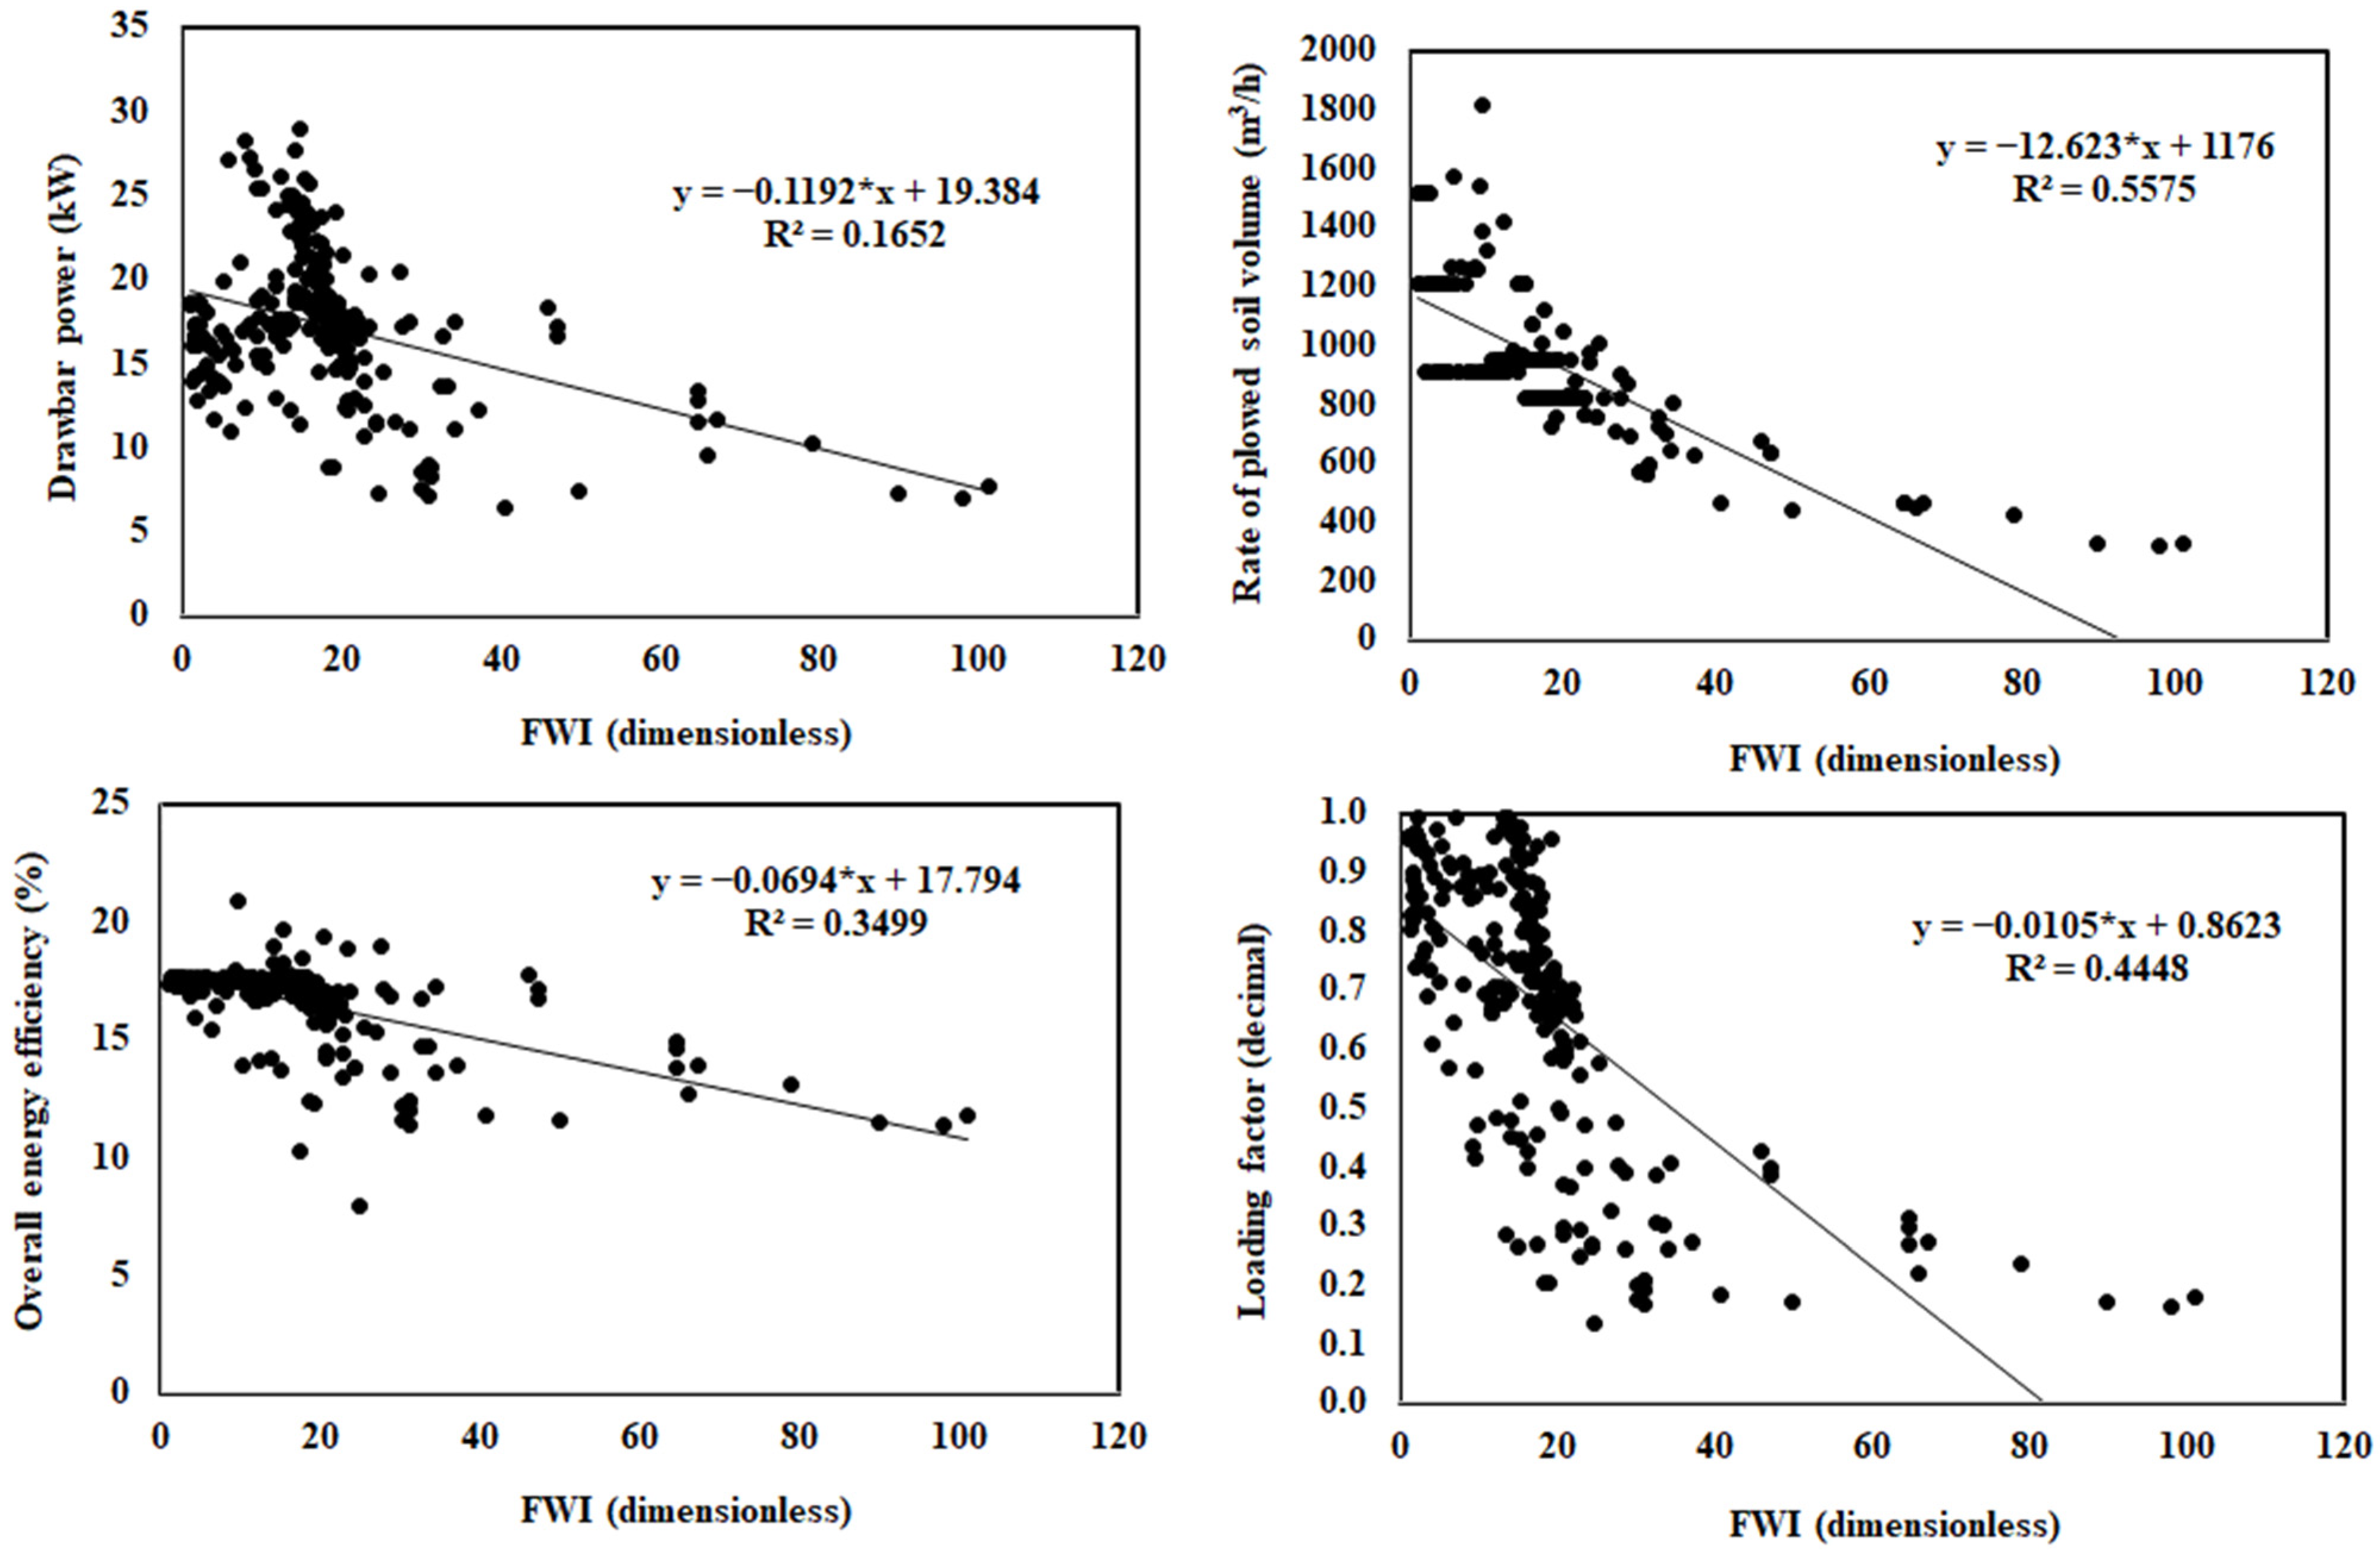
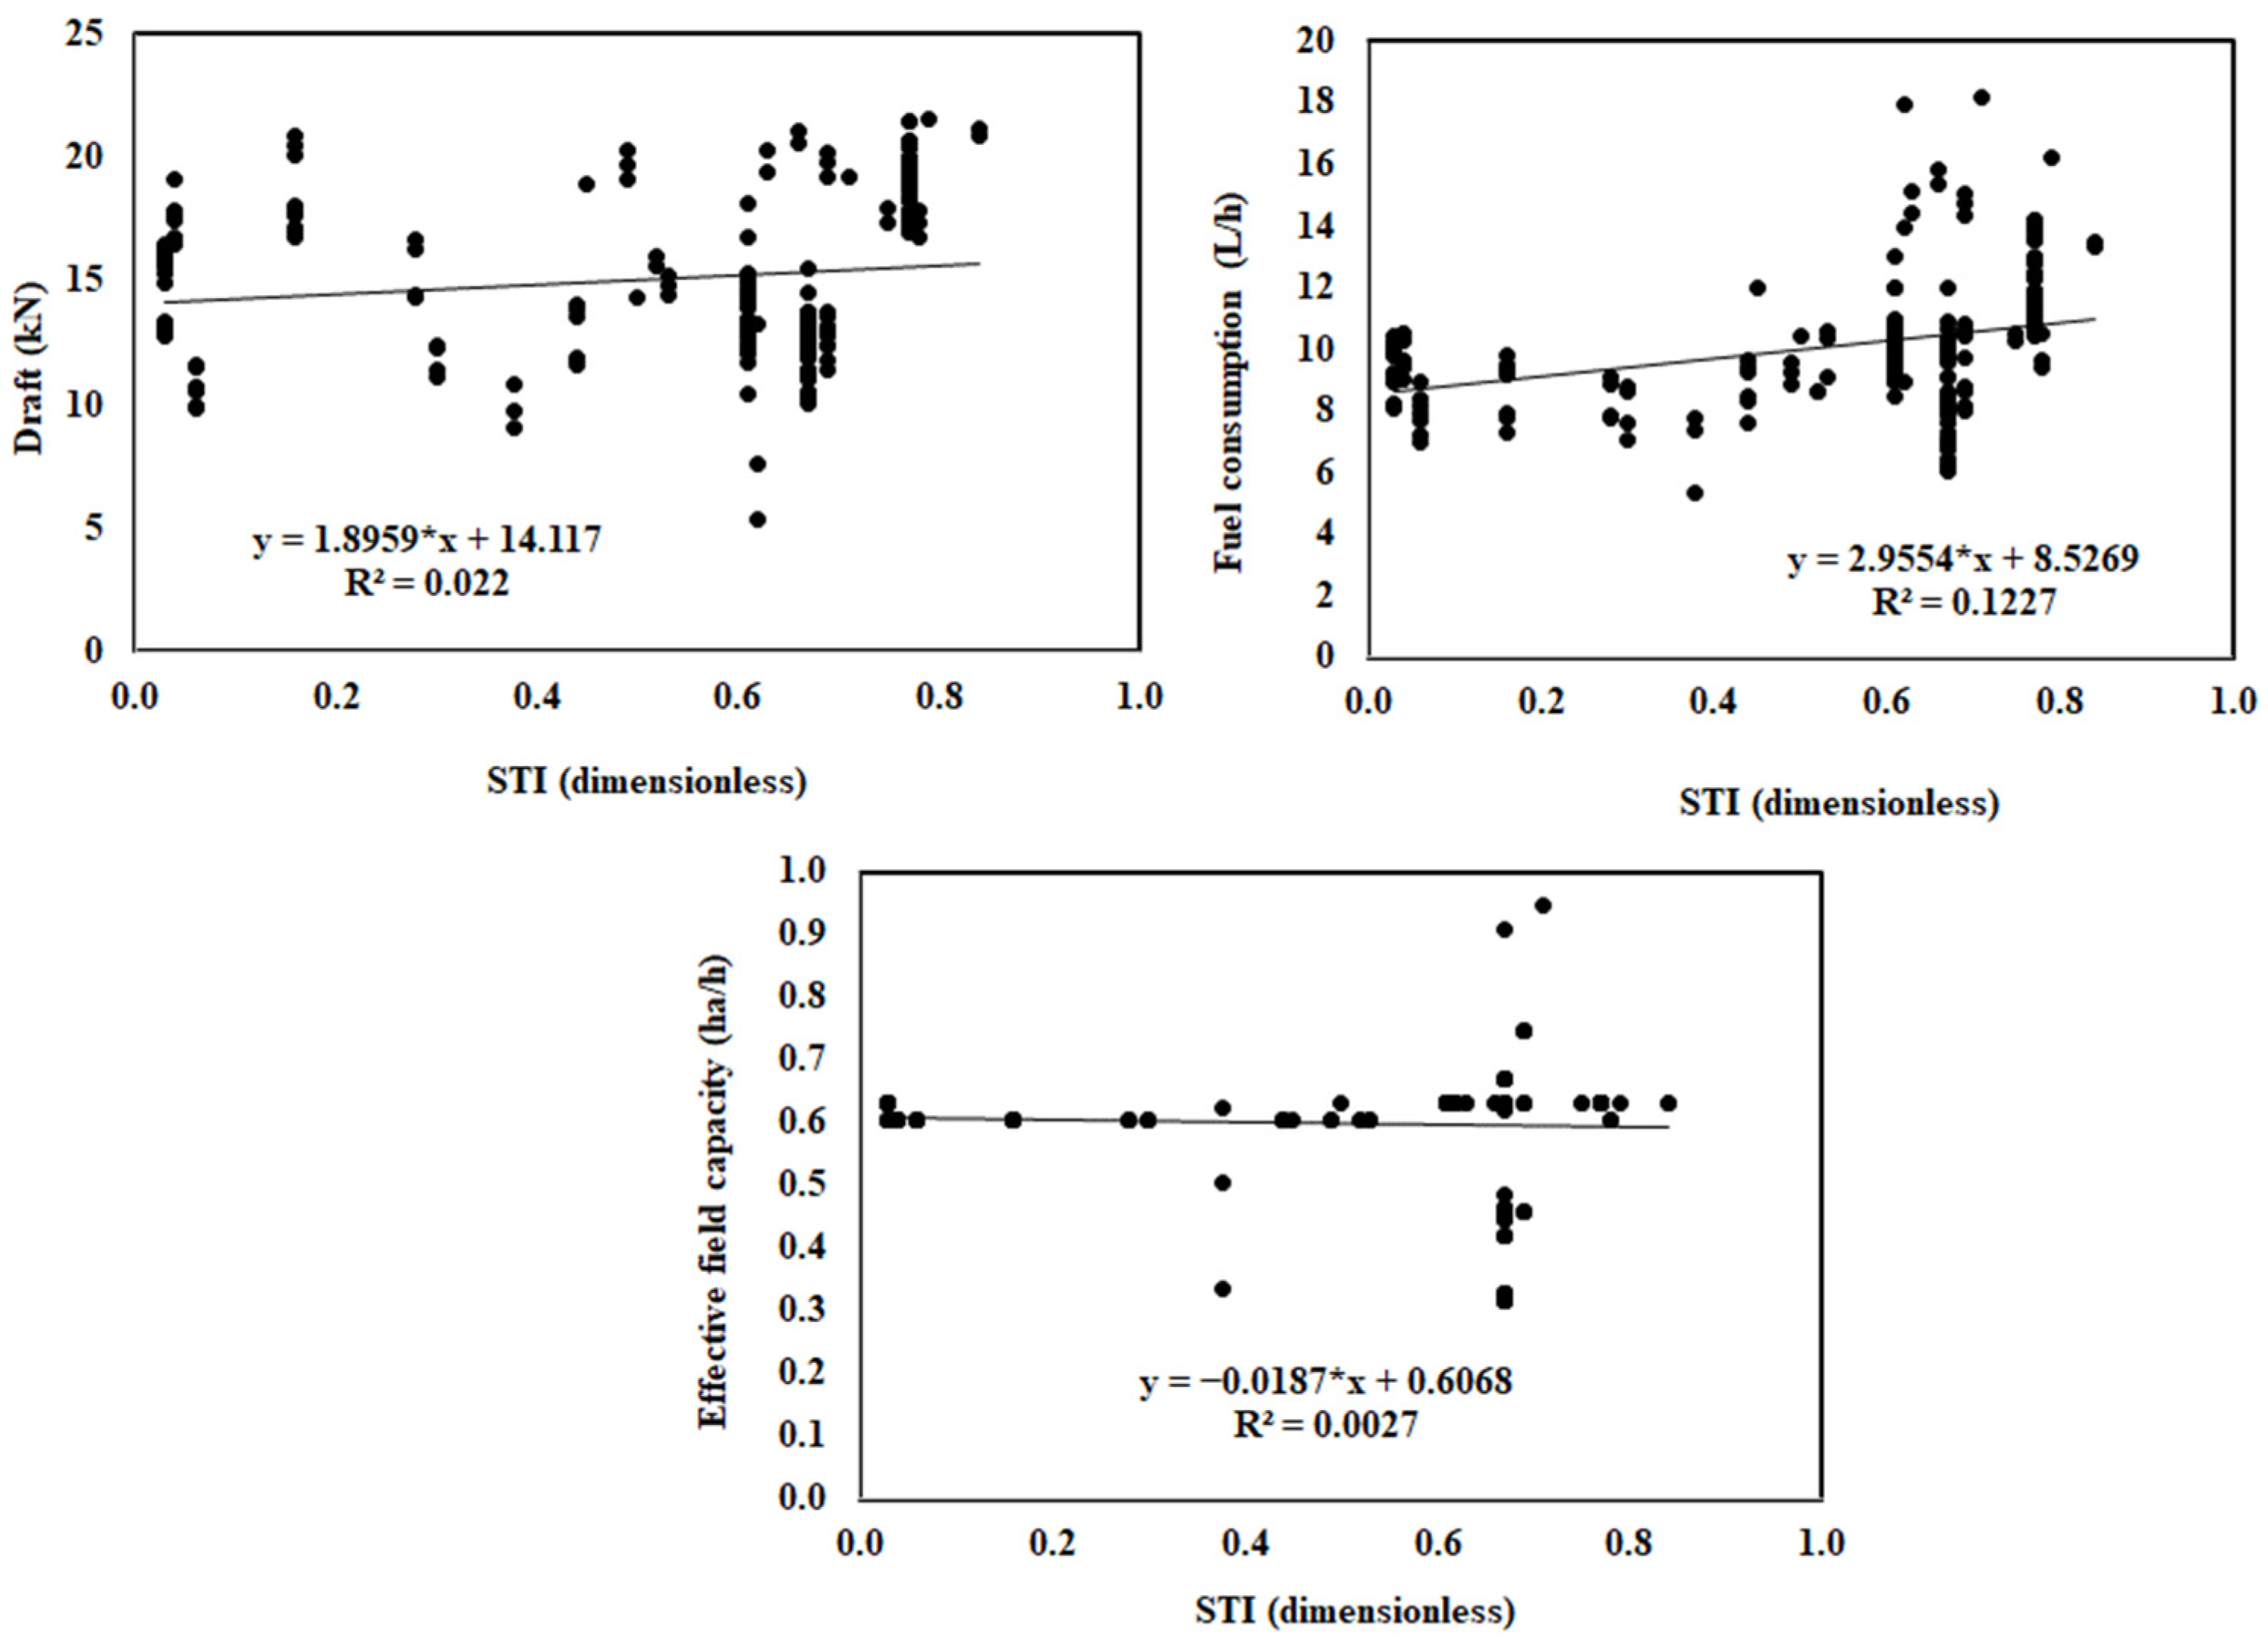
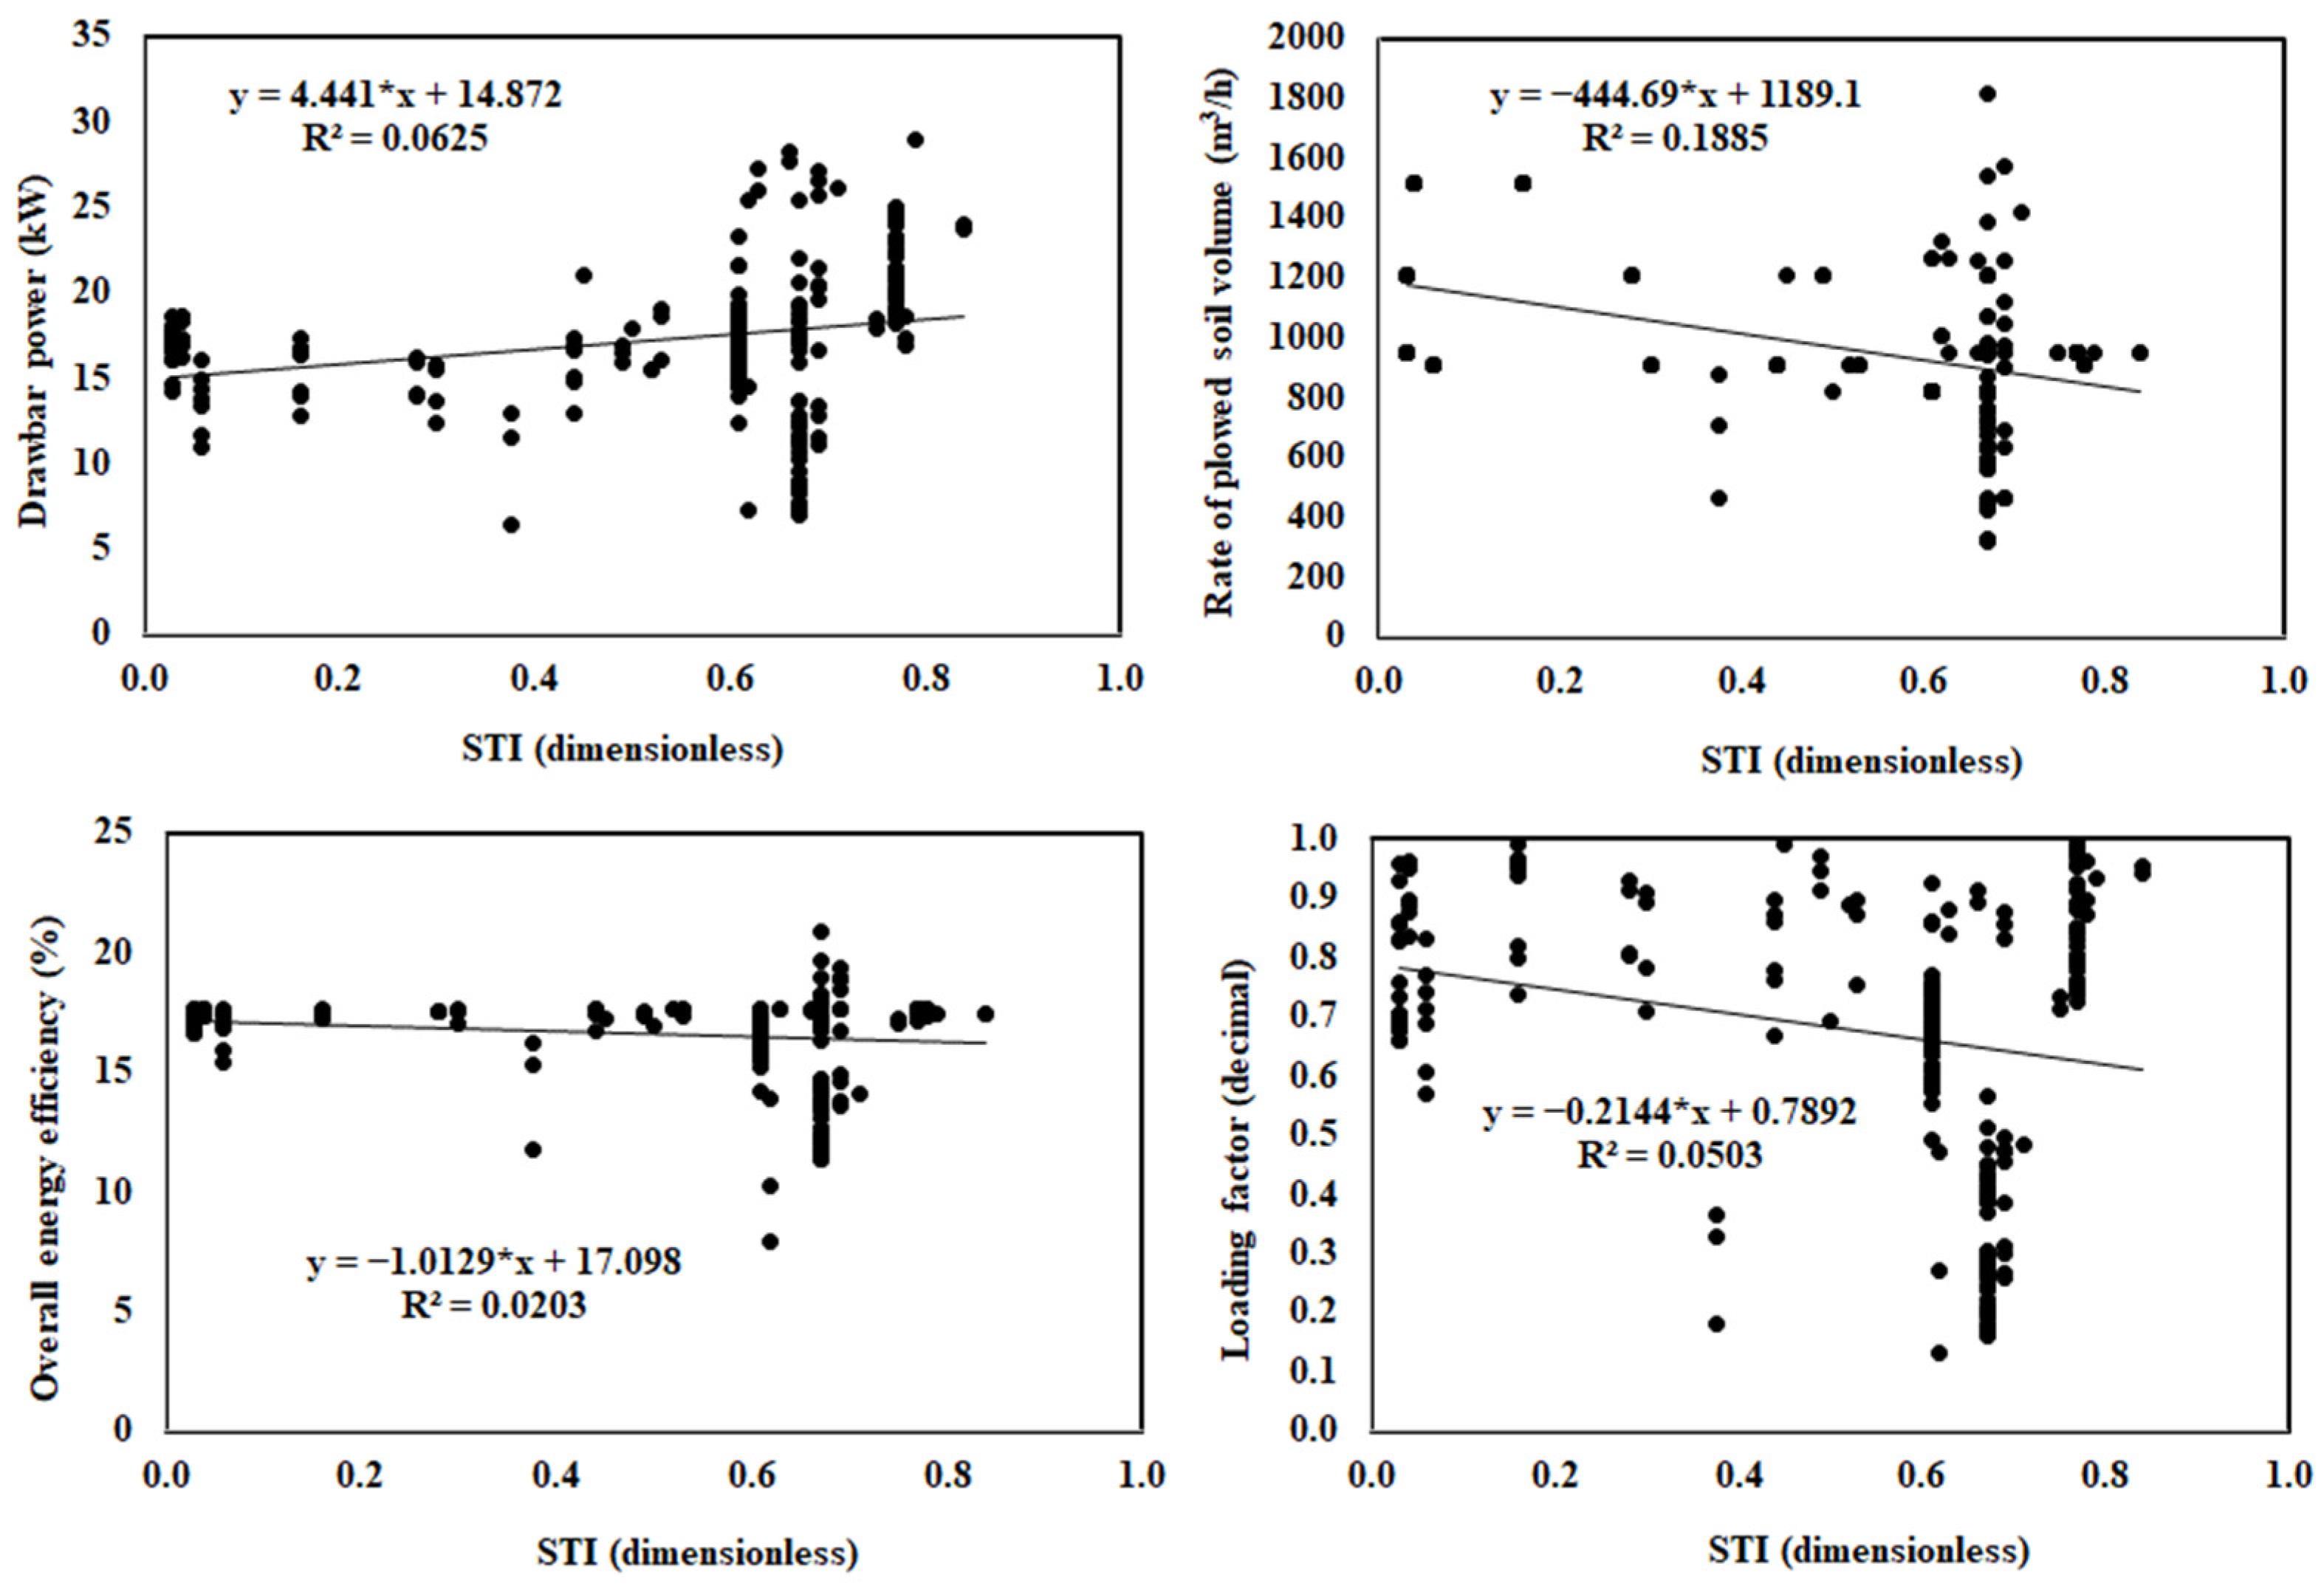
3.1. Data Analysis
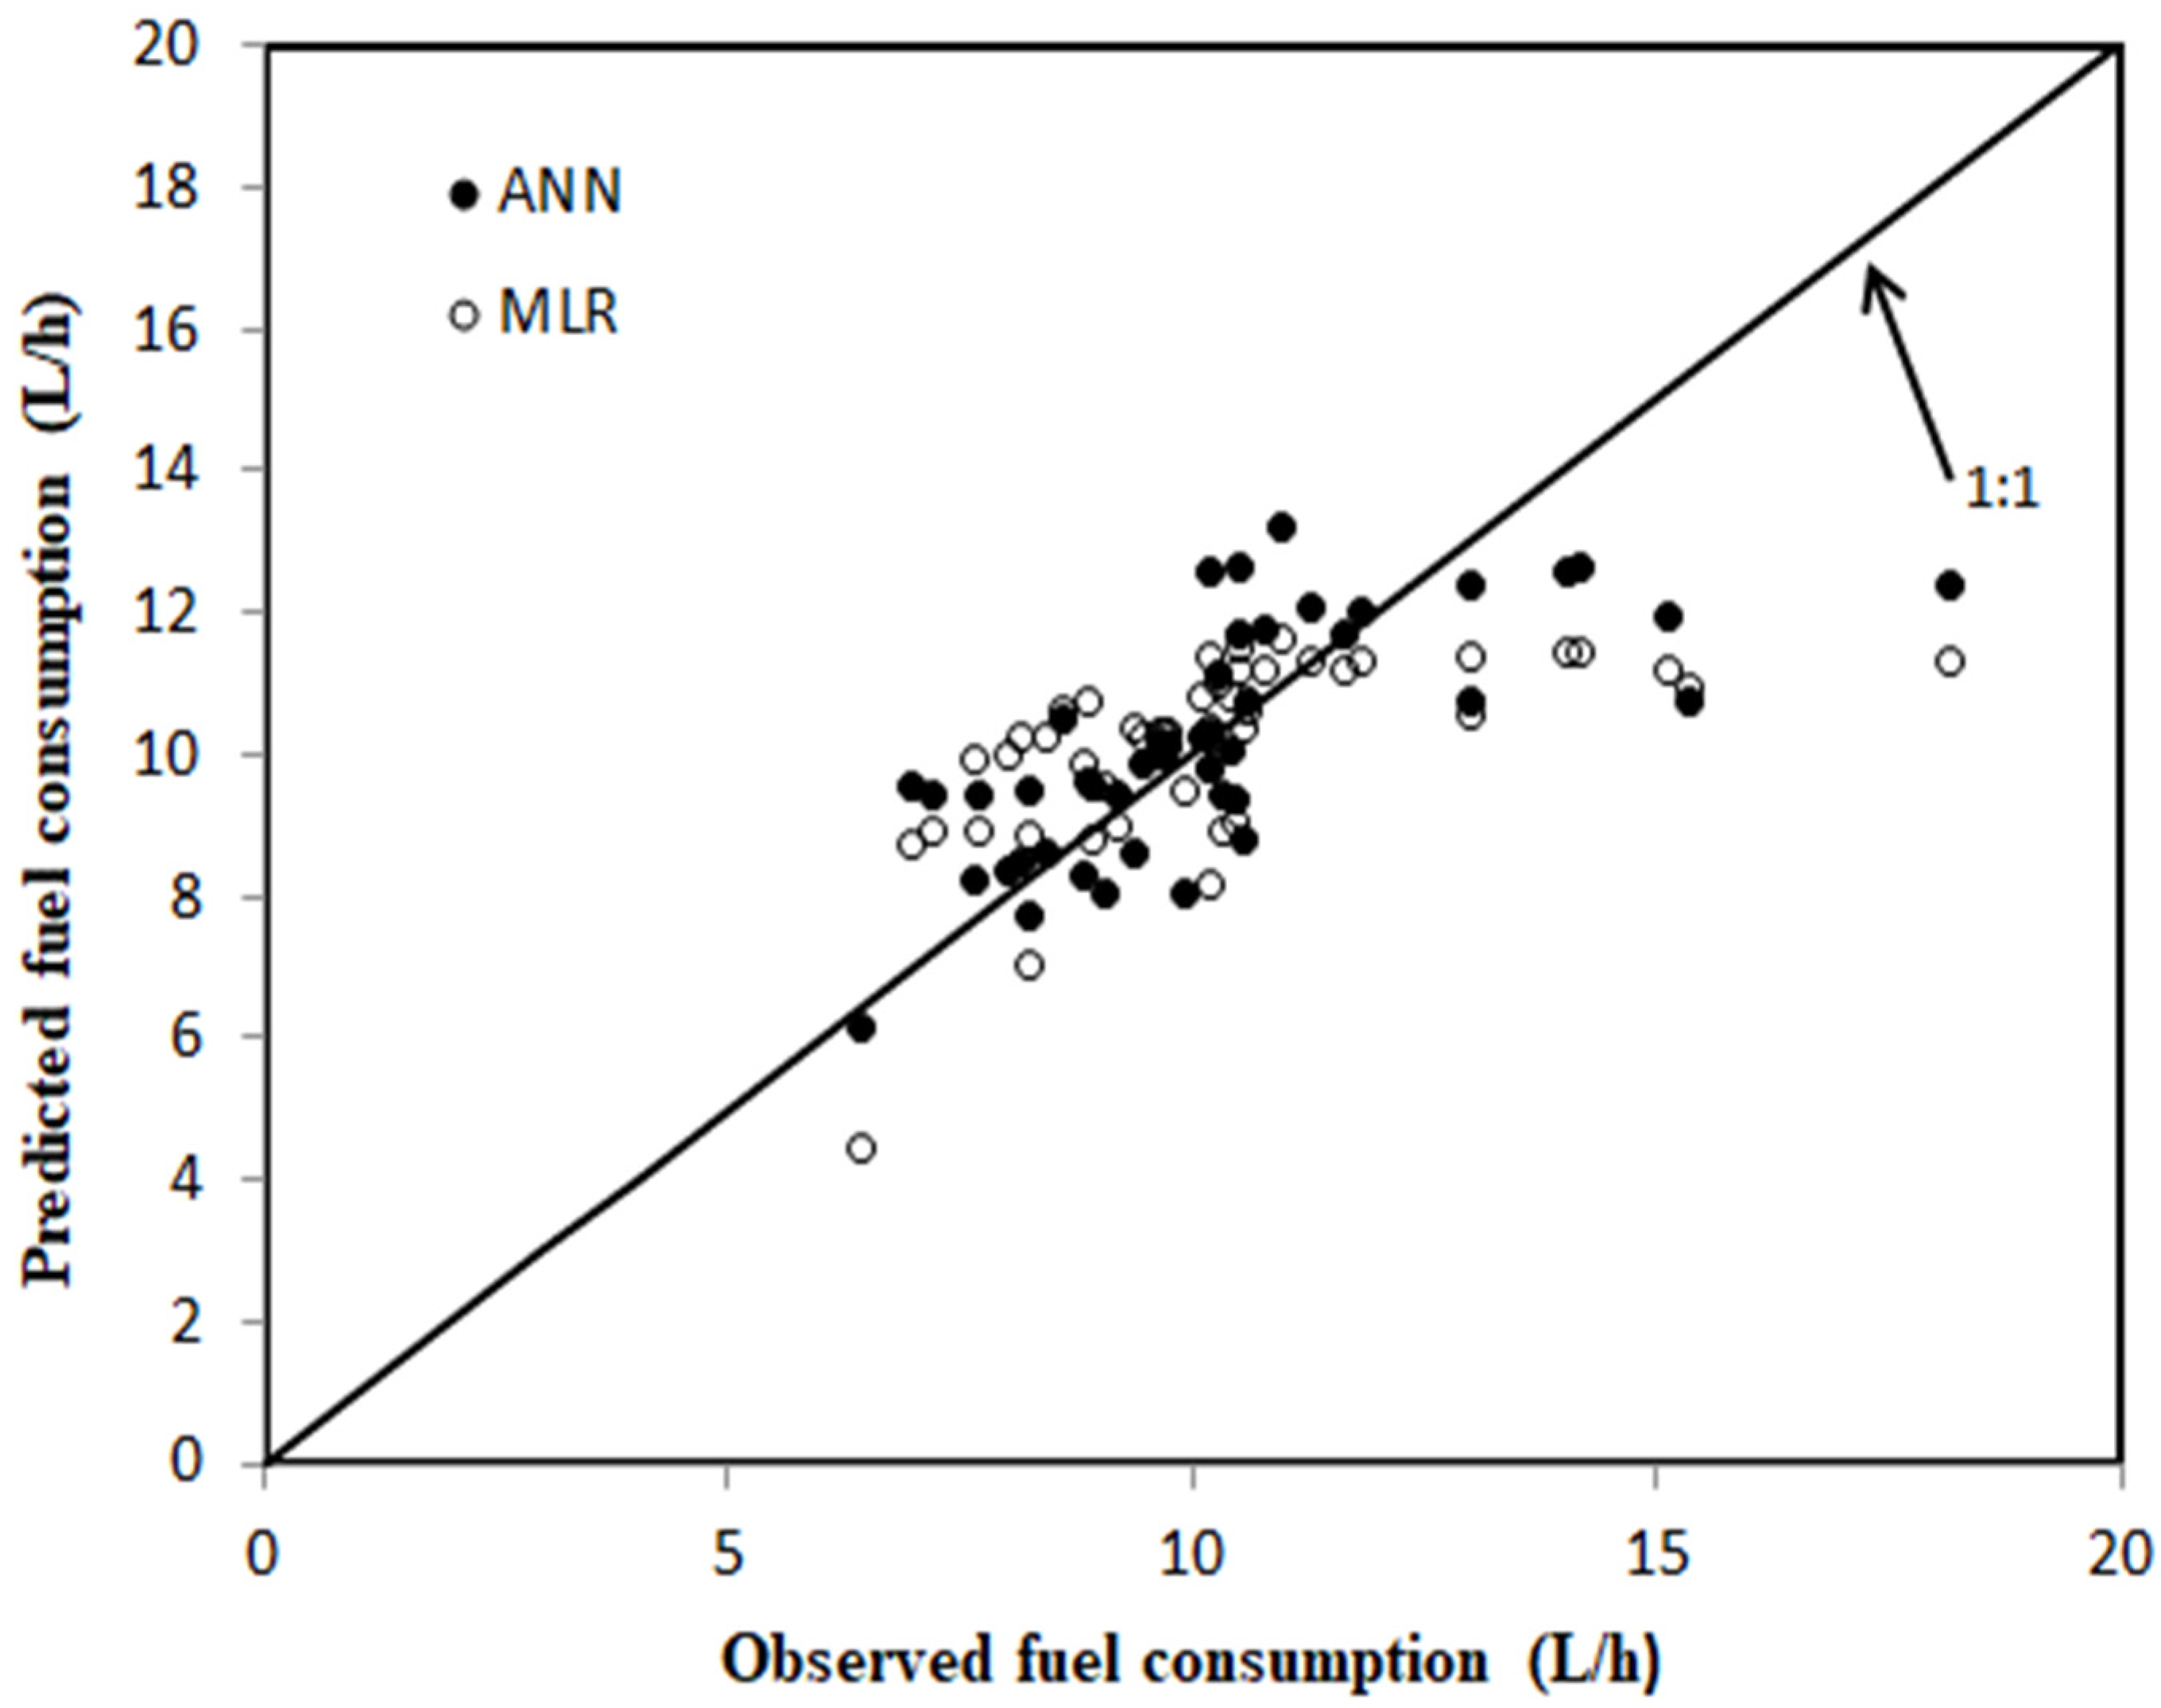
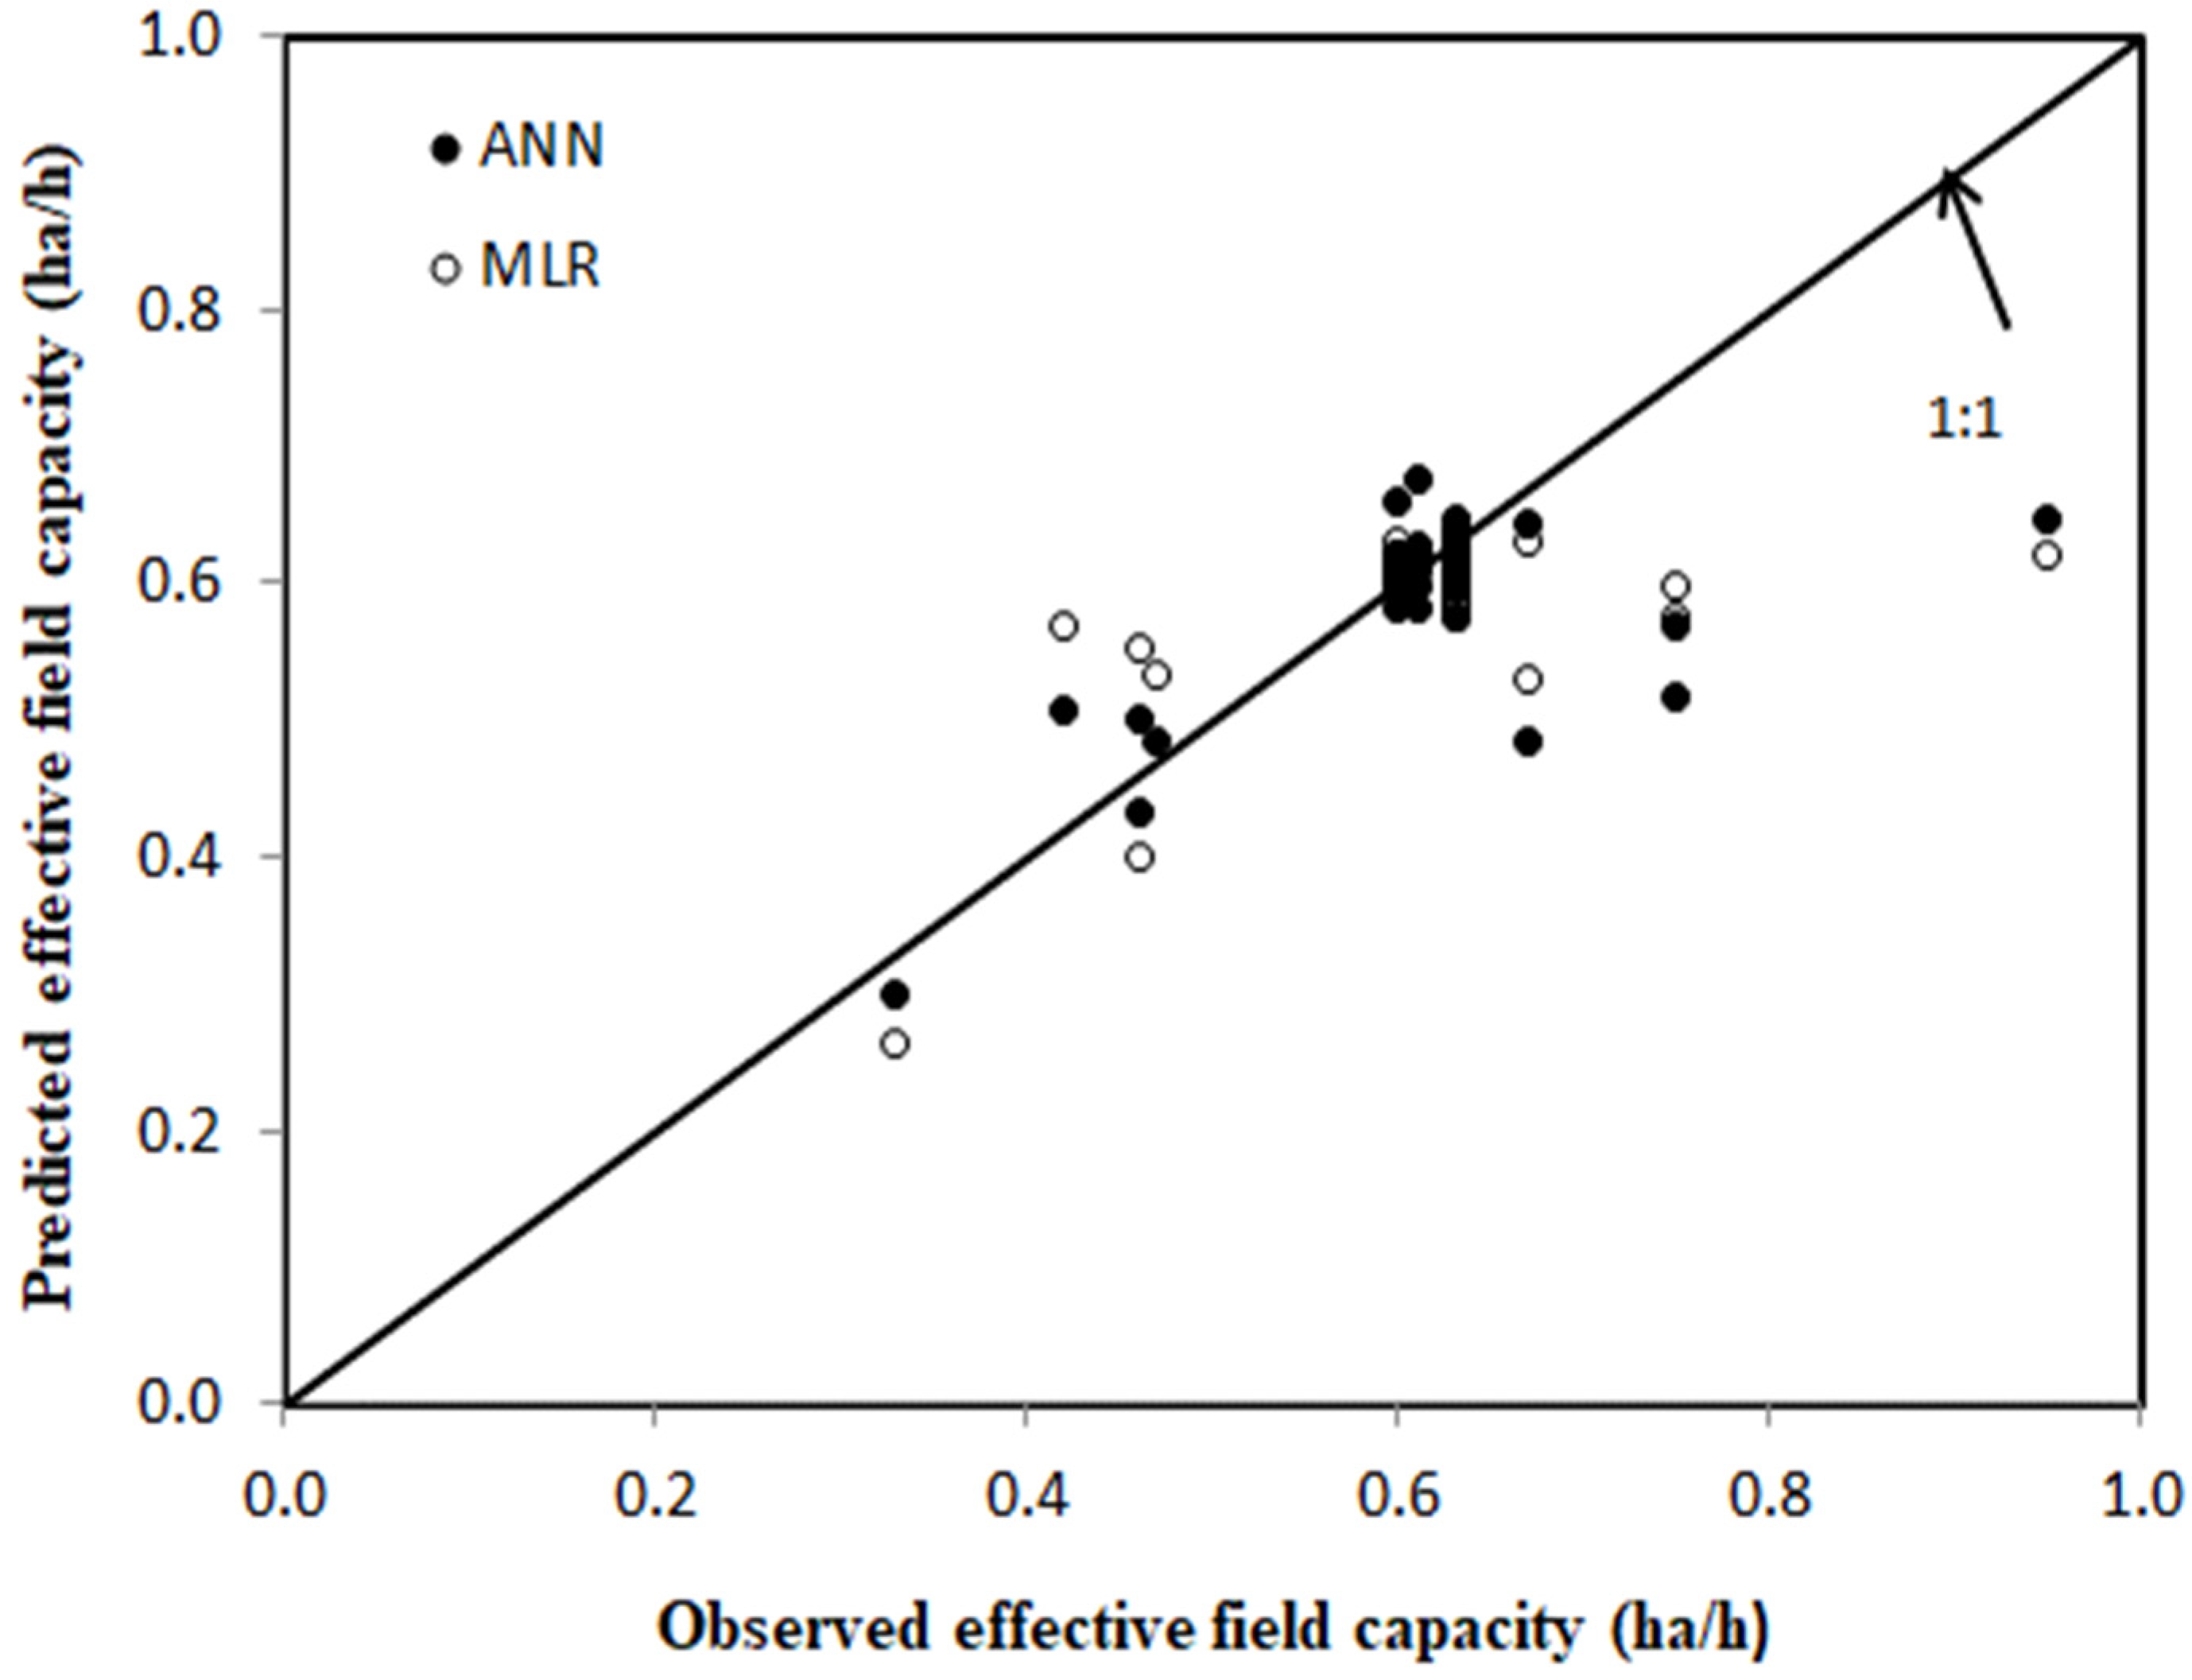
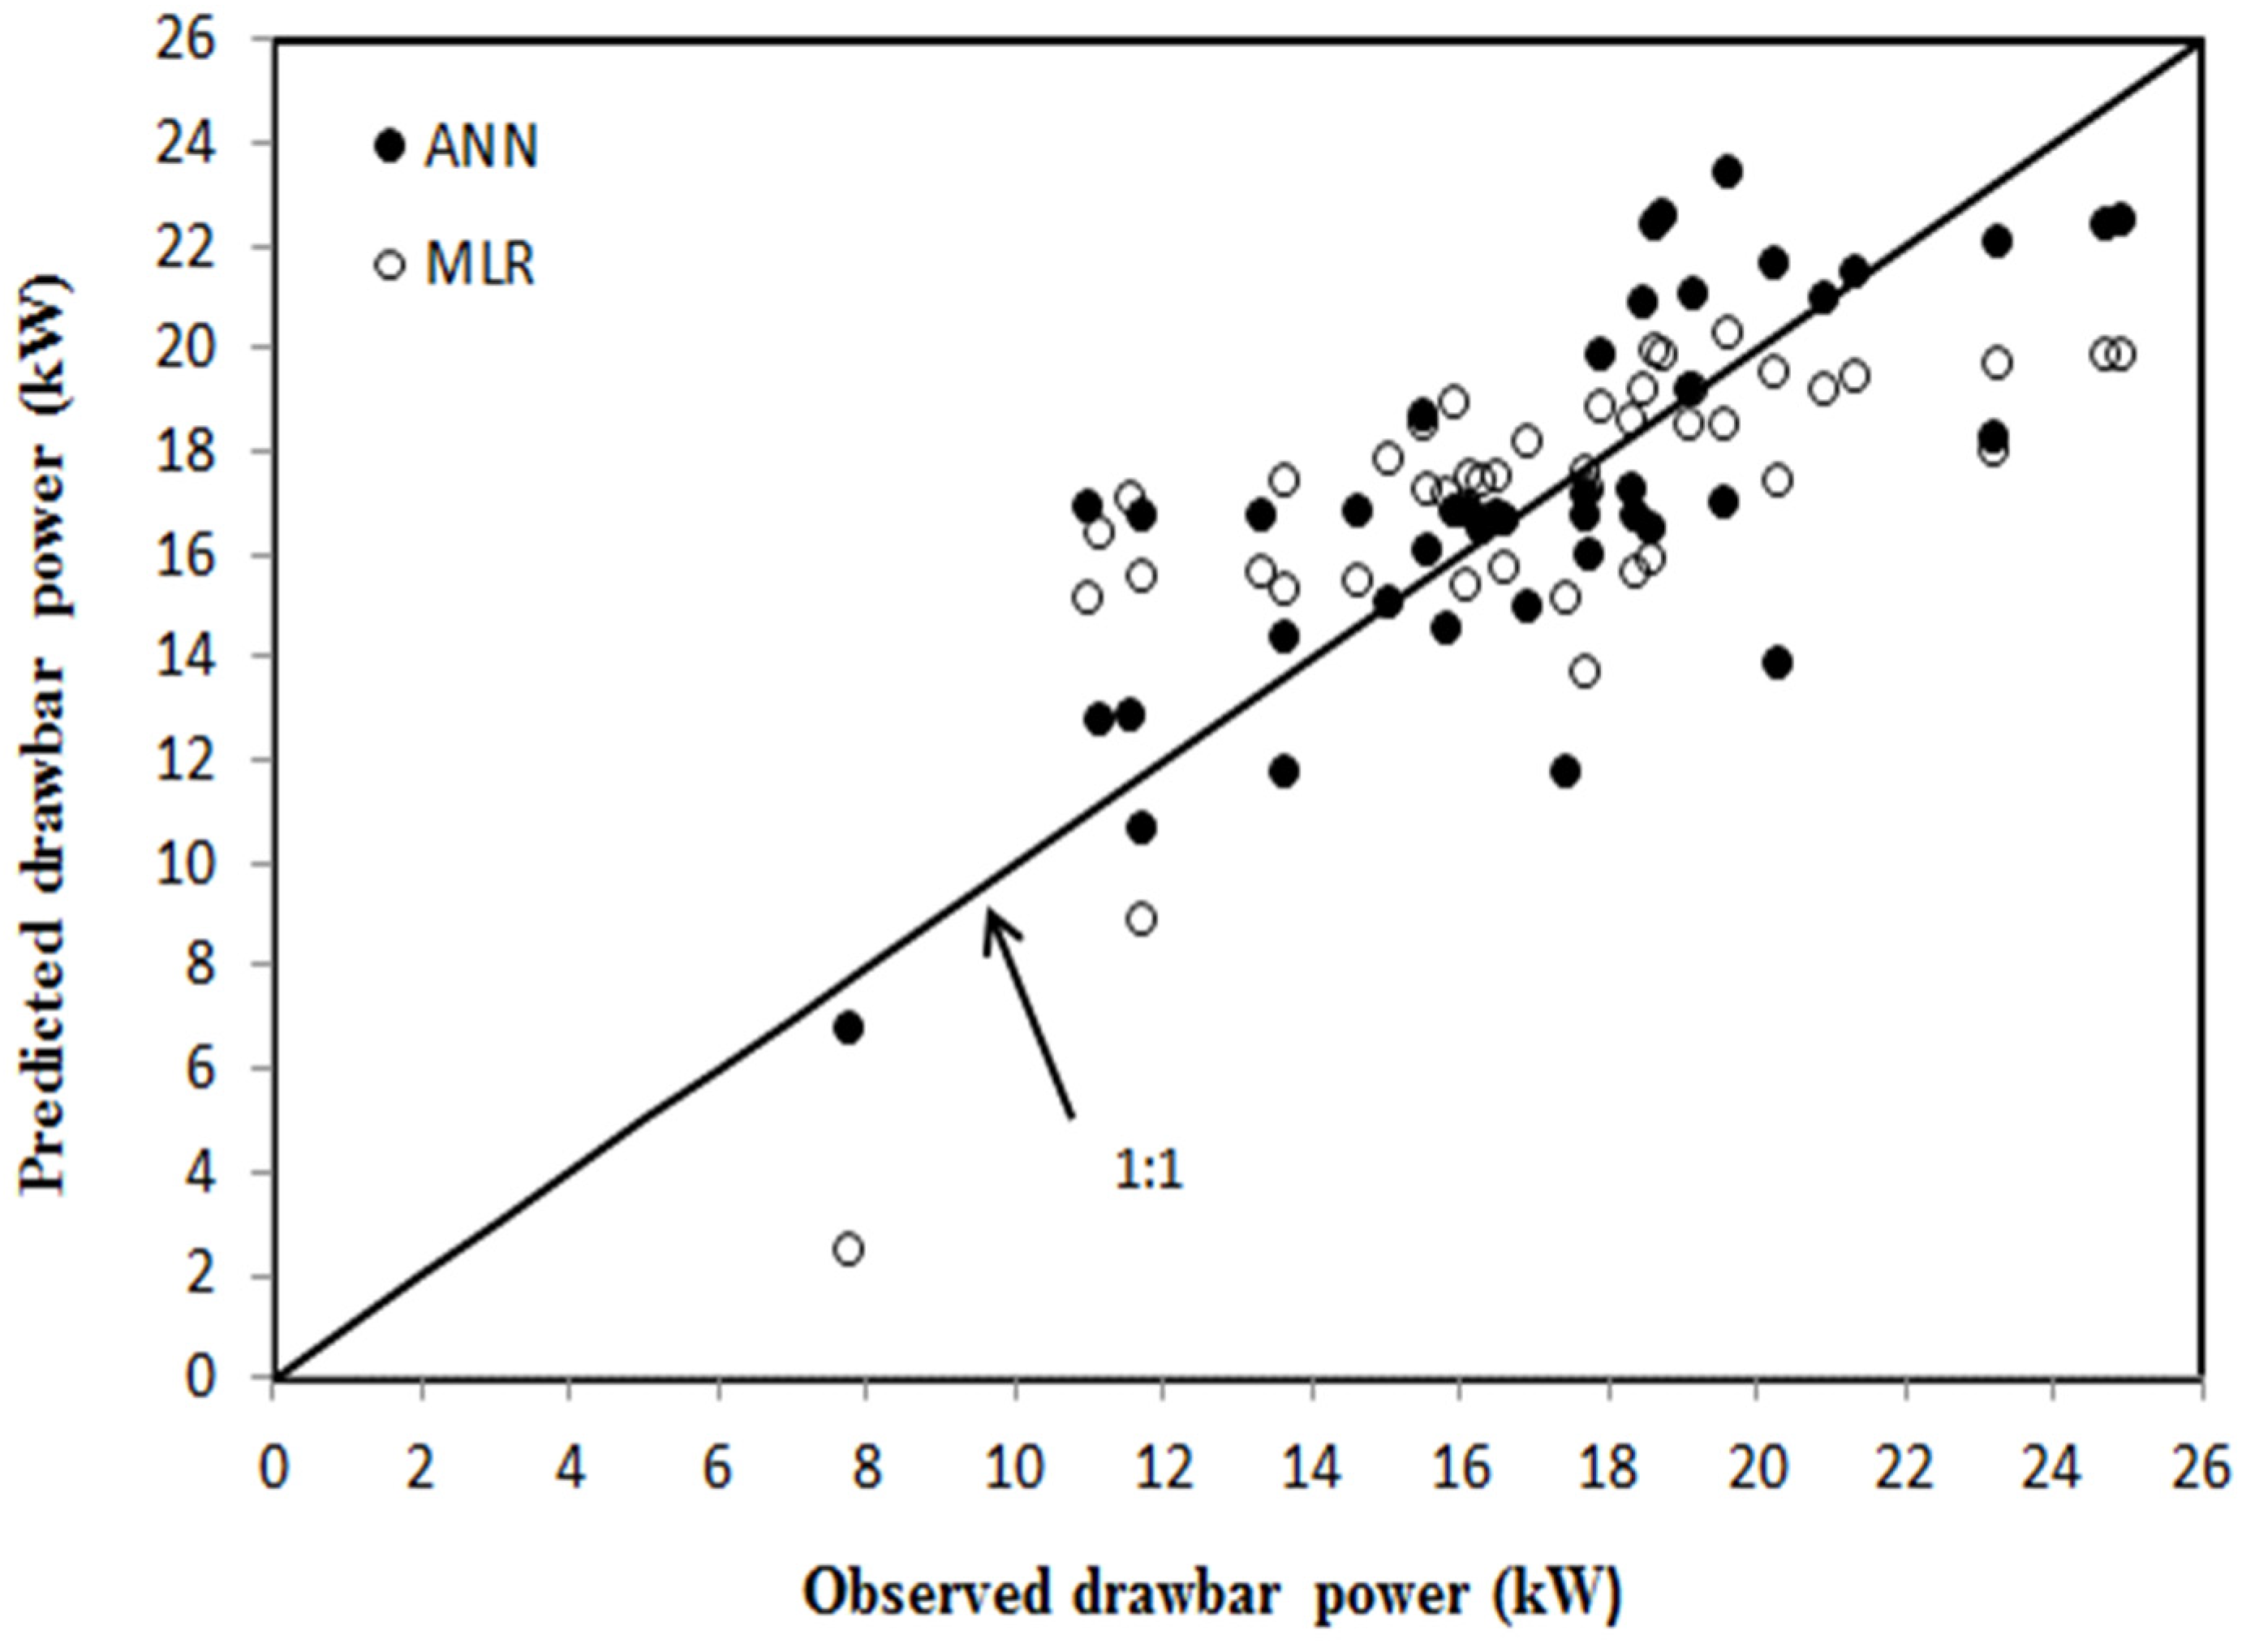
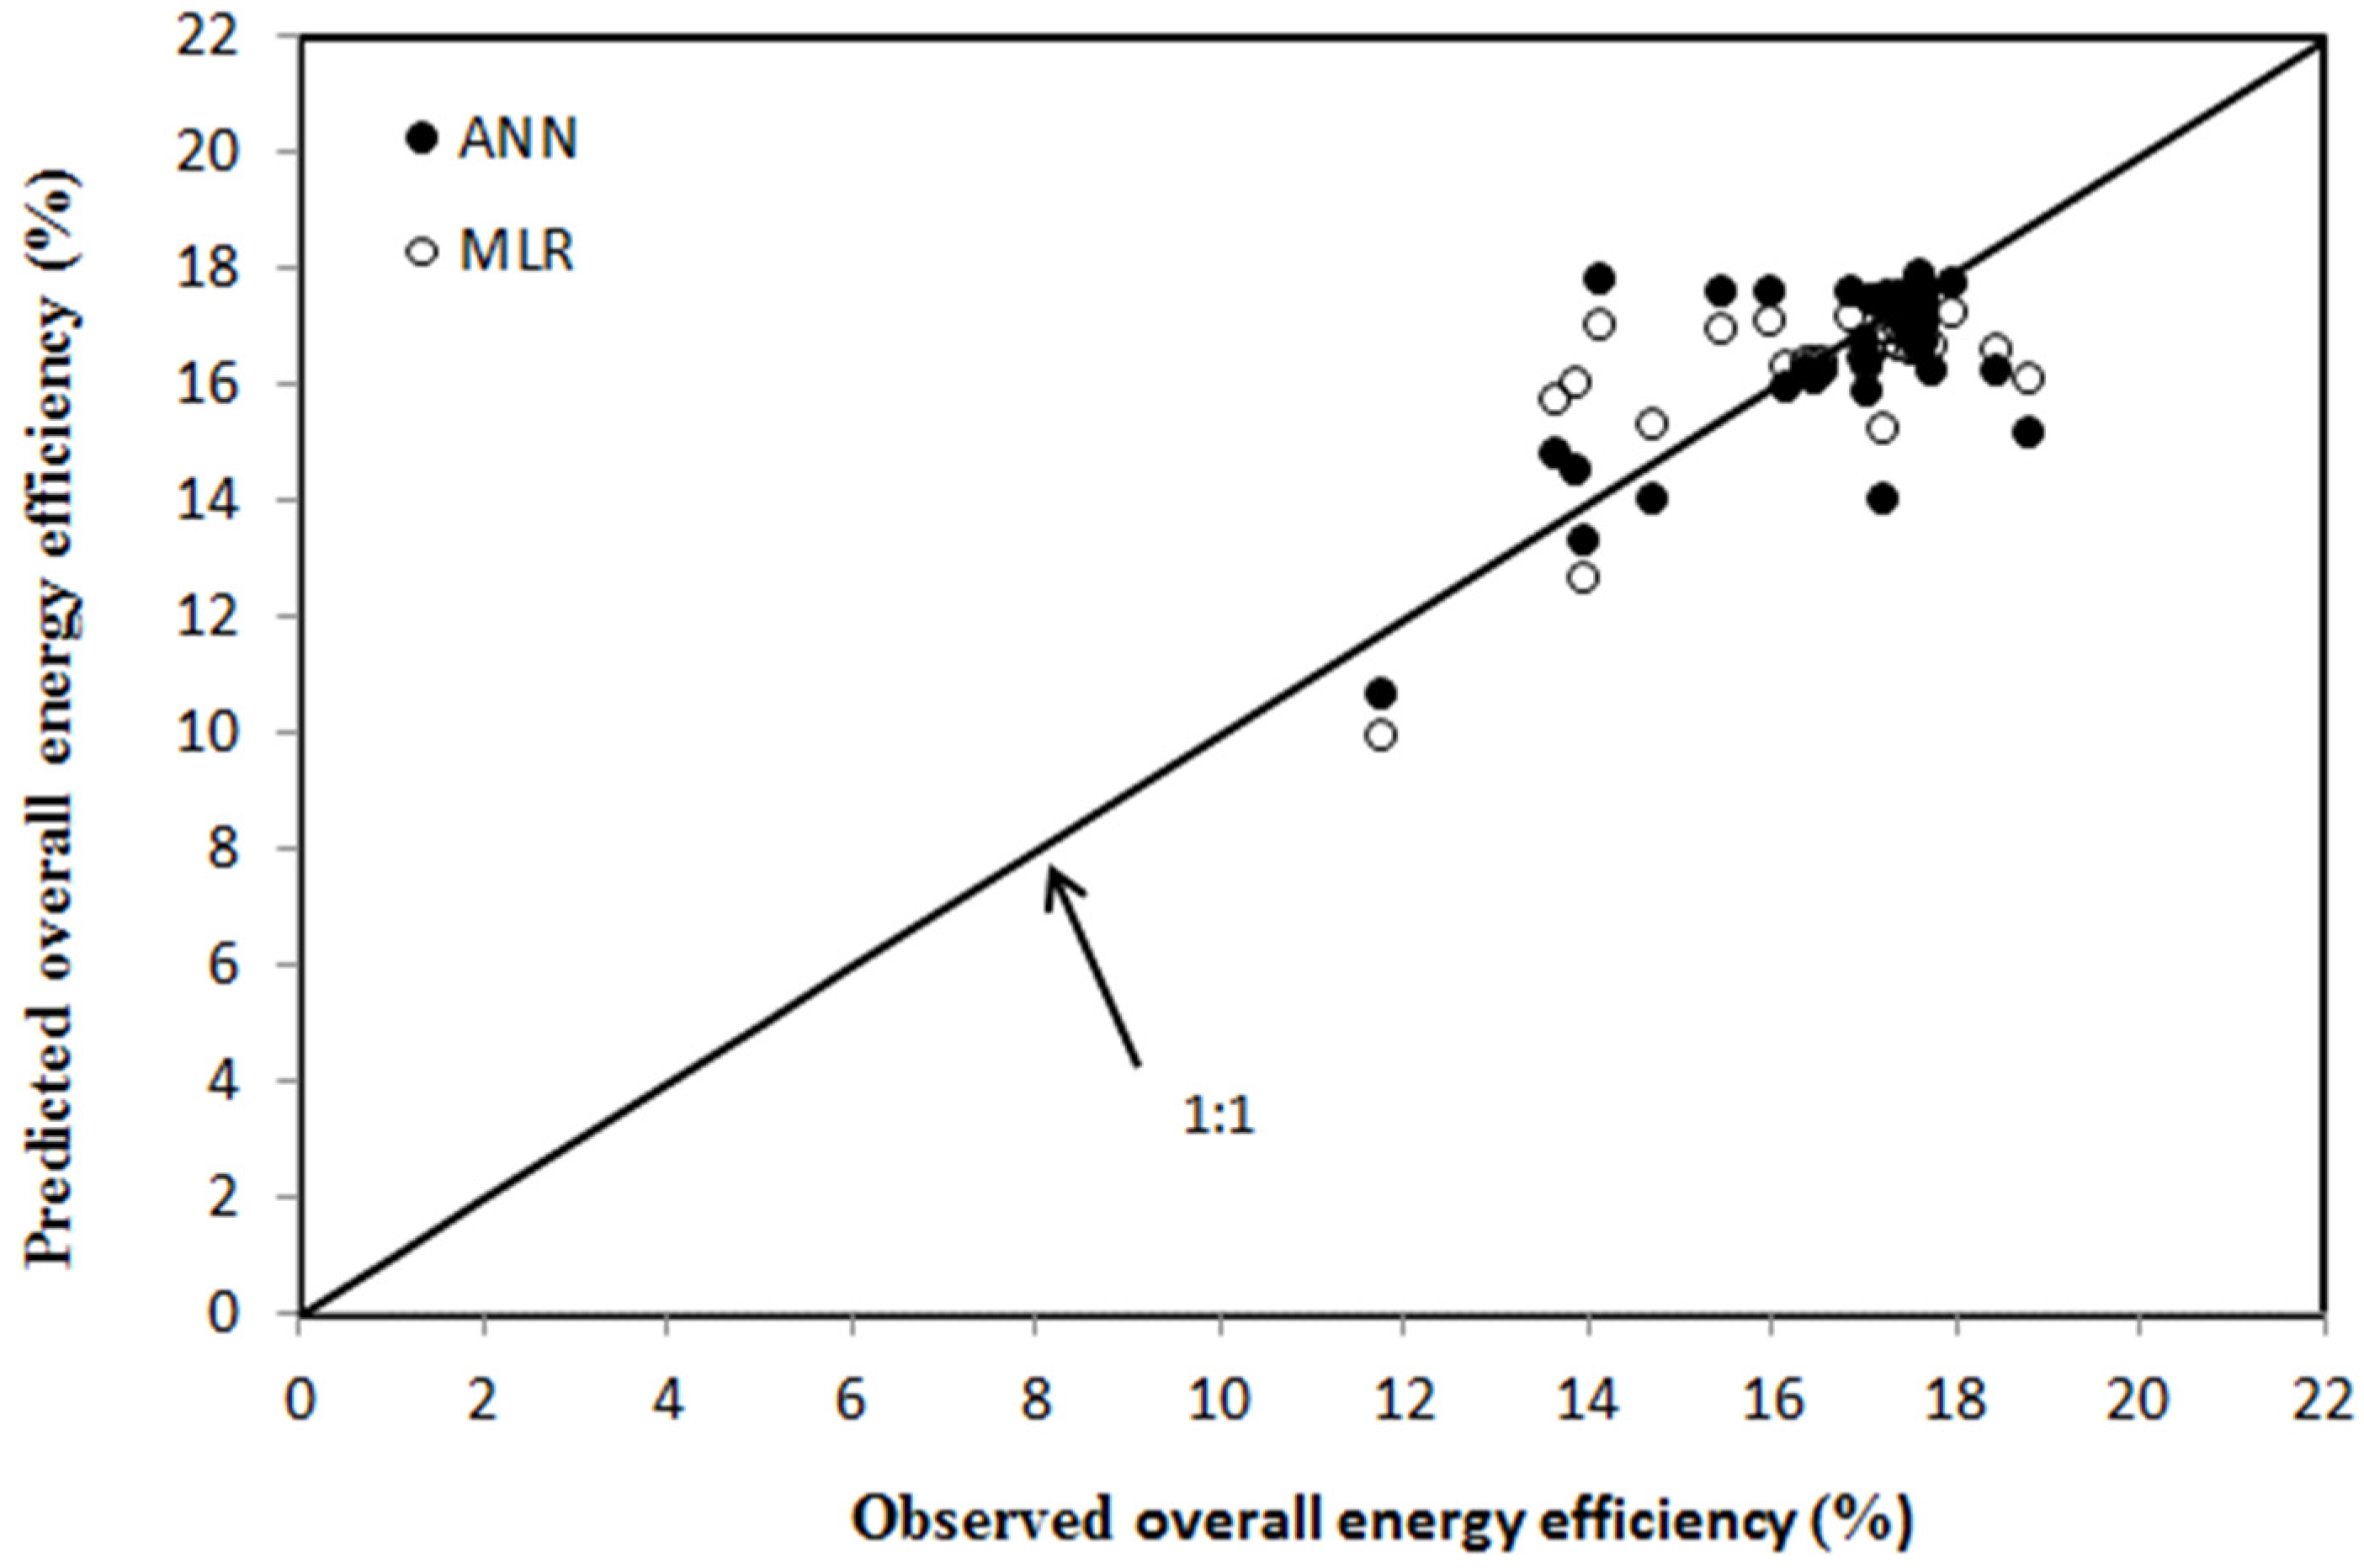
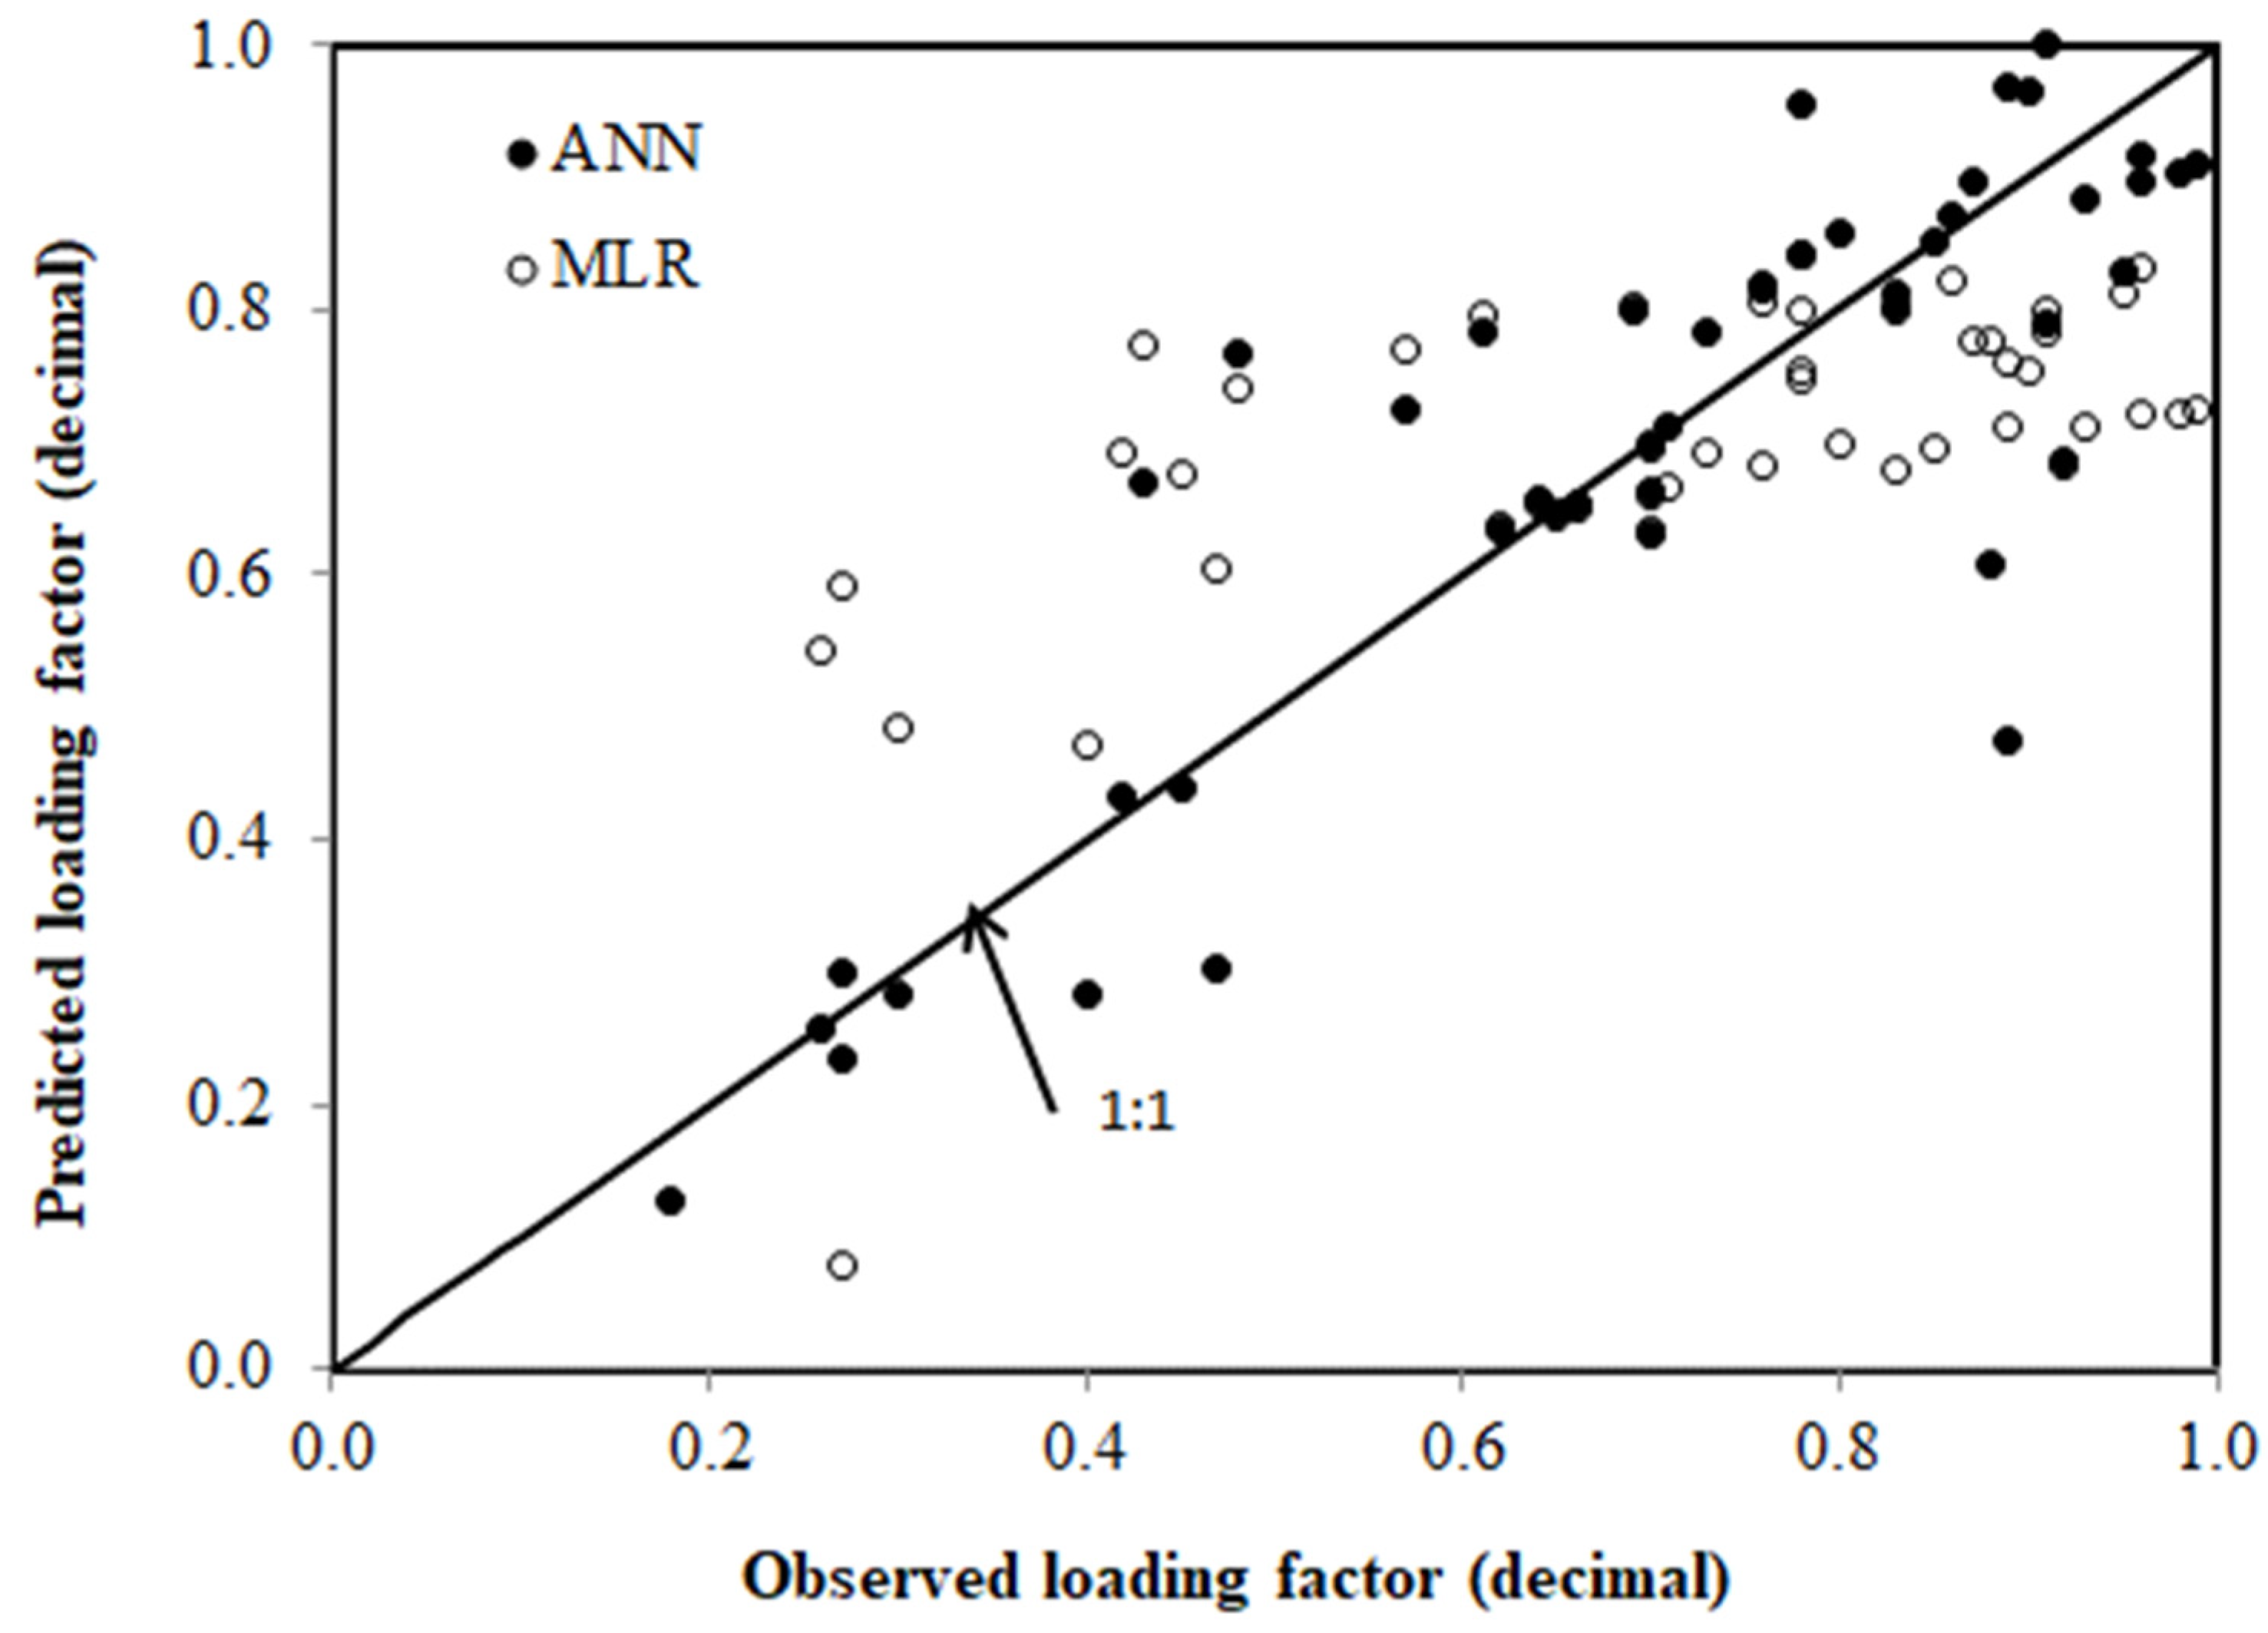
3.2. Evaluation of Investigated ANN and MLR Models for Prediction Performance Attributes
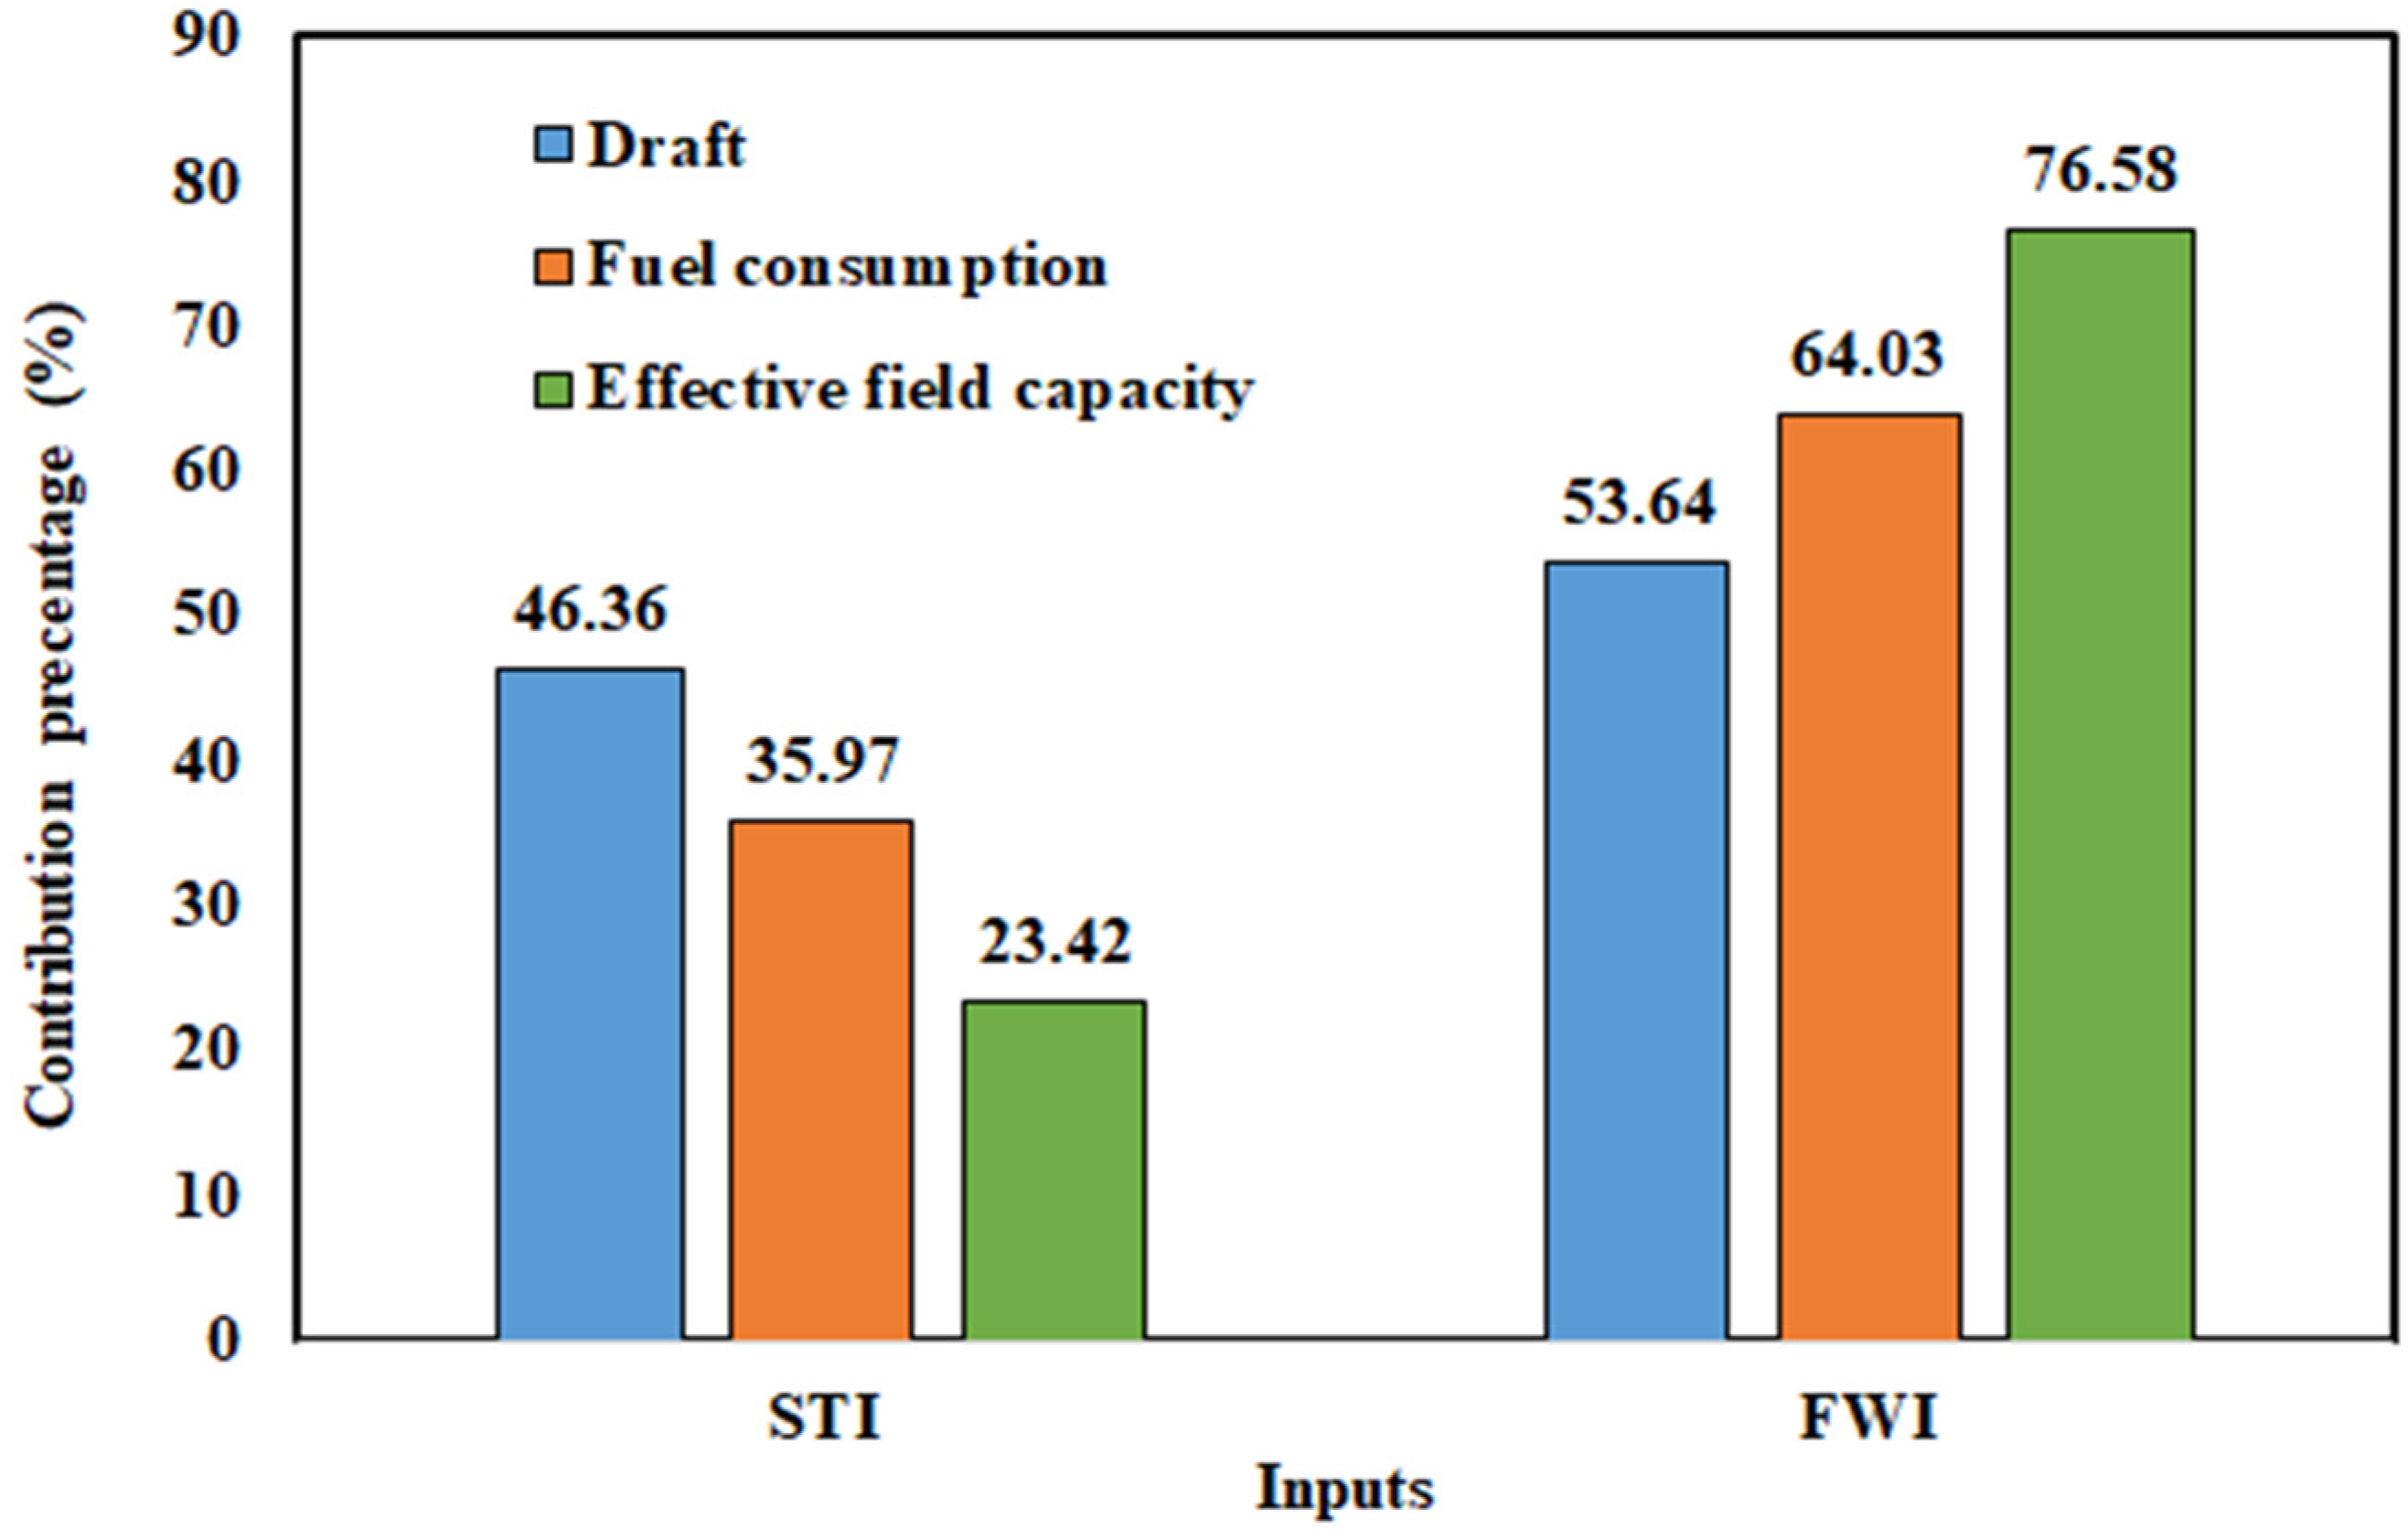
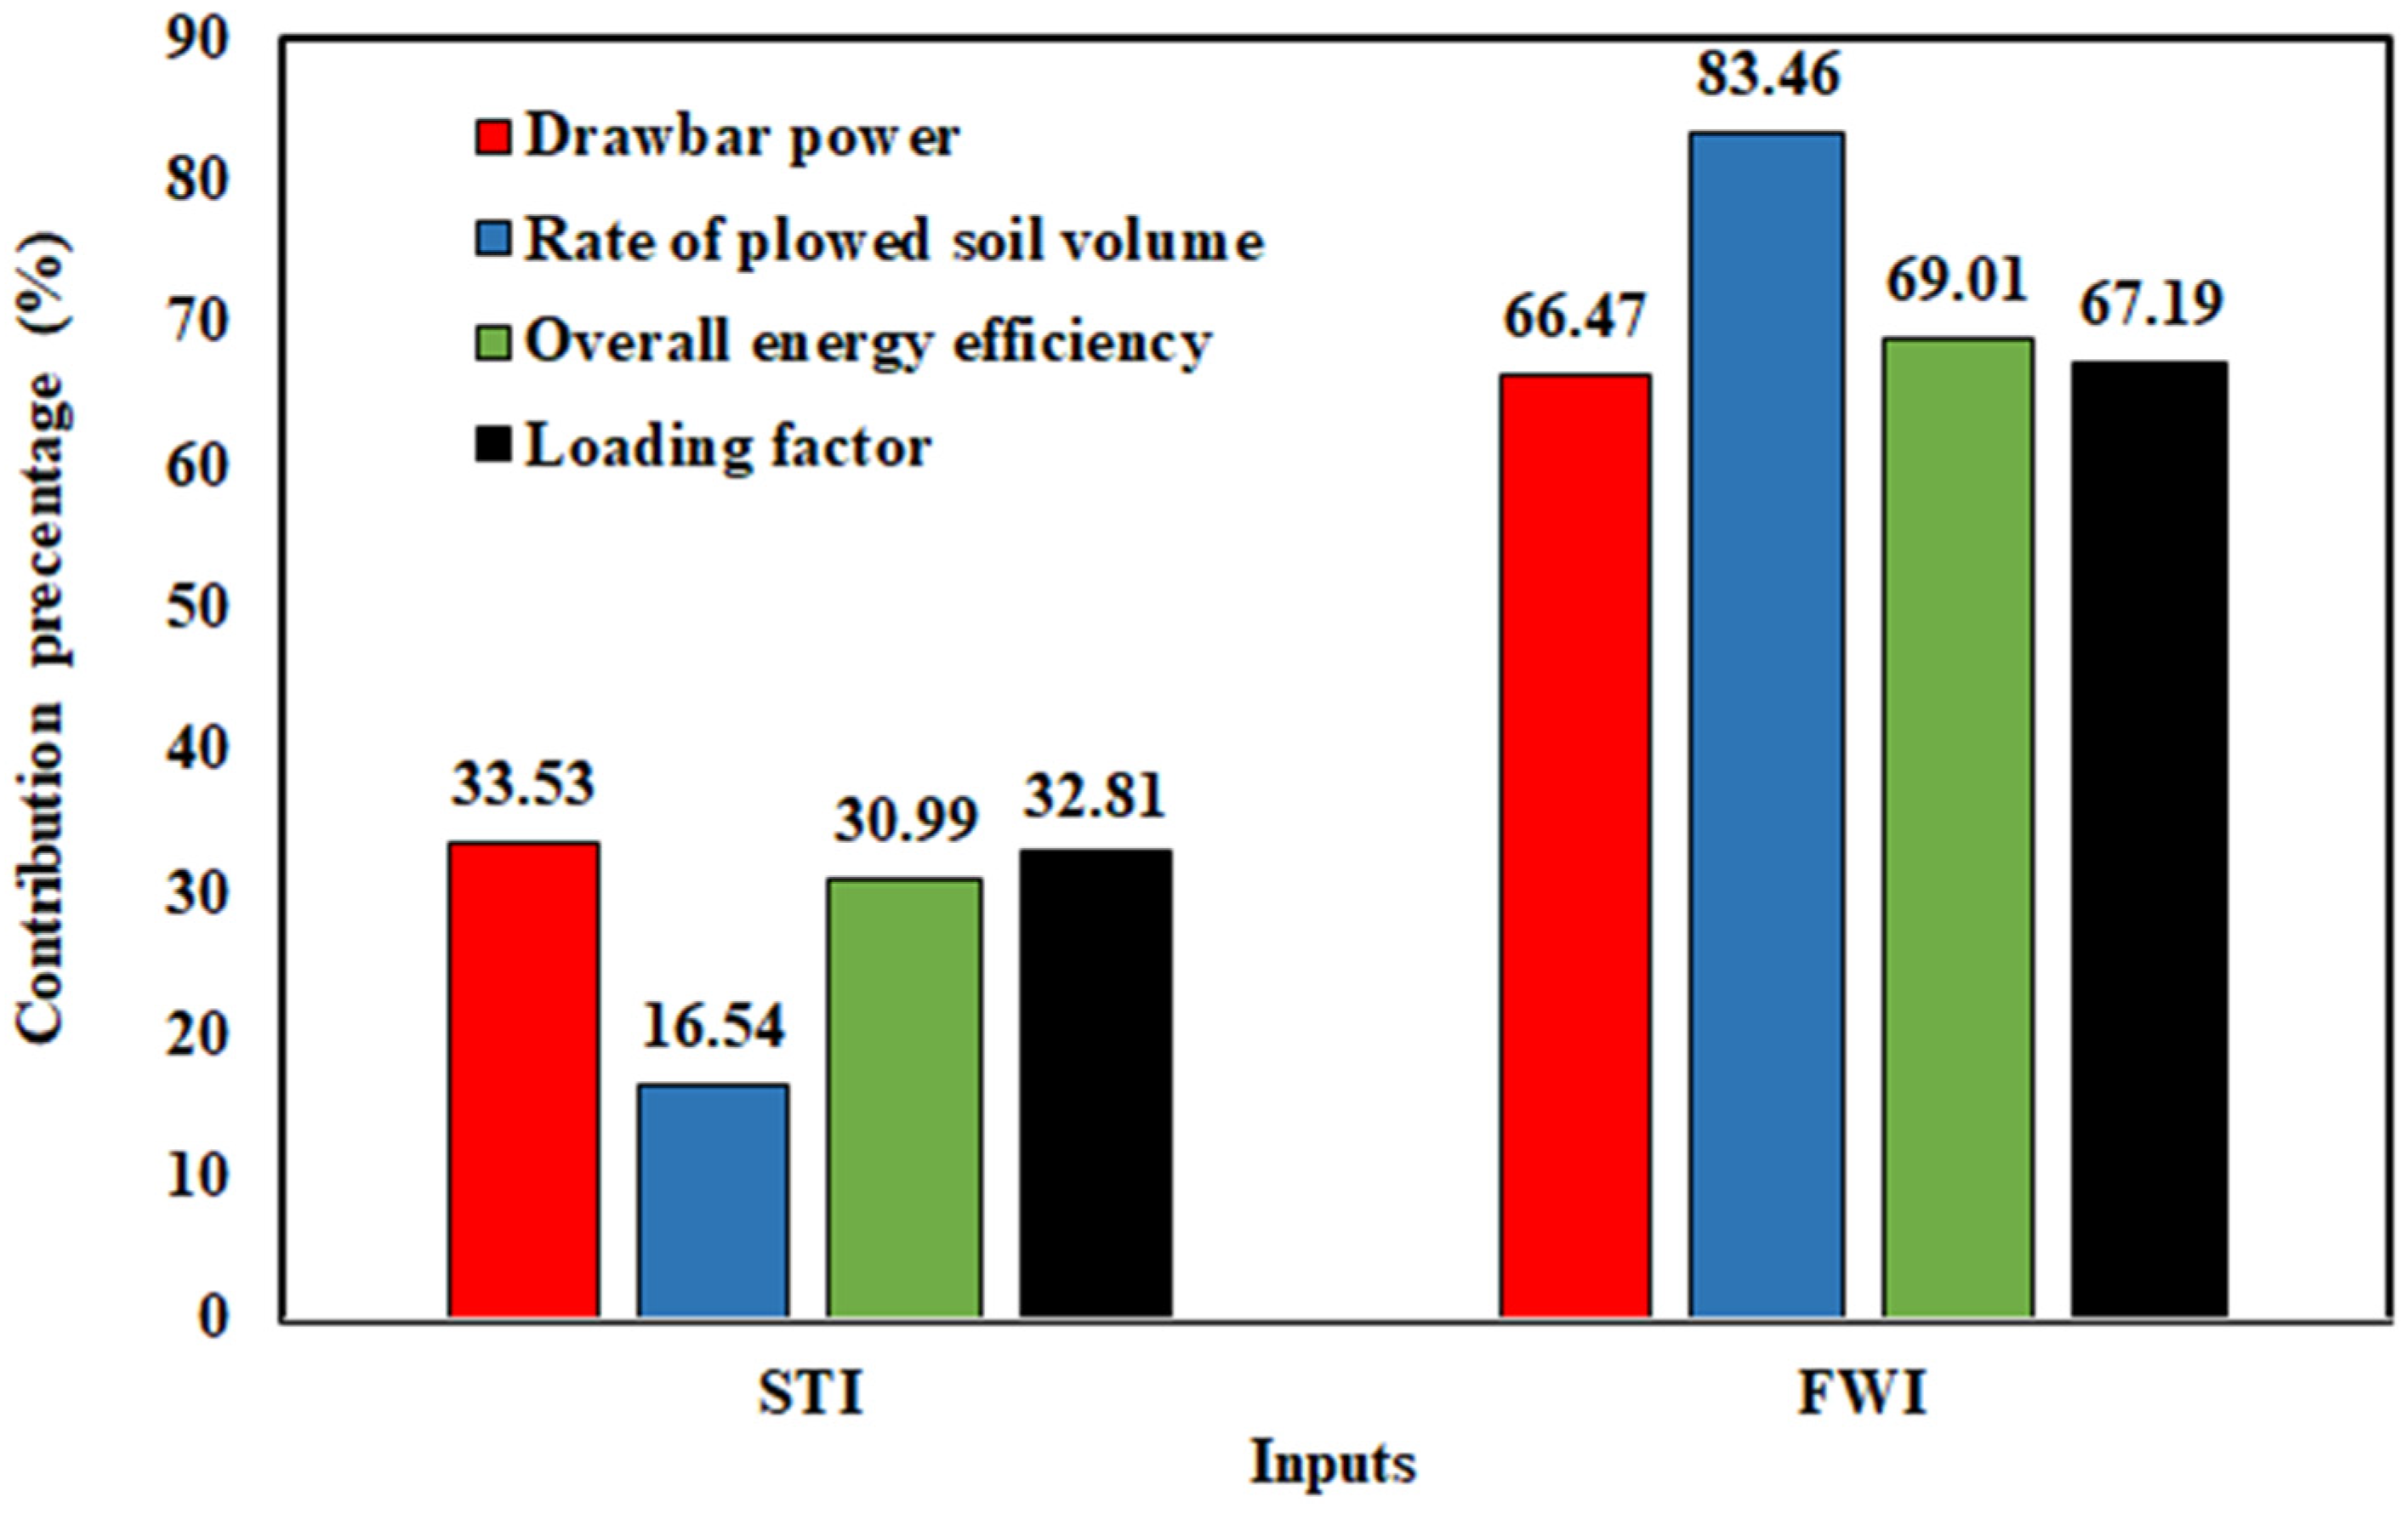
3.3. Contribution Percentage Analysis
4. Discussion
5. Conclusions
Author Contributions
Funding
Institutional Review Board Statement
Informed Consent Statement
Data Availability Statement
Acknowledgments
Conflicts of Interest
References
- Al-Aani, F.S.; Darr, M.J.; Covington, B.R.; Powell, L.J. The Performance of Farm Tractors as Reported by Can-Bus Messages. In Proceedings of the 2016 ASABE Annual International Meeting, Orlando, FL, USA, 17–20 July 2016; Paper No. 162461746. American Society of Agricultural and Biological Engineers: St. Joseph, MI, USA, 2016; pp. 1–18. [Google Scholar] [CrossRef]
- Amini, S.; Asoodar, M.A. Selecting the most appropriate tractor using Analytic Hierarchy Process—An Iranian case study. Inf. Process. Agric. 2016, 3, 223–234. [Google Scholar] [CrossRef] [Green Version]
- Almaliki, S.; Alimardani, R.; Omid, M. Artificial neural network based modeling of tractor performance at different field conditions. Agric. Eng. Int. CIGR J. 2016, 18, 262–274. [Google Scholar]
- Abbaspour-Gilandeh, Y.; Omid, M.; Keyhani, A. Simulation program for predicting tractor field performance. In Proceedings of the International Agricultural Engineering Conference, Bangkok, Thailand, 3–6 December 2007. [Google Scholar] [CrossRef]
- Zarini, R.L.; Akram, A.; Alimardani, R.; Tabatabaekoloor, R. Development of decision support software for matching tractor implement system used on Iranian farms. Am. J. Eng. Res. 2013, 2, 86–98. [Google Scholar]
- Sharma, S.; Gaba, M.; Singh, T. Performance evaluation of tractor with attached implements. Int. J. Res. Eng. Appl. Sci. 2016, 6, 146–157. [Google Scholar]
- Patel, T.; Chakravorty, A.; Karmakar, S. Software for performance prediction and matching of tractor-implement system. In Proceedings of the National Conference on Emerging Trends and Applications in Computer Science, Shillong, India, 30–31 March 2012. [Google Scholar] [CrossRef]
- Kheiry, A.N.O.; Mohamed, M.A.; Omer, E.A.; Rahma, A.E.; Albahi, A. Performance evaluation of Giad chisel plow under different type of soils. Int. J. Sci. Eng. Res. 2017, 8, 273–1283. [Google Scholar]
- Kheiralla, A.; Yahya, A.; Zohadie, M.; Ishak, W. Modelling of power and energy requirements for tillage implements operating in Serdang sandy clay loam. Malaysia. Soil Tillage Res. 2004, 78, 21–34. [Google Scholar] [CrossRef]
- Muhsin, S. Determination of energy requirements, plowed soil volume rate and soil pulverization ratio of chisel plow under various operating conditions. Basrah J. Agric. Sci. 2017, 30, 73–84. [Google Scholar] [CrossRef]
- Ibrahim, I.E.; Ji, C.; He, R.; Ding, Q.; El Sheikh, A.H.; Soomro, S.A.; Idris, S.I. Quantifying performance of chisel plow in heavy clay soil of Gezira scheme—Sudan. Int. Agric. Eng. J. 2019, 28, 79–87. [Google Scholar]
- Sahu, R.K.; Raheman, H. Draught prediction of agricultural implements using reference tillage tools in sandy clay loam soil. Biosyst. Eng. 2006, 94, 275–284. [Google Scholar] [CrossRef]
- Grisso, R.D.; Kocher, M.F.; Vaughan, D.H. Predicting tractor fuel consumption. Appl. Eng. Agric. 2004, 20, 553–561. [Google Scholar] [CrossRef]
- Owen, D. The Development, Validation and Implementation of a Data Acquisition System to Quantify In-Field Tractor Performance Characteristics. Master’s Thesis, Department of Biological and Agricultural Engineering, College of Engineering, Kansas State University, Manhattan, KS, USA, 2019; p. 77. [Google Scholar]
- Jebur, H.A.; Mostafa, M.M.; ElSahhar, E.A.; El-Attar, M.A.; Elnono, M.A. Evaluation of farm tractor using variable weights on rear wheels during ploughing and sowing operation. Misr J. Agric. Eng. 2013, 30, 645–660. [Google Scholar] [CrossRef]
- Pieczarka, K.; Lejman, K. Application of soft computing techniques for the analysis of tractive properties of a low-power agricultural tractor under various soil conditions. Hindawi Complex. 2020, 2020, 7607545. [Google Scholar] [CrossRef]
- Jahirul, M.; Rahman, S.; Masjuki, H.; Kalam, M.; Rashid, M. Application of artificial neural networks (ANN) for prediction the performance of a dual fuel internal combustion engine. J. HKIE Trans. 2009, 16, 14–20. [Google Scholar] [CrossRef]
- Cirak, B.; Demirtas, S. An application of artificial neural network for predicting engine torque in a biodiesel engine. Am. J. Energy Res. 2014, 2, 74–80. [Google Scholar] [CrossRef]
- Roul, A.; Raheman, K.; Pansare, H.; Machavaram, R. Predicting the draught requirement of tillage implements in sandy clay loam soil using an artificial neural network. Biosyst. Eng. 2009, 104, 476–485. [Google Scholar] [CrossRef]
- Ajdadi, F.; Abbaspour-Gilandeh, Y. Artificial neural network and stepwise multiple range regression methods for prediction of tractor fuel consumption. Measurement 2011, 44, 2104–2111. [Google Scholar] [CrossRef]
- Taghavifar, H.; Mardani, A.; Hosseinloo, A.H. Appraisal of artificial neural network-genetic algorithm based model for prediction of the power provided by the agricultural tractors. Energy 2015, 93, 1704–1710. [Google Scholar] [CrossRef]
- Borges, P.; Mendoza, Z.M.S.H.; Maia, J.C.S.; Bianchini, A.; Fernándes, H.C. Estimation of fuel consumption in agricultural mechanized operations using artificial neural networks. Eng. Agrícola 2017, 37, 136–147. [Google Scholar] [CrossRef] [Green Version]
- Shafaei, S.M.; Loghavi, M.; Kamgar, S. A comparative study between mathematical models and the ANN data mining technique in draft force prediction of disk plow implement in clay loam soil. Agric. Eng. Int. CIGR J. 2018, 20, 71–79. [Google Scholar]
- Abbaspour-Gilandeh, Y.; Fazeli, M.; Roshanianfard, A.; Hernández-Hernández, M.; Gallardo-Bernal, I.; Hernández-Hernández, J.L. Prediction of draft force of a chisel cultivator using artificial neural networks and its comparison with regression model. Agronomy 2020, 10, 451. [Google Scholar] [CrossRef] [Green Version]
- Çarman, K.; Marakoğlu, T.; Taner, A.; Çıtıl, E. Prediction of draft force and disturbed soil area of a chisel tine in soil bin conditions using draft force and its comparison with regression model. Selcuk J. Agric. Food Sci. 2021, 35, 56–64. [Google Scholar] [CrossRef]
- Küçüksarıyıldız, H.; Çarman, K.; Sabanci, K. Prediction of specific fuel consumption of 60 HP 2WD tractor using artificial neural networks. Int. J. Automot. Sci. Technol. 2021, 5, 436–444. [Google Scholar] [CrossRef]
- Elashry, E.R.; Bassuni, A.M.; Sayedahmed, A.A.; Ahmed, K.A. An instrumentation system for measuring the tractor performance. Misr J. Agric. Eng. 1994, 11, 968–987. [Google Scholar]
- Younis, S.M.; Elsaid, R.E.; Bahnasy, A.F.; Elsybaee, I.M. Development a local system for measuring tractors performance. Misr J. Agric. Eng. 2010, 27, 34–53. [Google Scholar] [CrossRef]
- Hemeda, S.; Aboukarima, A.; Minyawi, M. Developing a logging unit for measuring and recording power data using Arduino board. Misr J. Agric. Eng. 2017, 34, 2053–2072. [Google Scholar] [CrossRef]
- Mohamed, A.A.; Bahnasy, A.F.; Elgwady, A.A. Design and calibration of a device to measure the pulling force of agricultural trailed implements. Misr J. Agric. Eng. 2004, 21, 521–532. [Google Scholar]
- Oskoui, K.; Harvey, S.J. Predicting cone index from soil physical properties and organic matter content. Paper Am. Soc. Agric. Eng. 1992, 921056, 16. [Google Scholar]
- Al-Janobi, A.; Al-Hamed, S.; Aboukarima, A.; Almajhadi, y. Modeling of draft and energy requirements of a moldboard plow using artificial neural networks based on two novel variables. Eng. Agríc. 2020, 40, 363–373. [Google Scholar] [CrossRef]
- Bowers, C.G., Jr. Southeastern tillage energy data and recommended reporting. Trans. ASAE Am. Soc. Agric. Eng. 1985, 28, 731–737. [Google Scholar] [CrossRef]
- Srivastava, A.K.; Goering, C.E.; Rohrbach, R.P.; Buckmaster, D.R. Engineering Principles of Agricultural Machines, 2nd ed.; American Society of Agricultural and Biological Engineers: St. Joseph, MI, USA, 2006. [Google Scholar]
- Legahri, N.; Zehri, Q.; Shah, A.R.; Tagar, A.A.; Leghari, R.A.; Mangan, T. Comparison of shallow and deep tillage practices at different soil moisture content levels under climatic conditions of Sindh. Sci. Int. 2016, 28, 2661–2666. [Google Scholar]
- Bahnas, O.T.S. Evaluation of Some Farm Machinery under the Egyptian Conditions. Ph.D. Thesis, Agricultural and Mechanical Department, Faculty of Agriculture, Mansoura University, Mansoura, Egypt, 1999; pp. 17–147. [Google Scholar]
- El Sayed, R.A. Effects of a Combined Active and Passive Tillage Tools on Soil Compaction and The Required Energy. Master’s Thesis, Department of Agricultural Engineering, Ain Shams University, Cairo, Egypt, 2000; pp. 56–61. [Google Scholar]
- Ghazy, M.I.A. Soil Mechanics and Water. Master’s Thesis, Agricultural and Mechanical Department, Faculty of Agriculture, Mansoura University, Mansoura, Egypt, 2000; pp. 82–133. [Google Scholar]
- El Khadrawy, A.A. Estimating of Used Energy in the Production of Some Egyptian Crops. Master’s Thesis, Agricultural and Mechanical Department, Faculty of Agriculture, Mansoura University, Mansoura, Egypt, 1990; pp. 71–140. [Google Scholar]
- Obaia, A.R.A. Agricultural Machinery Selection Based on Tillage Power Requirements. Master’s Thesis, Agricultural and Mechanical Department, Faculty of Agriculture, Mansoura University, Mansoura, Egypt, 1991; pp. 139–143. [Google Scholar]
- El Saadawy, M.A.; Khadr, K.A.A.; Moussa, A.I. Effect of tillage system on irrigation and yield of maize crop. Misr J. Agric. Eng. 2000, 17, 45–54. [Google Scholar]
- Shaban, A.O. Effects of Some Tillage Systems and Tractor Performance on Some Soil Properties and the Production of Some Crops in the North Western Coast of Egypt. Master’s Thesis, Soil and Agricultural Chemistry Department, Faculty of Agriculture (Saba Bacha), Alexandria University, Alexandria, Egypt, 1999; pp. 108–123. [Google Scholar]
- El Sheikha, M.A. A quick and effective method to prepare seedbed for Egyptian farms. Misr J. Agric. Eng. 1989, 16, 213–223. [Google Scholar]
- Nasr, G.M. Study of the Optimum Tractor Power Requirement under Egyptian Agricultural Conditions. Ph.D. Thesis, Agricultural Engineering Department, Faculty of Agricultureg, Cairo University, Cairo, Egypt, 1985; pp. 60–98. [Google Scholar]
- Abd El Maksoud, S.E. Relation between Soil Physical Characteristics and Unit Draft at Different Plough Speeds and Depths. Ph.D. Thesis, Agricultural Engineering Department, Faculty of Agriculture, Cairo University, Cairo, Egypt, 1970; pp. 61–115. [Google Scholar]
- Lar, M.B.; Pour, Z.K.; Bamimohammadi, M.R. Field efficiency and its use for energy coefficient determination. J. Am. Sci. 2011, 7, 599–603. [Google Scholar]
- Hanna, M. Estimating the Field Capacity of Farm Machines; Ag Decision Maker File A3-24 PM 696; Iowa State University of Science and Technology: Ames, IA, USA, 2016; p. 5. [Google Scholar]
- Lewis, P.; Rasdorf, W. Fuel use and pollutant emissions taxonomy for heavy duty diesel construction equipment. J. Manag. Eng. 2017, 33, 04016038. [Google Scholar] [CrossRef]
- Ismail, W.I.W.; Burkhardt, T.H. Draft and fuel requirements measurement using tractor on-board data acquisition system. Pertanika J. Sci. Technol. 1993, 1, 51–64. [Google Scholar]
- ASAE Standards D497.4; Agricultural Machinery Management Data. ASAE Standards: St. Joseph, MI, USA, 2000; pp. 372–380.
- Akinnuli, B.O.; Akerele, F.O.; Nathanie, A.B.C. Model developed for farm tractors and implements selection for optimum utilization. J. Emerg. Trends Eng. Appl. Sci. JETEAS 2014, 5, 248–255. [Google Scholar]
- Zoz, F.M.; Grisso, R.D. Traction and tractor performance. In Proceedings of the 2003 Agricultural Equipment Technology Conference, Louisville, KY, USA, 9–11 February 2003; pp. 9–11. [Google Scholar]
- Omid, M. Introducing simulation software as an educational tool to enhance student understanding of tractor field performance. Int. J. Eng. Ed. 2006, 22, 1219–1223. [Google Scholar]
- Haykin, S. Neural Networks: A Comprehensive Foundation, 2nd ed.; Prentice Hall: Hoboken, NJ, USA, 1999; pp. 1–842. ISBN 13 9780132733502. [Google Scholar]
- Hunter, D.; Yu, H.; Pukish, M.S., III; Kolbusz, J.; Wilamowski, B.M. Selection of proper neural network sizes and architectures: A comparative study. IEEE Trans. Ind. Inform. 2012, 8, 228–240. [Google Scholar] [CrossRef]
- Jinchuan, K.; Xinzhe, L. Empirical analysis of optimal hidden neurons in neural network modeling for stock prediction. In Proceedings of the Pacific-Asia Workshop on Computational Intelligence and Industrial Application, Wuhan, China, 19–20 December 2008; Volume 2, pp. 828–832. [Google Scholar]
- Aragón-Ramírez, A.; Oida, A.; Nakashima, H.; Miyasaka, J.; Ohdoi, K. Mechanization index and machinery energy ratio assessment by means of an artificial neural network: A Mexican case study. Agric. Eng. Int. CIGR E J. 2007, 9, 07002. [Google Scholar]
- Vesta Services. Qnet2000 Shareware; Vesta Services, Inc.: Winnetka, IL, USA, 2000. [Google Scholar]
- Marey, S.; Aboukarima, A.; Almajhadi, Y. Predicting the performance parameters of chisel plow using neural network model. Eng. Agrícola Jaboticabal 2020, 40, 719–731. [Google Scholar] [CrossRef]
- Mashaly, A.F.; Alazba, A.A. Assessing the accuracy of ANN, ANFIS, and MR techniques in forecasting productivity of an inclined passive solar still in a hot, arid environment. Water SA 2019, 45, 239–250. [Google Scholar] [CrossRef] [Green Version]
- Makridakis, S.G.; Wheelwright, S.C.; Hyndman, R.J. Forecasting: Methods and Applications, 3rd ed.; John Wiley & Sons, Inc.: New York, NY, USA, 1998; p. 642. [Google Scholar]
- Ahmed, E.A.H. Tillage Implements Performance as Affected by Tractor Power and Forward Speed. Master’s Thesis, Department of Agricultural Engineering, Faculty of Agriculture, University of Khartoum, Khartoum, Sudan, 2006; p. 102. [Google Scholar]
- López-Vázquez, A.; Cadena-Zapata, M.; Campos-Magaña, S.; Zermeño-Gonzalez, A.; Mendez-Dorado, M. Comparison of energy used and effects on bulk density and yield by tillage systems in a semiarid condition of Mexico. Agronomy 2019, 9, 189. [Google Scholar] [CrossRef] [Green Version]
- Bukhari, S.; Bhutto, M.; Baloch, J.; Bhutto, A.; Mmirain, N. Performance of selected tillage implements. J. Agric. Mech. Asia Afr. Lat. Am. AMA 1988, 19, 9–14. [Google Scholar]
- Iqbal, M.; Younis, M.; Sabir, M.S.; Azhar, A.H. Draft requirements of selected tillage implements. J. Agric. Mech. Asia Afr. Lat. Am. AMA 1994, 25, 13–15. [Google Scholar]
- Khadr, K.A.A. Effect of some primary tillage implement on soil pulverization and specific energy. Misr J. Agric. Eng. 2008, 25, 731–745. [Google Scholar] [CrossRef]
- El-Iraqi, M.E.; Marey, S.A.; Drees, A.M. A modified Δ-shape chisel plow (evaluation and performance test). Misr J. Agric. Eng. 2009, 26, 644–666. [Google Scholar] [CrossRef]
- Al-Taee, M.E.A.; Al-Rajaboo, S.A.J. Effect of chisel plow shanks shape on power requirements of tractor. AL Rafdain Eng. J. 2015, 6, 17–26, (Abstract in English). [Google Scholar]
- Kheiry, A.N.O.; Mohamed, M.A.; Hongjuan, R.; Rahma, A.E.; Dahab, M.H.; Izzeldin, S.; Abdeen, M. Effects of chisel plow shanks distribution arrangements and forward speed on machine performance index in clay soil. Int. J. Eng. Adv. Technol. Stud. 2019, 7, 17–27. [Google Scholar]
- Meselhy, A. Design and performance evaluation of circular chisel plow in calcareous soil. Int. J. Emerg. Technol. Adv. Eng. 2014, 4, 1–8. [Google Scholar]
- Karparvarfard, S.; Rahmanian-Koushkaki, H. Development of a fuel consumption equation: Test case for a tractor chisel-ploughing in a clay loam soil. Biosyst. Eng. 2015, 130, 23–33. [Google Scholar] [CrossRef]
- Jebur, H.; Alsayyah, Y. Study of the soil moisture content and the tractor speed on the performance efficiency of the machinery unit. IOSR J. Agric. Vet. Sci. IOSR-JAVS 2017, 10, 65–70. [Google Scholar] [CrossRef]
- Osman, T.O.; Zaied, M.B.; El Naim, A.M. Field performance of a modified chisel plow. Int. J. Nat. Sci. Res. 2014, 2, 85–96. [Google Scholar]
- Ranjbarian, S.; Askari, M.; Jannatkhah, J. Performance of tractor and tillage implements in clay soil. J. Saudi Soc. Agric. Sci. 2017, 16, 154–162. [Google Scholar] [CrossRef] [Green Version]
- Celik, A.; Boydas, M.G.; Turgut, N. Comparison of the energy requirements of an experimental plow, a moldboard plow and a disk plow. Philipp. Agric. Sci. 2007, 90, 173–178. [Google Scholar]
- Ashour, D.; Safi, H. The effect of chisel plow type, operating depth and forward speed on the energy requirement and some filed performance indicators in silty clay soil. J. Basrah Res. Sci. 2015, 41, 1–11. [Google Scholar]
- Naik, V.S.; Raheman, H. Factors affecting fuel consumption of tractor operating active tillage implement and its prediction. Eng. Agric. Environ. Food 2019, 12, 548–555. [Google Scholar] [CrossRef]
- Lee, J.W.; Kim, J.S.; Kim, K.U. Computer simulations to maximise fuel efficiency and work performance of agricultural tractors in rotovating and ploughing operations. Biosyst. Eng. 2016, 142, 1–11. [Google Scholar] [CrossRef]
- Sahu, R.K.; Raheman, H. A decision support system on matching and field performance prediction of tractor implement system. Comput. Electron. Agric. 2008, 60, 76–86. [Google Scholar] [CrossRef]
- Karwasra, N.; Kumar, A.; Kalra, A.; Mukesh, S.; Rani, V.; Sarita. Tractor drawbar performance prediction using artificial neural network. J. Agric. Eng. 2017, 54, 1–9. [Google Scholar]
- Çarman, K.; Çitil, E.; Taner, A. Artificial neural network model for predicting specific draft force and fuel consumption requirement of a mouldboard plough. Selcuk J. Agric. Food Sci. 2019, 33, 241–247. [Google Scholar] [CrossRef]
- Kim, W.-S.; Lee, D.-H.; Kim, Y.-J.; Kim, Y.-S.; Park, S.-U. Estimation of axle torque for an agricultural tractor using an artificial neural network. Sensors 2021, 21, 1989. [Google Scholar] [CrossRef] [PubMed]


| Sites | Tractor Power | Plowing Depth | Plowing Speed | Soil Moisture Content | Soil Bulk Density | Number of Data Points |
|---|---|---|---|---|---|---|
| (kW) | (cm) | (km/h) | (%db) | (g/cm3) | (-) | |
| Abies area | 67 | 14.0 | 2.5,3.8,4.8 | 18.2 | 1.28 | 3 |
| El Gemmaiza Research Station | 82 | 10,12,14,15 | 3.5,4.8,5.7 | 18.2 | 1.40 | 12 |
| 10,12,15 | 4.8 | 18.2 | 1.40 | 3 | ||
| Meet El Deeba Province | 82 | 10,13,15,16 | 2.5,3.4,4.8 | 17.4 | 1.35 | 12 |
| 10,14,17,18 | 2.4,3.5,4.6,5.1 | 17.6 | 1.30 | 12 | ||
| 10,13,14,16 | 2.5,3.2,5.1 | 20.1 | 1.38 | 12 | ||
| 9,11,14,16 | 3.2,3.7,4.7,6.9 | 19.8 | 1.36 | 16 |
| Working Variables | Statistical Criteria | |||||
|---|---|---|---|---|---|---|
| Minimum | Maximum | Average | Kurtosis | Skewness | Coefficient of Variation (%) | |
| Tractor power (kW) | 33.55 | 104.38 | 54.99 | −0.50 | 0.88 | 33.71 |
| Plow width (m) | 1.68 | 2.63 | 1.74 | 142.16 | 10.48 | 3.82 |
| Plowing speed (km/h) | 2.30 | 6.92 | 4.12 | 1.16 | 0.18 | 19.29 |
| Soil bulk density (g/cm3) | 1.11 | 1.6 | 1.37 | −0.83 | 0.42 | 8.88 |
| Soil moisture content (%, db) | 4.60 | 20.05 | 16.92 | 3.24 | −1.93 | 19.99 |
| Plowing depth (cm) | 10.00 | 25.00 | 15.95 | 0.65 | 1.08 | 23.37 |
| No. of data points | 244 | 244 | 244 | 244 | 244 | 244 |
| Input and Output Attributes | Statistical Criteria | |||||
|---|---|---|---|---|---|---|
| Minimum | Maximum | Average | Kurtosis | Skewness | Coefficient of Variation (%) | |
| STI (input) (dimensionless) | 0.03 | 0.84 | 0.54 | −0.27 | −1.10 | 46.95 |
| FWI (input) (dimensionless) | 1.07 | 101.17 | 17.87 | 10.36 | 2.77 | 85.42 |
| Draft (output) (kN) | 5.32 | 21.55 | 15.13 | −0.69 | 0.19 | 21.27 |
| Fuel consumption (output) (L/h) | 5.31 | 18.17 | 10.11 | 1.43 | 0.87 | 21.02 |
| Effective field capacity(output) (ha/h) | 0.32 | 0.95 | 0.60 | 4.08 | −1.38 | 15.23 |
| Drawbar power (output) (kW) | 6.38 | 28.85 | 17.25 | 0.16 | 0.002 | 25.94 |
| Overall energy efficiency (output) (%) | 7.88 | 20.81 | 16.55 | 3.82 | −1.86 | 10.82 |
| Rate of plowed soil volume (output) (m3/h) | 315.00 | 1814.40 | 950.51 | 0.94 | 0.61 | 27.15 |
| Loading factor (output) (decimal) | 0.13 | 0.99 | 0.67 | −0.66 | −0.70 | 35.73 |
| No. of data points | 244 | 244 | 244 | 244 | 244 | 244 |
| Performance Attributes | Statistical Criteria | |||||
|---|---|---|---|---|---|---|
| MAE | R2 | RMSE | ||||
| Training | Testing | Training | Testing | Training | Testing | |
| Draft (kN) | 1.22 | 1.44 | 0.734 | 0.569 | 1.61 | 2.06 |
| Fuel consumption (L/h) | 0.92 | 1.17 | 0.602 | 0.486 | 1.15 | 1.64 |
| Effective field capacity (ha/h) | 0.04 | 0.03 | 0.467 | 0.384 | 0.03 | 0.07 |
| Drawbar power (kW) | 1.99 | 2.28 | 0.633 | 0.516 | 2.07 | 3.03 |
| Overall energy efficiency (%) | 0.76 | 0.68 | 0.510 | 0.454 | 0.89 | 1.13 |
| Rate of plowed soil volume (m3/h) | 70.22 | 73.97 | 0.835 | 0.777 | 85.29 | 110.21 |
| Loading factor (decimal) | 0.07 | 0.08 | 0.853 | 0.730 | 0.08 | 0.12 |
| Performance Attributes | Statistical Criteria | |||||
|---|---|---|---|---|---|---|
| MAE | R2 | RMSE | ||||
| Training | Testing | Training | Testing | Training | Testing | |
| Draft (kN) | 2.42 | 2.41 | 0.249 | 0.239 | 2.81 | 2.72 |
| Fuel consumption (L/h) | 1.28 | 1.35 | 0.345 | 0.352 | 1.68 | 1.85 |
| Effective field capacity (ha/h) | 0.05 | 0.04 | 0.298 | 0.358 | 0.08 | 0.07 |
| Drawbar power (kW) | 2.78 | 2.58 | 0.370 | 0.429 | 3.57 | 3.27 |
| Overall energy efficiency (%) | 0.93 | 0.74 | 0.346 | 0.511 | 1.51 | 1.02 |
| Rate of plowed soil volume (m3/h) | 125.13 | 134.10 | 0.604 | 0.482 | 165.64 | 179.72 |
| Loading factor (decimal) | 0.14 | 0.14 | 0.460 | 0.422 | 0.18 | 0.18 |
Publisher’s Note: MDPI stays neutral with regard to jurisdictional claims in published maps and institutional affiliations. |
© 2022 by the authors. Licensee MDPI, Basel, Switzerland. This article is an open access article distributed under the terms and conditions of the Creative Commons Attribution (CC BY) license (https://creativecommons.org/licenses/by/4.0/).
Share and Cite
Al-Dosary, N.M.N.; Aboukarima, A.M.; Al-Hamed, S.A. Evaluation of Artificial Neural Network to Model Performance Attributes of a Mechanization Unit (Tractor-Chisel Plow) under Different Working Variables. Agriculture 2022, 12, 840. https://doi.org/10.3390/agriculture12060840
Al-Dosary NMN, Aboukarima AM, Al-Hamed SA. Evaluation of Artificial Neural Network to Model Performance Attributes of a Mechanization Unit (Tractor-Chisel Plow) under Different Working Variables. Agriculture. 2022; 12(6):840. https://doi.org/10.3390/agriculture12060840
Chicago/Turabian StyleAl-Dosary, Naji Mordi Naji, Abdulwahed Mohamed Aboukarima, and Saad Abdulrahman Al-Hamed. 2022. "Evaluation of Artificial Neural Network to Model Performance Attributes of a Mechanization Unit (Tractor-Chisel Plow) under Different Working Variables" Agriculture 12, no. 6: 840. https://doi.org/10.3390/agriculture12060840