Article

Study on Fugitive Dust Control Technologies of Agricultural Harvesting Machinery

College of Mechanical and Electrical Engineering, Henan Agricultural University, Zhengzhou 450002, China
*
Author to whom correspondence should be addressed.
Agriculture 2022, 12(7), 1038; https://doi.org/10.3390/agriculture12071038
Submission received: 19 May 2022 / Revised: 10 July 2022 / Accepted: 15 July 2022 / Published: 16 July 2022
(This article belongs to the Special Issue Agricultural Safety and Health Culture)

Abstract

:
The fugitive dust generated by agricultural harvesting machinery not only causes harm to production safety, but also affects the living environment of people in agricultural areas. This is also one of the hot issues that have emerged in the green development of rural areas in recent years, which is related to agricultural safety and hygiene culture. Due to the lack of relevant research, many researchers still have considerable controversy on the issue of agricultural dust. Therefore, in combination with the actual production of agricultural mechanization, according to the cause of dust generation and particle characteristics, the selection of appropriate dust reduction technology and detection methods is of great significance for the research on the control of dust from agricultural harvesting machinery. Aiming at the dust problem in agricultural mechanization production, this research first introduces the relationship between fugitive dust and atmospheric particulate matter and the main components of fugitive dust, and then focuses on the causes of dust generated by wheat harvesters and peanut harvesters in field operations, and explains the main hazards of dust to human health, ecological environment, and climate. This study introduces four fugitive dust emission reduction technologies and five particle measurement methods, and compares and analyzes their feasibility in the application of agricultural harvesting machinery dust control. Finally, we put forward conclusions and suggestions on the dust control technology of agricultural harvesting machinery in order to provide reference for the control of agricultural harvesting machinery dust, improve the field operation environment, and promote the green development of modern agriculture.

1. Introduction

Agricultural mechanization is one of the important contents and symbols of agricultural modernization. Improving the level of agricultural mechanization is an important way to promote the sustainable development of China’s agricultural resources [1]. The advancement of the whole process and comprehensive mechanization has greatly improved the efficiency of agricultural production, greatly increased the income of farmers, and made great contributions to the development of the rural economy. However, while increasing production and income, agricultural machinery also brings some problems. In 2020, the sown areas of wheat and corn in China were 23,380 hectares and 41,264 hectares, respectively. The sown area of peanuts is also increasing year by year, and reached 4633 hectares in 2019 [2]. The main planting areas of these crops are the Huanghuaihai region, including Henan and Shandong, Hebei, Anhui, and other provinces with a population of more than 60 million. Whenever important farming seasons come, farmland operations are more concentrated, and there are dust problems to varying degrees in all aspects of farming and harvesting; in the harvesting process, the problem of dust generated by agricultural machinery operations is more prominent. During the working process of the harvesting machinery, various mechanical parts interact with the crops, so that the dust particles attached to the surface of the crops diffuse into the air and become aerosols. The fugitive dust suspended around the harvesting machinery seriously endangers the driver’s health, and affects the working sight and some smart sensors, causing great hidden dangers of work accidents. Under certain meteorological conditions, more dust causes a wider range of air pollution after diffusion, increases the content of inhalable particulate matter in the air, becomes one of the sources of air pollution during the harvest season of crops, and has a continuous impact on surrounding agricultural practitioners [3].
Due to the fact that there are few systematic studies on the fugitive dust of agricultural harvesting machinery at present, the existing dust control measures are mostly transplanted directly from other industrial fields, and the matching with agricultural harvesting machinery, energy consumption, cost, and maintenance that farmers are concerned about are rarely considered. They have been greatly restricted in terms of application and promotion. Unscientific fugitive dust control methods and policies not only fail to achieve good control effects, but may also affect normal agricultural production activities. In order to solve this problem, this paper starts from the generation, composition, and particle size characteristics of fugitive dust, expounds its harm to human health, climate and environment, and analyzes the feasibility of four fugitive dust suppression technology and five measurement methods from the perspective of agricultural production, and proposes a feasible fugitive dust suppression and measurement scheme, so as to provide reference and basis for the control of fugitive dust from agricultural harvesting machinery and the creation of a healthy and safe production environment.

2. Materials and Methods

2.1. Generation and Hazards of Fugitive Dust

2.1.1. Atmospheric Particulate Matter and Fugitive Dust from Agricultural Harvesting Machinery

Atmospheric particulate matter (APM) is a general term for various solid and liquid suspended particulate matter existing in the atmosphere [4]. Various particulate substances are uniformly dispersed in the air to form a relatively stable and bulky suspension system, an aerosol system, so atmospheric particles are also called atmospheric aerosols [5]. Fugitive dust particles in the atmosphere are open sources of pollution formed after surface dust diffuses into the atmosphere under wind, human, and other factors. According to the nature of particulate matter, dust particles are generally composed of inorganic particles, organic particles and living particles. Inorganic particles mainly include soil dust particles, metal dust particles, mineral dust particles, etc. [6]. Organic particles mainly include plant fiber, animal hair, cutin, dander, sugar, etc. [7,8]. Living particles mainly include fungi, bacteria and virus, etc. [9]. The particulate matter in the atmosphere is shown in Figure 1.
The size of dust particles is usually described by the Aerodynamic Equivalent Diameter [10]. According to the particle size, atmospheric particulate matter can be divided into PM2.5 (AED ≤ 2.5 μm), PM10 (AED ≤ 10 μm), and PM100 (AED ≤ 100 μm), among which PM10 is also known as inhalable particulate matter. Particles with aerodynamic equivalent diameter greater than 100 μm settle quickly under the action of gravity, while PM100 settles very slowly and are suspended in the air for a long time; so PM100 is also called total suspended particulate (TSP). The sedimentation rate of atmospheric particles under the action of gravity can be described by the Stokes equation:
v s = ( ρ p ρ a ) 18 μ g d p 2
where ρp is the density of the particulate matter (kg/m3), ρa the density of air (kg/m3), g is the acceleration of gravity (m/s2), dp the aerodynamic equivalent diameter of particle (m), and μ is the viscosity of air (Pa·s).
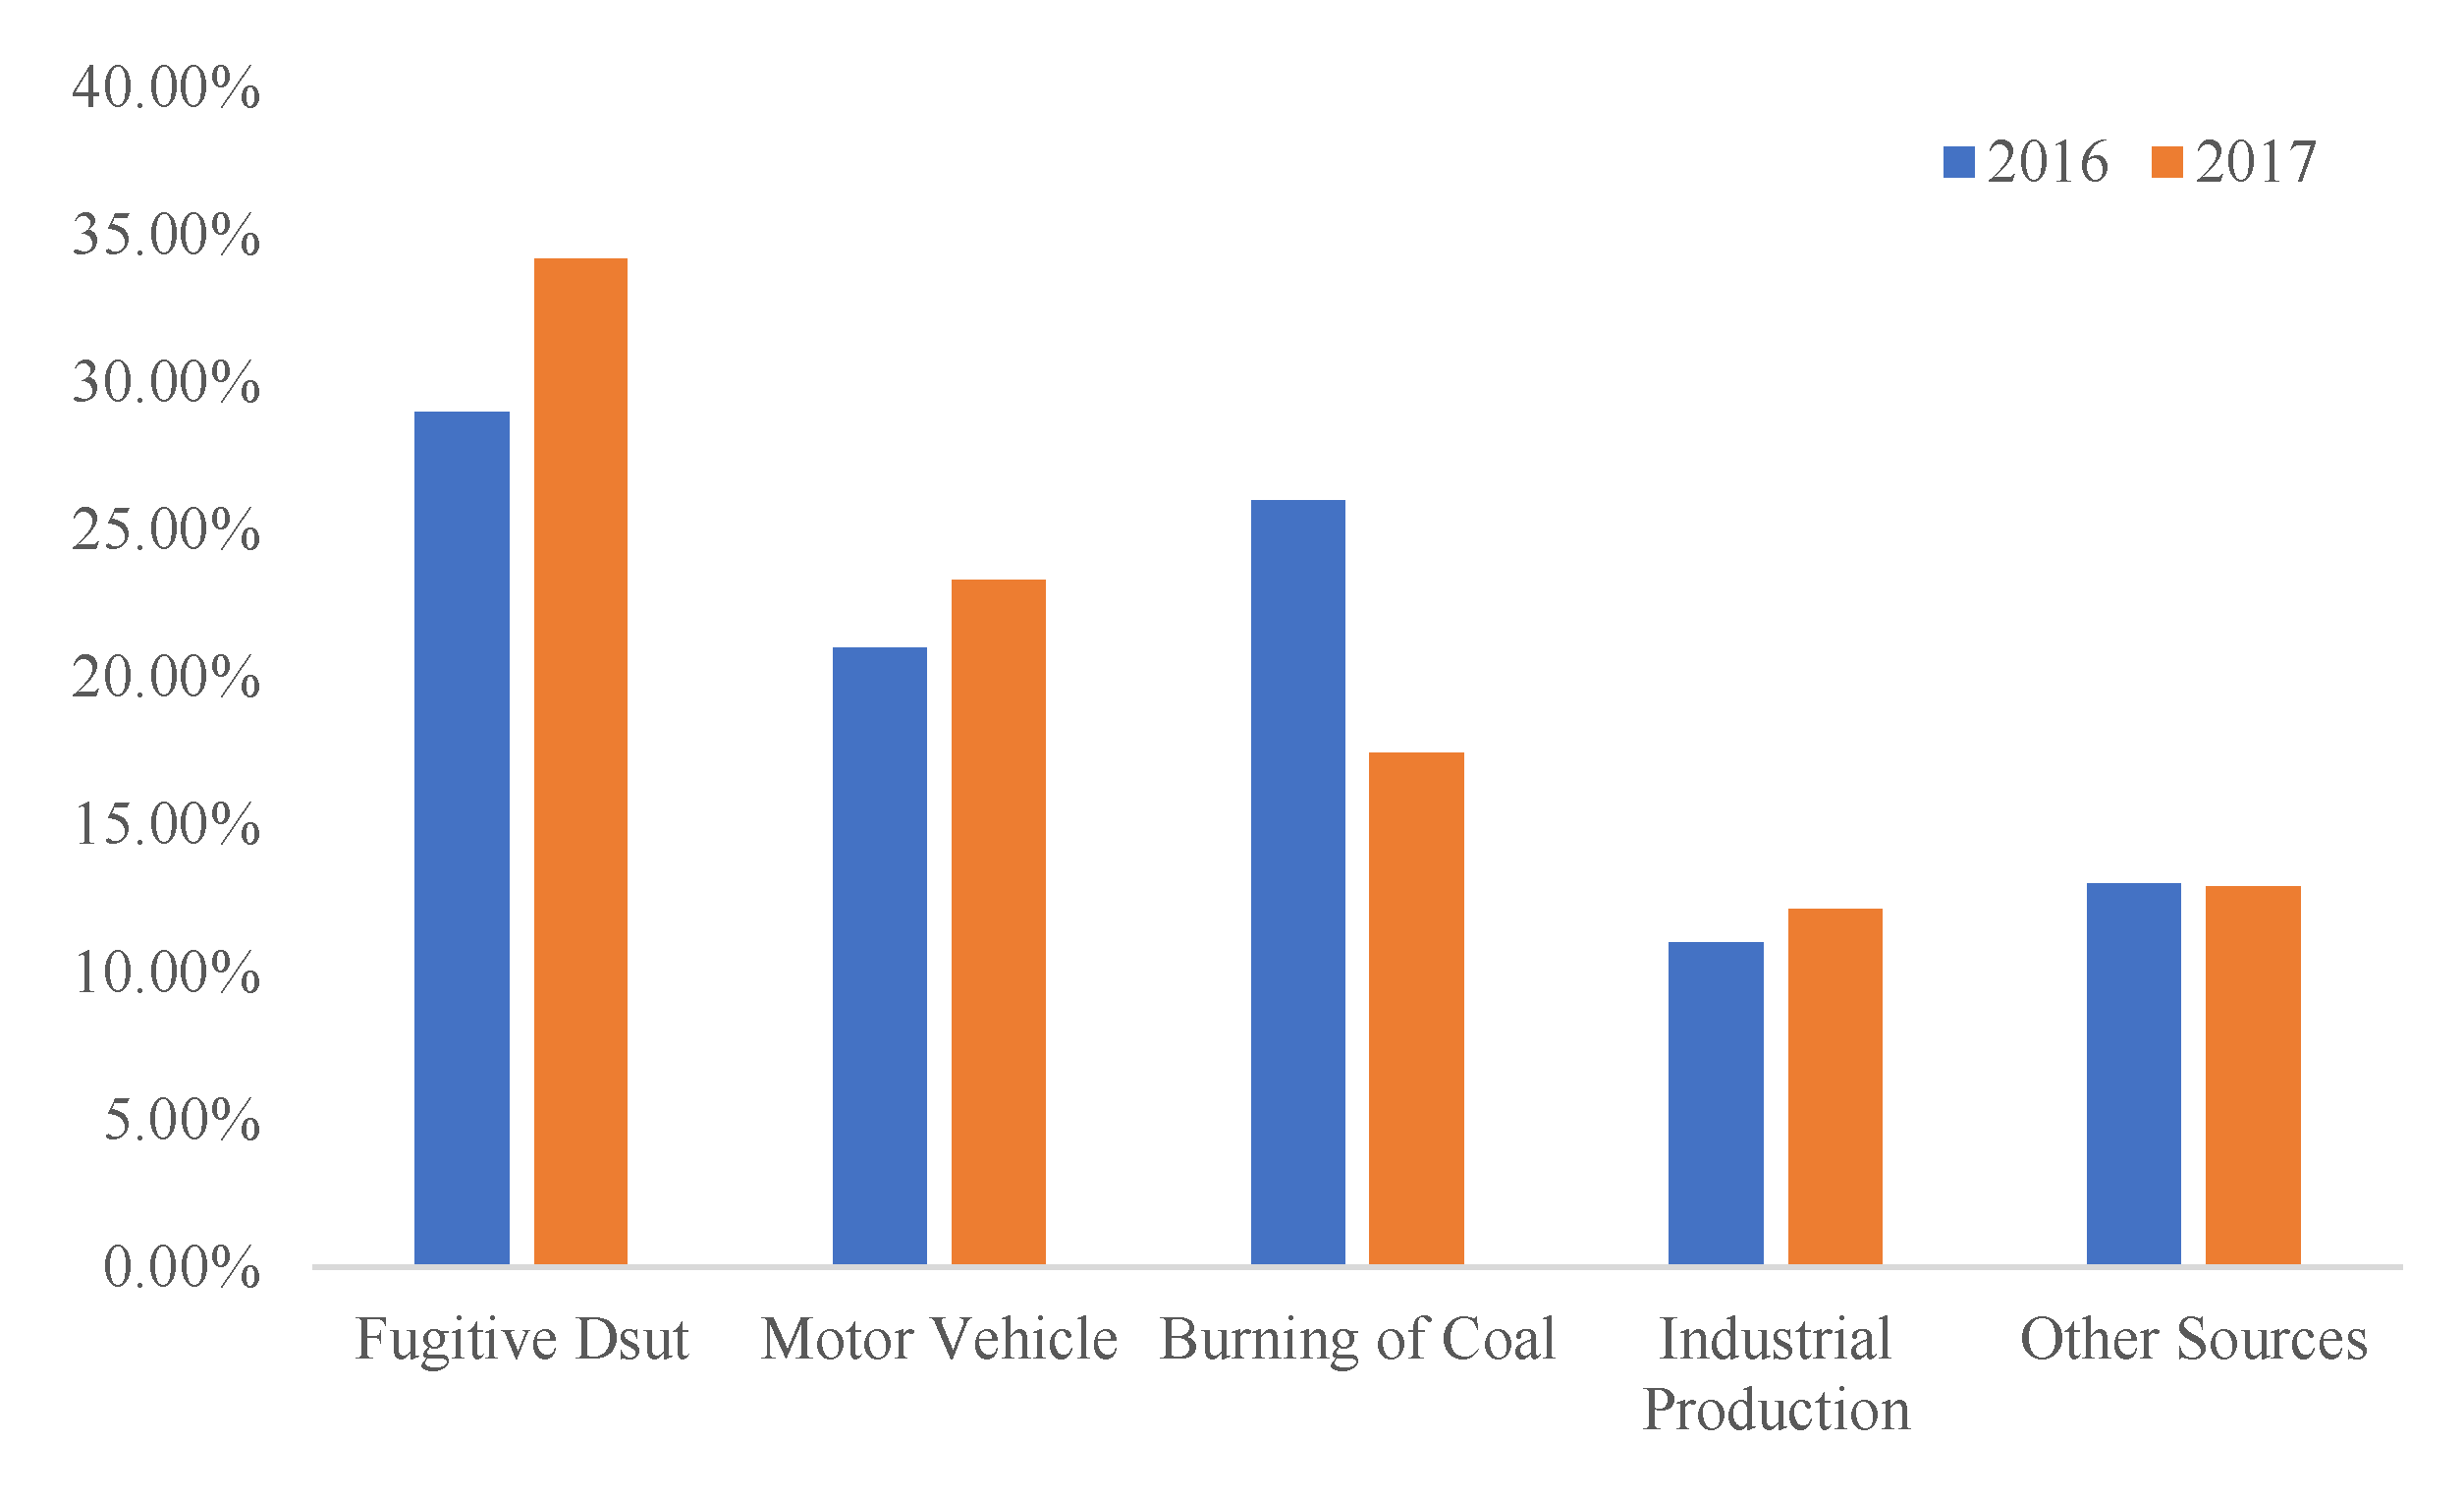
As an important part of atmospheric particulate matter in the environment [11,12], dust particles from exposed lands [13] occupy a relatively high proportion in the source of atmospheric particulate matter [14,15]. Feng [16] used the chemical mass balance (CMB) receptor model and dual source analysis technology to analyze the sources of TSP and PM10 in the ambient air of Urumqi, and found that among the sources of TSP and PM10, the dust particles had the highest sharing rates, 34% and 30%, respectively. According to the analysis results of sources of ambient air particulate matter in Jinan City in 2017 released by Jinan Environmental Protection Bureau in May 2018, among the PM10 sources in Jinan City in 2017, the share of dust particles was 34.2%, an increase of 5.2 percentage points compared with 2016. The share rate of PM10 sources in Jinan in 2016 and 2017 is shown in Figure 2.
For the study of the composition of atmospheric particles, the methods of chemical analysis and ray analysis [17] after sampling are usually adopted [18,19]. The most important components of atmospheric particulate matter are often sulfate and nitrate from surface soil and vehicle exhaust emissions [20,21], which can usually reach 60~80% or higher [22]. Terzi [23] et al. studied the chemical composition of atmospheric particulate matter at two different urban sites in the city of Thessaloniki, Greece. Through chemical analysis, they found that the samples contained minerals (Si, Al, Ca, Mg, Fe, Ti, and K), trace elements (Cd, Cr, Cu, Mn, Pb, V, Zn, Te, Co, Ni, Se, Sr, As, and Sb), water-soluble ions (Cl, NO 3 , SO 4 2 , Na+, K+, NH4+, Ca2+, and Mg2+) and carbonaceous compounds. This is consistent with the research of Ambade [24] and Cao [25].
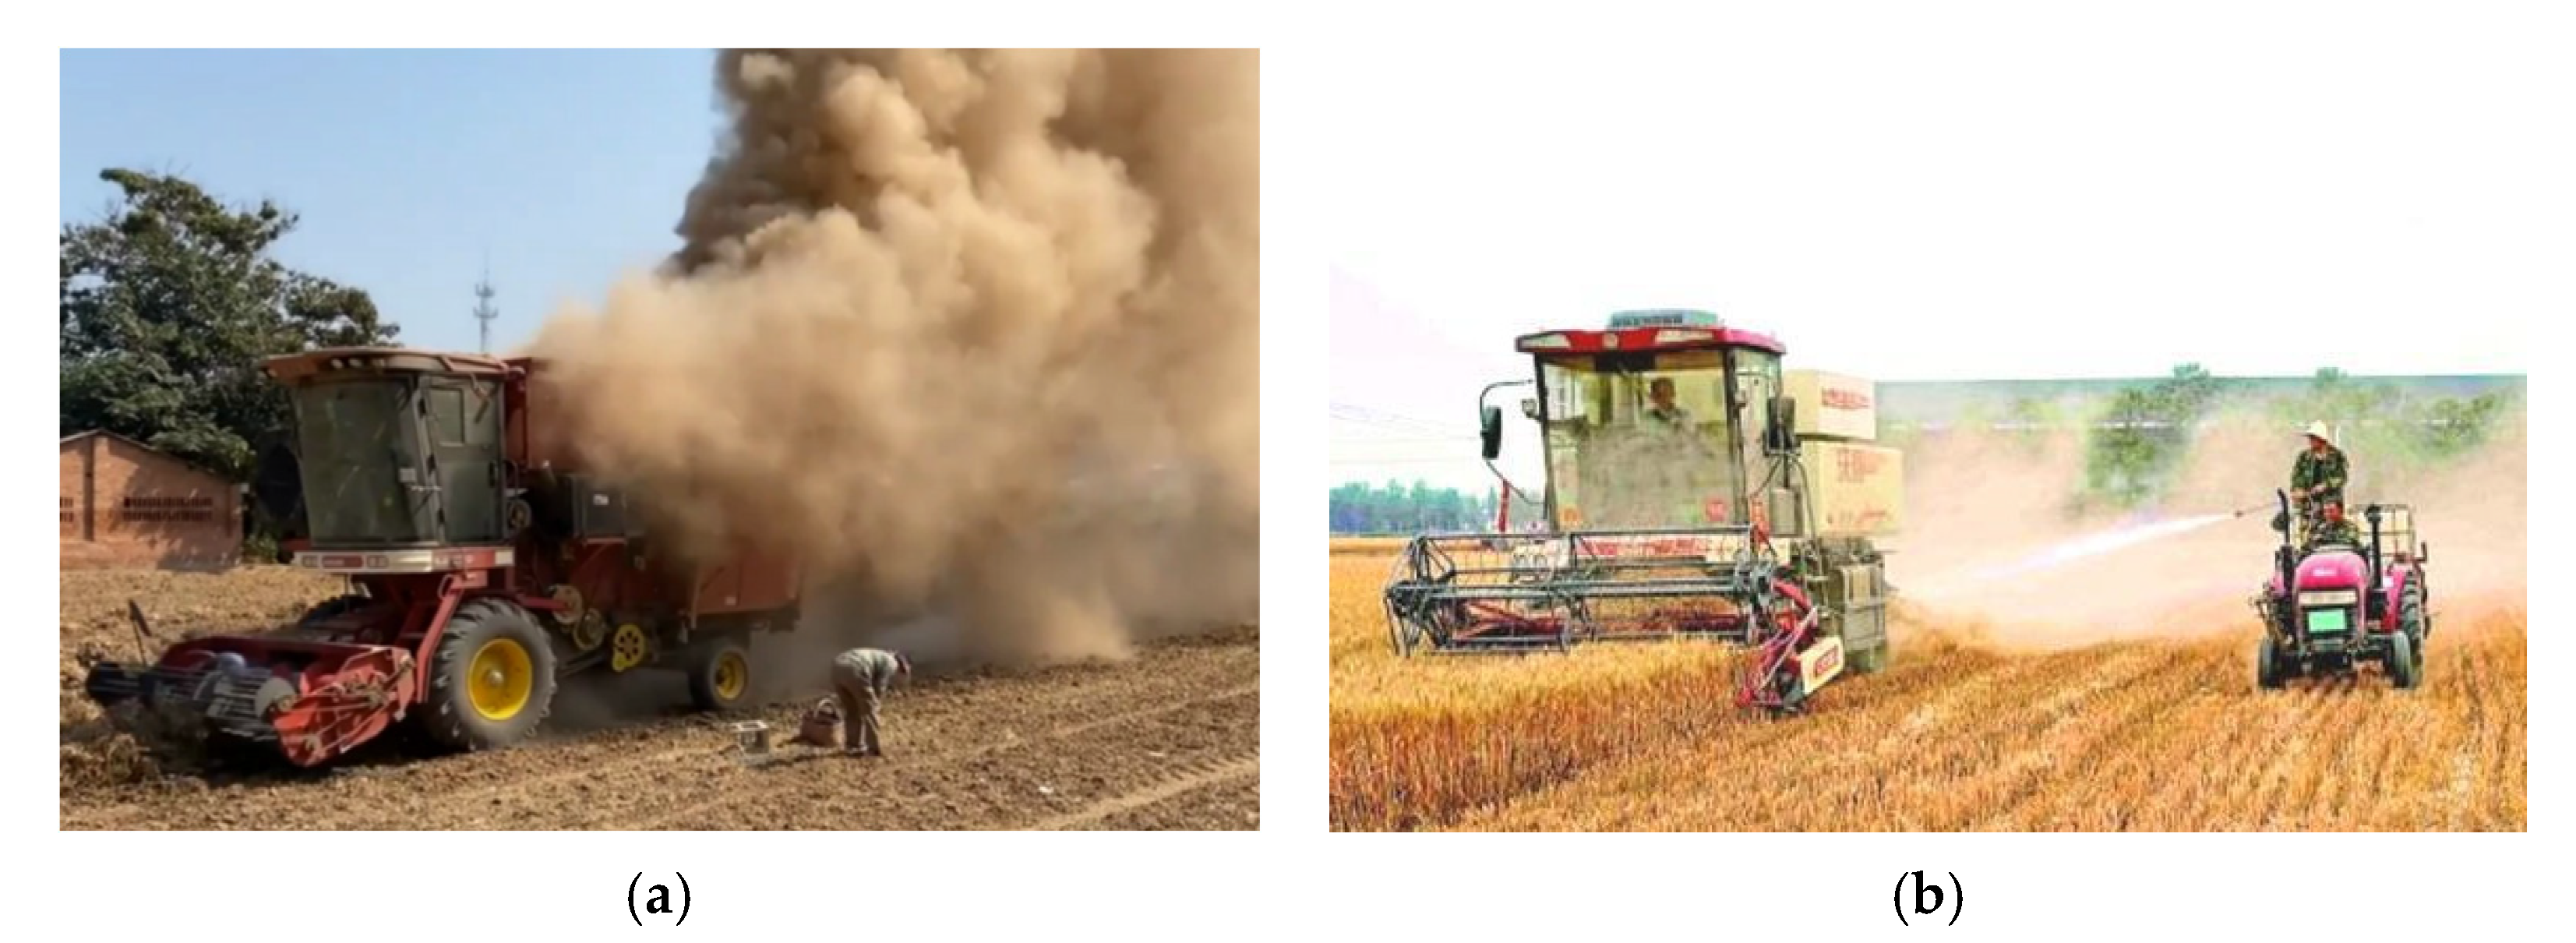
The fugitive dust in agricultural production is mainly soil dust particles, and contains some living particles such as plant fibers and fungi and microorganisms [26,27]. The particle size of soil dust particles is affected by many factors. Different regions, different soil types, and soil depths cause different soil particle size distributions [28], and even different tillage methods lead to changes in soil particle size [29]. According to the soil analysis method of Gee and Bauder, taking cultivated land as an example, among all soil particles with a particle size of less than 100 μm, the particle size between 20 and 50 μm accounts for 20.41%, and the particle size is between 50 and 100 μm. The proportion of particles is 78.9% [30]. The reason for the fugitive dust generated by agricultural harvesting machinery lies in the perturbation on the crop plants and soil during the operation. There are certain differences in the structure of harvesting machinery for different crops, but there are similarities in the structure of headers, threshing, and the cleaning device. Taking wheat harvesting machinery as an example, the main reasons for dust generation include: the perturbation and cutting of wheat plants by header; the impact, friction, and extrusion between the threshing device and the wheat plants [31]; the vibration of the sieve, the airflow field generated by the fan [32]; the impurities such as finely broken straw, chaff, dust, and ear head discharged from the miscellaneous outlet. For the picking and harvesting machinery in the two-stage peanut harvesting, the excavated peanut plants are dried on the ground and directly in contact with the surface soil [33], the perturbation of the plant and soil by the spring-finger cylinder pickup collector is one of the reasons for the generation of fugitive dust. The cleaning device mostly adopts the combination of sieve and fan [34]. The vibration of the sieve, especially the airflow generated by the fan generates a large amount of fugitive dust. Figure 3 shows the fugitive dust from agricultural harvesting machinery and an unscientific dust suppression method.

2.1.2. Hazards to Human Health

As an important part of suspended particulate matter in the air, fugitive dust is a serious threat to the health of human beings, especially children. According to the results of the third epidemiological survey on childhood asthma in Chinese urban areas in 2013 [35], compared with the results in 2000, the prevalence and cumulative prevalence of childhood asthma in China increased by 50.6% and 52.8%, respectively. Air pollution is one of the important factors causing this result [36]. Guo [37] et al. used a biomarker in epidemiological and toxicological studies, which help in understanding the biologic mechanisms underlying PM2.5-elicited adverse health outcomes. The identified biomarkers shed light on PM2.5-elicited inflammation, fibrogenesis, and carcinogenesis.
Many researchers have performed a lot of research on the sources, distribution, and hazards of atmospheric particles to human health, and deeply analyzed the pathogenic mechanism [38,39]. The researchers found that the particles were mostly deposited in the posterior pharyngeal wall, bronchioles, and the carina of the large respiratory tract, and the deposition rate was negatively correlated with the diameter, that is, the smaller the particle diameter, the easier it is to deposit in the respiratory tract [40,41,42]. Among the atmospheric particles, the part with a particle size larger than 2.5 μm is mainly deposited in the upper respiratory tract after being inhaled by the human body, while when the particle size is less than 2.5 μm, the particles can directly enter the bronchioles and alveolar ducts [43]. Studies have shown that high concentrations of inhalable particulate matter (PM10) are associated with reduced respiratory function, aggravated respiratory disease symptoms [44], and different components of particulate matter have effects on different diseases, such as secondary organic aerosols, elemental carbon, nitrates and ammonium on low birth weight [45,46], organic and elemental carbon, nitrates on cardiovascular disease [47,48], water-soluble As, Cd, Cs, Pb, Sb, Tl, and Zn, and polycyclic aromatic hydrocarbons (PAHs) on cancer [49,50], among others. PM10 can enter lung tissue, mechanically cause lung tissue cells such as epithelial cells, macrophages, and fibroblasts to produce defense responses and secrete inflammatory mediators, thereby causing lung disease [51]. During the COVID-19 pandemic in the past two years, many researchers have conducted studies on the relationship between atmospheric particulate matter and the spread of COVID-19 [52,53], and they found that atmospheric particulate matter can create a suitable environment for transporting the virus at greater distances than those considered for close contact [54].

2.1.3. Impact on the Ecological Environment and Climate

Fugitive dust not only harms human health, but also directly participates in the process of atmospheric dry deposition and wet deposition (rain, snow, frost, fog, etc.). On the other hand, dust can absorb or scatter sunlight, reduce atmospheric visibility, weaken solar radiation, and affect environmental thermal balance, which in turn affects environmental temperature and ecosystems.
Fugitive dust is not a single contaminant, but a heterogeneous mixture of particles of varying size, origin, and chemical composition. This inhomogeneity is not only reflected in the inhomogeneity of particle mass concentration between different locations in the same area, the inhomogeneous particle size distribution among different particles in the same location, and even the inhomogeneous composition within a single particle. When the Grantz [55] team studied the impact of atmospheric particles on vegetation and ecosystems, they found that some of the fugitive dust in the air is adsorbed by plants. Although the deposition process of these particles on the vegetation surface has no relation with their chemical properties, it mainly depends on the particle size distribution, but in the damage to plants after deposition is related to its chemical properties and particle size. The deposited fugitive dust may cause the wear of plant leaves and reduce the luminous flux of the leaves, and the chemical components in the fugitive dust can also cause damage to plants after being absorbed through the cuticle. The fugitive dust generated on the land spreads within a certain range under the action of airflow and wind force, and settles under the action of gravity. Atmospheric particulate matter deposition in offshore or near-water areas is one of the important ways for terrestrial materials to be transported into the sea and water [56]. The Xing Jianwei [57] team found that atmospheric particulate matter deposition accounted for 12.4% of the total exogenous input of active silicates in Jiaozhou Bay, which is an important potential factor leading to the imbalance of nutrient structure and the change in phytoplankton community structure in the water body of Jiaozhou Bay in recent decades. The active silicate input brought by dust will have a certain impact on the ecosystem of Jiaozhou Bay. At the same time, studies have also shown that the main source of Si in atmospheric particulate matter is agricultural activities and long-distance transmission of soil dust [58].
The impact of fugitive dust on the Earth’s climate is more complex. On the one hand, particulate matter in the form of aerosols has a “parasol effect” that absorbs and reflects solar radiation, thereby reducing the amount of radiation obtained by the Earth’s surface and lowering the Earth’s temperature [59]. On the other hand, aerosols, such as greenhouse gases, have a “greenhouse effect” that can increase the temperature of the earth [60]. Aerosols have a shorter life cycle than greenhouse gases, so their concentrations are more sensitive to changes in emissions. There is also a relationship between atmospheric particles and precipitation as these particles can act as condensation nuclei that form cloud droplets after absorbing water vapor [61].
Fugitive dust has a relatively high share rate in the source of atmospheric particulate matter, and it has certain hazards to human health and the environment. Combined with the actual situation of agricultural machinery, it is of great significance for the research on the dust control of agricultural harvesting machinery to analyze the causes and migration laws of fugitive dust, and to select appropriate fugitive dust control technology and measurement technology.

2.2. Fugitive Dust Suppression Technologies

Although some researchers have made some improvements to agricultural harvesting machinery by changing the structure or adding dust control devices to achieve a certain dust suppression effect, the research on dust reduction technology for agricultural harvesting machinery is still in its infancy. Further research needs to be combined with the actual situation of agricultural activities, and the existing dust reduction technologies in mining, coal power, and other fields should be used for reference.

2.2.1. Atomization Dust Suppression

Atomization dust suppression technology is one of the most widely used dust suppression technologies in China at this stage, and it is very common in mineral mining, construction engineering, urban environmental management, and other fields. The working principle of atomization dust suppression is that the water is pressurized by a high-pressure water pump, and the fine droplets formed by the nozzle absorb the dust particles in the air under the mechanism of inertial collision and Brownian diffusion, so that the dust particles increase in weight, bond, and settle. Due to its simple structure, spray dust suppression equipment is applied to agricultural harvesting machinery by some enterprises. Xinchang County Jiade Technology Development Co., Ltd. (Zhongshan, China) [62] invented a dust suppression device for agricultural machinery. The device uses a filter equipped with a filter element to initially filter the dusty gas, and then sprays water mist through the nozzle installed in the dust reduction chamber, and performs secondary dust reduction treatment on the filtered dusty gas to achieve a better dust reduction effect. The dust suppression devices for harvesting machinery developed by Xingguang Agricultural Machinery Co., Ltd. (XAM, Huzhou, China) and Yunxun Agricultural Technology Co., Ltd. (YAT, Guangzhou, China) both use a combination of enclosure and spray. The intelligent fog forest dust suppression system developed by the latter can be installed at the tail of peanut and wheat harvesting machinery. The straw and dust can be lowered by installing a windshield at the outlet of the harvesting machinery, and then spray water mist through the fan-shaped nozzle designed by us to achieve the dust reduction effect. Figure 4 shows the two types of dust suppression devices.
The effect of spray dust suppression is directly related to the surface tension of droplets. In general, by improving the atomization performance and adding additives, the droplets can obtain a smaller surface tension and better absorb dust particles. In the research of spray performance of different types of nozzles, Pollock [63] et al. used a phase Doppler particle analyzer to test the performance of four types of nozzles and conducted airflow induction and dust particle capture experiments under the same operating parameters. The experimental results showed that increasing the liquid pressure of the nozzle reduces the droplet size and increases the droplet velocity; the nozzle with a wider spray angle can induce more airflow, but the efficiency of dust collection is reduced. Han [64] et al. designed an arc fan nozzle and studied the spray field characteristics of the arc fan nozzle using a multiphase flow model (VOF) and found that the average width of the impact zone of the arc fan nozzle was 3.1 times that of the free jet zone. They conducted a comparative experiment with conical nozzles in the Fuchunke coal mine, and the average dust suppression efficiency of total dust and respirable dust increased by 34% and 32%, respectively. Wang [65] et al. built an experimental platform for spray dust reduction and measured the atomization performance of the internal mixing air atomizing nozzle and the swirl pressure nozzle. Experiments showed that the particle size of the droplets generated by the swirl pressure nozzle decreases with the increase in water pressure, and the size of the droplets generated by the air atomizing nozzle increases with the increase in water pressure, and with the increase in air pressure. Due to the use of compressed air as a pressure aid, the internal mixing air atomizing nozzle has a lower pressure requirement for water supply and lower power consumption. Common nozzles are shown in Figure 5.
Pure water droplets have a large surface tension, which makes it difficult to capture dust particles quickly and efficiently. Zhou [66] et al. studied the effects of different concentrations of dust suppressants on the static wetting characteristics and dust reduction efficiency of the solution and found that the three wetting characteristics of surface tension, sink time, and spreading work had the strongest correlation with dust reduction efficiency. This is used as an evaluation index to construct an evaluation system to determine the optimal dust suppressant concentration ratio. In order to avoid the uncertain impact of chemical components in dust suppressants on the environment, Zhang [67] et al. synthesized a hydroxypropyl guar gum through the nucleophilic substitution reaction between natural polymer guar gum and propylene oxide. The optimization and viscosity experiment of the dust agent showed that the dust suppression effect was the best when the concentration of hydroxypropyl guar gum was 0.8%, and the average dust reduction rate of total dust and inhalable dust increased to 83.94% and 84.08%, respectively.
The structure of the spray dust suppression device is simple, and the technical threshold and cost are relatively low, so it has been applied in the dust suppression technology of agricultural harvesting machinery. However, spray dust reduction requires continuous water supply, which affects the normal operation progress of agricultural harvesting machinery and increases the difficulty for the application of spray dust reduction in agricultural harvesting machinery.

2.2.2. Bag Filters

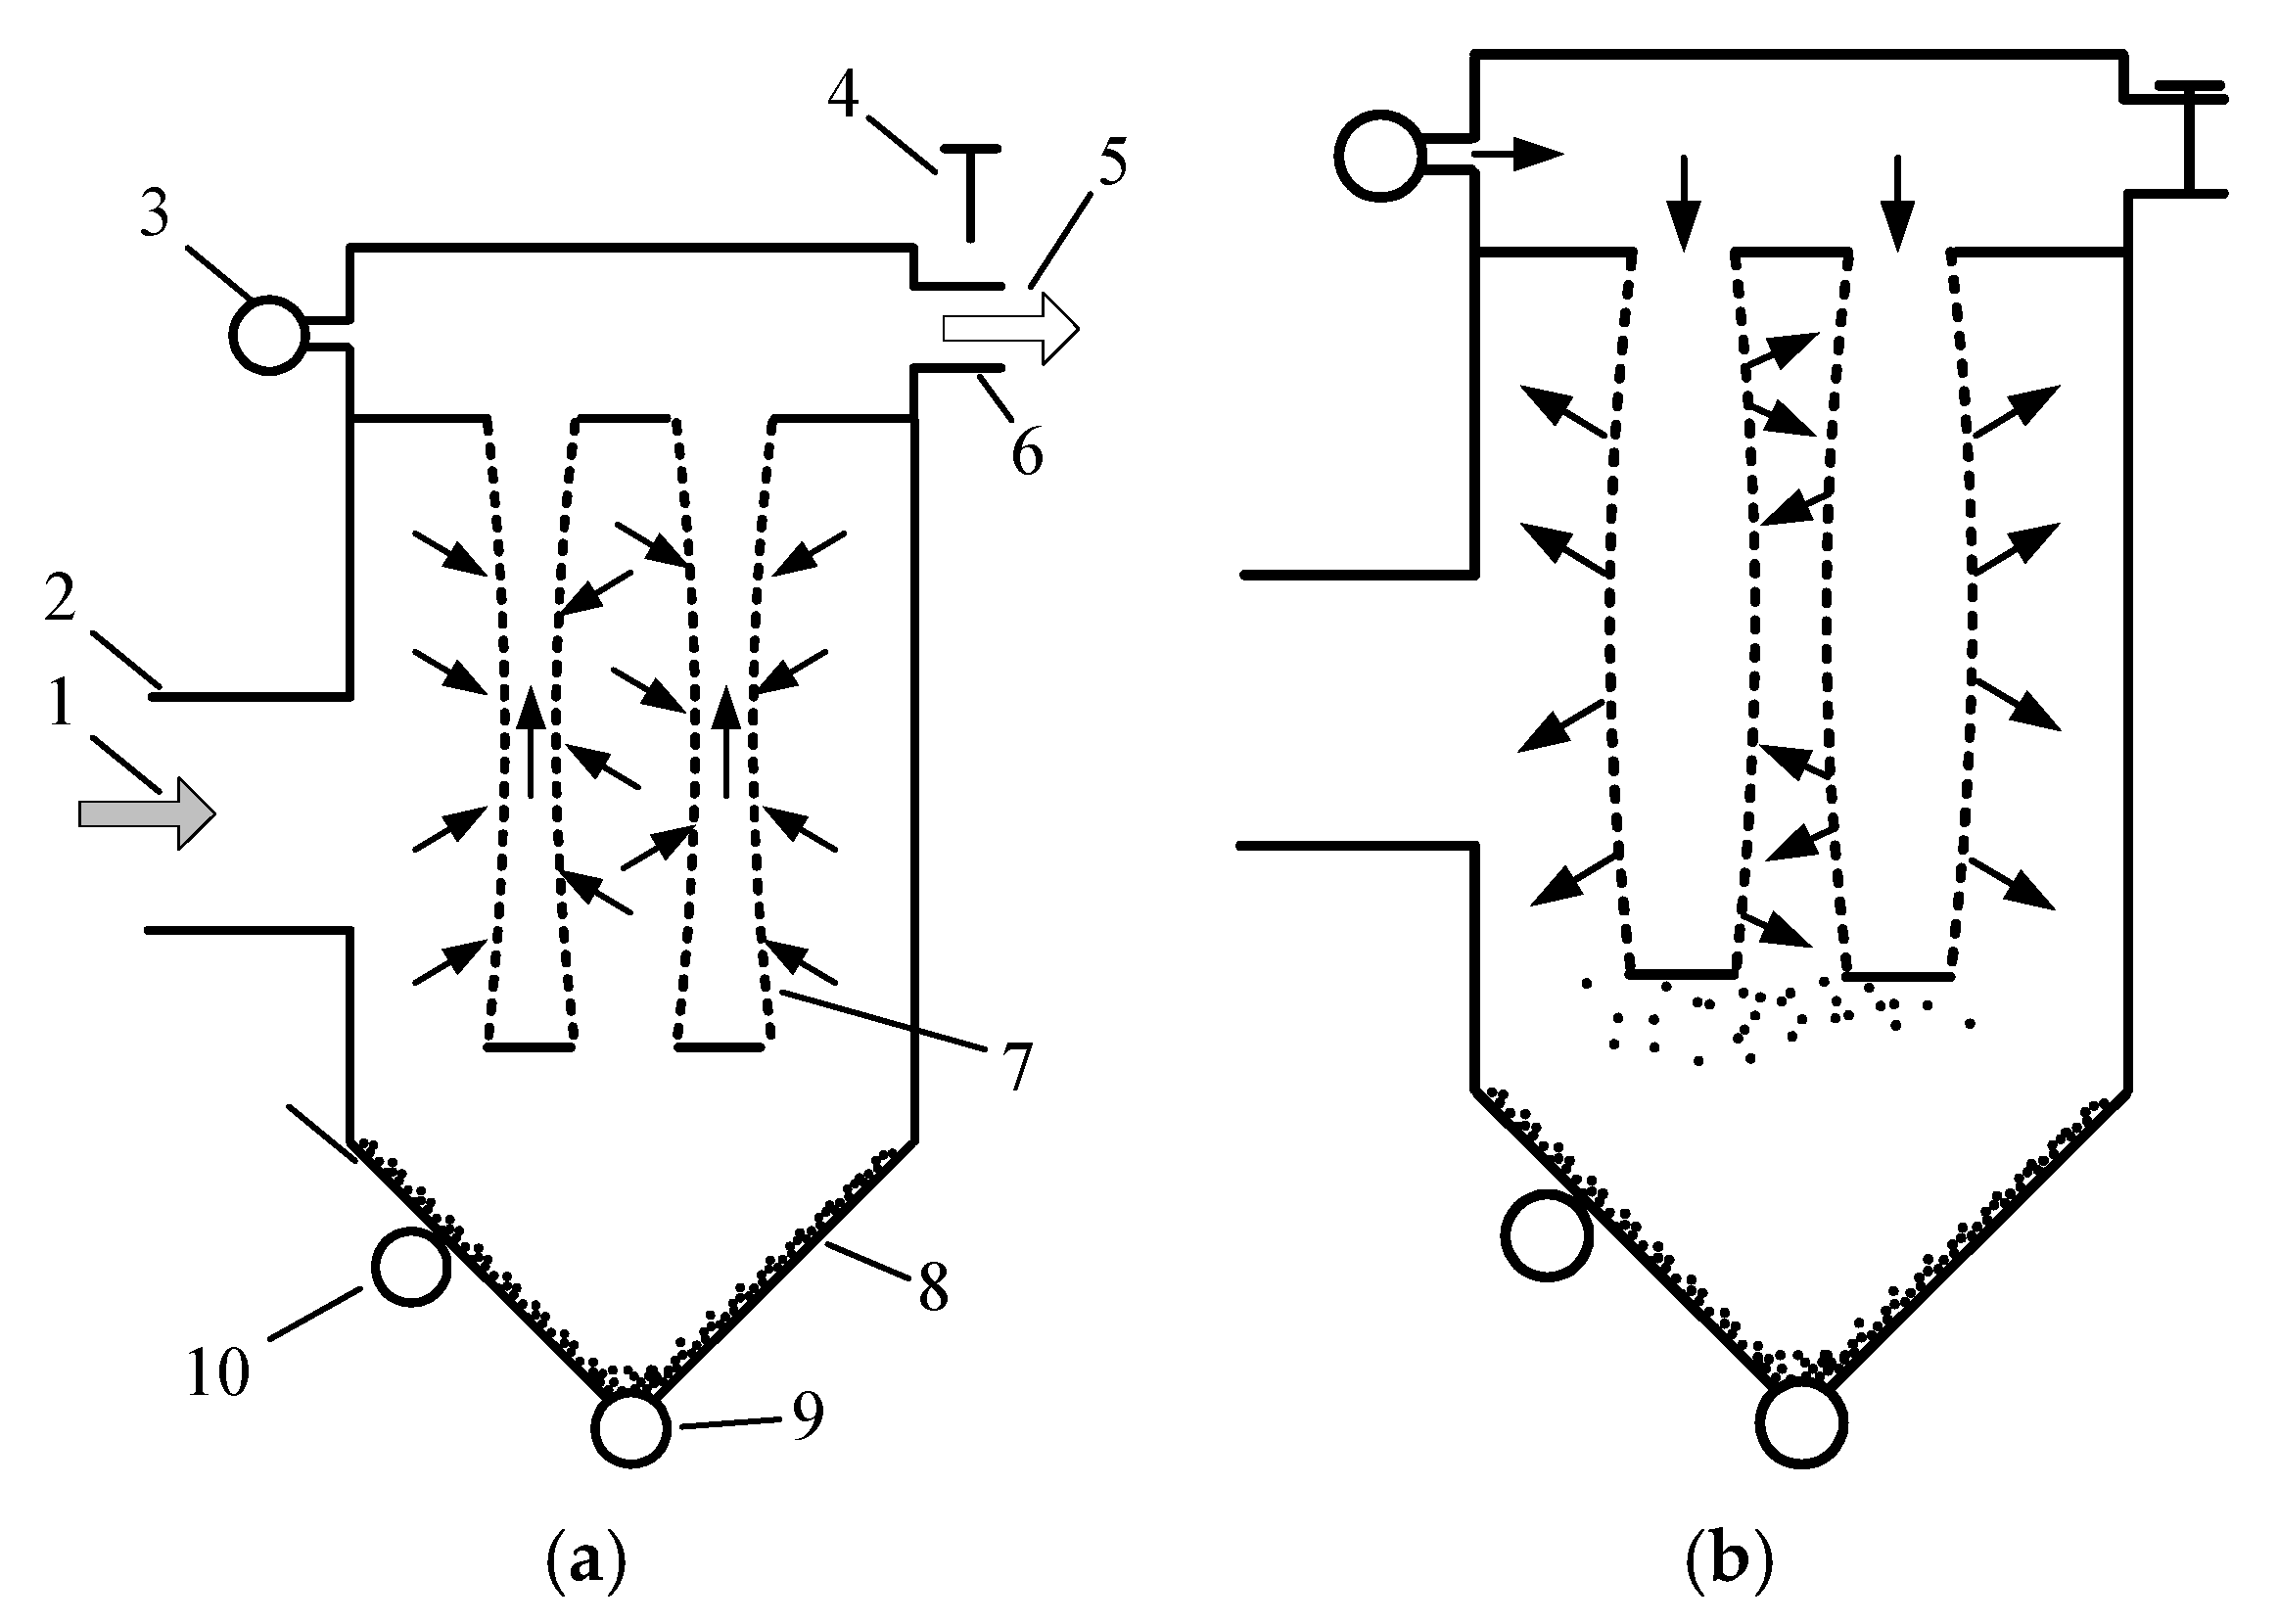
The main structure of bag filters includes gas inlet, filter bag (cartridge), gas outlet, etc. At the same time, dust removal devices such as air nozzles and mechanical rappers are also installed. Figure 6 shows two working states of a pulsed bag filter.
The main working principle of the bag filter is that when the dust-laden gas enters the clean device, part of the coarse particles are adsorbed on the filter material made of glass fiber, synthetic fiber, textile, etc., under the action of inertial collision, forming Primary layer [68]. With the assistance of the initial layer, the interception of smaller particles can be achieved. With the continuous accumulation of dust on the filter bag, the overall airflow resistance of the filter equipment gradually increases, the power consumption of the equipment increases [69], and some particles penetrate the filter bag and can be discharged from the air outlet under the action of pressure, affecting the dust removal efficiency. Therefore, after the filter bag has accumulated enough dust, it should be cleaned under the premise of protecting the initial layer. Zhang Yongchuan [70] et al. designed a dust suppression system for rice and wheat combine harvesters installed with negative pressure fans and filter cartridges. In the application of computational fluid dynamics (CFD), Le Wenyi [71] et al. studied the airflow distribution of a combined bag filter under four boundary conditions and found that the relative angle between the deflector and the air inlet and outlet was set to 90° can effectively improve the dust removal efficiency of the dust removal device. When the ambient humidity is too high, it has a certain impact on the performance of the bag filter. Boudhan [72] et al. found that when the gas at the inlet contains water vapor, the capillary condensation of water makes the powder layer more compact, which accelerates the increase in the pressure difference and reduce the life of the filter bag. For a pulse bag filter, the performance of the air nozzles affects the dust removal effect. Shim [73] et al. designed a pulse bag filter with a double annular slot air nozzle, which can generate more secondary air flow and achieve better dust removal compared with traditional hole nozzles and nipple nozzles. High dust removal efficiency can be obtained under low pulse pressure.
Bag filters have the characteristics of high dust removal efficiency, simple structure, and stable operation. This type of dust removal device has good capture efficiency for particles of various particle size ranges, but it has certain requirements on ambient temperature and humidity. When the temperature is too low or the humidity is high, the dust particles easily block the filter bag after absorbing water, which greatly increases the resistance of the dust collector. When the temperature is too low or the humidity is high, the dust particles easily block the filter bag after absorbing water, which greatly increases the resistance of the device. At the same time, if it is used as a vehicle-mounted dust removal device, the vibration of the machine affects the formation of the initial layer, thereby affecting the dust removal efficiency of the initial stage of work after the bag filter is started.

2.2.3. Electrostatic Precipitator

The working principle of electrostatic precipitator is to ionize the air through a high-voltage electric field. When the dust particles enter, they collide with the ions that move freely at high speed in the electric field, so as to be charged. Driven by the electric field force, these charged dusts are adsorbed and deposited by the dust collecting electrode, and finally collected by the dust cleaning device. The whole process can be summarized into five steps: ionizing, charging, driving, depositing, and removing. Common electrostatic precipitators can be divided into single-zone and dual-zone devices according to whether ionization and adsorption are in the same area [74] and can also be divided into dry and wet devices according to whether the dust removal is by spraying. Figure 7 shows the working principle of a common single-zone electrostatic precipitator.
Electrostatic precipitator technology has been applied to flue gas dust removal for more than 100 years [75]. The Coulomb force of a suspended charged particle in an electric field is provided by:
F = q E
where F is the Coulomb force (N), q the particle charge (C) and E is the electric field (V/m). The viscous force on a moving particle is provided by:
F s = 3 π μ d p w e C m
where w e is the velocity of the particles moving towards the collecting electrode, μ the viscosity of air (Pa·s), dp the aerodynamic equivalent diameter of the particle, and Cm the Cunningham correction factor.
The fine particle capture rate can be further improved by adding a pre-charger. Yang [76] et al. developed a combined wet electrostatic precipitator using a perforated pre-charger, which can generate high-density ions to improve the charging effect of fine particles. They applied this technology in a coal-fired power plant of 1000 MW scale, which can effectively improve the collection efficiency of fine particles in the size range of 0.1~1 μm by reducing the temperature. The use of a pre-charger reduces the particulate matter emission level to 0.43 mg/m3 with an additional energy consumption of less than 3%. In order to deal with high-resistivity dust, Mizuno [77] et al. obtained high-efficiency instantaneous pulse voltage with pulse voltage and semiconductor switching devices, formed non-thermal plasma for processing high-resistivity dust, and used an LC oscillation circuit to recover the energy in the capacitor, reducing energy consumption.
The electrostatic precipitator can work at a higher temperature and has the characteristics of high efficiency, low resistance, and no consumables. However, the electrostatic precipitator is large in size, complex in structure, and requires relatively high maintenance. At the same time, it has certain restrictions on the specific resistance of the dust that needs to be treated. Therefore, such devices have certain limitations in the fugitive dust control of agricultural harvesting machinery, and it can be considered to be used in conjunction with other dust suppression technologies to achieve better results.

2.2.4. Cyclone Dust Collector

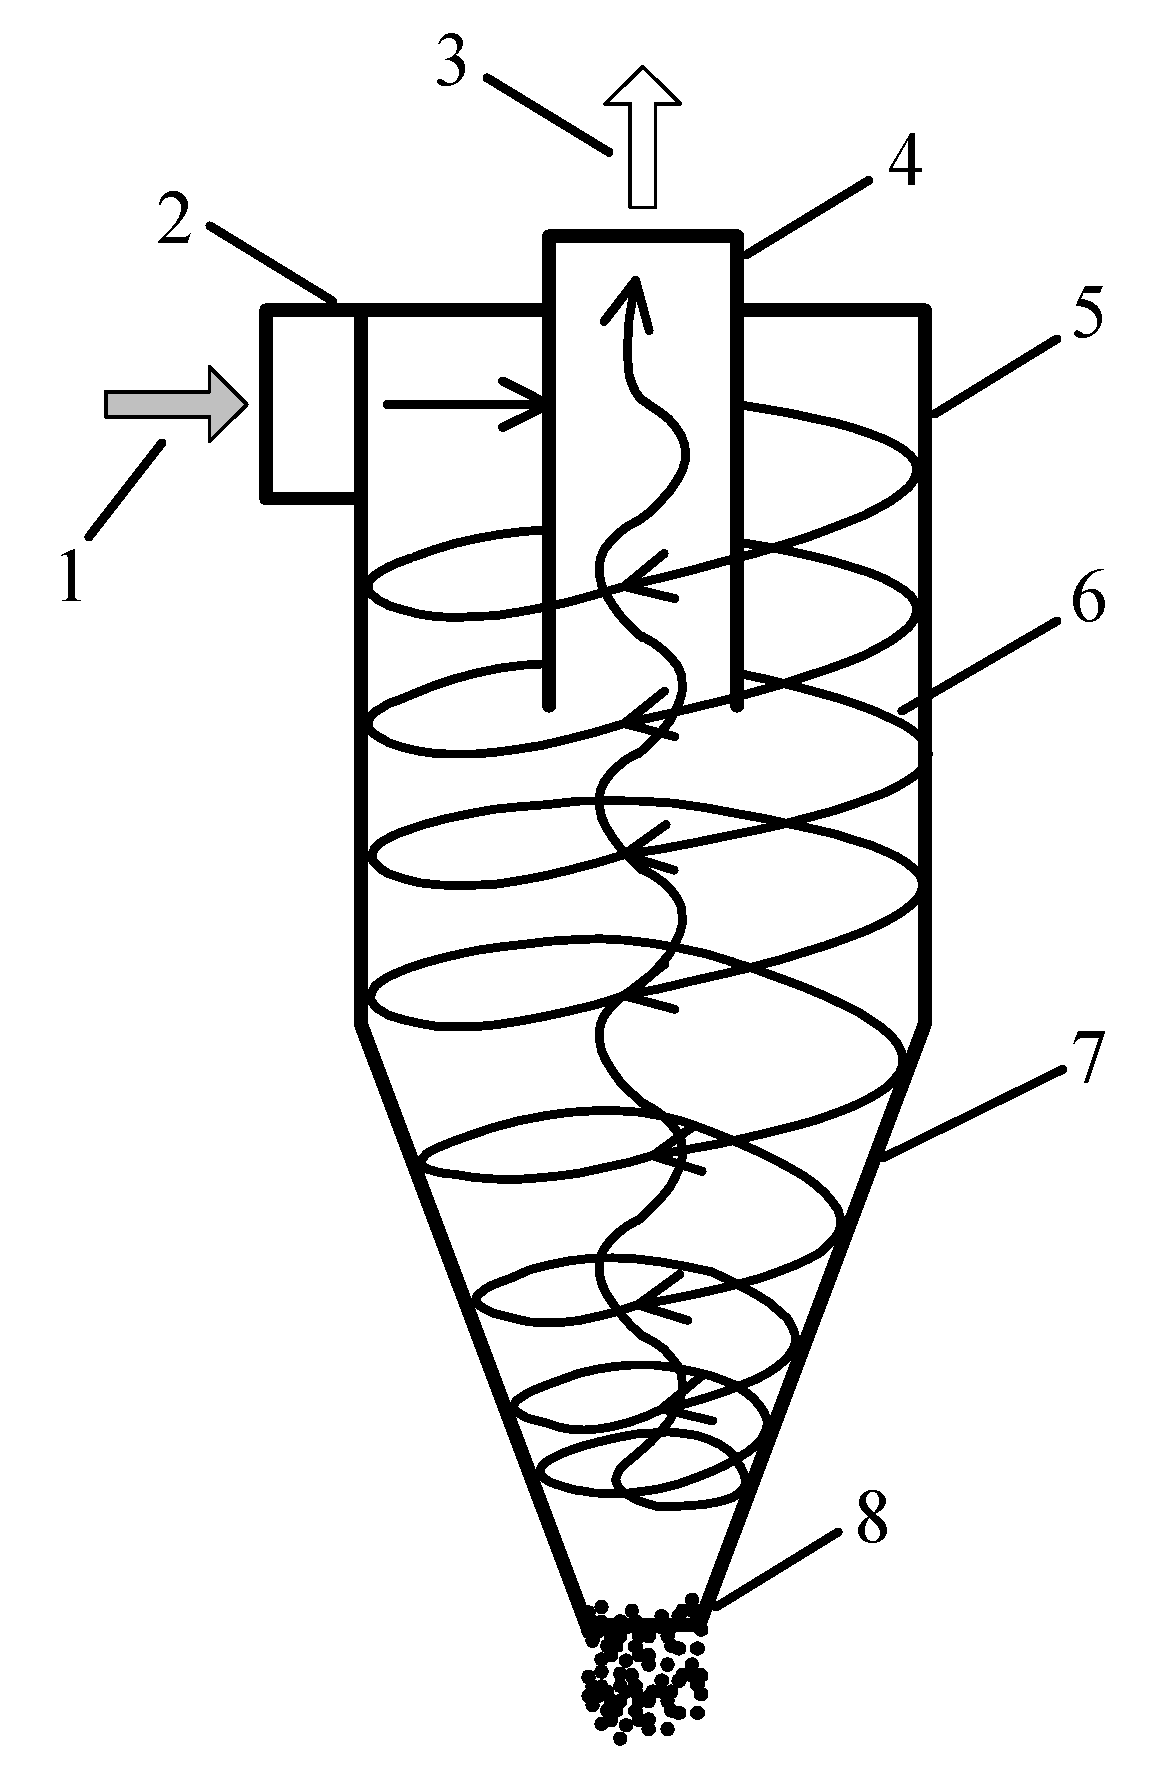
When the cyclone dust collector is working, the dusty gas needs to be sent into the dust collector to form a high-speed swirling flow. Under the action of centrifugal force, the solid dust particles are guided to the inner wall of the dust collector to collide and lose momentum. The dust particles separated from the swirling gas slide along the inner wall of the cyclone to the dust collecting device, as shown in Figure 8. The cyclone dust collector can maintain trouble-free operation for a long time and has the advantages of being simpler and more reliable than other dust removal equipment [78].
The equations of particle motion can be expressed as:
d u p d t = α ( u g u p )
d v p d t = α ( v g v p ) + w p 2 r p
d w p d t = α ( w g w p ) v p w p r p
α = 18 μ C D ρ p d p 2 R e 24 , C D = 0.22 + 24 R e [ 1 + 0.15 ( R e ) 0.6 ]
where u, v, and w are the velocity components of gas and particles on the x, y, and z coordinate axes, respectively (g for gas and p for particle), rp is the aerodynamic equivalent radius of particle, μ is the viscosity of air, ρp is the density of the particulate matter, dp is the aerodynamic equivalent diameter of particle, and Re is the Reynolds number.
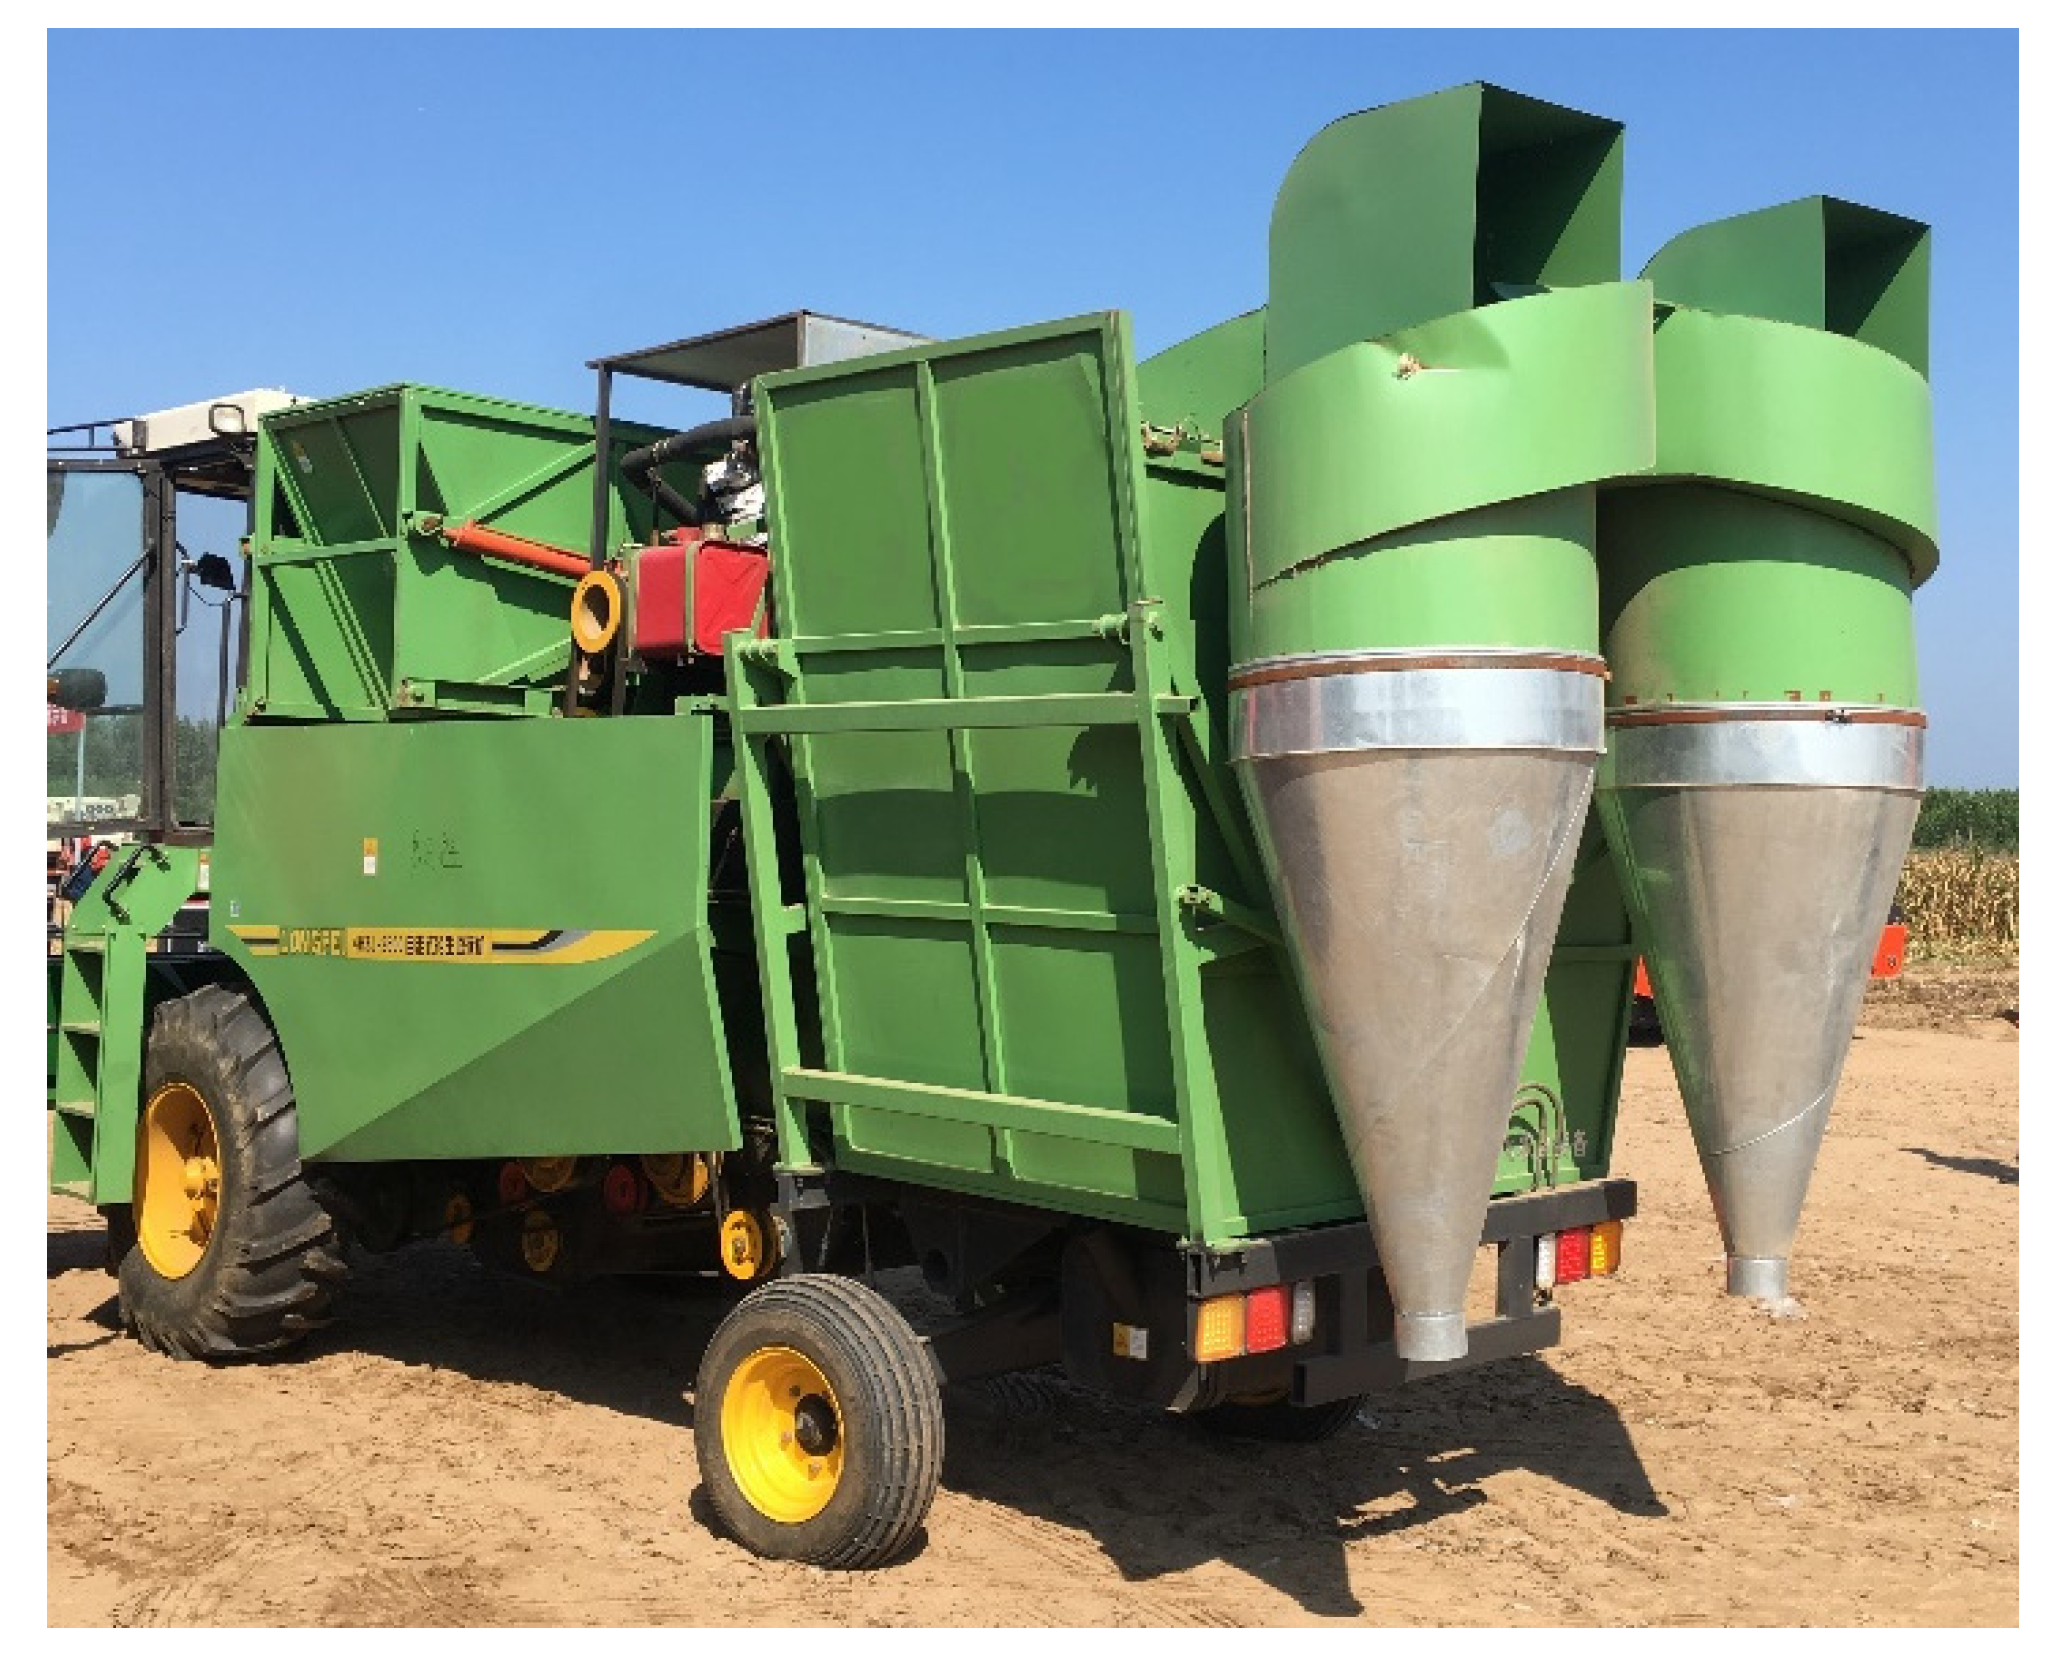
The size of each component of the cyclone is mainly determined by the flow of dusty gas being processed. Under the condition that the size of each component remains unchanged, multiple cyclone dust collectors can obtain higher dust removal efficiency by connecting in series and can handle larger gas flow by connecting them in parallel. The dust suppression system equipped with the 4HZJ-2500 self-propelled peanut picking and harvesting machine produced by Longfei Agricultural Machinery (LAM) Co., Ltd. (Qingdao, China) adopts the design of parallel cyclone dust collectors to deal with the large flow of dusty gas generated by high-power fans, as shown in Figure 9.
In order to improve the dust collection efficiency of the cyclone dust collector, Shin [79] et al. studied the cyclone dust collector suitable for the extreme environment of 600 kPa high pressure and 400 °C high temperature, and found that within a certain flow range, increasing the pressure and reducing the temperature improves the dust collection efficiency. Leith [80] et al. studied five pressure loss models and four dust reduction efficiency models commonly used in cyclone dust collectors and evaluated their performance. They finally chose Shepherd and Lapple’s pressure loss model and Leith and Licht’s dust reduction efficiency model as the best design method for the design and improvement of cyclone dust collectors and obtained higher dust collection efficiency. Tekam [81] et al. analyzed the effect of cyclone design parameters on pressure loss and dust collection efficiency, determined the optimal test parameters and conducted experiments. They found that the main factors affecting the pressure loss and dust reduction collection were inlet height, cylinder height, and outlet height.
The cyclone dust collector has the characteristics of simple structure, convenient operation, and maintenance, and has high separation efficiency for particles larger than 5 μm, which is more suitable for the control of fugitive dust from agricultural machinery operations. For fine particles, the dust collection efficiency of the cyclone is reduced. Therefore, by combining the cyclone dust collector with its combined dust removal device, higher dust collection efficiency can be obtained. Wang [82] et al. greatly enhanced the collection efficiency of particles, especially fine particles with a particle size of about 2 μm, by adding ultrasonic atomization for dust reduction. Zhang Jianping [83] et al. designed a cyclone dust collector with electrodes and a magnetic field. The charged particles in the dusty gas are subjected to the double action of the electric field force and the Lorentz force, which changes the direction of hitting the dust collecting electrode, so that they are easier collect.

2.3. Measurement Methods

The effect of fugitive dust suppression requires certain quantitative indicators. Fugitive dust is usually measured by mass concentration, and the unit is generally μg/m3 or mg/m3. The effect of fugitive dust suppression is provided by:
η = C 1 C 0 C 1 × 100 %
where C0 is mass concentration of particulate matter before dust suppression and C1 is mass concentration of particulate matter after dust suppression. The mass concentration is provided by:
C = M Q × T
where M is the mass of the collected particulate matter, Q is the air flow of the measuring device, and T is the sampling period. Measurement methods mainly include gravimetric analysis, beta attenuation, tapered element oscillating microbalance, piezoelectric crystal, and light scattering, etc. [84,85].

2.3.1. Gravimetric Analysis

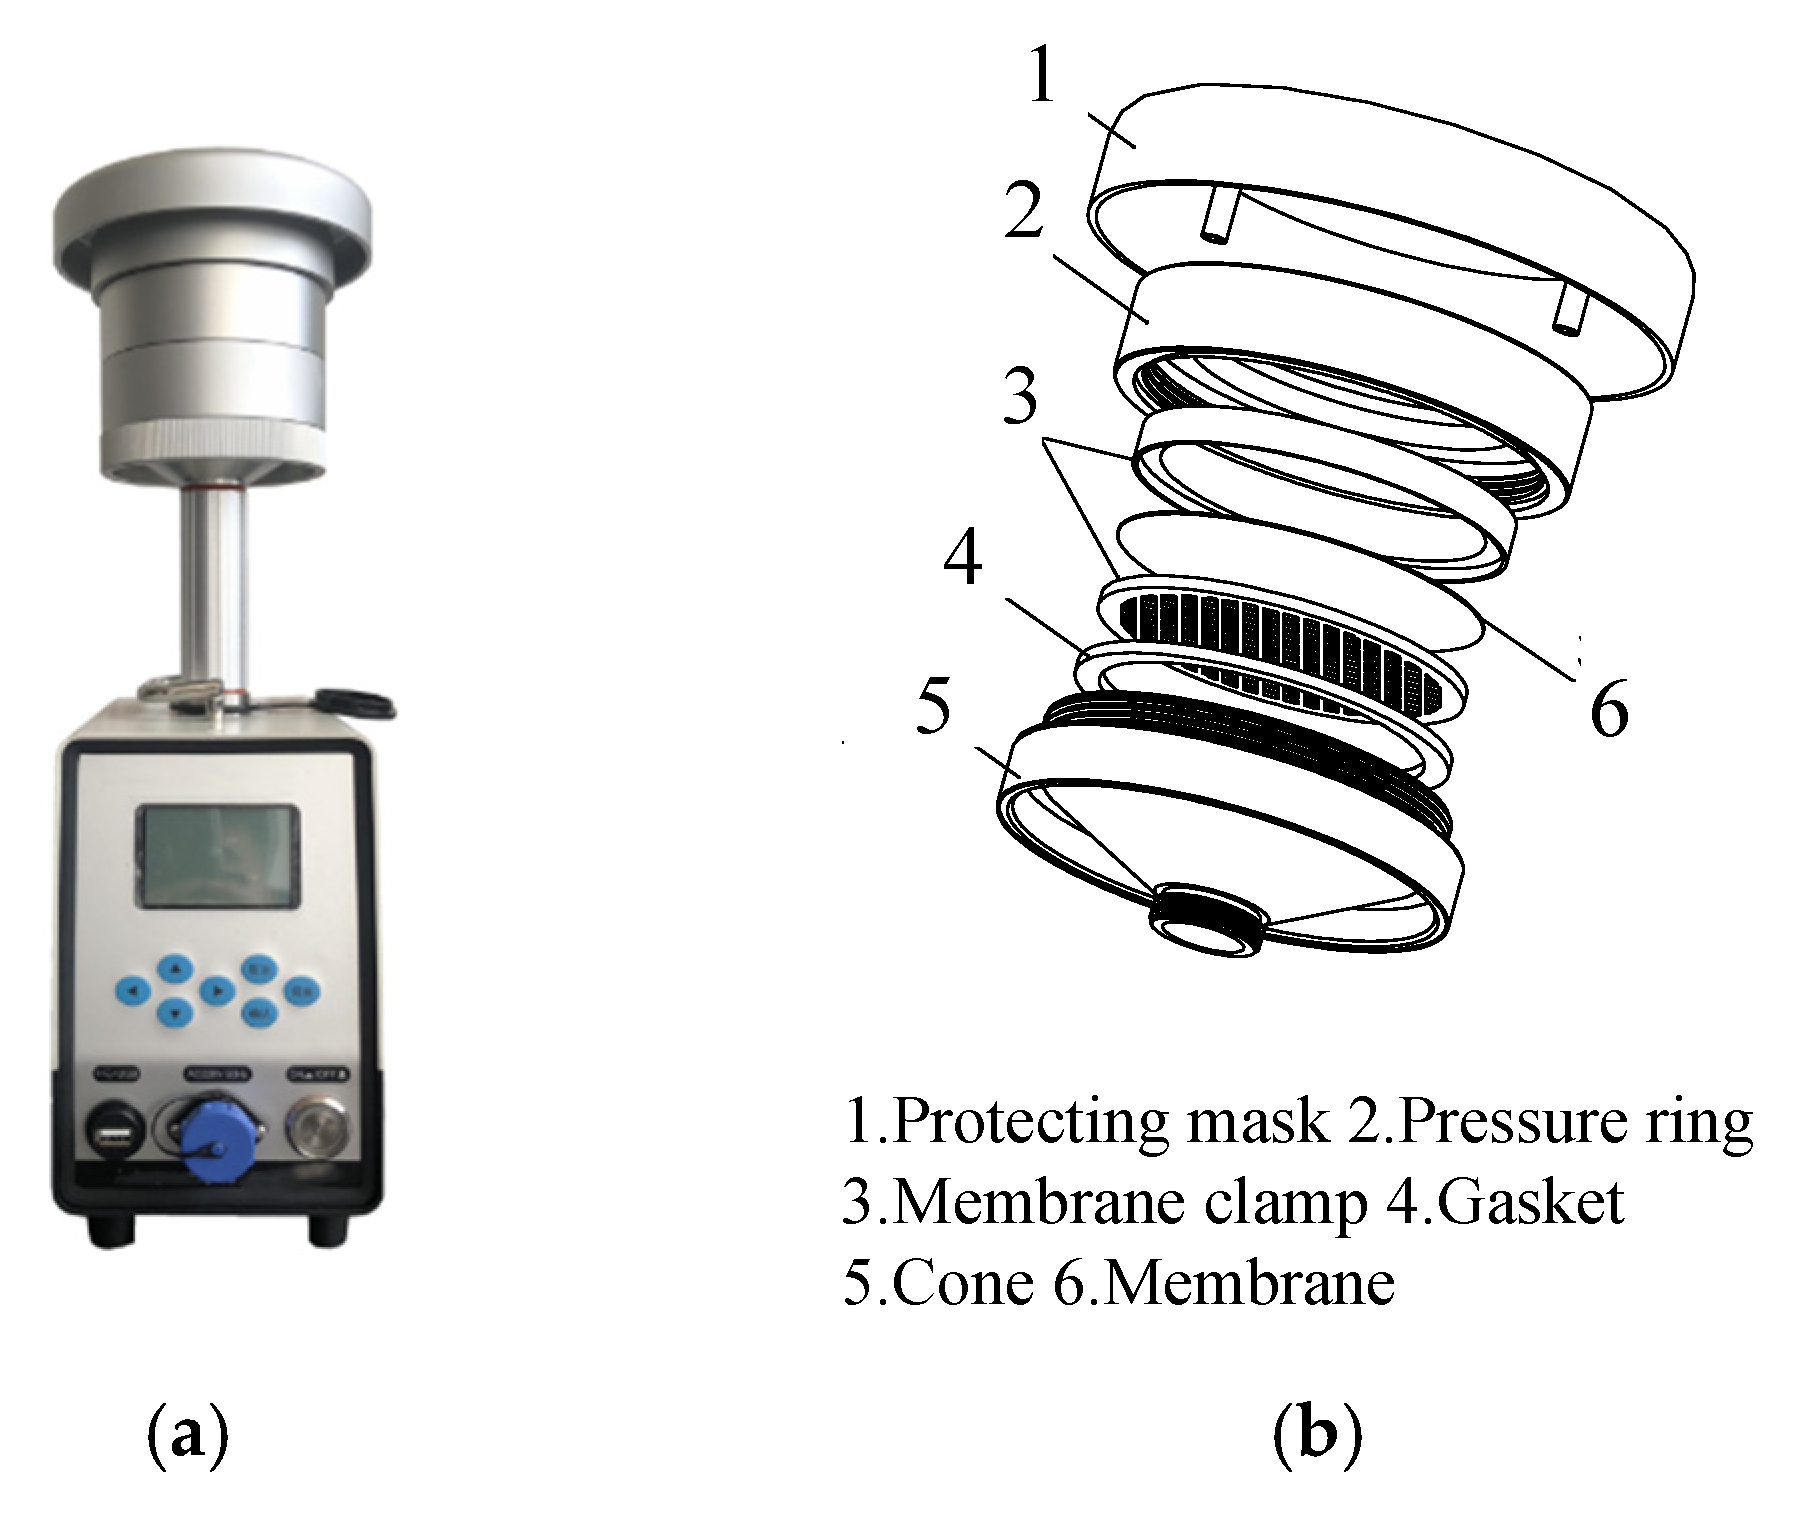
Gravimetric analysis, also known as the filter weighing method, is the most basic method for dust measurement. It is often used as a measure of the reliability of other methods and has received many theoretical and applied studies over the past few decades [86]. The filter weighing method works by extracting dusty gas through a stable sampler, sieving particles of different size ranges with the help of a cutter installed on it, and trapping them on the filter membrane. The dusty gas volume is calculated according to the sampling time and flow rate, and the mass increment of the filter membrane (i.e., the mass of the particulate matters) is weighed by an analytical balance to calculate the mass concentration of the fugitive dust. This method is a direct measurement method. The main structure of a medium-flow particle sampling device and its cutter is shown in Figure 10.
In the selection of filter membranes, the quartz filter membrane is the most used by Chinese scholars in the analysis and research of PM2.5 source [87], as shown in Table 1.
In the application of filter weighing method, Cui [88] et al. studied the chemical characteristics and sources of PM10 in Guangzhou area. They used a four-channel particle sampler for sampling, and the average mass concentration of PM10 in the seven sampling areas was 125.7 μg/m3. Wu [89] et al. studied the pollution characteristics of polycyclic aromatic hydrocarbons in TSP in Tianjin in winter and measured the mass concentration of total suspended particulate matter in 13 sampling points using the filter weighing method. In order to study the physicochemical characteristics and transmission pathways of atmospheric particulate matter in the sand–dust period in Harbin, Huang [90] et al. measured the mass concentrations of TSP, PM10, and PM2.5 using the filter weighing method. Considering the volatilization characteristics of some components in atmospheric particles, when using the filter weighing method to study the concentration of particulate matter, it is necessary to properly preserve the samples and complete the weighing measurement in a short time as much as possible. In the study of nitrate and sulfate concentrations in PM10, Dunwoody [91] et al. found that the average value of nitrate measured after 6 to 8 months of storage was 86% lower than the average value when sampling was completed, while the value of sulfate remained unchanged. This showed that there is a rapid loss of nitrate on the quartz filter membrane. Zhang [92] et al. studied the fugitive dust generated by peanut harvesting machinery, and measured PM2.5, PM10, and TSP at multiple sampling points by gravimetric analysis method. They found that the dust particles discharged during the mechanized peanut harvesting were concentrated within the 2~30 µm size range. They measured the concentrations of PM2.5, PM10, and TSP at multiple sampling points, among which the concentrations of these three particles at the sampling point 3 m away from the harvesting machinery path, reaching 2.38 mg/m3, 7.65 mg/m3, and 10.71 mg/m3, respectively, and the concentrations decreased rapidly when the distance increased to 20 m.
The filter weighing method has a simple principle and is a commonly used dust measurement method. However, it takes a long time to sample, the procedure is more complicated, the filter membrane needs to be dried before and after sampling, and it can only measure the average value within a specific period of time (usually at least 24 h), so it is difficult to realize real-time measurement. Therefore, in the fugitive dust measurement of agricultural harvesting machinery, it is suitable for long-term measurement as a fixed detection point.

2.3.2. Beta Attenuation

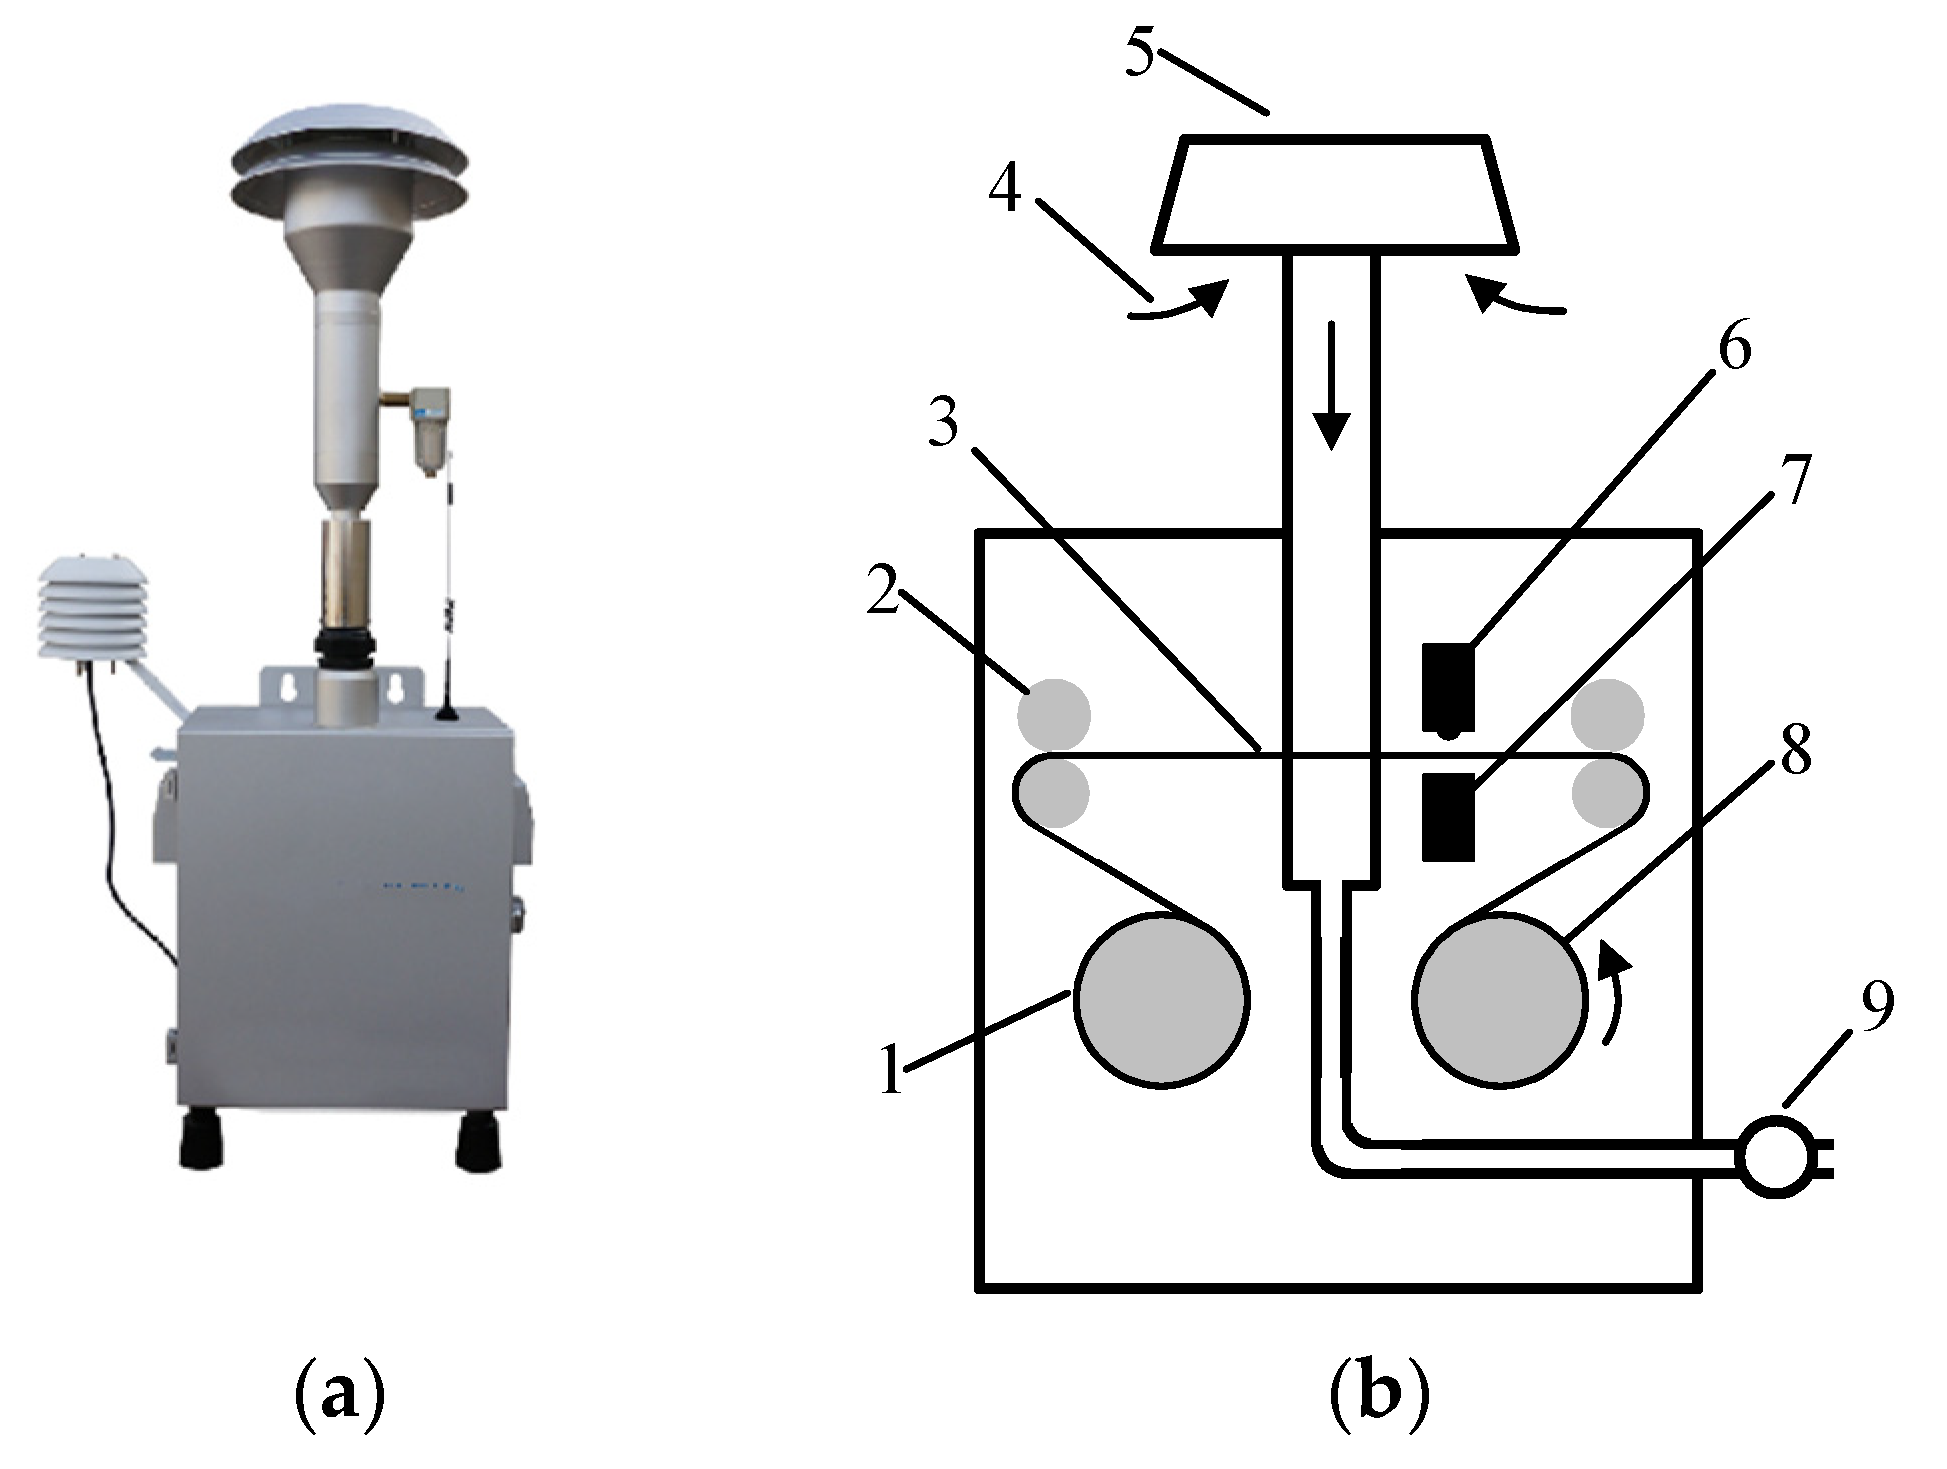
Beta attenuation is also known as β-ray attenuation. The working principle of this measurement method is that the β-rays pass through the filter paper belt used to trap particulate matter before and after sampling, and the mass of the particles collected on the filter paper belt is obtained according to the change in the attenuation of beta rays. Then, the mass concentration of particulate matter can be obtained through the flow value, which can realize continuous measurement. A common β-ray particle measurement device and its working principle are shown in Figure 11.
Beta attenuation is widely used in the field of atmospheric environmental monitoring. Cheng [93] et al. analyzed the PM2.5 pollution status of 45 megacities around the world, and 28 of the 45 cities use β-ray attenuation to measure the concentration of particulate matter in the atmosphere. When Zhang [94] et al. studied the particle size distribution of chemical components of atmospheric aerosols during haze weather in the northern suburbs of Nanjing, they used carbon-14 as a ray source to measure PM2.5 in the atmosphere, which reached 69.98 ± 31.70 μg/m3 on haze days. Triantafyllou [95] et al. used the beta attenuation method to measure PM2.5 and PM10 in atmospheric particulate matter in the suburbs of Athens, Greece for a period of 4 years, and systematically compared them with the measurement results of the filter weighing method. The correlation coefficients were 0.79 and 0.85, respectively. The β-ray attenuation method has high measurement accuracy, and its response is faster than the filter weighing method, usually up to 1 h, and has been widely used in environmental monitoring stations in many countries. However, its price is relatively expensive, the filter paper belt needs to be replaced regularly, and the instrument with radioactive source may be harmful in the farmland operation environment, which limits its application and promotion in the fugitive dust measurement of agricultural harvesting machinery to a certain extent. Therefore, this type of measuring device can be applied to a small number of fugitive dust monitoring stations set up around agricultural areas to obtain long-term fugitive dust change data.

2.3.3. Tapered Element Oscillation Microbalance

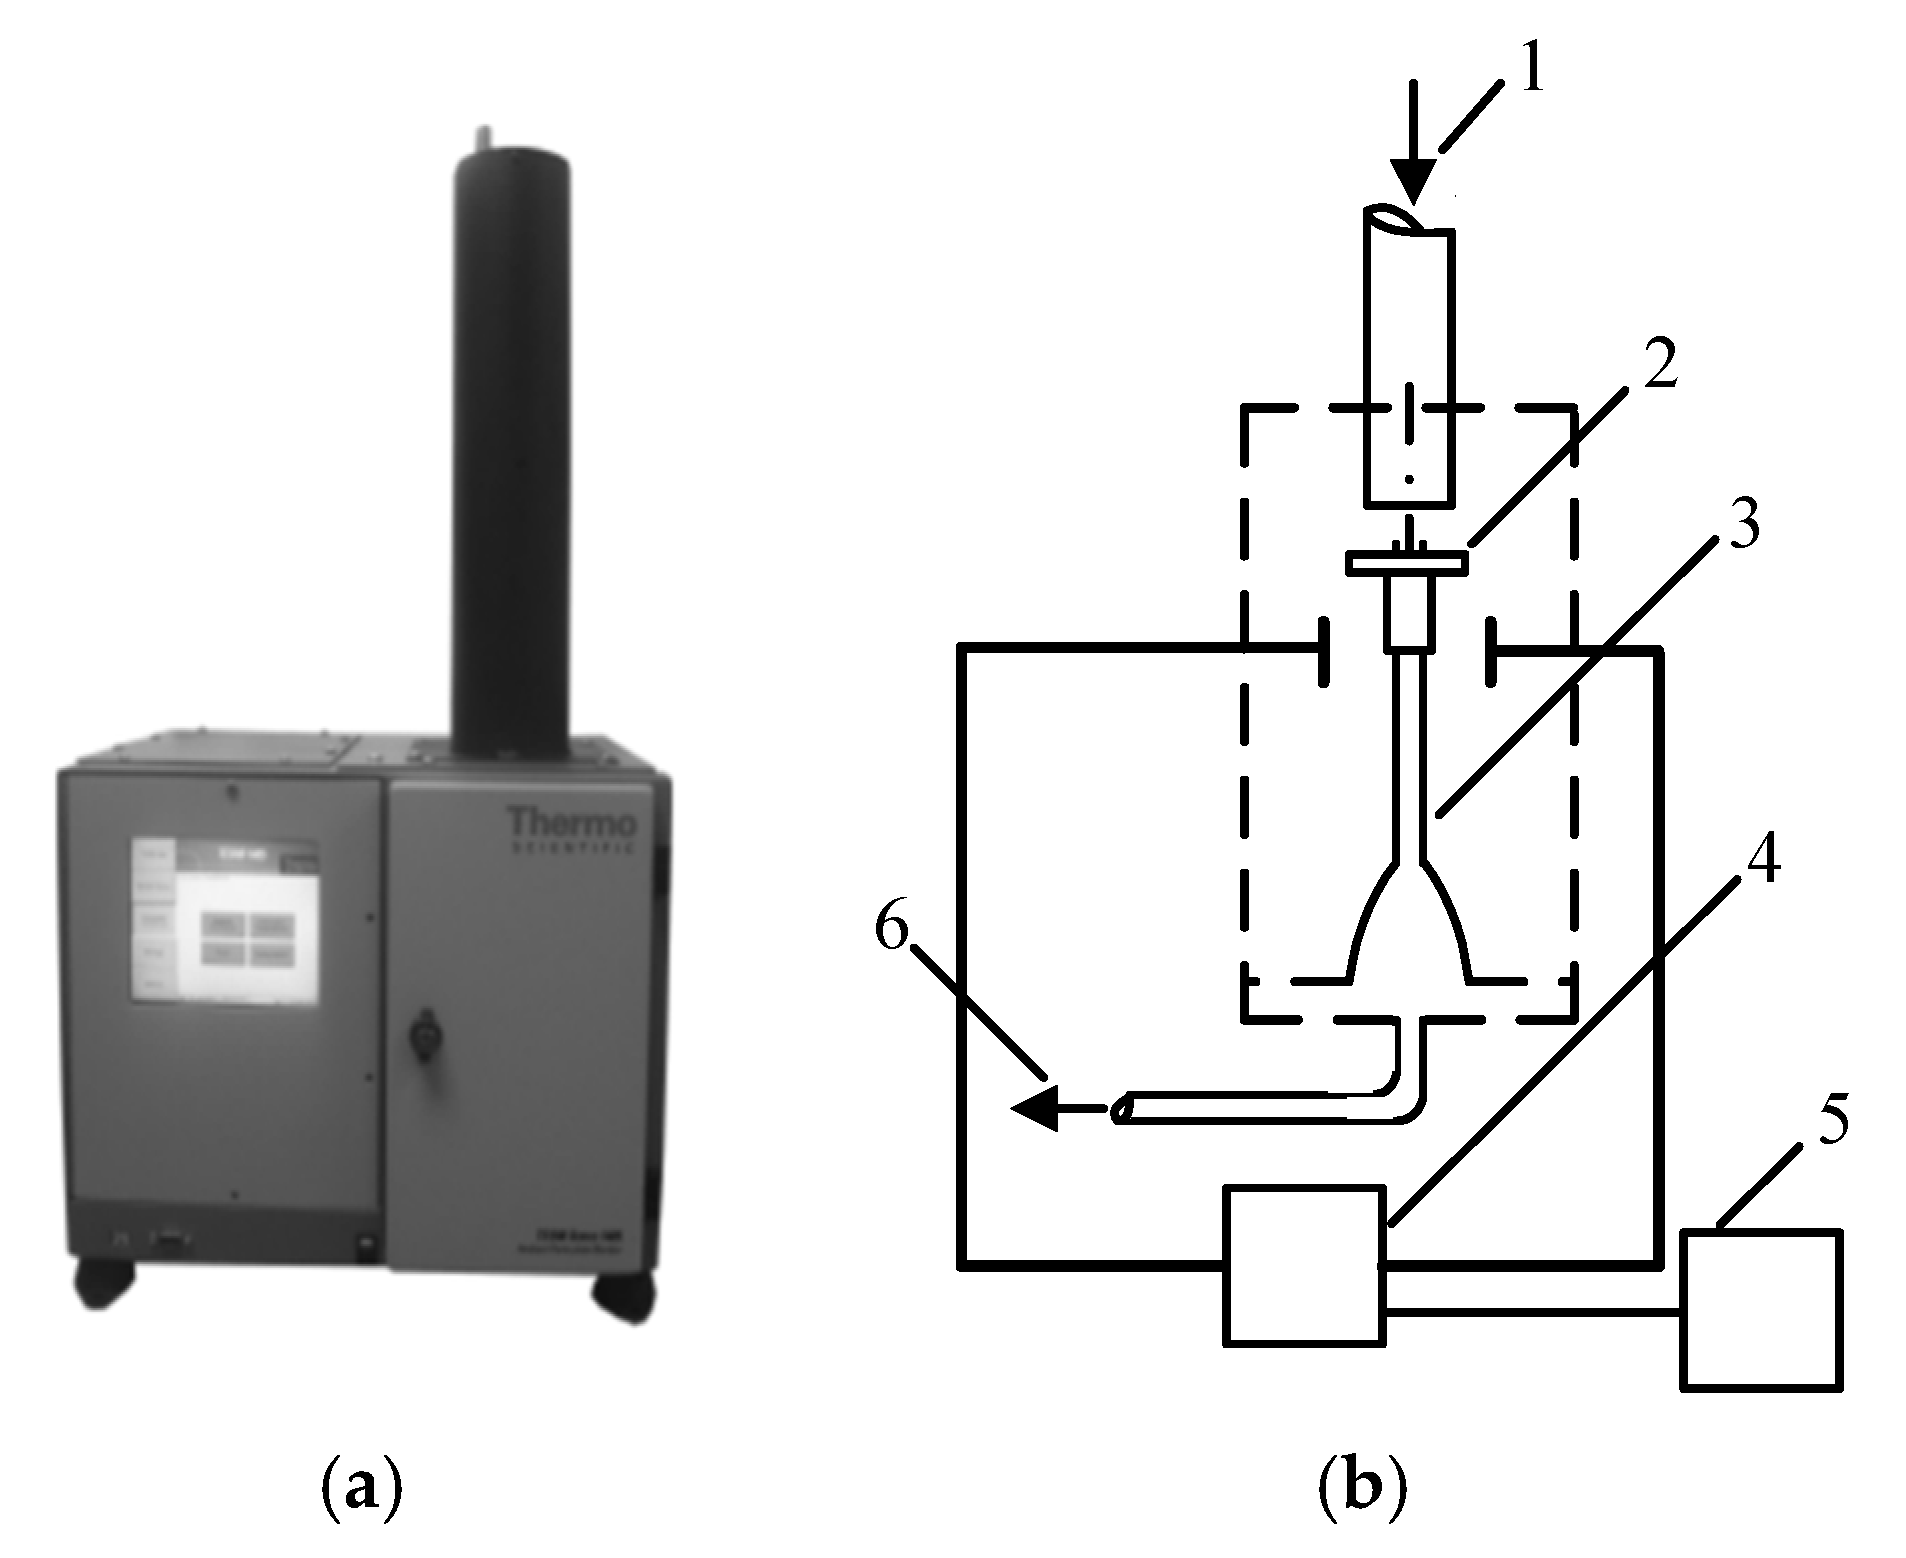
The working principle of the tapered element oscillating microbalance (TEOM) is as follows: First, a filter membrane is installed on the narrower end of the tapered hollow tube. Then, when the air to be detected enters the conical hollow tube and passes through the filter membrane, the particulate matter is adsorbed. The tapered hollow tube, which originally oscillates at the natural frequency in the natural state, changes the oscillation frequency due to the change in the mass so as to obtain the mass of the adsorbed particles. Finally, the mass concentration of particulate matter is obtained according to the gas flow rate. TEOM is a method that can continuously monitor the concentration of particulate matter. Compared with the β-ray attenuation method and the light scattering method, it is a direct measurement method for the concentration of particulate matter [96]. The more common conical element oscillating microbalance measuring equipment is Thermo Fisher’s TEOM 1405 series particulate matter monitor, as shown in Figure 12.
TEOM is widely used in atmospheric environmental quality monitoring. Wang [97] studied the concentration characteristics of nonvolatile and semi volatile particles in PM2.5 in winter and spring in Shanghai. He used TEOM to measure the mass concentration of PM2.5 in the atmosphere, and achieved more accurate detection results through dynamic membrane technology. Wang [98] et al. studied the mass concentration of particulate matter in the ambient atmosphere of Changsha and its variation characteristics. They used TEOM to measure PM10, obtained an annual average of 120.8 ± 47.7 μg/m3, and found that there was a good correlation between PM10 and PM2.5 mass concentrations in the atmosphere of Changsha.
TEOM has the characteristics of fast, accurate, and high sensitivity, and has a wide range of applications. However, it is large and expensive, and has high requirements for the installation. Therefore, the application in fugitive dust measurement of agricultural harvesting machinery has certain limitations, and it is suitable for use as calibration equipment.

2.3.4. Piezoelectric Crystal

Piezoelectric crystal is also known as piezoelectric microbalance because it resembles a small balance. The corona action of the high-voltage discharge needle causes the particles to settle on the electrode surface of the quartz resonator, and the increment of the particle mass is measured by the change in the frequency of the quartz resonator. Quartz resonators generally have a natural resonance frequency of 5 to 10 MHz, and the sensitivity to mass increment can usually reach 1000 Hz/μg, with high stability at 10 MHz.
As early as 1971, Olin [99] et al. initially verified the feasibility of using piezoelectric crystals to measure the mass concentration of suspended particles. Zhao [100] et al. designed a miniature atmospheric particle measurement system. First, the silica powder was separated according to particle size by a virtual impactor. Then, through the characteristic that the resonance frequency of the quartz crystal resonant sensor decreases linearly with the increase in the mass load of the particulate matter, the mass of the particulate matter is measured, thereby obtaining the mass concentration of the particulate matter in the gas to be measured.
At present, there are relatively few devices for particle measurement using piezoelectric crystals. The measurement sensitivity of the piezoelectric crystal method is very high, but when the load is large, the increase in the resonance frequency and the increase in the mass of the pressed particle shows a nonlinear relationship. Therefore, the particles deposited on the crystal surface must be cleaned regularly. This type of device is not suitable for directly measuring high-concentration fugitive dust generated by agricultural machinery, but can be used as a particle detection device in the cab.

2.3.5. Light Scattering

The light scattering method is a particle measurement method based on the Mie scattering principle [101]. The measuring device samples the dusty gas to be measured into the detection darkroom through a fan, and irradiates the laser on the particles, which generates scattered light. Finally, the pulsed electrical signals converted from these scattered light are used to obtain the mass concentration of the particulate matter. The detection principle of the light scattering method is shown in Figure 13.
In the research and development of measuring devices, TSI Corporation [102] of the United States detects the size of the pulse signal generated by the scattered light of particulate matter to determine its aerodynamic equivalent diameter. The new measurement device they developed combines photometric and light pulse measurements to obtain mass concentration values that are larger than typical particle counting instruments and more accurate than conventional photometers. In the application research of light scattering particle measurement device, Zamora [103] et al. used three Plantower PMS-A003 laser scattering dust sensors to measure PM2 from eight sources, and the sensors showed high accuracy and R2 values higher than 0.86. Guo [104] et al. used light scattering to monitor TSP mass concentrations at 17 sites in Shanghai for 15 months. The monitoring data were used as a data set together with the data obtained by the filter weighing method. They trained the model using four machine learning algorithms, corrected the measurements obtained by the light scattering method, and obtained better fitting results. Reference [70] used the light scattering dust detection device to measure the fugitive dust generated by the rice–wheat combine harvester, and they found that the dust concentration at the header was the highest, which could reach 4021 μg/m3.
The light scattering fugitive dust measurement device has the characteristics of fast response speed, high sensitivity, small size, and low cost, and is more suitable for installation on harvesting machinery or drones to measure the fugitive dust generated by agricultural machinery. However, because it is not a direct measurement of the amount of suspended particulate matter, it leads to certain deviations in the measurement results, so some manufacturers correct it before the product leaves the factory. Some common light scattering dust detection devices are shown in Figure 14.

3. Results and Discussion

3.1. Component and Hazards of Fugitive Dust

The component and hazards of fugitive dust introduced in this paper are shown in Table 2.
The component of fugitive dust is very complex, which can induce or spread a variety of diseases, pose a great threat to human health, and have a certain impact on the ecological environment and climate.

3.2. Comparison of Several Fugitive Dust Suppression Technologies

The comparison of the fugitive dust suppression technologies introduced in this paper are shown in Table 3.
Among these technologies, the three technologies of atomization dust suppression, bag filters, and cyclone dust collector were initially applied in agricultural harvesting machinery. There are also some companies that apply a variety of dust reduction technologies to harvesting machinery at the same time. For example, the 4HJL-2500H peanut harvester produced by Zhengyang County Yufeng Machinery Co., Ltd. (Zhengzhou, China) adopts a combination of cyclone dust removal and spray dust reduction, which achieves a better dust reduction effect. All these provide a reference for researchers to continue to explore agricultural harvesting machinery governance technology.

3.3. Comparison of Several Measurement Methods

The comparison of these five measurement methods introduced in this paper is shown in Table 4.
Among these methods, the filter weighing method is the most basic, but it takes a long time to measure. β-ray attenuation and TEOM are the measurement technologies most used in environmental monitoring stations at present, and have good timeliness and measurement accuracy. However, because of their complex structure and large size, they are not conducive to application and promotion in the field of agricultural machinery dust. The piezoelectric crystal method has very high sensitivity, but there are relatively few mature products and applications, and maintenance is difficult. In comparison, the light scattering measurement device can achieve real-time measurement, and the equipment is small and can adapt to complex motion environments, but because it is not a direct measurement, the relevant detection device needs to be calibrated when it leaves the factory and after a period of use. References [70,92] used light scattering and gravimetric analysis methods to measure the fugitive dust of rice–wheat combine harvester and peanut harvester, and the maximum concentrations of fugitive dust were 4021 μg/m3 and 10.71 mg/m3, respectively.

4. Conclusions

This paper studies the relationship between dust and atmospheric particles and the major component of fugitive dust, including sulfate, nitrate, minerals, trace elements, water-soluble ions, carbonaceous compounds, living particles, etc. In this paper, wheat harvesters and peanut harvesters were taken as examples to analyze the causes of fugitive dust generated by agricultural harvesting machinery in their work, and the hazards of fugitive dust to human health were explained, as well as the impact on the ecological environment and climate. From the perspective of agricultural production, this paper analyzes the feasibility of the application of four fugitive dust suppression technologies and five measurement methods in the fugitive dust control of agricultural harvesting machinery. Due to the lack of relevant research at present, in the next research, we must obtain more simulation and test data of dust suppression equipment for agricultural harvesters. Combined with the research content of this paper, the conclusions are as follows:
(1)
The component of fugitive dust from agricultural harvesting machinery is complex and harmful, so it needs to be treated scientifically in order to protect agricultural laborer and build a better agricultural safety and health culture;
(2)
Compared with several other dust suppression devices, the cyclone dust collector has the advantages of simple structure, convenient maintenance, low pressure drop, and high efficiency when dealing with large particles of dust. Therefore, it can be used as the preferred dust suppression device in the fugitive dust control of agricultural harvesting machinery;
(3)
The light scattering device has the advantages of fast response speed, high sensitivity, small size, and low cost. It is more suitable for the production environment of agricultural harvesting machinery, especially mobile measurement methods such as vehicle-mounted and drone-mounted methods, which have advantages in promotion and application;
(4)
There is a need to increase farmers’ perception and acknowledgement of environmental protection and provide scientific dust protection equipment for agricultural laborer. Moreover, more research on more environmentally friendly harvesting methods are needed.

Author Contributions

Conceptualization, Y.L. and W.W.; methodology, W.W.; software, L.S. and J.C.; validation, Y.L. and W.W.; formal analysis, Y.L.; investigation, Y.L., W.W. and H.Z.; writing—original draft preparation, Y.L., L.S. and Y.Y.; writing—review and editing, Y.L. and W.W.; visualization, Y.L. and B.H.; funding acquisition, L.S. and W.W. All authors have read and agreed to the published version of the manuscript.

Funding

This research was funded by China Agriculture Research System (CARS-03) and Major Public Research Projects in Henan Province (201300110400).

Institutional Review Board Statement

Not applicable.

Informed Consent Statement

Not applicable.

Data Availability Statement

The data used to support the findings of this study are available from the corresponding author upon request.

Conflicts of Interest

The authors declare no conflict of interest.

References

  1. Luo, X.; Liao, J.; Zang, Y.; Zhou, Z. Improving agricultural mechanization level to promote agricultural sustainable development. Trans. Chin. Soc. Agric. Eng. 2016, 32, 1–11. [Google Scholar]
  2. Yu, Q.; Min, X. Analysis on Air Pollution Characteristics and Meteorological Causes of Heavy Pollution Events in Kaifeng from 2014 to 2016. Meteorol. Environ. Sci. 2020, 43, 114–122. [Google Scholar]
  3. China National Bureau of Statistics. China Statistical Yearbook 2020; China Statistics Press: Beijing, China, 2020. [Google Scholar]
  4. Liu, Z. Classification and nomenclature of atmospheric particulate matter. China Terminol. 2013, 15, 31–34. [Google Scholar]
  5. Remer, L.A.; Levy, R.C.; Mattoo, S.; Tanré, D.; Gupta, P.; Shi, Y.; Sawyer, V.; Munchak, L.A.; Zhou, Y.; Kim, M. The Dark Target algorithm for observing the global aerosol system: Past, present, and future. Remote Sens. 2020, 12, 2900. [Google Scholar] [CrossRef]
  6. Liu, Y.; Zhang, W.; Bai, Z.; Yang, Y.; Zhao, X.; Han, B.; Wang, X. Characteristics of PM2.5 chemical source profiles of coal combustion and industrial process in China. Res. Environ. Sci. 2017, 30, 1859–1868. [Google Scholar]
  7. Yan, J. PM2.5-bound Typical Polar Organic Compounds in Dezhou City: Pollution Characteristics and Source Analysis. Master’s Thesis, Shanghai University, Shanghai, China, 2020. [Google Scholar]
  8. Shi, N.; Gao, B.; Guo, S.; Liu, M.; Lu, Q.; He, Q.; Zhao, W.; Huang, X.; Zhang, Z.; Tao, J.; et al. Compositions and sources of carbohydrates in PM2.5 in September of Taiyuan. Acta Sci. Circumstantiae 2020, 40, 83–89. [Google Scholar]
  9. Liu, S.; Tan, X.; Liu, C.; Zhu, C.; Li, W.; Cui, S.; Du, Y.; Huang, D.; Xie, F. Recognition of Fusarium Head Blight Wheat Grain Based on Hyperspectral Data Processing Algorithm. Spectrosc. Spectr. Anal. 2019, 39, 3540–3546. [Google Scholar]
  10. Wang, K.; Wu, J.; Mei, W.; Wang, X. Research status on particulate reduction technology in livestock houses. Trans. Chin. Soc. Agric. Eng. 2020, 36, 204–212. [Google Scholar]
  11. Chen, G.; Liu, J.; Huang-Fu, Y.; Wang, H.; Shi, G.; Tian, Y.; Zhu, Y.; Li, Q.; Feng, Y. Seasonal variations and source apportionment of ambient PM10 and PM2.5 at urban area of Hefei, China. China Environ. Sci. 2016, 36, 1938–1946. [Google Scholar]
  12. Ho, K.F.; Lee, S.C.; Chow, J.C.; Watson, J.G. Characterization of PM10 and PM2.5 source profiles for fugitive dust in Hong Kong. Atmos. Environ. 2003, 37, 1023–1032. [Google Scholar] [CrossRef]
  13. Bi, X.; Feng, Y.; Wu, J.; Wang, Y.; Zhu, T. Source apportionment of PM10 in six cities of northern China. Atmos. Environ. 2007, 41, 903–912. [Google Scholar] [CrossRef]
  14. Wang, Z.; Wu, T.; Shi, G.; Fu, X.; Tian, Y.; Feng, Y.; Wu, X.; Wu, G.; Bai, Z.; Zhang, W. Potential source analysis for PM10 and PM2.5 in autumn in a northern city in China. Aerosol Air Qual. Res. 2012, 12, 39–48. [Google Scholar] [CrossRef] [Green Version]
  15. Begum, B.A.; Biswas, S.K.; Markwitz, A.; Hopke, P.K. Identification of sources of fine and coarse particulate matter in Dhaka, Bangladesh. Aerosol Air Qual. Res. 2010, 10, 345–353. [Google Scholar] [CrossRef]
  16. Feng, Y.; Peng, L.; Wu, J.; Zhu, T.; Lv, A.; Zhang, K. Analytic studies on source of TSP and PM10 in environmental air of Urumchi city. China Environ. Sci. 2005, 25, 30–33. [Google Scholar]
  17. Ariola, V.; D’Alessandro, A.; Lucarelli, F.; Marcazzan, G.; Mazzei, F.; Nava, S.; Garcia-Orellana, I.; Prati, P.; Valli, G.; Vecchi, R. Elemental characterization of PM10, PM2.5 and PM1 in the town of Genoa (Italy). Chemosphere 2006, 62, 226–232. [Google Scholar] [CrossRef]
  18. Chan, Y.C.; Simpson, R.W.; Tainsh, G.; Vowles, P.D.; Bailey, G.M. Characterization of Chemical Species in PM2.5 and PM10 Aerosols in Brisbane, Australia. Atmos. Environ. 1997, 31, 3773–3785. [Google Scholar] [CrossRef]
  19. Lv, D.; Chen, Y.; Zhu, T.; Li, T.; Shen, F.; Li, X.; Mehmood, T. The pollution characteristics of PM10 and PM2.5 during summer and winter in Beijing, Suning and Islamabad. Atmos. Pollut. Res. 2019, 10, 1159–1164. [Google Scholar] [CrossRef]
  20. Cheng, M.D.; Hopke, P.K.; Zeng, Y. A receptor-oriented methodology for determining source regions of particulate sulfate observed at Dorset, Ontario. J. Geophys. Res. Atmos. 1993, 98, 16839–16849. [Google Scholar] [CrossRef]
  21. Artaxo, P.; Oyola, P.; Martinez, R. Aerosol composition and source apportionment in Santiago de Chile. Nucl. Instrum. Methods Phys. Res. Sect. B Beam Interact. Mater. At. 1999, 150, 409–416. [Google Scholar] [CrossRef]
  22. Chakraborty, A.; Gupta, T. Chemical characterization and source apportionment of submicron (PM1) aerosol in Kanpur region, India. Aerosol Air Qual. Res. 2010, 10, 433–445. [Google Scholar] [CrossRef]
  23. Terzi, E.; Argyropoulos, G.; Bougatioti, A.; Mihalopoulos, N.; Nikolaou, K.; Samara, C. Chemical composition and mass closure of ambient PM10 at urban sites. Atmos. Environ. 2010, 44, 2231–2239. [Google Scholar] [CrossRef]
  24. Ambade, B.; Ghosh, S. Characterization of PM10 in the ambient air during Deepawali festival of Rajnandgaon district, India. Nat. Hazards 2013, 69, 589–598. [Google Scholar] [CrossRef]
  25. Cao, J.; Shen, Z.; Chow, J.C.; Qi, G.; Watson, J.G. Seasonal variations and sources of mass and chemical composition for PM10 aerosol in Hangzhou, China. Particuology 2009, 7, 161–168. [Google Scholar] [CrossRef]
  26. Song, F.; Liu, Y.; Fan, X. Effects of cultivation measures on AM fungal community structure in agro-ecological system. Mycosystema 2018, 37, 988–998. [Google Scholar]
  27. Wang, X.; Ma, K.; Wang, Z.; Li, Y.; Wei, C. Effects of no-tillage, mulching and organic fertiliation on soil microbial composition in winter wheat field. Chin. J. Eco-Agric. 2019, 27, 267–276. [Google Scholar]
  28. Min, X.; Li, X.; Li, Q. Influence of mechanical compaction on reclaimed soil particle size distribution multifractal characteristics. Trans. Chin. Soc. Agric. Eng. 2017, 33, 274–283. [Google Scholar]
  29. Wang, S.; Cao, Y.; Feng, Q.; Guo, L.; Liang, H.; Wang, X.; Han, H.; Ning, T. Impacts of conservation tillage on soil particulate composition and distribution of soil carbon and nitrogen in brown soil. J. Plant Nutr. Fertil. 2019, 25, 792–804. [Google Scholar]
  30. Feng, X.; Gao, H.; Li, H.; Wang, X. In Atmospheric Environment PM10 by Wind Erosion from Farmlands. In Proceedings of the International Academic Annual Meeting of China Agricultural Machinery Society, Hangzhou, China, 28 December 2012. [Google Scholar]
  31. Tang, Z.; Li, Y.; Xu, L.; Li, H.; Pang, J. Experiment and evaluating indicators of wheat threshing and separating on test-bed of longitudinal axial-threshing unit. Trans. Chin. Soc. Agric. Eng. 2012, 28, 14–19. [Google Scholar]
  32. Xu, L.; Li, Y.; Li, Y.; Chai, X.; Qiu, J. Research Progress on Cleaning Technology and Device of Grain Combine Harvester. Trans. Chin. Soc. Agric. Mach. 2019, 50, 1–16. [Google Scholar]
  33. Xu, T.; Shen, Y.; Gao, L.; Liu, Z.; Zhang, X.; Lu, C. Dynamic simulation analysis of spring-finger cylinder peanut pickup mechanism. J. Shenyang Agric. Univ. 2016, 47, 192–198. [Google Scholar]
  34. Chen, Z.; Gao, L.; Chen, C.; Butts, C.L. Analysis on technology status and development of peanut harvest mechanization of China and the United States. Trans. Chin. Soc. Agric. Mach. 2017, 48, 1–21. [Google Scholar]
  35. The National Cooperative Group on Childhood Asthma; Institute of Environmental Health and Related Product Safety. Third nationwide survey of childhood asthma in urban areas of China. Chin. J. Pediatrics 2013, 51, 729–735. [Google Scholar]
  36. Wang, Q.; Bai, X.; Xu, D. Air Pollutants-Asthma Triggers and Mechanisms. J. Environ. Health 2009, 26, 551–553. [Google Scholar]
  37. Guo, C.; Lv, S.; Liu, Y.; Li, Y. Biomarkers for the adverse effects on respiratory system health associated with atmospheric particulate matter exposure. J. Hazard. Mater. 2022, 421, 126760. [Google Scholar] [CrossRef] [PubMed]
  38. Yang, L.; Zhang, H.; Zhang, X.; Xing, W.; Wang, Y.; Bai, P.; Zhang, L.; Hayakawa, K.; Toriba, A.; Tang, N. Exposure to atmospheric particulate matter-bound polycyclic aromatic hydrocarbons and their health effects: A review. Int. J. Environ. Res. Public Health 2021, 18, 2177. [Google Scholar] [CrossRef] [PubMed]
  39. Mukherjee, A.; Agrawal, M. World air particulate matter: Sources, distribution and health effects. Environ. Chem. Lett. 2017, 15, 283–309. [Google Scholar] [CrossRef]
  40. Song, J.; Xu, B.; Shen, K. Effect of particulate matter on asthma. Chin. J. Appl. Clin. Pediatrics 2020, 35, 1272–1273. [Google Scholar]
  41. Thomas, R.J. Particle size and pathogenicity in the respiratory tract. Virulence 2013, 4, 847–858. [Google Scholar] [CrossRef] [Green Version]
  42. Stahlhofen, W.; Gebhart, J.; Heyder, J. Experimental determination of the regional deposition of aerosol particles in the human respiratory tract. Am. Ind. Hyg. Assoc. J. 1980, 41, 385–398a. [Google Scholar] [CrossRef]
  43. Wang, H.; Jin, Y. Thestudyonairpollutioneffectsonthe mechanismofrespiratorysystem. Sci. Travel Medince 2001, 7, 29–33. [Google Scholar]
  44. Tecer, L.H.; Alagha, O.; Karaca, F.; Tuncel, G.; Eldes, N. Particulate matter (PM2.5, PM10–2.5, and PM10) and children’s hospital admissions for asthma and respiratory diseases: A bidirectional case-crossover study. J. Toxicol. Environ. Health Part A 2008, 71, 512–520. [Google Scholar] [CrossRef] [PubMed]
  45. Laurent, O.; Hu, J.; Li, L.; Kleeman, M.J.; Bartell, S.M.; Cockburn, M.; Escobedo, L.; Wu, J. Low birth weight and air pollution in California: Which sources and components drive the risk? Environ. Int. 2016, 92, 471–477. [Google Scholar] [CrossRef] [PubMed]
  46. Liu, Y.; Xu, J.; Chen, D.; Sun, P.; Ma, X. The association between air pollution and preterm birth and low birth weight in Guangdong, China. BMC Public Health 2019, 19, 3. [Google Scholar] [CrossRef] [PubMed]
  47. Martinelli, N.; Olivieri, O.; Girelli, D.J.E.; John, O.I.M. Air particulate matter and cardiovascular disease: A narrative review. Eur. J. Intern. Med. 2013, 24, 295–302. [Google Scholar] [CrossRef]
  48. Polichetti, G.; Cocco, S.; Spinali, A.; Trimarco, V.; Nunziata, A. Effects of particulate matter (PM10, PM2.5 and PM1) on the cardiovascular system. Toxicology 2009, 261, 1–8. [Google Scholar] [CrossRef]
  49. Shao, L.; Hu, Y.; Wang, J.; Hou, C.; Yang, Y.; Wu, M. Particle-induced oxidative damage of indoor PM10 from coal burning homes in the lung cancer area of Xuan Wei, China. Atmos. Environ. 2013, 77, 959–967. [Google Scholar] [CrossRef]
  50. Cheng, J.; Yuan, T.; Wu, Q.; Zhao, W.; Xie, H.; Ma, Y.; Ma, J.; Wang, W. PM10-bound polycyclic aromatic hydrocarbons (PAHs) and cancer risk estimation in the atmosphere surrounding an industrial area of Shanghai, China. Water Air Soil Pollut. 2007, 183, 437–446. [Google Scholar] [CrossRef]
  51. Brändli, O. Are inhaled dust particles harmful for our lungs? Schweiz. Med. Wochenschr. 1996, 126, 2165–2174. [Google Scholar]
  52. Srivastava, A. COVID-19 and air pollution and meteorology-an intricate relationship: A review. Chemosphere 2021, 263, 128297. [Google Scholar] [CrossRef]
  53. Zhu, C.; Maharajan, K.; Liu, K.; Zhang, Y. Role of atmospheric particulate matter exposure in COVID-19 and other health risks in human: A review. Environ. Res. 2021, 198, 111281. [Google Scholar] [CrossRef]
  54. Comunian, S.; Dongo, D.; Milani, C.; Palestini, P. Air pollution and COVID-19: The role of particulate matter in the spread and increase of COVID-19′s morbidity and mortality. Int. J. Environ. Res. Public Health 2020, 17, 4487. [Google Scholar] [CrossRef]
  55. Grantz, D.A.; Garner, J.H.B.; Johnson, D.W. Ecological effects of particulate matter. Environ. Int. 2003, 29, 213–239. [Google Scholar] [CrossRef]
  56. Wang, H. Process and Behavior of Terrestrial Reactive Silica in the Changjiang River and Huanghe River and the Impact of Silica Cycle in the Estuary. Master’s Thesis, First Institute of Oceanography, Ministry of Natural Resources, Qingdao, China, 2019. [Google Scholar]
  57. Xing, J.; Song, J.; Yuan, H.; Li, X.; Li, N.; Long, A. Dry deposition characteristics of atmospheric reactive silicate at Jiaozhou Bay and its potential ecological effects on marine ecosystem. Acta Ecol. Sin. 2020, 40, 3096–3104. [Google Scholar]
  58. Xing, J.; Song, J.; Yuan, H.; Li, X.; Li, N.; Duan, L.; Kang, X.; Wang, Q. Fluxes, seasonal patterns and sources of various nutrient species (nitrogen, phosphorus and silicon) in atmospheric wet deposition and their ecological effects on Jiaozhou Bay, North China. Sci. Total Environ. 2017, 576, 617–627. [Google Scholar] [CrossRef] [PubMed]
  59. Shi, X.; Shen, P.; Zhu, S.; Ji, L.; Zhang, H.; Liu, J.; Chen, B.; Li, Z. A modeling study on anthropogenic aerosol effects based on CMIP6 forcing.part Ⅰ:NUIST model results and corresponding estimation. Trans. Atmos. Sci. 2020, 43, 506–515. [Google Scholar]
  60. Yang, Y.; Tai, Y.; Zhang, Y. Reviews of harms and analytic technique study of airborne particulates. North. Environ. 2010, 22, 82–87. [Google Scholar]
  61. McNeill, V.F. Atmospheric aerosols: Clouds, chemistry, and climate. Annu. Rev. Chem. 2017, 8, 427–444. [Google Scholar] [CrossRef]
  62. Yang, M. A Dust Removal Device for Agricultural Machinery. CN2018203303457, 16 April 2019. [Google Scholar]
  63. Pollock, D.; Organiscak, J. Technology Airborne dust capture and induced airflow of various spray nozzle designs. Aerosol Sci. 2007, 41, 711–720. [Google Scholar] [CrossRef]
  64. Han, F.; Liu, J. Flow field characteristics and coal dust removal performance of an arc fan nozzle used for water spray. PLoS ONE 2018, 13, e0203875. [Google Scholar] [CrossRef]
  65. Wang, P.; Li, Y.; Liu, R.; Tan, X.; Tian, C. Spray characteristics and dust removal efficiency of internal-mixing air atomizing nozzle. J. China Coal Soc. 2019, 44, 1570–1579. [Google Scholar]
  66. Zhou, Q.; Xu, G.; Chen, Y.; Qin, B.; Zhao, Z.; Guo, C. The development of an optimized evaluation system for improving coal dust suppression efficiency using aqueous solution sprays. Colloids Surf. A Physicochem. Eng. Asp. 2020, 602, 125104. [Google Scholar] [CrossRef]
  67. Zhang, H.; Nie, W.; Yan, J.; Bao, Q.; Wang, H.; Jin, H.; Peng, H.; Chen, D.; Liu, Z.; Liu, Q. Preparation and performance study of a novel polymeric spraying dust suppression agent with enhanced wetting and coagulation properties for coal mine. Powder Technol. 2020, 364, 901–914. [Google Scholar] [CrossRef]
  68. Yan, J. Design and Evaluation on Dust Removal Process of Coal Plasma-Pyrolysis Gases for Producing Acetylene and the Development of Absorbents. Master’s Thesis, Zhejiang University, Hangzhou, China, 2018. [Google Scholar]
  69. Yuan, X.; Chen, X.; Yang, Z.; Yang, F.; Yang, J.; Zhang, W. Effects of humidity on dust removal intensification of bag filters. J. Chem. Eng. Chin. Univ. 2019, 33, 965–971. [Google Scholar]
  70. Zhang, Y.; Wu, C.; Jiang, Z.; Jiang, L.; Guan, Z.; Wang, G. Design and test of dust suppression system for rice-wheat combine harvesters. Trans. Chin. Soc. Agric. Eng. 2021, 37, 97–105. [Google Scholar]
  71. Yue, W.; Duan, C.; Xie, D. Simulation of interior flow field in the composite bag filter. Environ. Eng. 2020, 38, 120–125. [Google Scholar]
  72. Boudhan, R.; Joubert, A.; Durecu, S.; Gueraoui, K. Influence of air humidity on particle filtration performance of a pulse-jet bag filter. J. Aerosol Sci. 2019, 130, 1–9. [Google Scholar] [CrossRef] [Green Version]
  73. Shim, J.; Joe, Y.-H.; Park, H.-S. Influence of air injection nozzles on filter cleaning performance of pulse-jet bag filter. Powder Technol. 2017, 322, 250–257. [Google Scholar] [CrossRef]
  74. Gao, M.; Yao, X.; Zhu, Y.; Zhang, Y.; Shi, J.; Shangguan, W. Numerical simulation study of two-stage electrostatic precipitator. China Environ. Sci. 2018, 38, 3698–3703. [Google Scholar]
  75. Yan, K.; Li, S.; Zheng, Q.; Zhou, J.; Huang, Y.; Liu, Z. Development and application of electrostatic precipitation technology. High Volt. Eng. 2017, 43, 476–486. [Google Scholar]
  76. Yang, Z.; Zheng, C.; Liu, S.; Guo, Y.; Liang, C.; Wang, Y.; Hu, D.; Gao, X. A combined wet electrostatic precipitator for efficiently eliminating fine particle penetration. Fuel Process. Technol. 2018, 180, 122–129. [Google Scholar] [CrossRef]
  77. Mizuno, A. Electrostatic precipitation. IEEE Trans. Dielectr. Electr. Insul. 2000, 7, 615–624. [Google Scholar] [CrossRef]
  78. Cortes, C.; Gil, A. Modeling the gas and particle flow inside cyclone separators. Prog. Energy Combust. Sci. 2007, 33, 409–452. [Google Scholar] [CrossRef]
  79. Shin, M.S.; Kim, H.S.; Jang, D.S.; Chung, J.D.; Bohnet, M. A numerical and experimental study on a high efficiency cyclone dust separator for high temperature and pressurized environments. Appl. Therm. Eng. 2005, 25, 1821–1835. [Google Scholar] [CrossRef]
  80. Leith, D.; Mehta, D. Cyclone performance and design. Atmos. Environ. 1973, 7, 527–549. [Google Scholar] [CrossRef]
  81. Tekam, R.K.; Verma, J.K. Analysis and optimization of design parameters of cyclone precipitator for air pollution control. Int. Res. J. Mod. Eng. Technol. Sci. 2020, 2, 1130–1143. [Google Scholar]
  82. Wang, C.; Zhang, Y.; Dong, K.; Wang, B.; Li, S.; Xin, R.; Jiang, Y. Enhanced collection of fine particles in a cyclone using ultrasonic vapor with surfactants. Adv. Powder Technol. 2020, 31, 2207–2214. [Google Scholar] [CrossRef]
  83. Zhang, J.; Jiang, Z.; Che, P.; Liu, Y. Influence of gas velocity on the collection of fine particles in electrostatic cyclone precipitator under magnetic field effect. Environ. Pollut. Control. 2020, 42, 1081–1084, 1089. [Google Scholar]
  84. McMurry, P.H. A review of atmospheric aerosol measurements. Atmos. Environ. 2000, 34, 1959–1999. [Google Scholar] [CrossRef]
  85. Chow, J.C. Measurement methods to determine compliance with ambient air quality standards for suspended particles. J. Air Waste Manag. Assoc. 1995, 45, 320–382. [Google Scholar] [CrossRef] [Green Version]
  86. Lee, K.W.; Liu, B.Y.H. On the minimum efficiency and the most penetrating particle size for fibrous filters. J. Air Pollut. Control. Assoc. 1980, 30, 377–381. [Google Scholar] [CrossRef]
  87. Zheng, M.; Zhang, Y.; Yan, C.; Zhu, X.; Schauer, J.J.; Zhang, Y. Review of PM2.5 source apportionment methods in China. Acta Sci. Nat. Univ. Pekin. 2014, 50, 1141–1154. [Google Scholar]
  88. Cui, M.; Wang, X.; Su, H.; Zhang, Y. Chemical Characters and Sources Identification of PM10 in Guangzhou Area. Acta Sci. Nat. Univ. Pekin. 2008, 44, 459–466. [Google Scholar]
  89. Wu, S.; Zuo, Q.; Lan, T.; Deng, H.; Li, B.; Xu, F.; Shen, W.; Qin, B.; Sun, R.; Tao, S. PAHs in airborne particles from Tianjin in winter season. Environ. Sci. 2004, 25, 13–17. [Google Scholar]
  90. Huang, L.; Wang, G.; Wang, K. Physicochemical characteristics and long-range transportation of atmospheric particulates during a dust storm episode in Harbin. China Environ. Sci. 2014, 34, 1920–1926. [Google Scholar]
  91. Dunwoody, C.L. Rapid nitrate loss from PM10 filters. J. Air Pollut. Control. Assoc. 1986, 36, 817–818. [Google Scholar] [CrossRef]
  92. Zhang, P.; Xu, H.; Hu, Z.; Chen, Y.; Cao, M.; Yu, Z.; Mao, E. Characteristics of agricultural dust emissions from harvesting operations: Case study of a whole-feed peanut combine. Agriculture 2021, 11, 1068. [Google Scholar] [CrossRef]
  93. Cheng, Z.; Luo, L.; Wang, S.; Wang, Y.; Sharma, S.; Shimadera, H.; Wang, X.; Bressi, M.; de Miranda, R.M.; Jiang, J. Status and characteristics of ambient PM2.5 pollution in global megacities. Environ. Int. 2016, 89, 212–221. [Google Scholar] [CrossRef]
  94. Zhang, C.; Yu, X.; An, J.; Li, Y.; Zhao, R.; Zhao, B.; Xiao, W. Distribution characteristics of chemical components in aerosol during haze days in north suburban Nanjing. China Environ. Sci. 2018, 38, 2873–2881. [Google Scholar]
  95. Triantafyllou, E.; Diapouli, E.; Tsilibari, E.M.; Adamopoulos, A.D.; Biskos, G.; Eleftheriadis, K. Assessment of factors influencing PM mass concentration measured by gravimetric & beta attenuation techniques at a suburban site. Atmos. Environ. 2016, 131, 409–417. [Google Scholar]
  96. Patashnick, H.; Rupprecht, E.G. Continuous PM-10 measurements using the tapered element oscillating microbalance. J. Air Waste Manag. Assoc. 1991, 41, 1079–1083. [Google Scholar] [CrossRef]
  97. Wang, D. 385 Characteristics of non-volatile and semi-volatile particulate matters in PM2.5 in Shanghai during winter and spring. China Environ. Sci. 2013, 33, 385–391. [Google Scholar]
  98. Wang, Q.; Deng, Q.; Tang, M.; Liu, W. Mass concentration and variations of particulate matters PM10 in suburban air of Changsha, China. J. Cent. South Univ. Sci. Technol. 2010, 41, 2419–2423. [Google Scholar]
  99. Olin, J.G.; Sem, G. Piezoelectric microbalance for monitoring the mass concentration of suspended particles. Atmos. Environ. 1971, 5, 653–668. [Google Scholar] [CrossRef]
  100. Zhao, J.; Liu, M.; Liang, L.; Wang, W.; Xie, J.J.S.; Physical, A.A. Airborne particulate matter classification and concentration detection based on 3D printed virtual impactor and quartz crystal microbalance sensor. Sens. Actuators A Phys. 2016, 238, 379–388. [Google Scholar] [CrossRef]
  101. Mie, G. Beiträge zur Optik trüber Medien, speziell kolloidaler Metallösungen. Ann. Phys. 1908, 330, 377–445. [Google Scholar] [CrossRef]
  102. Wang, X.; Chancellor, G.; Evenstad, J.; Farnsworth, J.E.; Hase, A.; Olson, G.M.; Sreenath, A.; Agarwal, J.K. A novel optical instrument for estimating size segregated aerosol mass concentration in real time. Aerosol Sci. 2009, 43, 939–950. [Google Scholar] [CrossRef]
  103. Levy Zamora, M.; Xiong, F.; Gentner, D.; Kerkez, B.; Kohrman-Glaser, J.; Koehler, K. Field and Laboratory Evaluations of the Low-Cost Plantower Particulate Matter Sensor. Environ. Sci. Technol. 2019, 53, 838–849. [Google Scholar] [CrossRef]
  104. Guo, Q.; Zhu, Z.; Cheng, Z.; Xu, S.; Wang, X.; Duan, Y. Correction of light scattering-based total suspended particulate measurements through machine learning. Atmosphere 2020, 11, 139. [Google Scholar] [CrossRef] [Green Version]
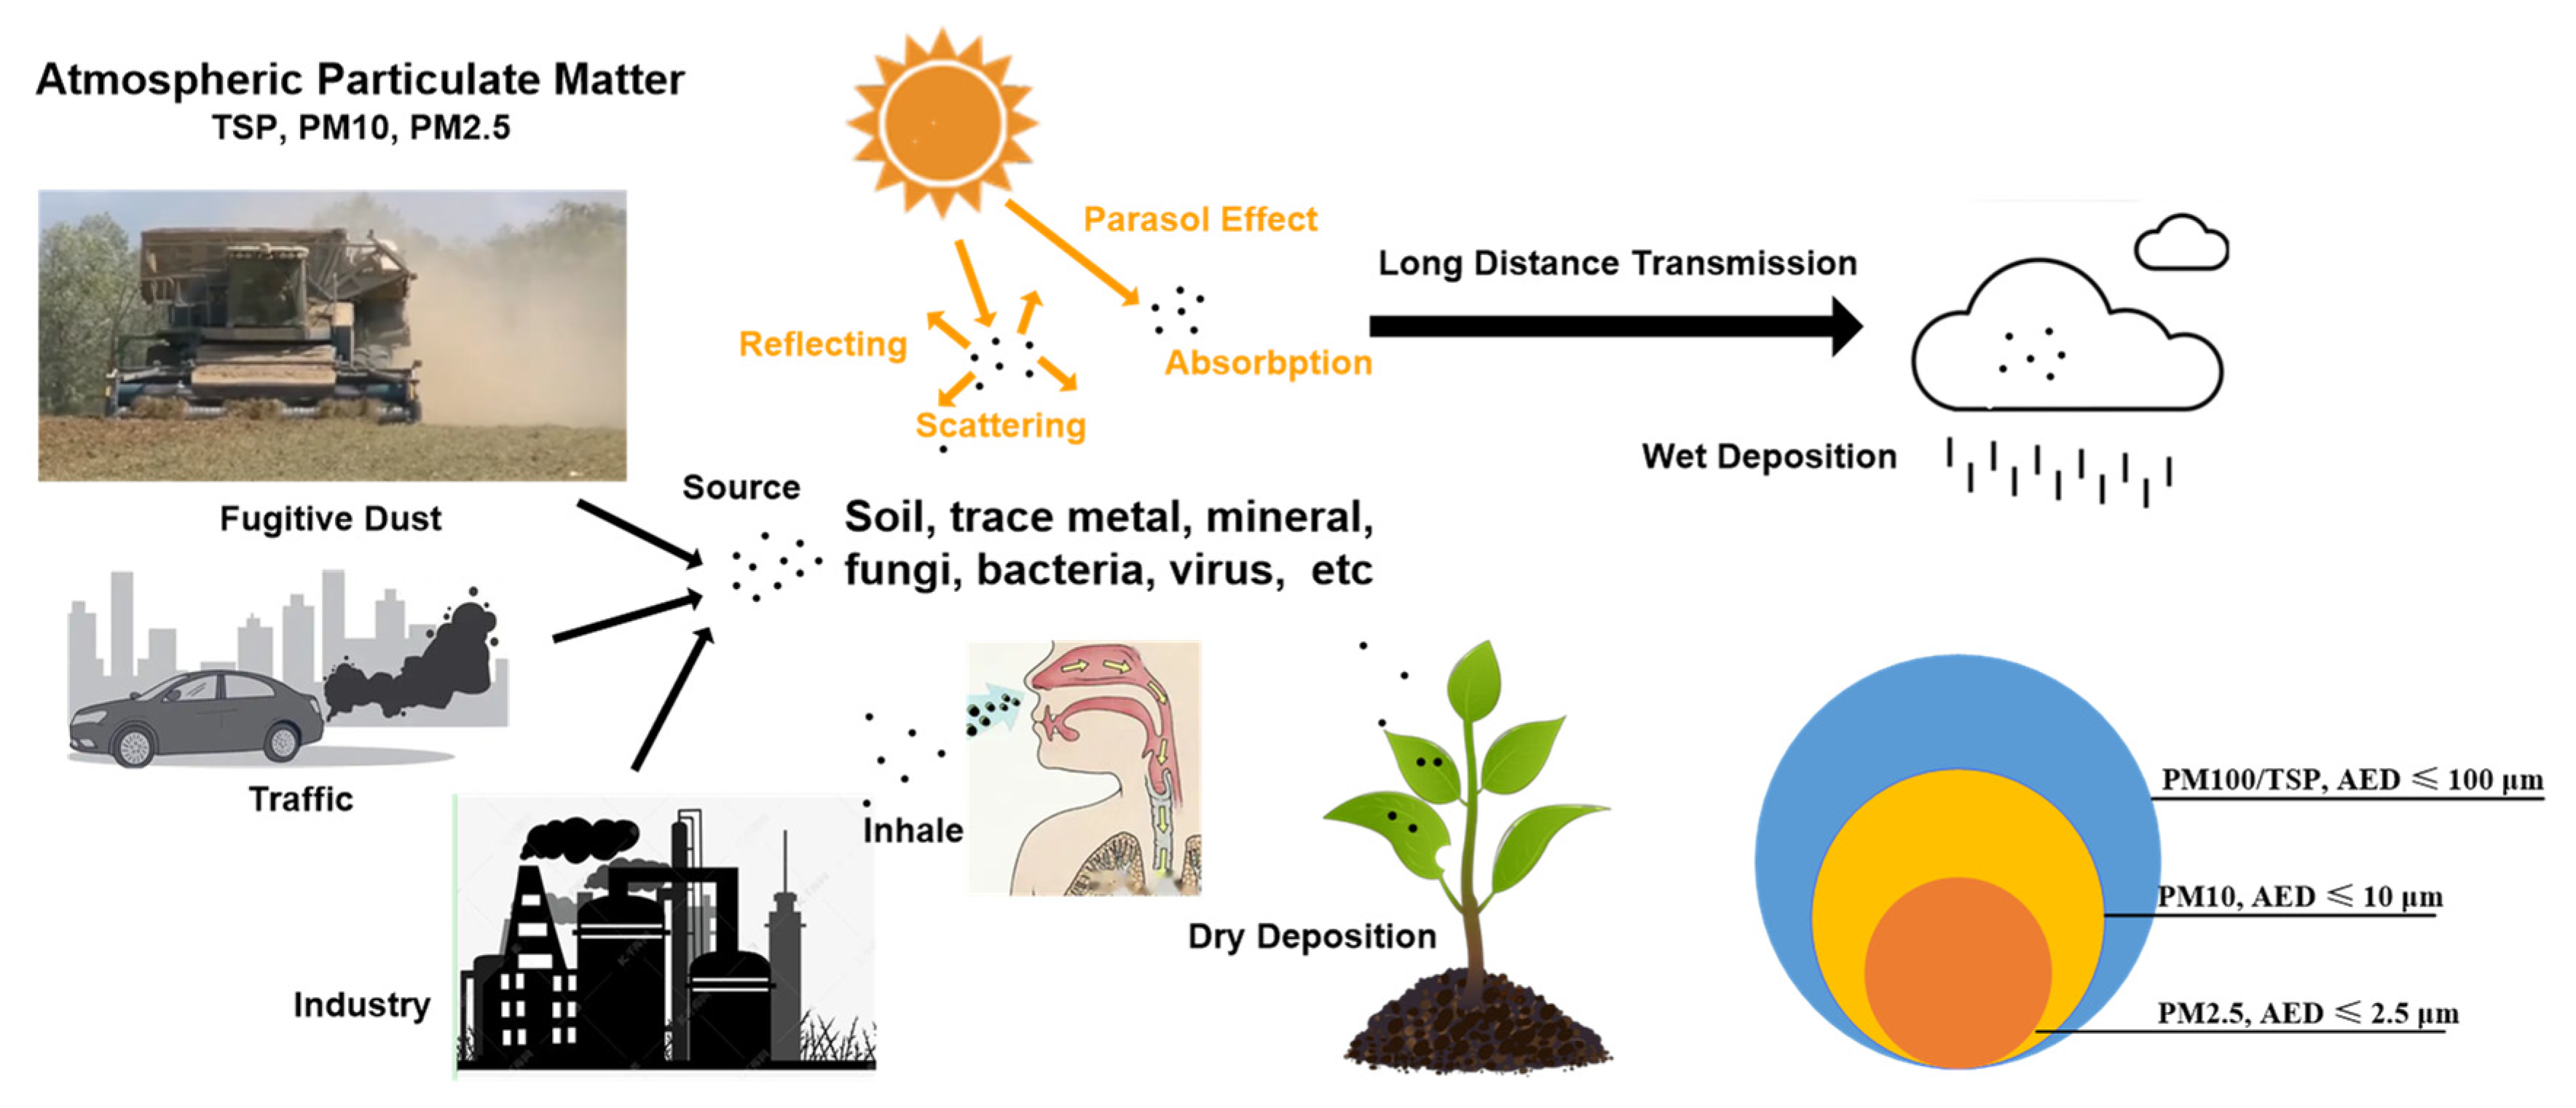
Figure 1. Atmospheric particulate matter: sources, effects, and size classification.
Agriculture 12 01038 g001
Figure 2. Sources of PM10 in Jinan in 2016 and 2017.
Agriculture 12 01038 g002
Figure 3. Fugitive dust from agricultural harvesting machinery: (a) fugitive dust from peanut harvester; (b) an unscientific dust suppression method.
Agriculture 12 01038 g003
Figure 4. Spray dust suppression device installed on wheat harvester: (a) XAM spray dust suppression device; (b) YAT spay dust suppression device.
Agriculture 12 01038 g004
Figure 5. Common nozzle types: (a) fan nozzle; (b) hollow cone nozzle; (c) swirl nozzle; (d) air-assisted nozzle.
Agriculture 12 01038 g005
Figure 6. Working principle of pulse bag filters: (a) filtering status; (b) cleaning status. 1. Dusty gas; 2. gas inlet; 3. pulse valve; 4. valve plate; 5. clean gas; 6. gas outlet; 7. filter bag 8. ash bucket; 9. unloaded valve; 10. rapping device.
Agriculture 12 01038 g006
Figure 7. Working principle of single zone electrostatic precipitator. 1. Dusty gas; 2. collection elec−trode; 3. charged dust particle; 4. discharge electrode; 5. clean gas; 6. dust particle.
Agriculture 12 01038 g007
Figure 8. Working principle of cyclone dust collector. 1. Dusty gas; 2. air inlet; 3. clean gas; 4. air outlet; 5. cylinder; 6. gas flow path; 7. cone; 8. dust outlet.
Agriculture 12 01038 g008
Figure 9. LAM 4HZJ-2500 peanut harvester.
Agriculture 12 01038 g009
Figure 10. JH-120F particle sampler: (a) particle sampler appearance; (b) main structure of the cutter.
Agriculture 12 01038 g010
Figure 11. β-ray particle measurement device and its working principle: (a) β-ray particle measurement device; (b) working principle. 1. Clean filter paper roll; 2. pressure wheel; 3. filter paper; 4. gas flow; 5. cutter; 6. β-ray source; 7. β-ray detector; 8. scroll motor; 9. air pump.
Agriculture 12 01038 g011
Figure 12. TEOM 1405 series particulate matter monitor: (a) particle matter monitor appearance; (b) main structure of core components. 1. Sample flow; 2. exchangeable TEOM filter cartridge; 3. tapered element; 4. drive amplifier; 5. frequency counter; 6. to flow controller.
Agriculture 12 01038 g012
Figure 13. Working principle of light scattering particle measurement device. 1. Light source; 2. lens; 3. photoelectric converter; 4. integrator; 5. darkroom; 6. exhaust fan.
Agriculture 12 01038 g013
Figure 14. Common light scattering dust detection devices: (a) PlantTower PMS6003; (b) Sharp GP2Y1010AU0F; (c) TSI 8530.
Agriculture 12 01038 g014
Table 1. Comparison of common filter membranes.
Membrane MaterialApplication OccasionPercentage (%)
Quartz fiberOrganic matter analysis47
TeflonInorganic matter analysis26
PolypropyleneHigh temperature, strong acid, and alkali8
Glass fiberLarge flow, high concentration8
Table 2. Component and hazards of fugitive dust.
ItemContentReferences
ComponentMinerals (Si, Al, Ca, Mg, Fe, Ti, and K),[6,7,8,9,17,18,19,20,21,22,23,24,25]
Trace elements (Cd, Cr, Cu, Mn, Pb, V, Zn, Te, Co, Ni, Se, Sr, As, and Sb),
Water-soluble ions (Cl, NO 3 , SO 4 2 , Na+, K+, NH4+, Ca2+, and Mg2+),
Carbonaceous compounds (plant fiber, animal hair, cutin, dander, and sugar),
Hazards to human healthRisk of inducing spreading various diseases such as reduced respiratory function, low birth weight, cardiovascular disease, cancer, COVID-19[35,36,37,38,39,40,41,42,43,44,45,46,47,48,49,50,51,52,53,54]
Impact on the EnvironmentAbsorb or scatter sunlight, reduce atmospheric visibility, weaken solar radiation, affect environmental thermal balance, long distance transmission, deposition, parasol effect, greenhouse effect.[55,56,57,58,59,60,61]
Table 3. Comparison of several dust particle reduction technologies.
Suppression
Technology
Working PrincipleAdvantagesDisadvantagesReferences
Atomization dust suppressionAdsorption of dust particles by fine droplets.Simple structure and easy maintenanceNeed to supply clean water[62,63,64,65,66,67]
Bag filtersAdsorption of dust particles by filter bag.High dust removal efficiency and stable operationBlocking at high humidity[68,69,70,71,72,73]
Electrostatic precipitatorAdsorption of charged dust particles by electrodes.High dust removal efficiency and low resistanceComplex structure, large volume, and high cost[74,75,76,77]
Cyclone dust collectorCentrifugal force of dust particles.Simple structure and high efficiency for large particlesReduced capture efficiency for small particles[78,79,80,81,82,83]
Table 4. Comparison of several measurement methods.
Measurement MethodsWorking PrincipleAdvantagesDisadvantagesReferences
Gravimetric analysisAdsorption of particulate matter by filter membrane.Simple principleHigh time cost for measurement[86,87,88,89,90,91,92]
Beta attenuationThe attenuation of beta-ray caused by the adsorption of particulate matter by the filter membrane.High precision and high time resolutionComplex structure, large volume and high cost[93,94,95]
TEOMThe oscillation frequency varies with the mass of the particulate matter adsorbed by the filter membrane.High precision and high time resolutionComplex structure, large volume and high cost[96,97,98]
Piezoelectric crystalThe oscillation frequency varies with the mass of particles adsorbed by the electrode.High sensitivityDifficult to maintain[99,100]
Light scatteringScattering of light.Fast response, high sensitivity, small size, and low costNeed to be corrected before leaving the factory and after use for a period of time[101,102,103,104]
Publisher’s Note: MDPI stays neutral with regard to jurisdictional claims in published maps and institutional affiliations.