Effects of Continuous Ridge Tillage at Two Fertilizer Depths on Microbial Community Structure and Rice Yield

 ,
,
Abstract
:1. Introduction
2. Materials and Methods
2.1. Test Site
2.2. Test Materials
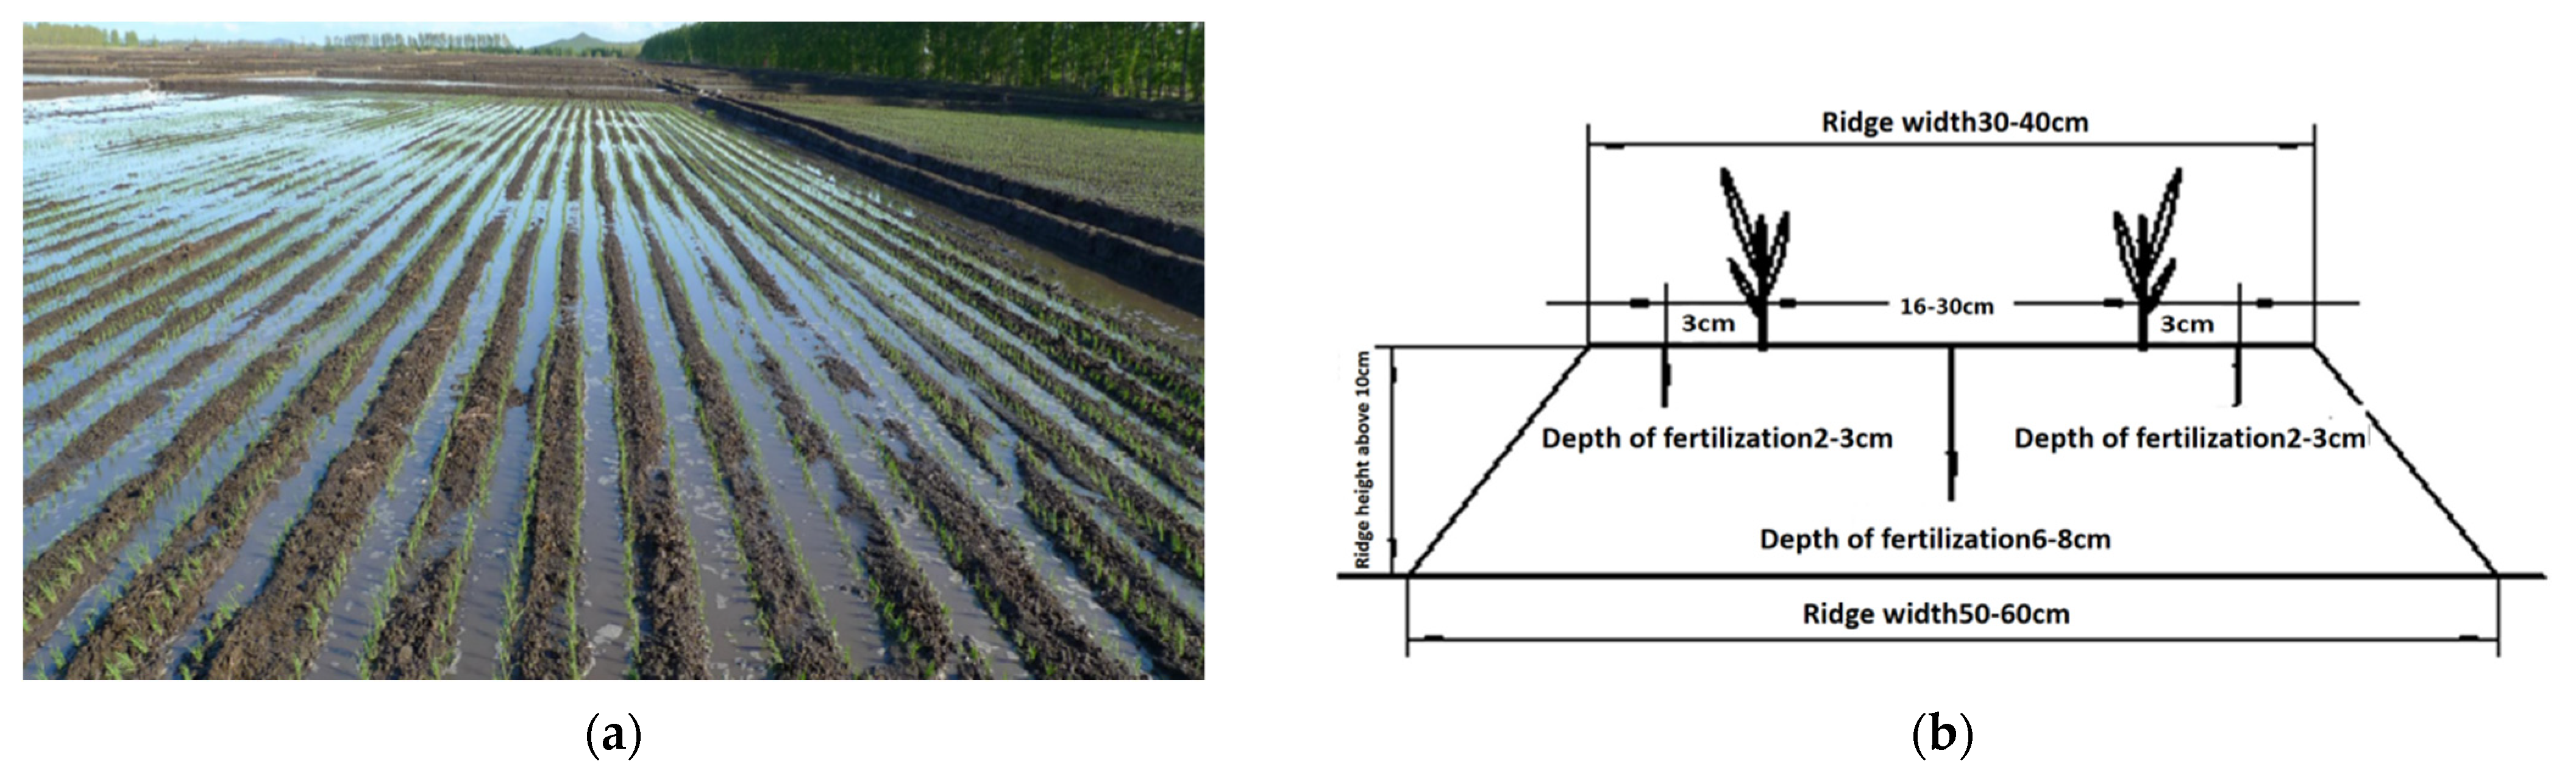
2.3. Test Design
2.4. Measurement Index and Method
2.4.1. Soil Sampling and Analysis
2.4.2. Soil Physical Properties Analysis
2.4.3. Microbial Community Structure Analysis
2.4.4. Rice Theoretical Output and Output Composition
2.5. Data Processing and Analysis
3. Results
3.1. Effects of Continuous Tillage at Two Fertilizer Depths on Soil Nutrient Content and Physical Properties
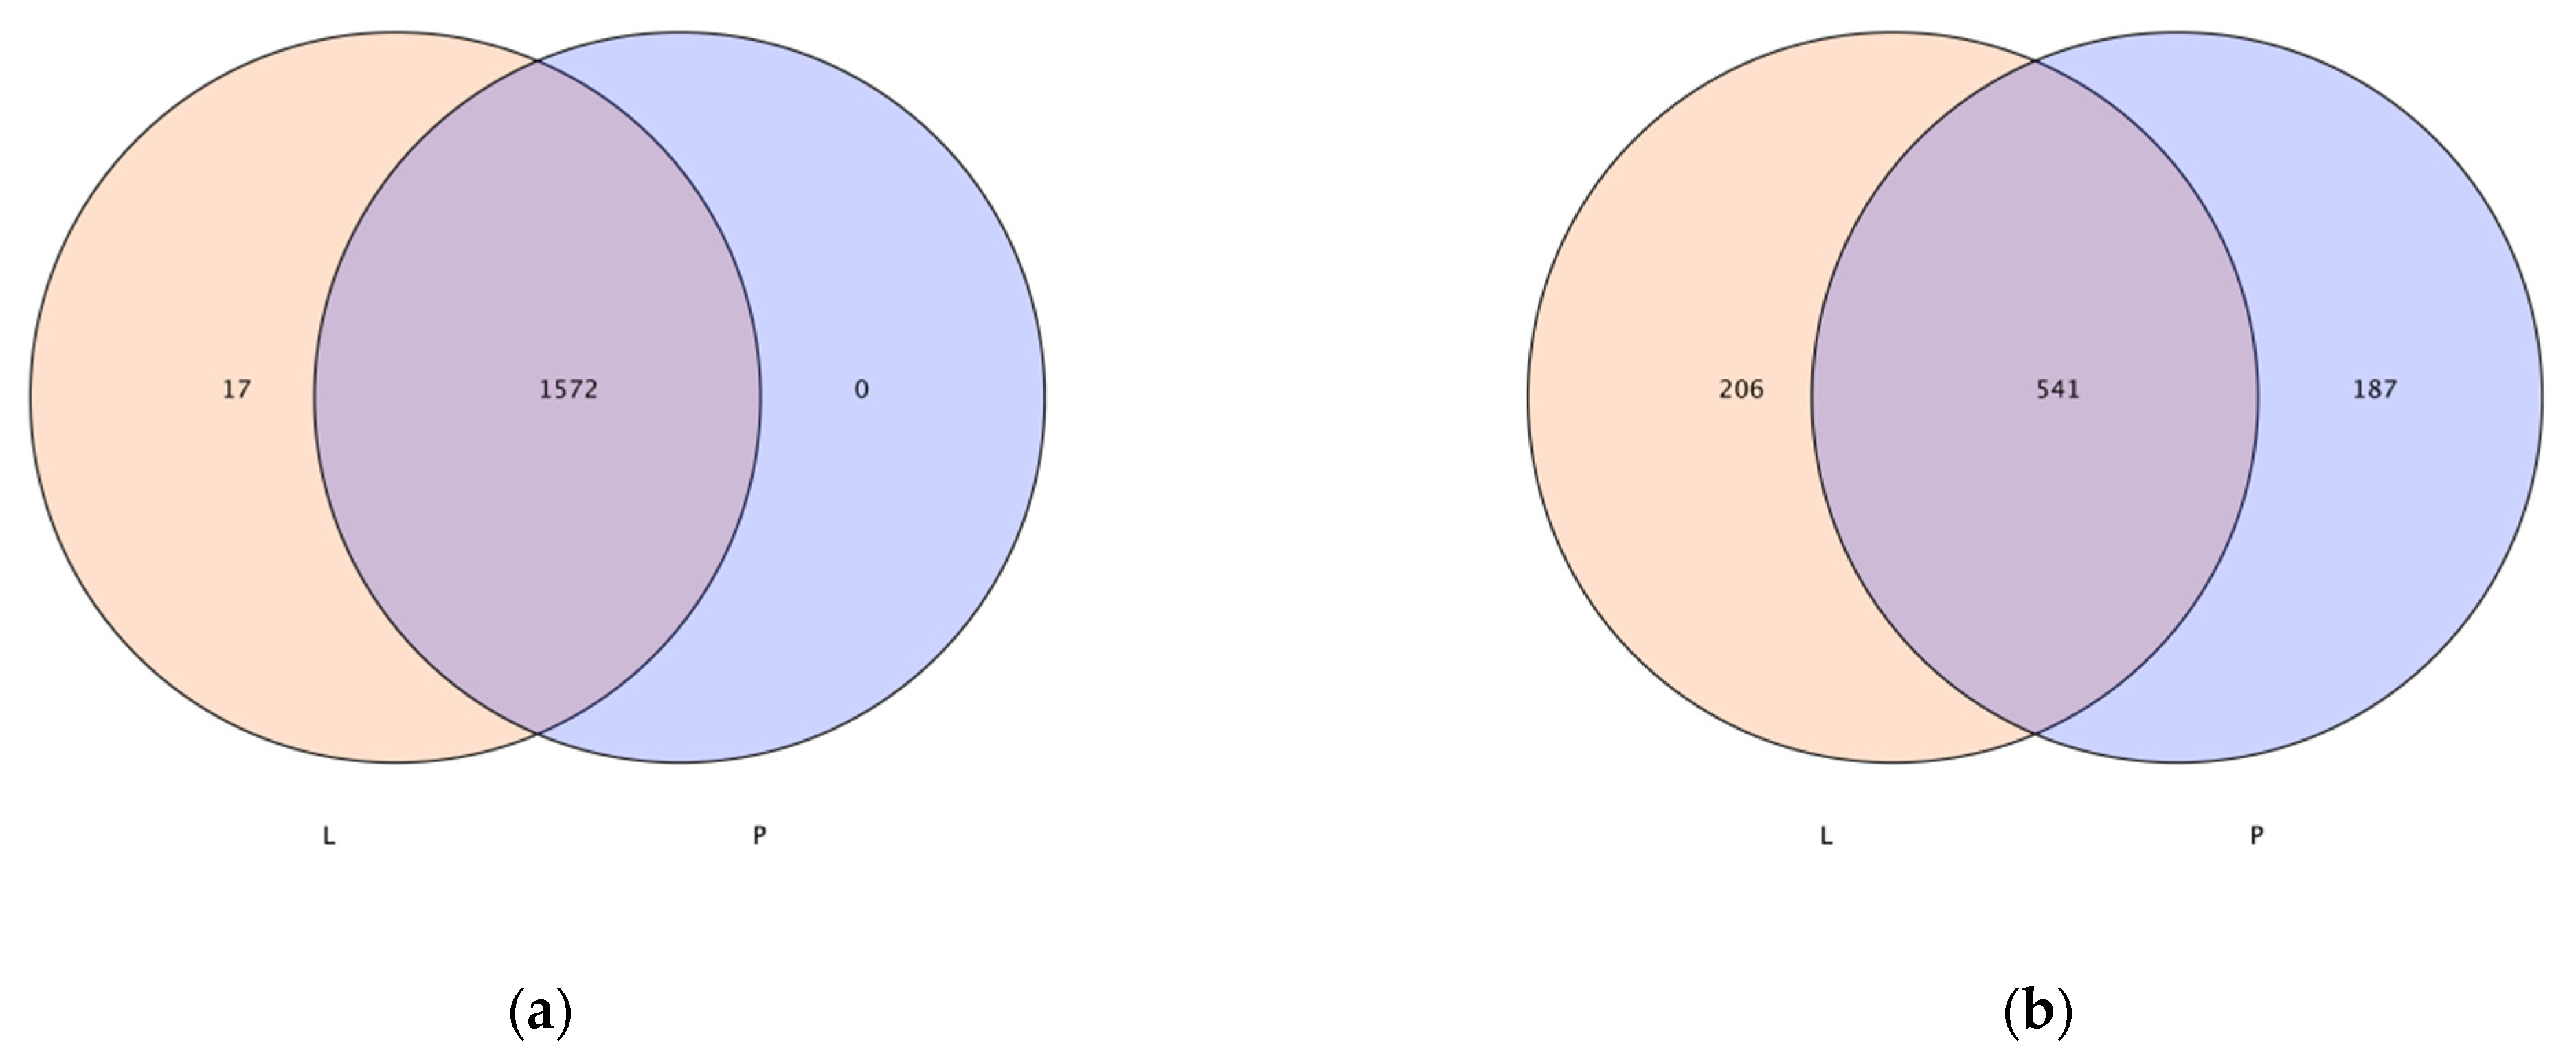
3.2. Analysis of Soil Microbial Operational Taxonomic Units (OTUs)
3.3. Effects of Continuous Tillage at Two Fertilizer Depths on the Diversity and Abundance of Soil Microorganism Communities
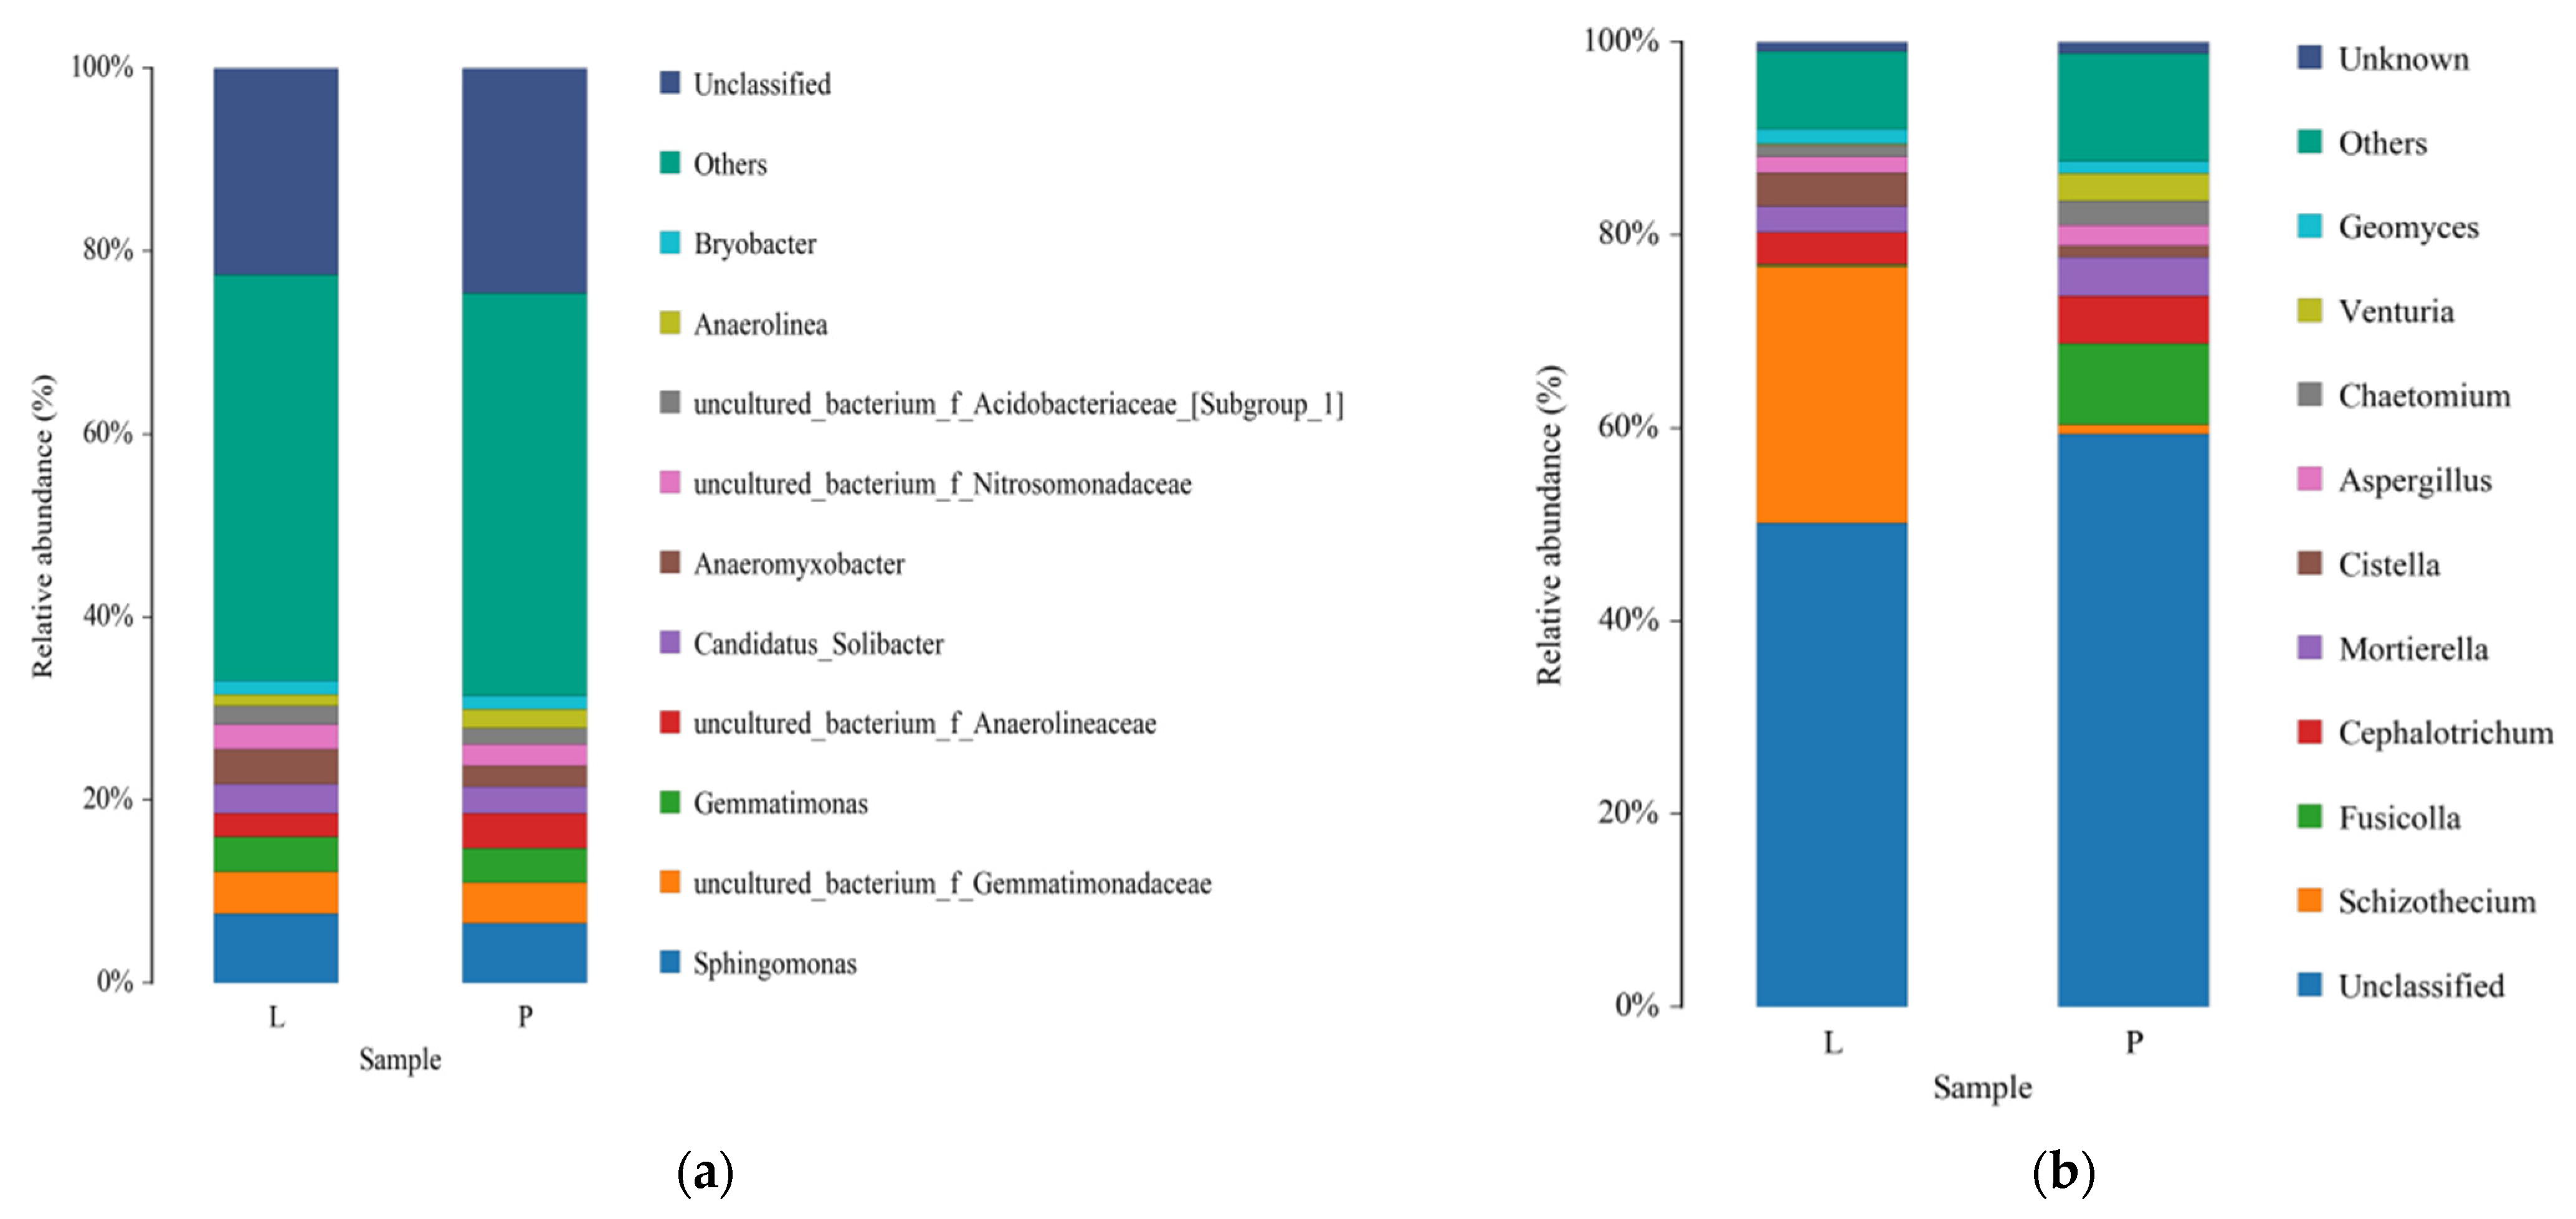
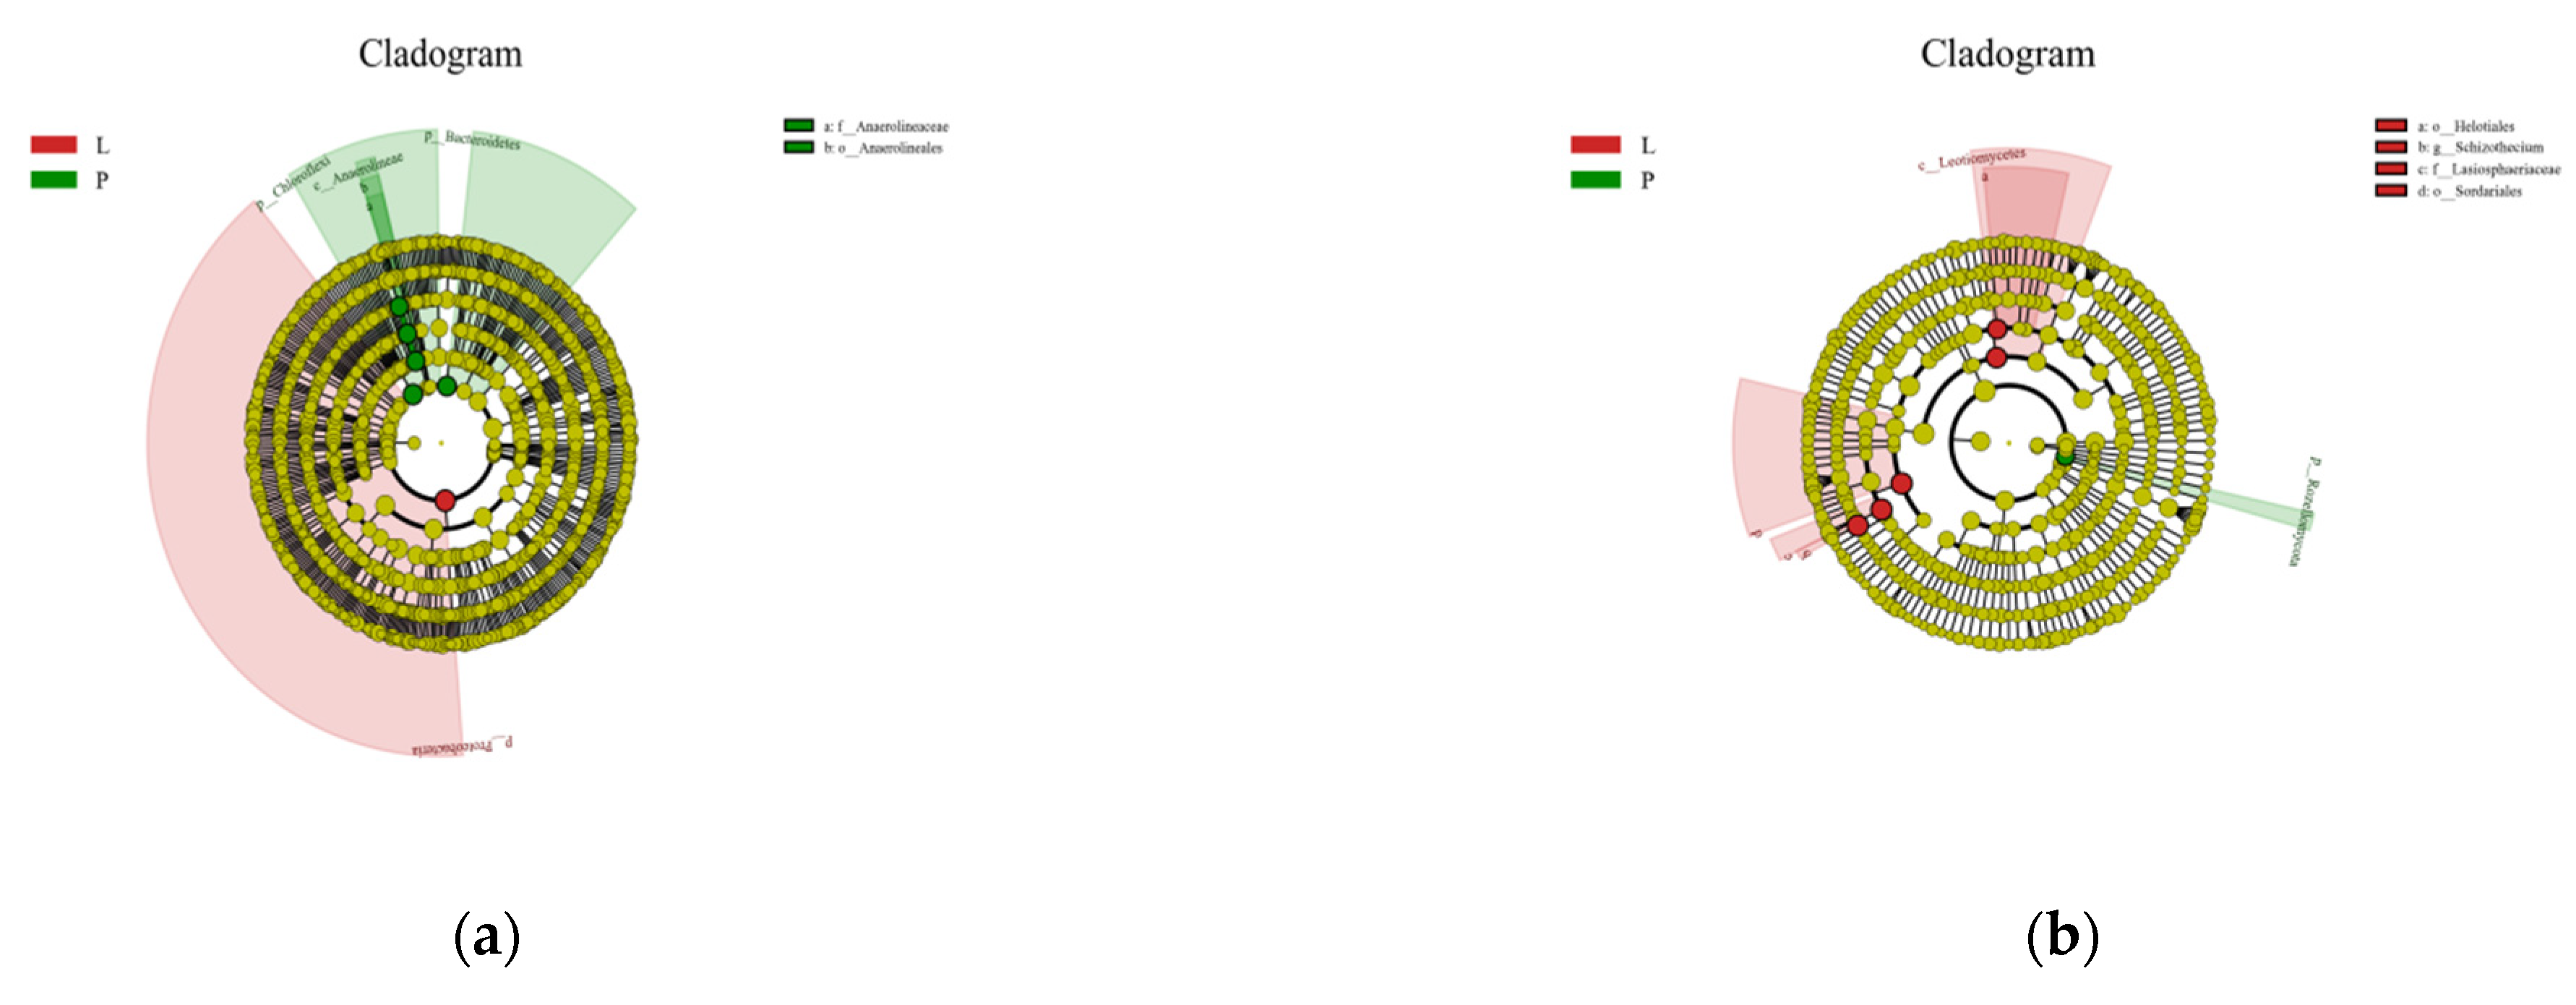
3.4. Effects of Continuous Ridge Tillage at Two Fertilizer Depths on the Microbial Community Structure
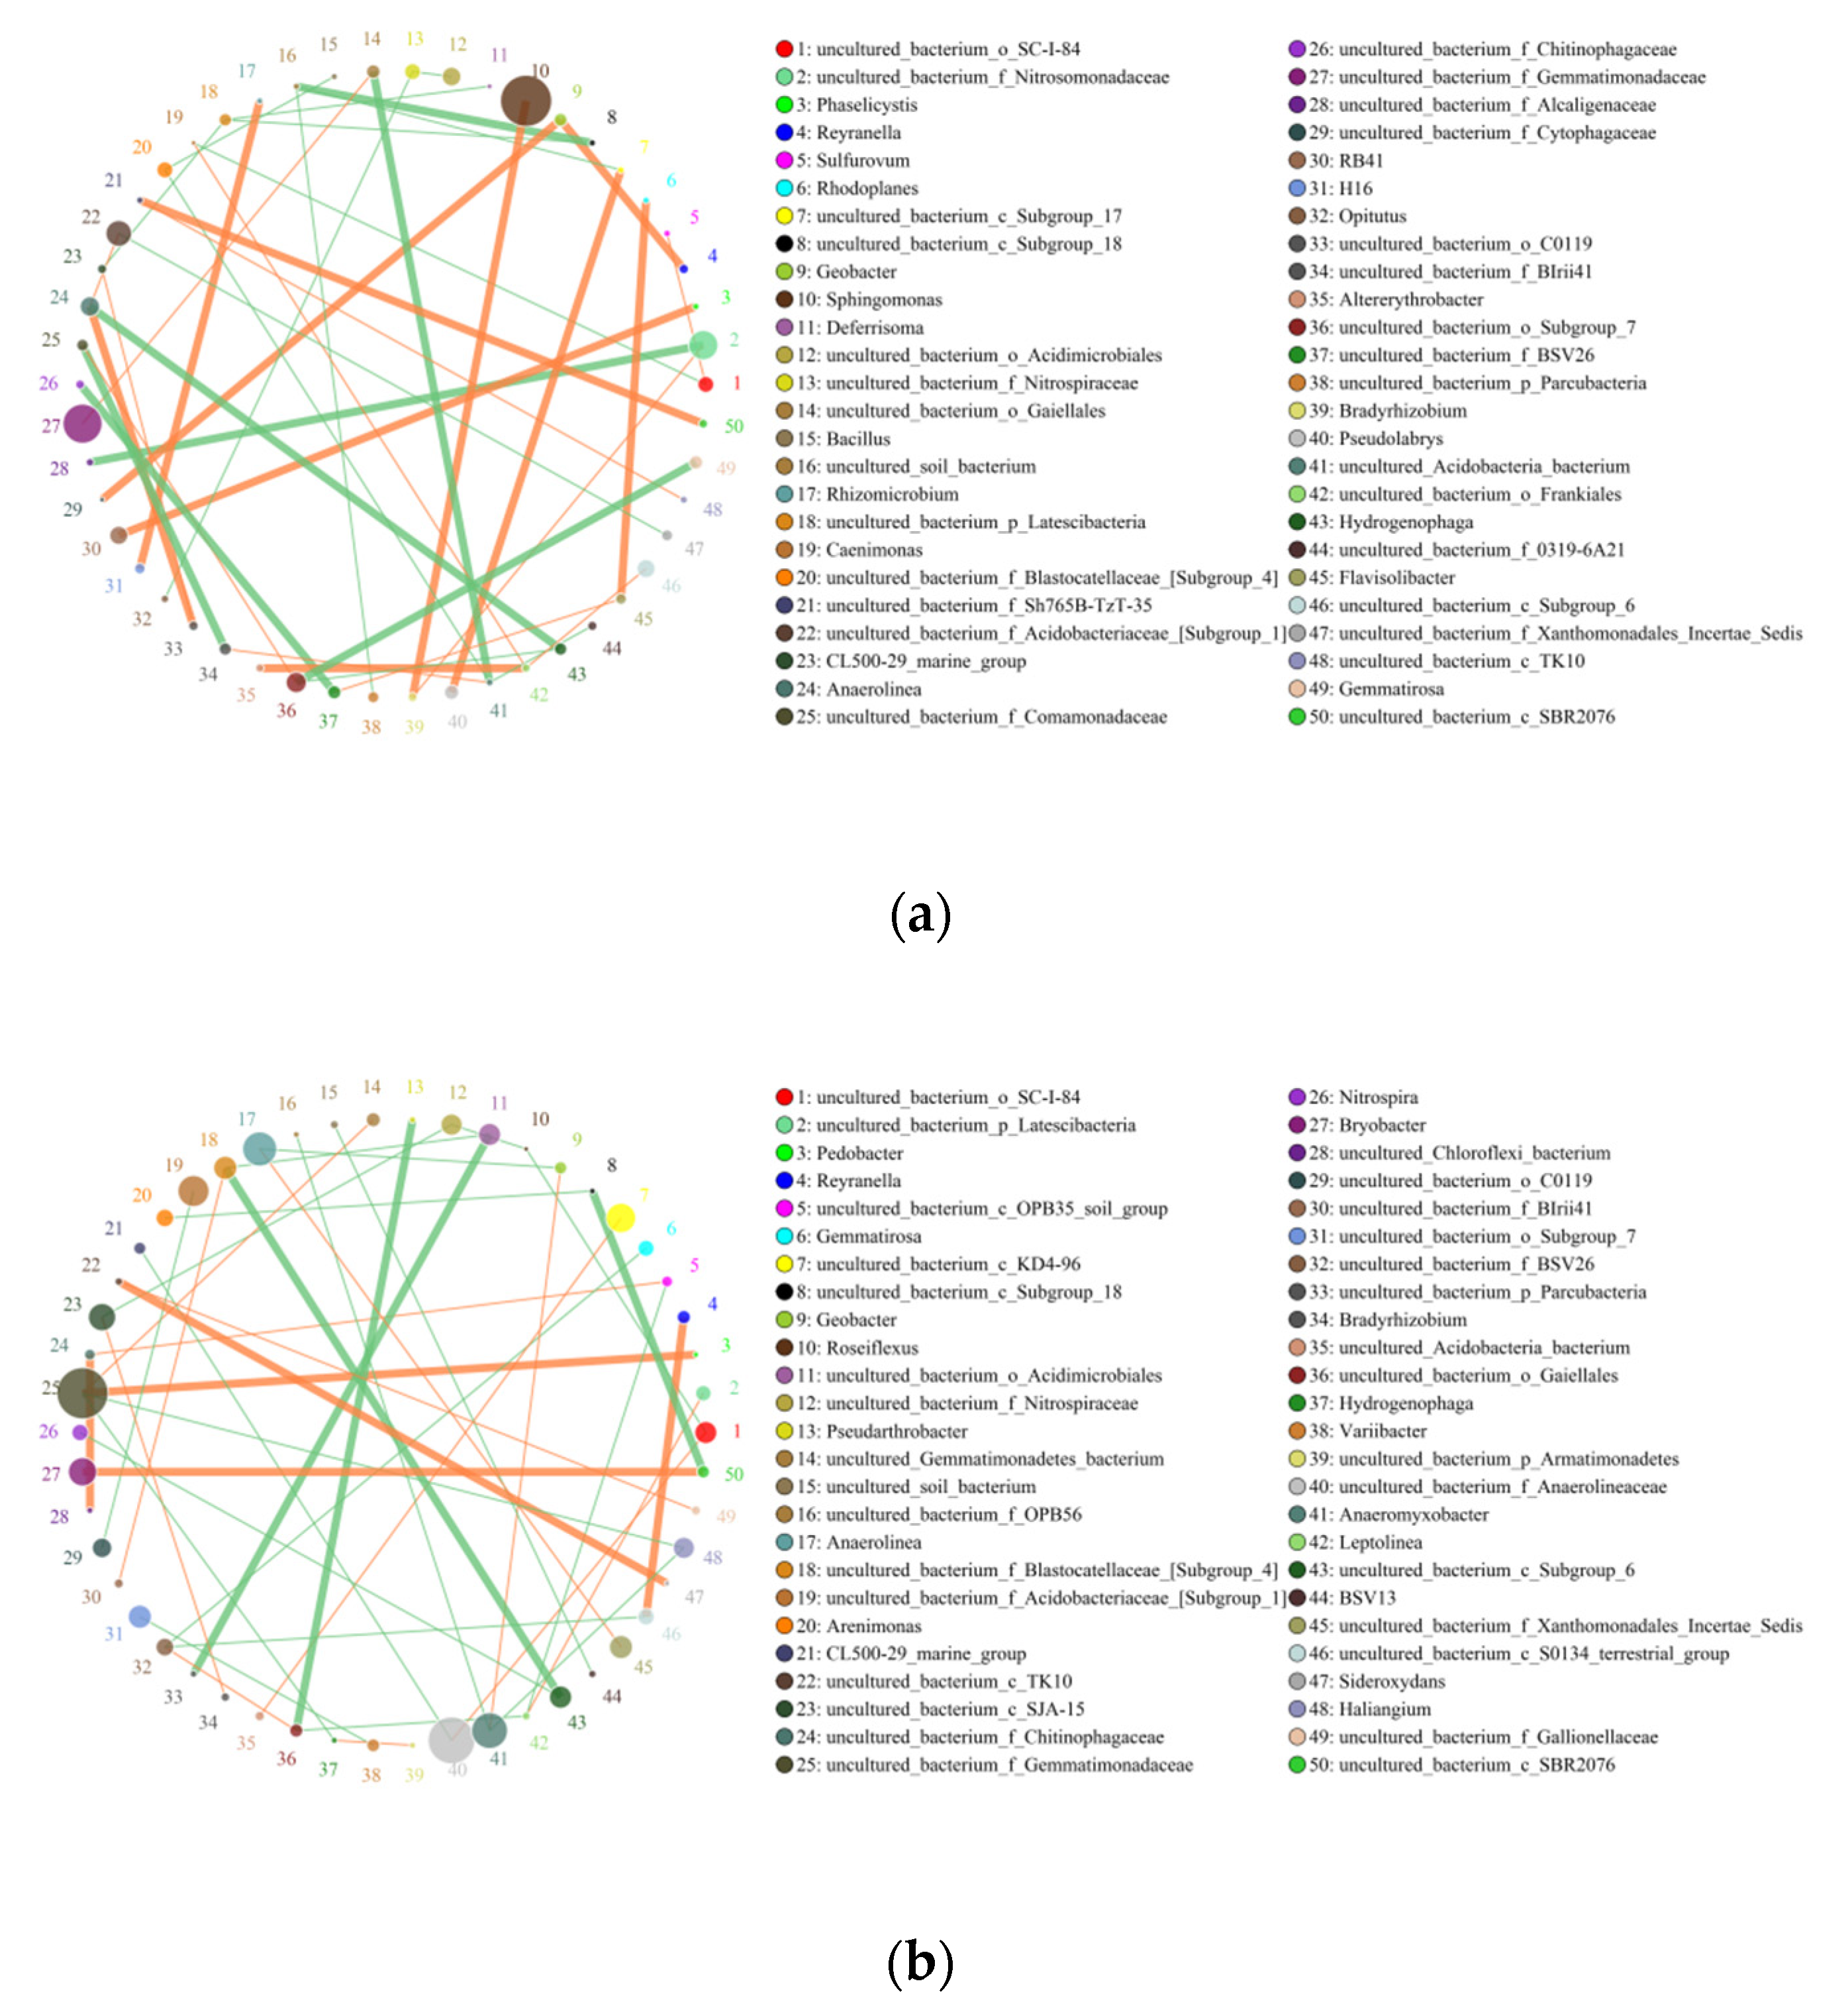
3.5. Effects of Continuous Tillage at Two Fertilizer Depths on the Interaction between Soil Bacteria and Fungi
3.6. Effects of Continuous Tillage at Two Fertilizer Depths on Yield and Yield Components
3.7. Correlation between Rice Yield and Alpha Diversity of Soil Bacteria and Fungi
4. Discussion
4.1. Effects of Continuous Tillage at Two Fertilizer Depths on Soil Nutrient Content and Physical Properties
4.2. Effects of Continuous Tillage at Two Fertilizer Depths on the Abundance and Diversity of Soil Microorganism Communities
4.3. Effects of Continuous Ridge Tillage at Two Fertilizer Depths on the Microbial Community Structure
4.4. Effects of Continuous Tillage at Two Fertilizer Depths on the Interaction between Soil Bacteria and Fungi
4.5. Effects of Continuous Tillage at Two Fertilizer Depths on Yield and Yield Components
4.6. Correlation between Rice Yield and Alpha Diversity of Soil Bacteria and Fungi
5. Conclusions
Author Contributions
Funding
Institutional Review Board Statement
Informed Consent Statement
Data Availability Statement
Acknowledgments
Conflicts of Interest
References
- Peng, Y.Q.; Zheng, H.B.; Hu, T.; Chen, Y.; Huang, H. Effect of rice ridge tillage and terrace cultivation technology on rice root growth. Crop Res. 2012, 26, 14–17. (In Chinese) [Google Scholar] [CrossRef]
- Ding, J.; Zhu, D.; Chen, Q.L.; Zheng, F.; Wang, H.T. Effects of long-term fertilization on the associated microbiota of soil collembolan. Soil Biol. Biochem. 2019, 130, 141–149. [Google Scholar] [CrossRef]
- Heijden, M.; Wagg, C. Soil microbial diversity and agro-ecosystem functioning. Plant Soil 2013, 363, 1–5. [Google Scholar] [CrossRef] [Green Version]
- Ojuederie, O.B.; Olanrewaju, O.S.; Babalola, O.O. Plant Growth Promoting Rhizobacterial Mitigation of Drought Stress in Crop Plants: Implications for Sustainable Agriculture. Agronomy 2019, 9, 712. [Google Scholar] [CrossRef] [Green Version]
- Sarfraz, R.; Hussain, A.; Sabir, A.; Fekih, I.B.; Ditta, A.; Xing, S. Role of biochar and plant growth promoting rhizobacteria to enhance soil carbon sequestration—A review. Environ. Monit. Assess. 2019, 191, 251. [Google Scholar] [CrossRef]
- Brockett, B.F.; Prescott, C.E.; Grayston, S.J. Soil moisture is the major factor influencing microbial community structure and enzyme activities across seven biogeoclimatic zones in western Canada. Soil Biol. Biochem. 2012, 44, 9–20. [Google Scholar] [CrossRef]
- Kulmatiski, A.; Beard, K.H.; Stevens, J.R.; Cobbold, S.M. Plant-soil feedbacks: A meta-analytical review. Ecol. Lett. 2008, 11, 980–992. [Google Scholar] [CrossRef]
- Degens, B.P.; Schipper, L.A.; Sparling, G.P.; Vojvodic-Vukovic, M. Decreases in organic C reserves in soils can reduce the catabolic diversity of soil microbial communities. Soil Biol. Biochem. 2000, 32, 189–196. [Google Scholar] [CrossRef]
- Hewedy, O.A.; Lateif, K.S.; Seleiman, M.F.; Sham, A.; Albarakaty, F.M.; El-Meihy, R.M. Phylogenetic Diversity of Trichoderma Strains and Their Antagonistic Potential against Soil-Borne Pathogens under Stress Conditions. Biology 2020, 9, 189. [Google Scholar] [CrossRef]
- Chu, G.; Wang, Z.Q.; Zhang, H.; Liu, L.J.; Yang, J.C.; Zhang, J.H. Alternate wetting and moderate drying increases rice yield and reduces methane emission in paddy field with wheat straw residue incorporation. Food Energy Secur. 2015, 4, 238–254. [Google Scholar] [CrossRef]
- Ghimire, R.; Norton, J.B.; Stahl, P.D.; Norton, U. Soil Microbial Substrate Properties and Microbial Community Responses under Irrigated Organic and Reduced-Tillage Crop and Forage Production Systems. PLoS ONE 2014, 9, e103901. [Google Scholar] [CrossRef] [PubMed] [Green Version]
- Lienhard, P.; Terrat, S.; Prévost-Bouré, N.C.; Nowak, V.; Régnier, T.; Sayphoummie, S.; Panyasiri, K.; Tivet, F.; Mathieu, O.; Levêque, J.; et al. Pyrosequencing evidences the impact of cropping on soil bacterial and fungal diversity in Laos tropical grassland. Agron. Sustain. Dev. 2014, 34, 525–533. [Google Scholar] [CrossRef]
- Madejón, E.; Murillo, J.M.; Moreno, F.; López, M.V.; Arrue, J.L.; Alvaro-Fuentes, J.; Cantero, C. Effect of long-term conservation tillage on soil biochemical properties in Mediterranean Spanish areas. Soil Tillage Res. 2009, 105, 55–62. [Google Scholar] [CrossRef] [Green Version]
- Mbuthia, L.W.; Acosta-Martínez, V.; Debryun, J.; Schaeffer, S.; Tyler, D.; Odoi, E.; Mpheshea, M.; Walker, F. Long term tillage, cover crop, and fertilization effects on microbial community structure, activity: Implications for soil quality. Soil Biol. Biochem. 2015, 89, 24–34. [Google Scholar] [CrossRef]
- Souza, R.C.; Hungria, M.; Cantão, M.E.; Vasconcelos AT, R.; Nogueira, M.A.; Vicente, V.A. Metagenomic analysis reveals microbial functional redundancies and specificities in a soil under different tillage and crop-management regimes. Appl. Soil Ecol. 2015, 86, 106–112. [Google Scholar] [CrossRef]
- Wang, Z.; Liu, L.; Chen, Q.; Wen, X.; Liao, Y. Conservation tillage increases soil bacterial diversity in the dryland of northern China. Agron. Sustain. Dev. 2016, 36, 28. [Google Scholar] [CrossRef] [Green Version]
- Chapin, F.S.; McFarland, J.; McGuire, A.D.; Euskirchen, E.S.; Ruess, R.W.; Kielland, K. The changing global carbon cycle: Linking plant-soil carbon dynamics to global consequences. J. Ecol. 2009, 97, 840–850. [Google Scholar] [CrossRef]
- Groenigen, K.; Bloem, J.; Bååth, E.; Boeckx, P.; Rousk, J.; Bode, S.; Forristal, D.; Jones, M.B. Abundance, production and stabilization of microbial biomass under conventional and reduced tillage. Soil Biol. Biochem. 2010, 42, 48–55. [Google Scholar] [CrossRef]
- Luo, Z.Z.; Cai, L.Q.; Li, L.L.; Niu, Y.N.; Zhang, R.Z.; Xie, J.H. Long-term effects of tillage system on soil nutrients and grain yields in rainfed area of Loess Plateau. Agric. Res. Arid. Areas 2015, 33, 171–176. (In Chinese) [Google Scholar] [CrossRef]
- Li, T.; Wang, Z.T.; Liu, L.; Liao, Y.C.; Liu, Y.; Han, J. Effect of Conservation Tillage Practices on Soil Microbial Spatial Distribution and Soil Physico-Chemical Properties of the Northwest Dryland. Sci. Agric. Sin. 2017, 50, 859–870. (In Chinese) [Google Scholar] [CrossRef]
- Gao, J.S.; Cao, W.D.; Li, D.C.; Xu, M.G.; Zeng, X.B.; Nie, J.; Zhang, W.J. Effects of long-term double-rice and green manure rotation on rice yield and soil organic matter in paddy field. Acta Ecol. Sin. 2011, 31, 4542–4548. (In Chinese) [Google Scholar]
- Huang, G.Q.; Yang, B.J.; Wang, S.B.; Huang, X.Y.; Zhang, Z.F.; Yao, Z.; Huang, L.X.; Zhao, Q.G. Effects of 8 years of conservational tillage on rice yield and soil physical, chemical and biological properties. Acta Ecol. Sin. 2015, 35, 1225–1234. (In Chinese) [Google Scholar] [CrossRef] [Green Version]
- Li, J.M.; Huang, Q.H.; Yuan, T.Y.; Cao, J.H.; Yu, X.C. Effect of long term green manure application on rice yield and soil nutrients in paddy soil. J. Plant Nutr. Fertil. 2011, 17, 563–570. (In Chinese) [Google Scholar] [CrossRef]
- Zhang, Z.C.; Li, H.W.; Chen, T.T.; Wang, X.M.; Wang, Z.Q.; Yang, J.C. Effect of Furrow Irrigation and Alternate Wetting and Drying Irrigation on Grain Yield and Quality of Rice. Sci. Agric. Sin. 2011, 44, 4988–4998. (In Chinese) [Google Scholar] [CrossRef]
- Hu, T. Effect of Ridge-Bed Cultivation on Rice Morphological Structure, Physiological Characteristics and Grain Yield. Mester’s Thesis, Hunan Agricultural University, Changsha, China, 2013. (In Chinese). [Google Scholar]
- Tang, Z.W.; Zhou, W.T.; Wang, B.R.; Zhong, K.Y.; Xiong, R.; Long, P.; Xu, Y.; Fu, Z.Q. Effects of ridge-bed cultivation on rice root characteristics and soil physical properties. Chin. J. Ecol. 2021, 40, 3961–3969. (In Chinese) [Google Scholar] [CrossRef]
- Zheng, H.B.; Yao, L.; Liu, J.X.; He, H.; Chen, Y.; Huang, H. Effect of Ridge & Terraced Cultivation on Rice Yield and Root Trait. Acta Agron. Sin. 2014, 40, 667–677. (In Chinese) [Google Scholar] [CrossRef]
- Qian, Y.D.; Li, J.F.; Zheng, G.P.; Lv, Y.D.; Guo, X.H.; Sun, C.Y. Effect of Ridge Cultivation on Root Growth of Rice in Cold Region. Chin. J. Rice Sci. 2005, 19, 238–242. (In Chinese) [Google Scholar] [CrossRef]
- Qian, Y.D.; Liu, L.H.; Li, H.Y.; Zheng, G.P.; Liu, C.W. Effects of Cold Terra Protective Tillage and Cultivation Technology on Rice Yield and Yield Components. Crops 2010, 2, 41–44. (In Chinese) [Google Scholar] [CrossRef]
- Zheng, G.P.; Han, D.L.; Lv, Y.D.; Ding, Z.L.; Li, H.Y.; Sui, Y.G.; Song, J.; Chen, H.L.; Jiang, Y.W.; Zhao, T.T. New Efficient Cultivation Pattern and Technical Code of “Dry Land Regulation and Bilateral Deep Fertilization on Ridge” for Rice. J. Heilongjiang Bayi Agric. Univ. 2016, 28, 1–3, 24. (In Chinese) [Google Scholar] [CrossRef]
- Al-Shammary, A.A.G.; Kouzani, A.Z.; Kaynak, A.; Khoo, S.Y.; Norton, M.; Gates, W. Soil bulk density estimation methods: A Review. Pedosphere 2018, 4, 581–596. [Google Scholar] [CrossRef]
- Chinese Academy of Sciences. Soil Physical and Chemical Analysis; Shanghai Science and Technology Press: Shanghai, China, 1978. (In Chinese) [Google Scholar]
- Bao, S.D. Soil and Agricultural Chemistry Analysis, 3rd ed.; Chinese Agriculture Press: Beijing, China, 2000. (In Chinese) [Google Scholar]
- Zhang, X.; Zhu, A.; Yang, W.; Zhang, J. Accumulation of organic components and its association with macroaggregation in a sandy loam soil following conservation tillage. Plant Soil 2017, 416, 1–15. [Google Scholar] [CrossRef]
- Jaziri, S.; M’hamed, H.C.; Rezgui, M.; Labidi, S.; Souissi, A.; Rezgui, M.; Barbouchi, M.; Annabi, M.; Bahri, H. Long Term Effects of Tillage–Crop Rotation Interaction on Soil Organic Carbon Pools and Microbial Activity on Wheat-Based System in Mediterranean Semi-Arid Region. Agronomy 2022, 12, 953. [Google Scholar] [CrossRef]
- Harasim, E.; Antonkiewicz, J.; Kwiatkowski, C.A. The Effects of Catch Crops and Tillage Systems on Selected Physical Properties and Enzymatic Activity of Loess Soil in a Spring Wheat Monoculture. Agronomy 2020, 10, 334. [Google Scholar] [CrossRef] [Green Version]
- Chichongue, O.; van Tol, J.; Ceronio, G.; Du Preez, C. Effects of Tillage Systems and Cropping Patterns on Soil Physical Properties in Mozambique. Agriculture 2020, 10, 448. [Google Scholar] [CrossRef]
- Chen, H.; Boutros, P.C. VennDiagram: A package for the generation of highly-customizable Venn and Euler diagrams in R. BMC Bioinform. 2011, 12, 35. [Google Scholar] [CrossRef] [PubMed] [Green Version]
- Lucheta, A.R.; Cannavan, F.D.S.; Roesch, L.F.W.; Tsai, S.M.; Kuramae, E.E. Fungal community assembly in the amazonian dark. Earth Microb. Ecol. 2016, 71, 962–973. [Google Scholar] [CrossRef] [Green Version]
- Li, S.; Wang, S.; Fan, M.; Wu, Y.; Shangguan, Z. Interactions between biochar and nitrogen impact soil carbon mineralization and the microbial community. Soil Tillage Res. 2020, 196, 104437. [Google Scholar] [CrossRef]
- Chen, L.Q.; Zhao, H.C.; He, C.; Zhou, J.; Lv, Y.D.; Li, H.Y.; Yin, D.W.; Zheng, G.P. Effects of Dry Land Regulation and Bilateral Deep Fertilization on Ridge on Yield and Quality of Rice under Nitrogen Fertilizer Operation Model. J. Henan Agric. Sci. 2018, 47, 20–26. (In Chinese) [Google Scholar] [CrossRef]
- Kang, K.; Liu, L.H.; Qing, M.; Zheng, G.P.; Zhang, X.S.; Bai, C.Y.; Zhao, S.; Gao, X.H. Effects of Ridge Tillage of Double Depth and Planting Space on Photosynthesis, Yield and Panicle Traits of Rice. Crops 2020, 5, 164–169. (In Chinese) [Google Scholar] [CrossRef]
- Li, H.Y.; Zhang, G.L.; Zheng, G.P.; Chen, L.Q.; Lv, Y.D. Evaluation on Technical Effect of Double Depth Ridge Cultivation Mode of Rice in Cold Region. Res. Soil Water Conserv. 2020, 27, 164–170. (In Chinese) [Google Scholar] [CrossRef]
- Wang, W.Y.; Wan, S.Y.; Zhang, X.S.; Wei, Y.Y.; Zhang, J.Z.; Li, H.Y.; Zheng, G.P. The Effects of Transplanting Rice Seedling Period and Seedling Type on Yield and Quality under Different Cultivation Modes. Acta Agric. Boreali-Sin. 2021, 36, 116–126. (In Chinese) [Google Scholar] [CrossRef]
- Zheng, H.B. The Law of Water Utilization and Its Mechanism of Increasing Yield of Rice Ridge Tillage and Terrace Cultivation Technology. Ph.D. Thesis, Hunan Agricultural University, Chang, China, 2014. (In Chinese). [Google Scholar]
- Ji, F.Y.; Ming, H.X.; Li, H.B.; Zan, S.J.; Wang, J.N.; Su, J.; Guo, L.M.; Chang, Y.K.; Shi, Y.; Guan, C.J.; et al. Diversity of CO2 fixation gene in the surface waters of northern South China Sea in the Calvin cycle. Acta Sci. Circumstantiae 2016, 36, 4037–4043. (In Chinese) [Google Scholar] [CrossRef]
- Liu, Q.; Wei, X.M.; Wu, X.H.; Yuan, H.C.; Wang, J.R.; Li, Y.Y.; Ge, T.D.; Wu, J.S. Characteristic of Abundances and Diversity of Carbon Dioxide Fixation Microbes in Paddy Soils. Environ. Sci. 2017, 38, 760–768. (In Chinese) [Google Scholar] [CrossRef]
- Fierer, N.; Bradford, M.A.; Jackson, R.B. Toward an ecological classification of soil bacteria. Ecology 2007, 88, 1354–1364. [Google Scholar] [CrossRef] [PubMed]
- Jones, R.T.; Robeson, M.S.; Lauber, C.L.; Hamady, M.; Knight, R.; Fierer, N. A comprehensive survey of soil acidobacterial diversity using pyrosequencing and clone library analyses. ISME J. 2009, 3, 442–453. [Google Scholar] [CrossRef] [PubMed]
- Hug, L.A.; Castelle, C.J.; Wrighton, K.C.; Thomas, B.C.; Sharon, I.; Frischkorn, K.R.; Williams, K.H.; Tringe, S.G.; Banfield, J.F. Community genomic analyses constrain the distribution of metabolic traits across the Chloroflexi phylum and indicate roles in sediment carbon cycling. Microbiome 2013, 1, 22. [Google Scholar] [CrossRef] [PubMed] [Green Version]
- Wu, L.; Wang, Y.; Zhang, S.; Wei, W.; Kuzyakov, Y.; Ding, X. Fertilization effects on microbial community composition and aggregate formation in saline-alkaline soil. Plant Soil 2021, 463, 523–535. [Google Scholar] [CrossRef]
- Cui, H.H.; Chen, Z.G.; Zhang, Q.; Zhu, Q.; Li, J.; Lu, S.; Zhang, D.P.; Gu, Y.B. Improvement and Rice Fewer-tillage Cultivation Techniques in Cold Waterlogged Field. Farming Cultiv. 2014, 2, 44–46, 60. (In Chinese) [Google Scholar] [CrossRef]
- Liu, L.J.; Liu, C.Y.; Wan, Z.H. Effects of Different Cultivation Methods and Nitrogen Fertilizer Application on Rice Yield. Hubei Agric. Sci. 2015, 54, 2061–2064. (In Chinese) [Google Scholar] [CrossRef]
- Sun, Y.J.; Ma, J.; Sun, Y.Y.; Xu, H.; Yang, Z.Y.; Liu, S.J.; Jia, X.W.; Zheng, H.Z. The effects of different water and nitrogen managements on yield and nitrogen use efficiency in hybrid rice of China. Field Crops Res. 2012, 127, 85–98. [Google Scholar] [CrossRef]
- Chen, J.; Ma, Z.M.; Liu, L.L.; Lv, X.D. Effect of tillage system on soil organic carbon, microbial biomass and enzyme activities. J. Plant Nutr. Fertil. 2016, 22, 667–675. (In Chinese) [Google Scholar] [CrossRef]
- Lu, D.; Lei, J.; Wei, Y.Y.; Shen, W.K.; Huang, Y.F.; Gu, M.H. Effect of Microbial Community and Diversity Index of Paddy Soil under Short No-tillage and Ridge Tillage. Southwest China J. Agric. Sci. 2015, 28, 1670–1674. (In Chinese) [Google Scholar] [CrossRef]


| Year | Treatment | Base Fertilizer | Regulating Fertilizer | Panicle Fertilizer | ||||
|---|---|---|---|---|---|---|---|---|
| N | P | K | N | N | K | |||
| 2016–2018 | L | Upper layer | 40.85 | 5.16 | 9.92 | 10.35 | — | 12.96 |
| Lower layer | 47.50 | 7.40 | 15.02 | — | — | — | ||
| P | Full layer | 88.35 | 12.56 | 24.94 | 10.35 | — | 12.96 | |
| Year | Treatment | Alkali-Hydrolyzed Nitrogen (AN) (mg/kg) | Available Phosphorus (AP) (mg/kg) | Available Potassium (AK) (mg/kg) | Organic Matter (OC) (g/kg) | pH |
|---|---|---|---|---|---|---|
| 2016 | L | 155.90 | 30.75 | 189.47 | 35.50 | 7.25 |
| P | 155.90 | 30.75 | 189.47 | 35.50 | 7.25 | |
| 2017 | L | 171.58 | 32.97 | 134.75 | 33.00 | 7.23 |
| P | 173.38 | 36.89 | 136.05 | 35.00 | 7.12 | |
| 2018 | L | 144.89 | 28.17 | 179.35 | 27.30 | 7.55 |
| P | 158.06 | 31.94 | 184.96 | 35.30 | 7.34 |
| Treatment | pH | Organic Matter (OC) (g/kg) | Alkali-Hydrolyzed Nitrogen (AN) (mg/kg) | Available Phosphorus (AP) (mg/kg) | Available Potassium (AK) (mg/kg) | Total Nitrogen (TN) (g/kg) | Total Phosphorus (TP) (g/kg) | Total Potassium (TK) (g/kg) |
|---|---|---|---|---|---|---|---|---|
| L | 7.81 a | 32.27 a | 146.67 a | 47.22 a | 122.06 a | 1.76 a | 0.94 a | 18.36 a |
| P | 8.08 a | 29.77 b | 138.33 b | 39.13 b | 109.27 b | 1.59 b | 0.86 a | 18.07 a |
| Treatment | 0–5 cm | 5–10 cm | 10–15 cm | 15–20 cm | |
|---|---|---|---|---|---|
| Bulk density (g·cm−3) | L | 1.19 b | 1.29 b | 1.36 a | 1.35 a |
| P | 1.35 a | 1.44 a | 1.50 a | 1.35 a | |
| Total porosity (%) | L | 59.56 a | 51.26 a | 42.50 a | 40.25 a |
| P | 45.23 b | 40.15 b | 39.21 a | 38.25 a | |
| Total aggregates (%) | L | 22.30 a | 28.90 a | ||
| P | 19.60 b | 24.50 b | |||
| Treatment | Bacterial (V3 + V4) OTU Numbers | Coverage | Fungal (ITS1) OTU Numbers | Coverage |
|---|---|---|---|---|
| L | 1549 a | 0.9974 a | 489 a | 0.9998 a |
| P | 1465 b | 0.9905 b | 464 a | 0.9998 a |
| Treatment | ACE Index | Chao Index | Simpson Index | Shannon Index | ACE Index | Chao Index | Simpson Index | Shannon Index |
|---|---|---|---|---|---|---|---|---|
| Bacterial (V3 + V4) | Fungal (ITS1) | |||||||
| L | 1572.069 a | 1576.272 a | 0.005 a | 6.360 a | 493.631 a | 498.000 a | 0.115 a | 4.096 a |
| P | 1549.379 a | 1547.933 a | 0.005 a | 6.332 a | 468.986 a | 472.095 a | 0.078 a | 3.835 a |
| Year | Treatment | Number of Panicles (m2) | Number of Grains Per Panicle | Seed Setting Rate (%) | Weight of 1000-Grain (g) | Rice Yield (kg/ha) |
|---|---|---|---|---|---|---|
| 2016 | L | 629.33 a | 70.03 b | 93.77 a | 24.29 a | 10,027.13 a |
| P | 508.00 b | 79.36 a | 91.38 a | 25.23 a | 9294.45 a | |
| 2017 | L | 563.17 a | 78.93 a | 92.95 b | 25.81 a | 10,664.51 a |
| P | 508.33 b | 69.11 b | 95.25 a | 26.83 a | 8977.00 b | |
| 2018 | L | 532.17 a | 68.73 a | 86.95 a | 27.22 a | 8653.08 a |
| P | 447.67 b | 61.55 a | 83.41 a | 27.53 a | 6340.92 b |
| Correlation | OTU | ACE index | Chao Index | Simpson Index | Shannon Index |
|---|---|---|---|---|---|
| Weight of panicles | 0.989 ** | 0.942 ** | 0.947 ** | 0.093 | 0.545 |
| Number of panicles per hill | 0.555 | 0.486 | 0.419 | −0.291 | 0.595 |
| Number of real grains | 0.981 ** | 0.927 ** | 0.931 ** | 0.133 | 0.51 |
| Number of shattered grains | −0.686 | −0.657 | −0.626 | −0.6 | 0.061 |
| Number of empty particles | 0.884 * | 0.816 * | 0.775 | 0.326 | 0.312 |
| Weight of real grain | 0.979 ** | 0.932 ** | 0.932 ** | 0.164 | 0.482 |
| Number of panicles per m2 | 0.709 | 0.655 | 0.593 | −0.163 | 0.575 |
| Number of grains per panicle | 0.752 | 0.735 | 0.798 | 0.231 | 0.283 |
| Seed setting rate | 0.845 * | 0.818 * | 0.835 * | 0.427 | 0.166 |
| Weight of 1000-grain | −0.619 | −0.559 | −0.588 | 0.508 | −0.796 |
| Yield | 0.971 ** | 0.931 ** | 0.922 ** | 0.172 | 0.464 |
| Correlation | OTU | ACE Index | Chao Index | Simpson Index | Shannon Index |
|---|---|---|---|---|---|
| Weight of panicles | 0.455 | 0.465 | 0.438 | −0.052 | 0.394 |
| Number of panicles per hill | −0.212 | −0.183 | −0.175 | 0.288 | −0.158 |
| Number of real grains | 0.452 | 0.463 | 0.441 | −0.045 | 0.389 |
| Number of shattered grains | −0.717 | −0.736 | −0.752 | 0.272 | −0.589 |
| Number of empty particles | 0.505 | 0.524 | 0.519 | 0.002 | 0.369 |
| Weight of real grain | 0.5 | 0.511 | 0.489 | −0.076 | 0.426 |
| Number of panicles per m2 | 0.021 | 0.049 | 0.055 | 0.138 | 0.055 |
| Number of grains per panicle | 0.575 | 0.563 | 0.523 | −0.188 | 0.48 |
| Seed setting rate | 0.672 | 0.683 | 0.681 | −0.291 | 0.607 |
| Weight of 1000-grain | 0.318 | 0.308 | 0.327 | −0.244 | 0.169 |
| Yield | 0.516 | 0.53 | 0.513 | −0.108 | 0.452 |
Publisher’s Note: MDPI stays neutral with regard to jurisdictional claims in published maps and institutional affiliations. |
© 2022 by the authors. Licensee MDPI, Basel, Switzerland. This article is an open access article distributed under the terms and conditions of the Creative Commons Attribution (CC BY) license (https://creativecommons.org/licenses/by/4.0/).
Share and Cite
Liu, L.; Cui, S.; Qin, M.; Chen, L.; Yin, D.; Guo, X.; Li, H.; Zheng, G. Effects of Continuous Ridge Tillage at Two Fertilizer Depths on Microbial Community Structure and Rice Yield. Agriculture 2022, 12, 923. https://doi.org/10.3390/agriculture12070923
Liu L, Cui S, Qin M, Chen L, Yin D, Guo X, Li H, Zheng G. Effects of Continuous Ridge Tillage at Two Fertilizer Depths on Microbial Community Structure and Rice Yield. Agriculture. 2022; 12(7):923. https://doi.org/10.3390/agriculture12070923
Chicago/Turabian StyleLiu, Lihua, Shize Cui, Meng Qin, Liqiang Chen, Dawei Yin, Xiaohong Guo, Hongyu Li, and Guiping Zheng. 2022. "Effects of Continuous Ridge Tillage at Two Fertilizer Depths on Microbial Community Structure and Rice Yield" Agriculture 12, no. 7: 923. https://doi.org/10.3390/agriculture12070923