Article

Effects of Rust on Plant Growth and Stoichiometry of Leymuschinensis under Different Grazing Intensities in Hulunber Grassland

1
State Key Laboratory of Grassland Agro-Ecosystems, Key Laboratory of Grassland Livestock Industry Innovation, Ministry of Agriculture and Rural Affairs, College of Pastoral Agricultural Science and Technology, Lanzhou University, Lanzhou 730020, China
2
School of Pharmacy, Lanzhou University, Lanzhou 730000, China
3
Retired from AgResearch, Grasslands Research Centre, Private Bag 11-008, Palmerston North 4442, New Zealand
4
National Hulunber Grassland Ecosystem Observation and Research Station, Institute of Agricultural Resources and Regional Planning, Chinese Academy of Agricultural Science, Beijing 100081, China
*
Author to whom correspondence should be addressed.
Agriculture 2022, 12(7), 961; https://doi.org/10.3390/agriculture12070961
Submission received: 29 April 2022 / Revised: 23 June 2022 / Accepted: 28 June 2022 / Published: 5 July 2022
(This article belongs to the Special Issue Plant–Soil–Microorganism Interaction in Grassland Agroecosystem)

Abstract

:
Grazing is the main utilization of native grassland, and forage fungal disease is one of the limiting factors of grassland productivity. The present research in the Hulunber meadow steppe grassland was conducted to investigate the responses of the dominant plant Leymus chinensis (Trin.) to beef cattle grazing, rust, and their interaction influence. Six grazing intensity treatments with three replicates were established. The response of L. chinensis to grazing and rust was systematically studied for two consecutive years. The main findings were that grazing and rust had significant effects (p < 0.05) on the growth and nutrient elements content of L. chinensis. Compared with the 0 cattle ha−1 treatment, the dry matter of L. chinensis in the 0.42, 0.63, and 1.67 cattle ha−1 treatments decreased by 42.2%, 90.5%, and 339.5%, respectively. Compared with non-infected plants, dry matter of rust-infected L. chinensis plants decreased by 45.6%. The N:C and P:C ratios of rust-infected plants were lower than in non-infected plants, and positively correlated with their relative growth rates. Therefore, we concluded that the growth rate hypothesis still applied in L. chinensis under the interactive effects of grazing and disease. Additionally, grazing can alleviate the loss of dry matter caused by disease.

1. Introduction

Grasslands, about 390 million ha, cover 41% of the total land area in China [1]. The Hulunber meadow steppe, located in northeastern China, is one of the largest areas of natural temperate sub-humid meadow steppe grassland in the world, covering an area about 9.97 × 10⁶ km2 [2]. It plays a critical role in regional ecological balance and is also an important ecological barrier in north China [3,4]. The most dominant plant species of this grassland is Leymus chinensis (Trin.) [5]. L. chinensis is a perennial rhizomatous grass with rich nutritional content, high yield, and palatability, and lays the foundation for highly productive livestock husbandry in the Hulunber grassland [4,6].
Large herbivores are key drivers of plant communities and ecosystem functioning in many terrestrial ecosystems as they influence nutrient cycling and availability in soil and plants [7,8,9,10,11]. Livestock grazing is the most prevalent use of grasslands. Grazing herbivores change the vegetation cover and cause soil compaction as a result of ingestion and trampling [4,12,13,14]. Generally, the response of grassland ecosystems to livestock disturbance is mediated by various factors, such as local environmental conditions, livestock species, grazing intensity, and plant diseases [9,15,16].
Fungal diseases are one of the main limiting factors affecting grassland productivity, leading to degradation, and can strongly contribute to the rate and magnitude of ecosystem function in grassland [17,18,19]. In addition, disease also reduces the palatability of grass for livestock [20]. Infection of grasses by some fungi can result in the accumulation of fungal toxins and secondary metabolites that are harmful to grazing animals and even humans [21,22,23], further restricting the productivity of animal husbandry [21]. It is worth noting that there have been some clues that conservative grazing may be one of the effective ways to control fungal disease in this grassland [24]. However, the influence of grazing on grassland diseases is not a consistent factor with plant diseases. Grazing may reduce the incidence by removing the infected tissues and pathogens on the foliage through ingestion [22], or, in contrast, promote pathogen invasion by forming wounds on plants through ingestion or trampling [25,26,27,28]. The transmission and infection of pathogens is also significantly affected by plant species diversity, plant abundance, aboveground biomass, and the functional composition of grassland ecosystems [29,30,31,32,33]. All the above-mentioned factors are directly or indirectly affected by grazing. Therefore, grazing should be regarded as one of the potential available methods to limit the damage caused by plant pathogens in grasslands and forage-based grazing systems.
Ecological stoichiometry describes the balance of energy and nutrients between organisms and their environment and can improve our understanding of impacts of energy and nutrient fluxes, and also balances between plants, microbes, soil, and individual organism growth [34,35,36,37]. There are two different mechanisms to explain the effect of grazing on grassland nutrient cycling [9,34,38]. One is that grazing may stimulate soil microbial activity and accelerate nutrient cycling rates by introducing fresh leaves, plant litter, and livestock waste into the soil [39,40]. The other viewpoint suggests that grazing may reduce nutrient cycling rates by increasing plant species with low palatability within the population [9,38,41,42]. Ecological stoichiometry focuses on the chemical elements necessary for all life and is easily generalizable across systems and taxa, which is extremely useful in research on multi-trophic interactions such as infectious diseases on plants [43,44,45]. The classical paradigm, the growth rate hypothesis, based on the relationships between the N:P in organisms and their growth rate capacity and scaling ecological consequences, has been proved in many systems [35,43]. It allows us to make predictions about the roles of specific elements in diseases, and about the linkage between infectious diseases and nutrient cycles, by uniting them with a common, multimetric currency [46].
Both grazing and disease have significant effects on the productivity of plants [2,47]. However, the mechanism of ecological stoichiometry in response to grassland diseases is rarely reported. How the interaction between grazing and disease affects the stoichiometry of the individual plant is still uncertain. Therefore, a two-year study was carried out in the Hulunber grasslands trial site. L. chinensis, the dominant plant species in the local area, was utilized as the experimental species. Through analyzing the growth indexes, disease incidence, and elements content in individual plants, we aimed to explore the ecological stoichiometry response strategies of L. chinensis to grazing and disease, as well as their interaction effects. Hopefully, our results will enhance understanding about how to use grazing as one of the methods to control diseases in natural grasslands.

2. Materials and Methods

2.1. Study Site

This study site is located at the Hulunber Grassland Ecosystem Station of the Chinese Academy of Agricultural Sciences, which is in the northeast Inner Mongolia grassland, a central part of the Hulunber meadow steppe, China (N 49°19′21″~49°20′10″, E 119°56′31″~119°57′51″; elevation varies from 666 m~680 m) [4]. The climate of this location is temperate semiarid continental, with an annual average of 110 frost-free days. The mean annual temperature range is −5 °C~−2 °C and with an annual precipitation range of 350 mm~400 mm, with more than 80% falling from July to August [5]. The precipitation was about 280 mm~320 mm during the growing season in 2015 and 2016. The type of the soil is kastanozems according to FAO/UNESCO System of Soil Classification. The vegetation is characterized as typical meadow steppe that is dominated by L. chinensis, Stipa baicalensis (Roshev.), and Carex duriuscula (C.A. Mey), other species are Galium verum (L.), Bupleurum scorzonerifolium (Willd.) and Filifolium sibiricum (L.). The grassland usually regrows in early May and starts to wither in late September. It is suitable for cattle grazing only from June to October, limited by the short growing season.

2.2. Experimental Design

The grassland area was divided into 18 paddocks, each of 5 ha (300 m × 167 m). Six levels of cattle grazing intensity were set as follows: 0.00, 0.42, 0.63, 0.83, 1.25, and 1.67 cattle ha−1, corresponding to 0, 2, 3, 4, 6, and 8 adult cattle with 500 kg of live body weight per plot, which were designated G0, G1, G2, G3, G4, and G5, respectively, in a randomized complete block design with three replicates (Appendix A Figure A1). The grazing cattle were kept in plots for 24 h a day over the grazing period and supplied with water from an outside source. This study site has been used since 2009 as summer pastures, with a grazing period from June to September each year.

2.3. Plant Sample Collection and Measurements

During the growing season, tillers of L. chinensis were obtained at the end of June, July, and August in 2015 and 2016. One hundred tillers were collected in each plot from rust-infected and also non-infected plants (100 tillers per plot × 6 grazing intensities × 3 replicates). Tillers that had 30–50% of the leaf area covered by uredinia and telia were collected as rust-infected samples, while tillers that were without any rust pustules were collected as the non-infected samples [48]. All of the collected tillers were cut near to the soil surface and oven-dried at 65 °C to a constant weight (at least 48 h) to obtain dry matter (DM) content. Then the weighed samples were milled to a fine powder with a particle size <0.2 mm for plant organic carbon (C), plant-total-nitrogen (N), and total phosphorus (P) analysis [48,49]. The percentage of C was analyzed by the Walkley–Black modified acid-dichromate FeSO4 titration method as described by Nelson and Sommers [50]. Briefly, 0.015 g of milled plant tissue was digested with 5 mL of 1 N K2Cr2O7 and 10 mL of concentrated sulfuric acid at 185 °C for 5 min, followed by titration of the digests with standardized FeSO4. N and P were determined by a FIAstar 5000 Analyzer (Foss Tecator, Höganäs, Sweden) [9].
We surveyed L. chinensis monthly for the presence of rust pathogens in five assigned quadrats (1 m × 1 m) in each of the 18 (5 ha) grazing plots from June to August in 2015 and 2016. We conducted the survey using an ‘X’ preselected pattern, and the separation distance for adjacent quadrats was at least 100 m. The quadrats were located away from the plot fences to avoid marginal effects. In each survey, we visually examined the aboveground tissues (stems, leaves, inflorescences) of all the L. chinensis plants present per quadrat. We also collected 5~10 samples of rust-infected L. chinensis to establish the identity of the rust species in the laboratory using both the morphological methods via light microscopy (Olympus CX31, Japan) and molecular methods.
Relative growth rate (μ) was calculated as [34]:
μ = Ln (M1/M0)/t
where M1 and M0 represented the DM of L. chinensis at the beginning and at the end of the month, respectively, t for 30 days.
The response ratio was calculated as the ratio of non-infected tillers to rust-infected tillers. The smaller the ratio, the smaller the impact of the rust [51].

2.4. Statistical Analysis

The incidence of rust on L. chinensis was calculated as the percentage of rust-infected tillers in each quadrat. The data analyses were performed using the GenStat version 17.1 (VSN International Ltd., Oxford, UK) based on the 2-year (2015 and 2016) average. One way analysis of variance (ANOVA) with Tukey’s tests was used to evaluate the effects of grazing intensity on dry matter, relative growth rate, C, N, and P content (%), and C:N:P stoichiometry of non-infected and rust-infected L. chinensis, respectively. Generalized linear mixed models were used to test the significance of variation in dry matter, relative growth rate, C, N, and P content (%), and C:N:P stoichiometry, with sample date and grazing intensity as main effects. Individual comparisons of dry matter, C, N, and P content (%), C:N:P stoichiometry and relative growth rate between non-infected and rust-infected tillers were performed using independent sample t-tests at p < 0.05.
Prior to the ANOVA, data were checked for normality and homogeneity, and were transformed whenever necessary to meet the assumption. Means are reported with standard errors. To assess the relationship between the relative growth rates of non-infected and rust-infected plants with the C:N:P stoichiometry, we constructed a series of generalized linear models. The redundancy analysis (RDA) was used to further assess the effects of grazing and rust on the DM and C, N, and P content (%). To quantify the relative importance of the grazing and rust on the DM of L. chinensis, we constructed the structural equation model (SEM) based on the known relationship among grazing intensity and the C, N, and P content (%) of L. chinensis. The RDA and the structural equation were carried out with the Canoco console 4.5 [52] and RStudio, respectively.

3. Results

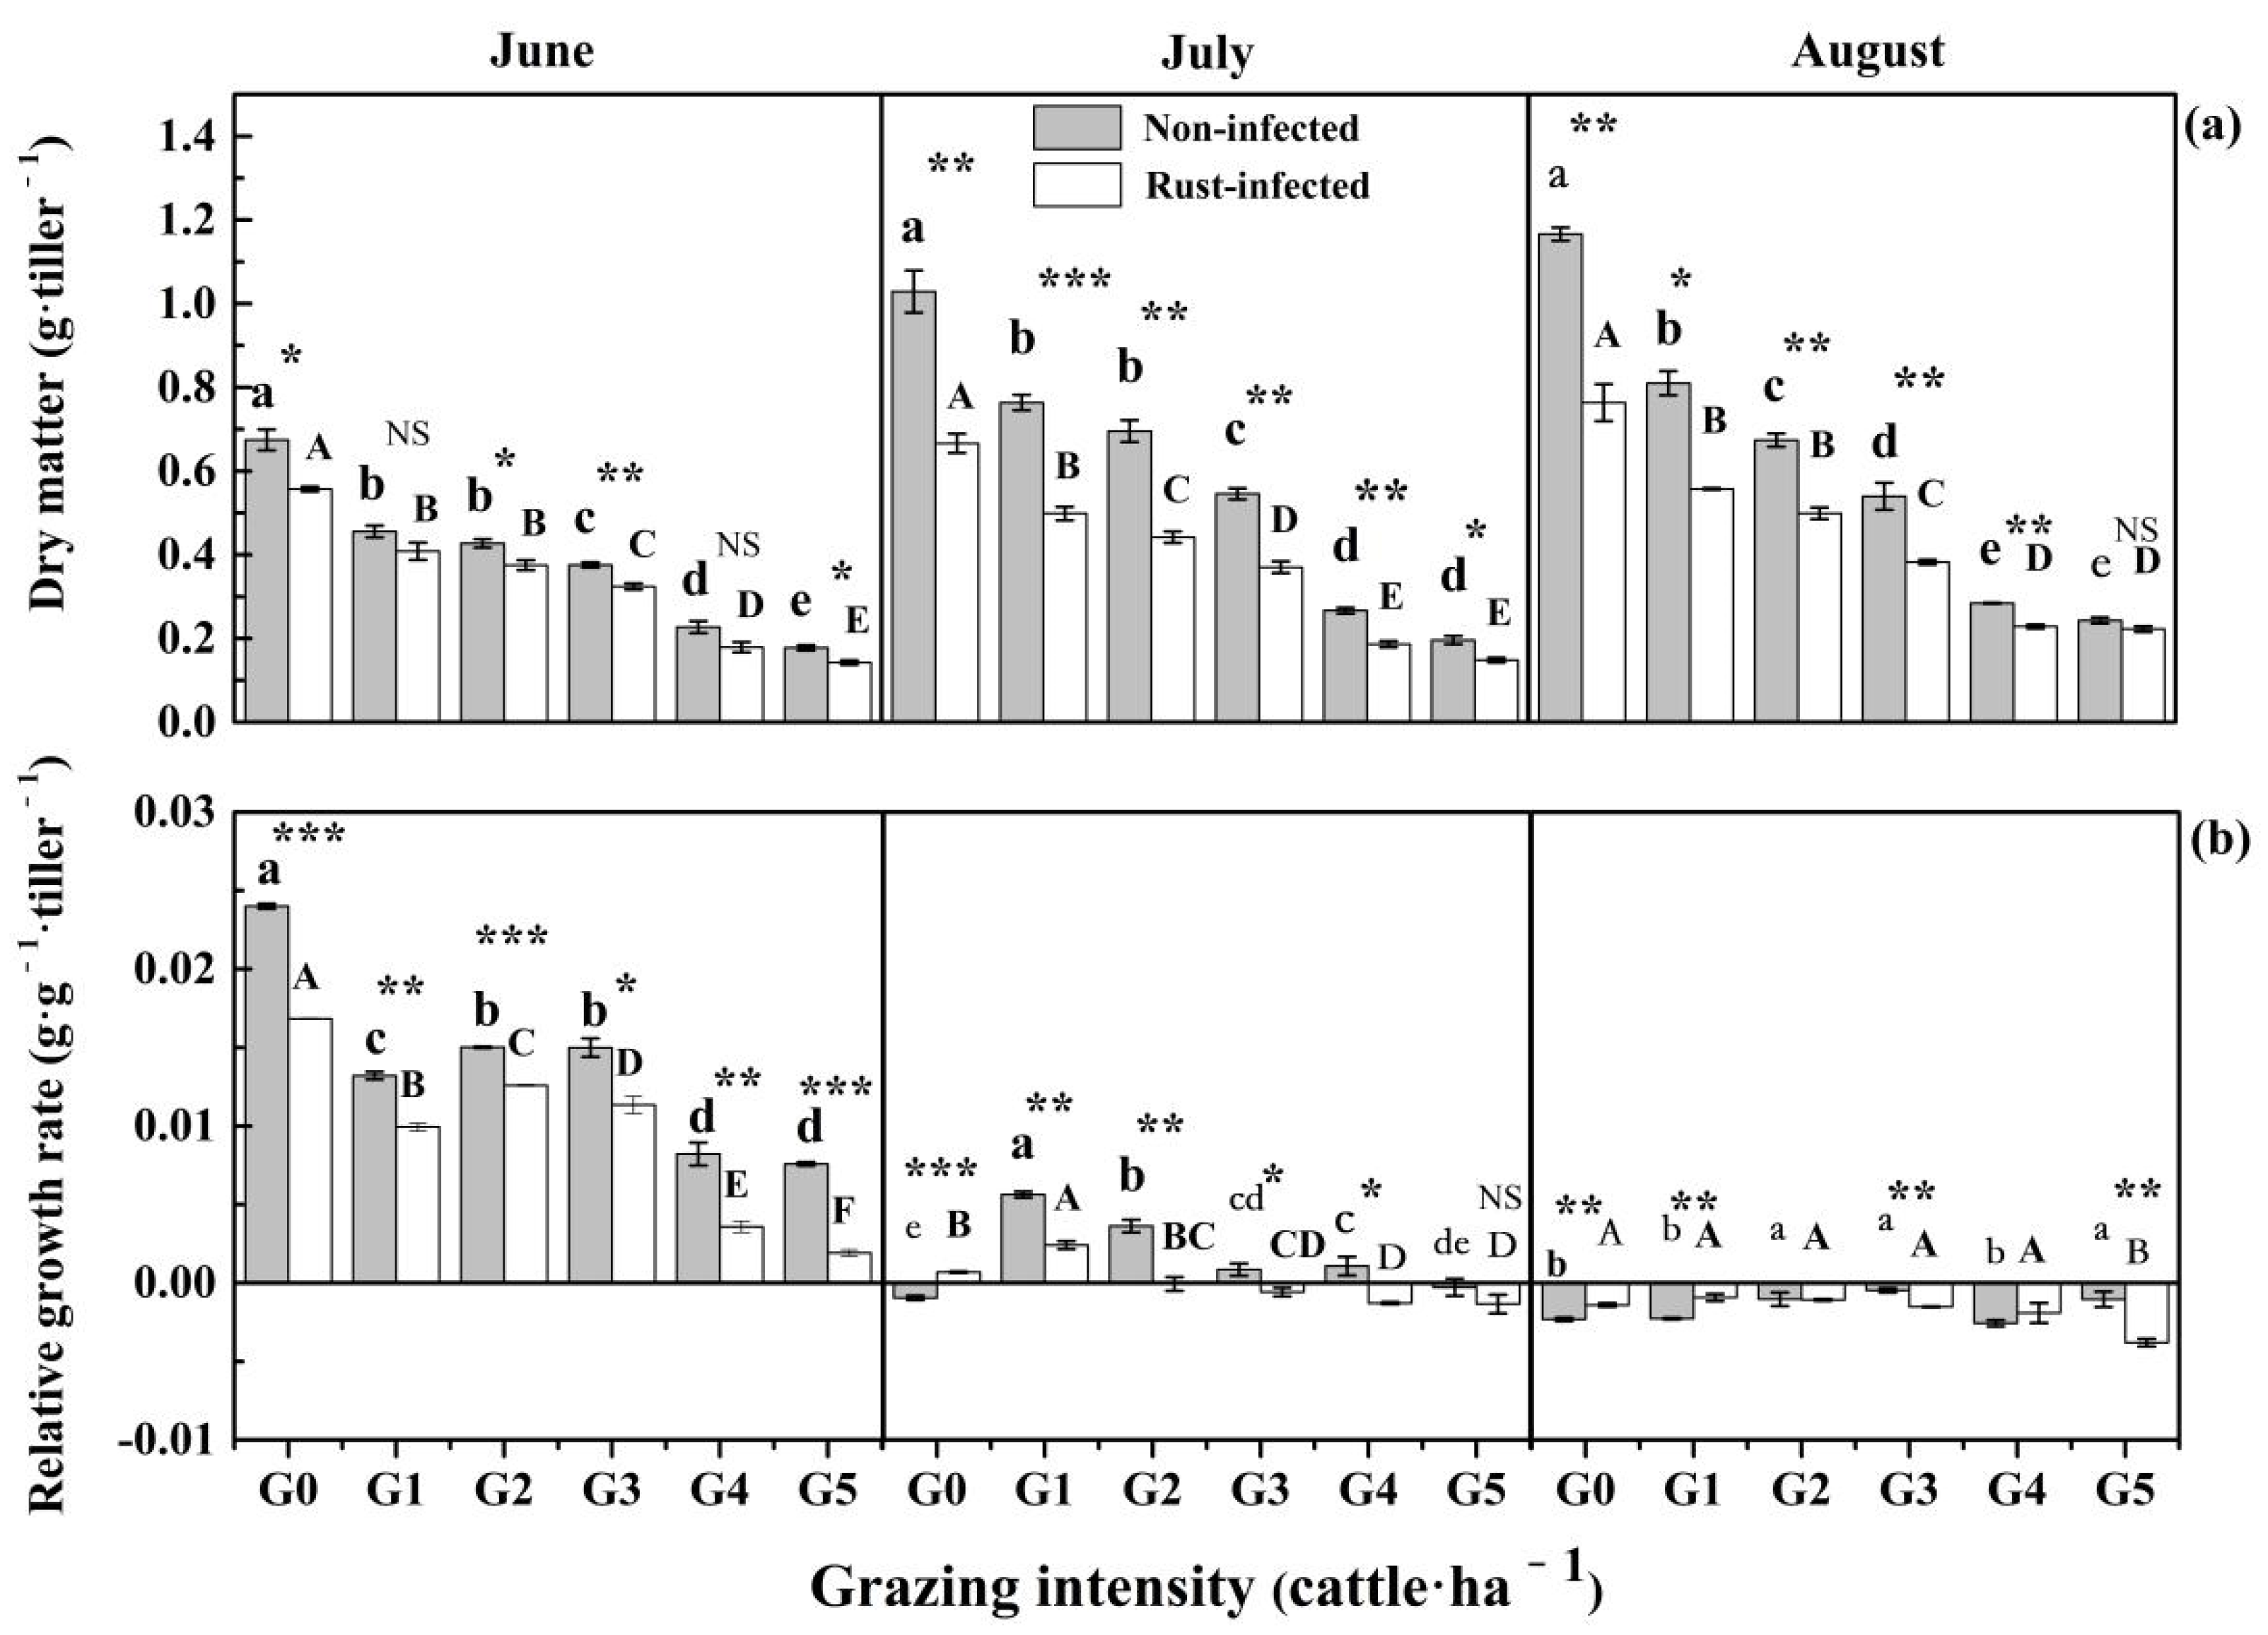
3.1. Effects of Grazing Intensity on L. chinensis Rust Incidence and Growth

The rust on L. chinensis was predominantly caused by Puccinia elymi (Westend.), a species that was first reported in Jilin province of China [53]. The specific identification process and pathogenicity testing was as used in our previous studies [16]. The field survey results indicated that the rust incidence tended to significantly (p < 0.05) decrease with increasing grazing intensity from June to August. As compared with the G0 treatment, the incidence under the G5 treatment decreased by 89%. The rust incidence was the highest under the G0 and G1 treatments in July. Under the rest of the grazing intensities, incidence on L. chinensis was the highest in August (Figure 1).
During the growth season, the DM of L. chinensis declined significantly (p < 0.05) in response to increasing grazing intensities in the meadow steppe. As compared with the G0 treatment, the DM decreased by 42.2%, 90.5%, and 339.5% in the G1, G3, and G5 treatments, respectively. Compared with non-infected plants, there was a sharp decrease by 30.2% in the DM of rust-infected plants (Figure 2a) from June to August. The relative growth rate of L. chinensis was the highest in the G0 treatment. With the grazed treatments it increased from the G1 to the G3 treatment and decreased from the G3 to the G5 treatment in June. Over time, relative growth rate increased from the G0 to the G3 treatment in June and then declined from the G3 to the G5 treatment in July. However, the relative growth rate was negative due to the cessation of L. chinensis growth. The relative growth rate of rust-infected plants decreased by 57.1% compared with non-infected plants (Figure 2b).

3.2. Effects of Grazing Intensity on Stoichiometry of Non-Infected and Rust-Infected L. chinensis

For the C content, there were no significant differences (p > 0.05) between the G0 treatment and the G4 and G5 treatments. There was also no significant difference (p > 0.05) between non-infected and rust-infected plants except in the G1, G2, and G5 treatments (Figure 3a). The N content increased with the increase of grazing intensity, except for the ungrazed treatment. There was a significant (p < 0.05) decrease of 8.3% in the N content of rust-infected plants in July and August (Figure 3b). The P content was the lowest under the G3 treatment, and there was no significant difference (p > 0.05) compared with the G5 treatment. The P content of rust-infected plants decreased by 7.7% from June to August (Figure 3c).
The C:N ratios of L. chinensis increased from G0 to G2, then they decreased from G3 to G5 from June to August. From G3 to G5, reduced C:N ratios were due primarily to increases in N content (Figure 4a). The C:P ratios (Figure 4b) showed similar patterns as the C:N ratios. The C:N and C:P ratios were both the highest in July. However, the N:P ratios did not show specific rules (Figure 4c). In contrast to the C, N, and P content (%) of non-infected and rust-infected plants, the C:N and C:P ratios significantly (p < 0.05) increased by 17.3% and 10.2%, respectively, from June to August (Figure 4a, b). There was no significant difference (p > 0.05) in the N:P ratios between non-infected and rust-infected plants (Figure 4c).

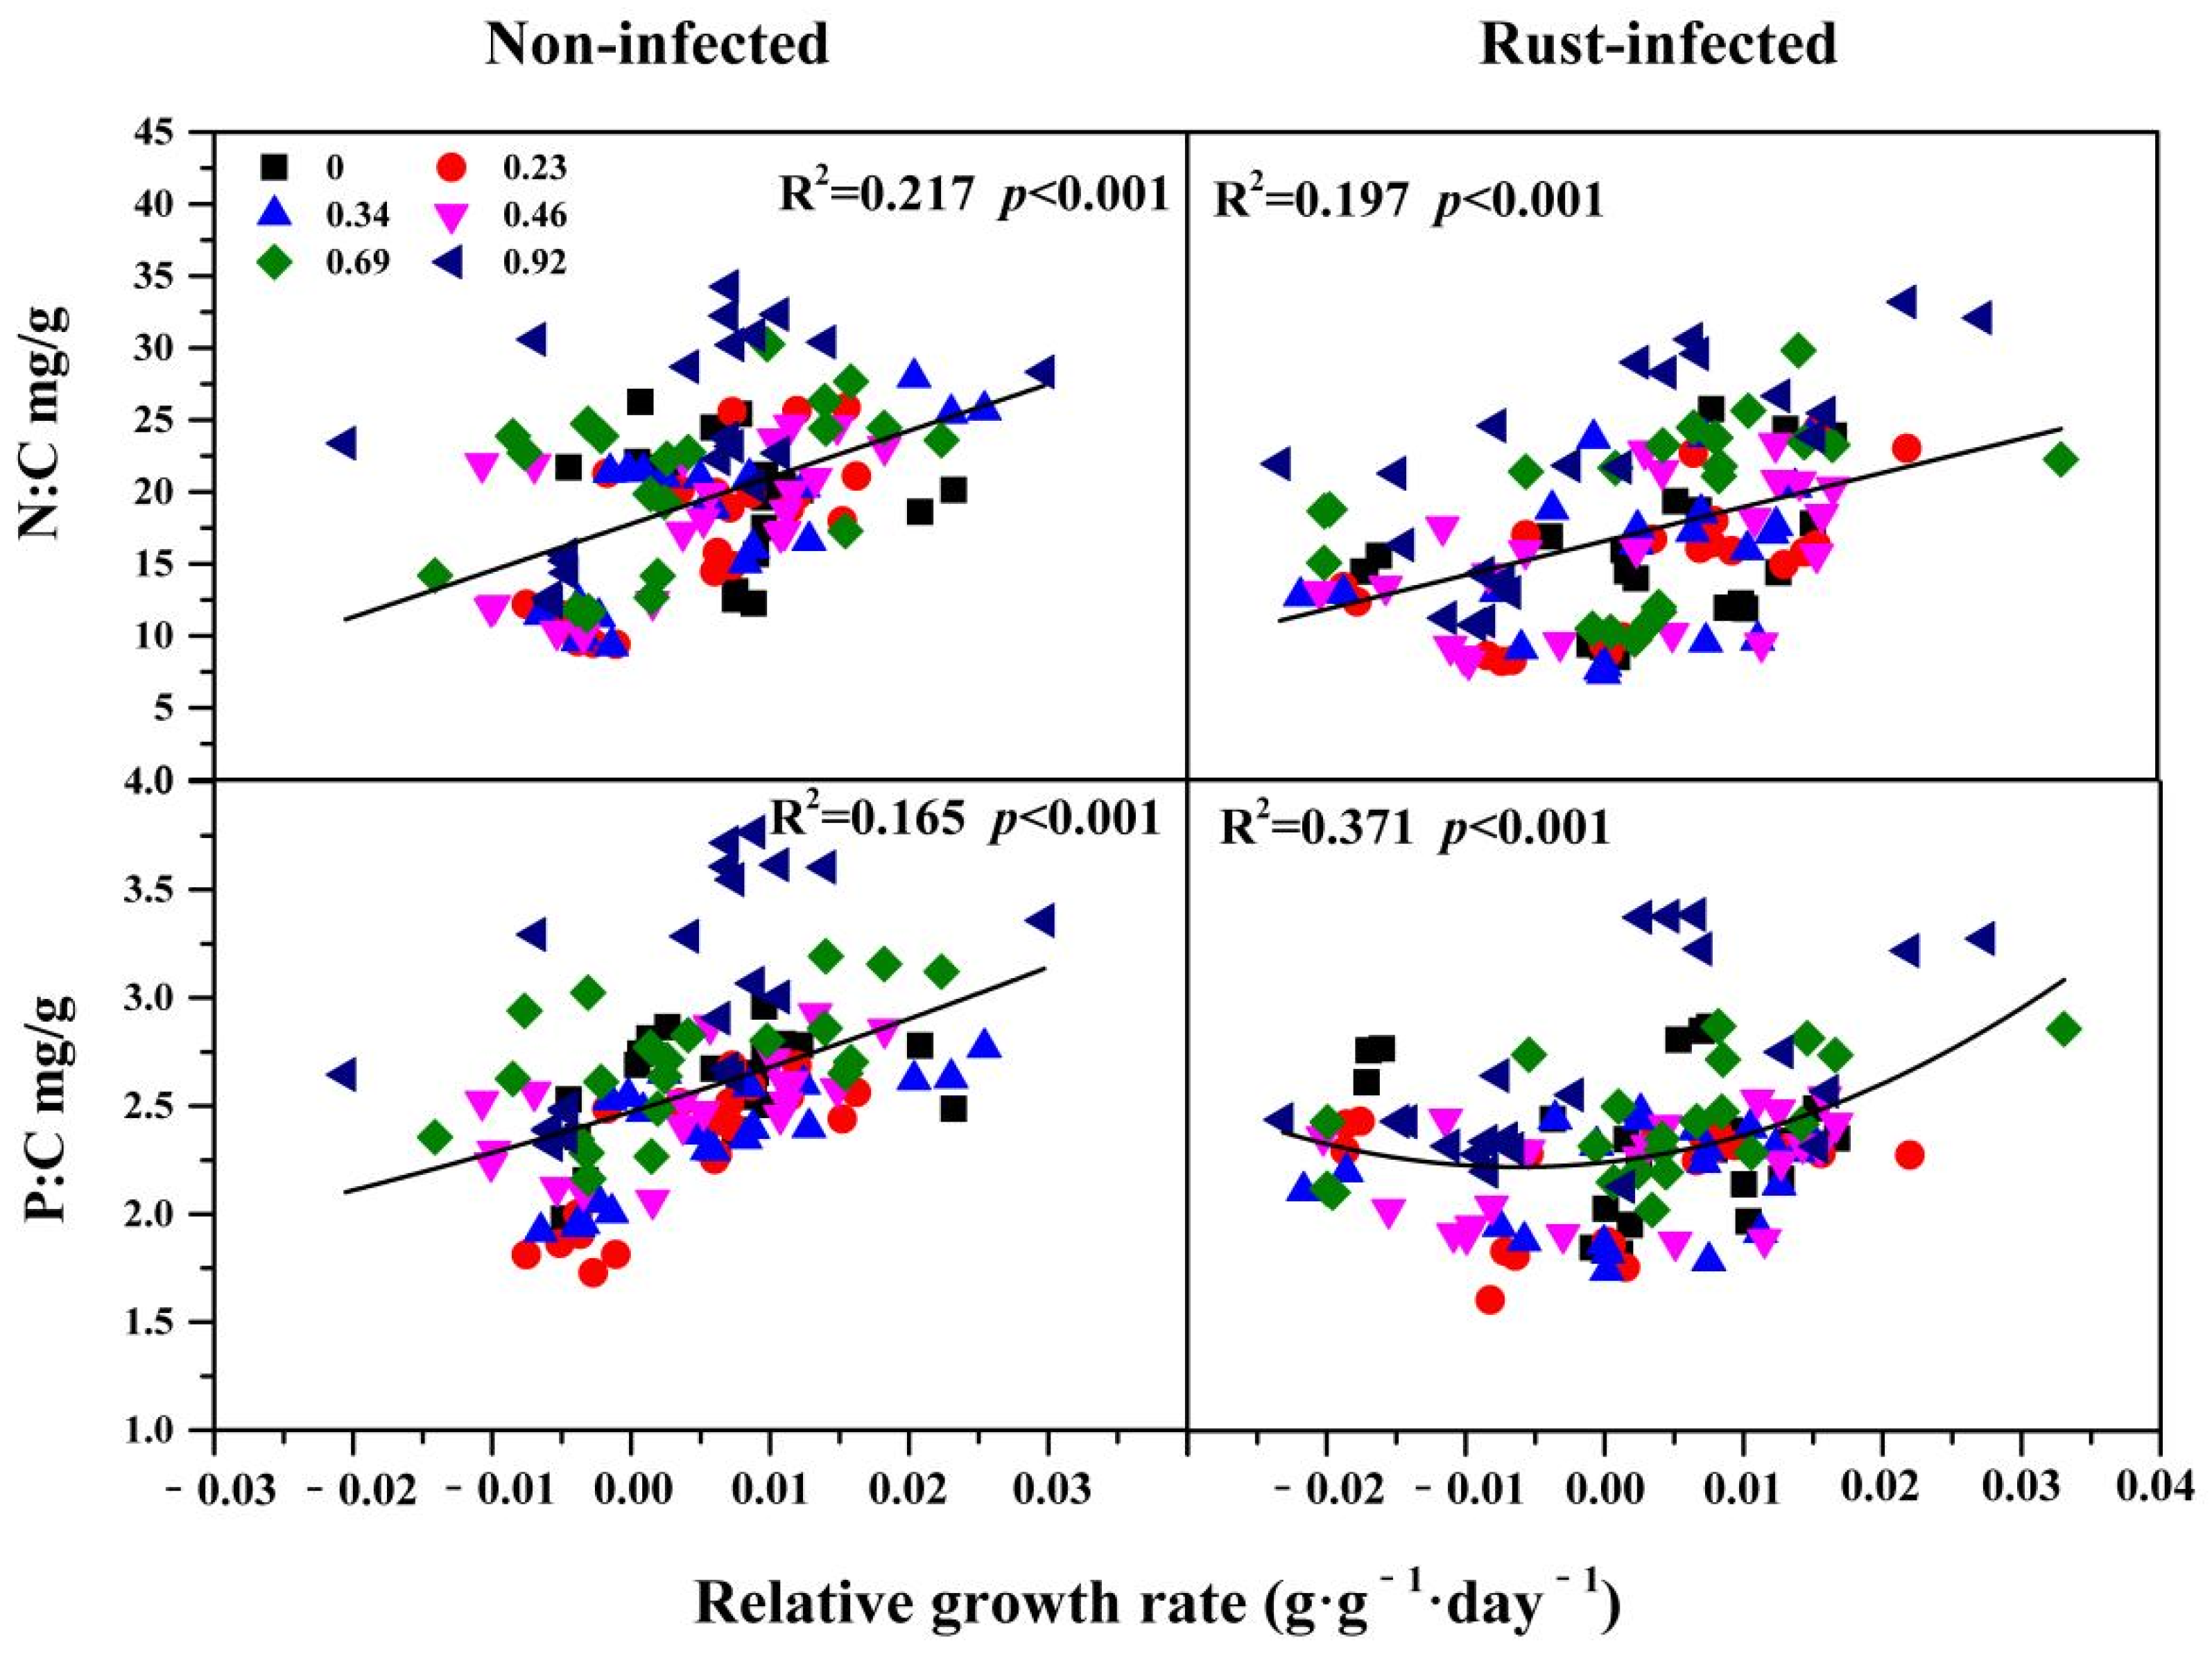
3.3. The Relationship between Relative Growth Rate and C:N:P Stoichiometry

For non-infected and rust-infected plants, the ratios of N:C and P:C increased with the relative growth rates. The higher growth rates correspond to a higher N:C and P:C ratios (Figure 5).

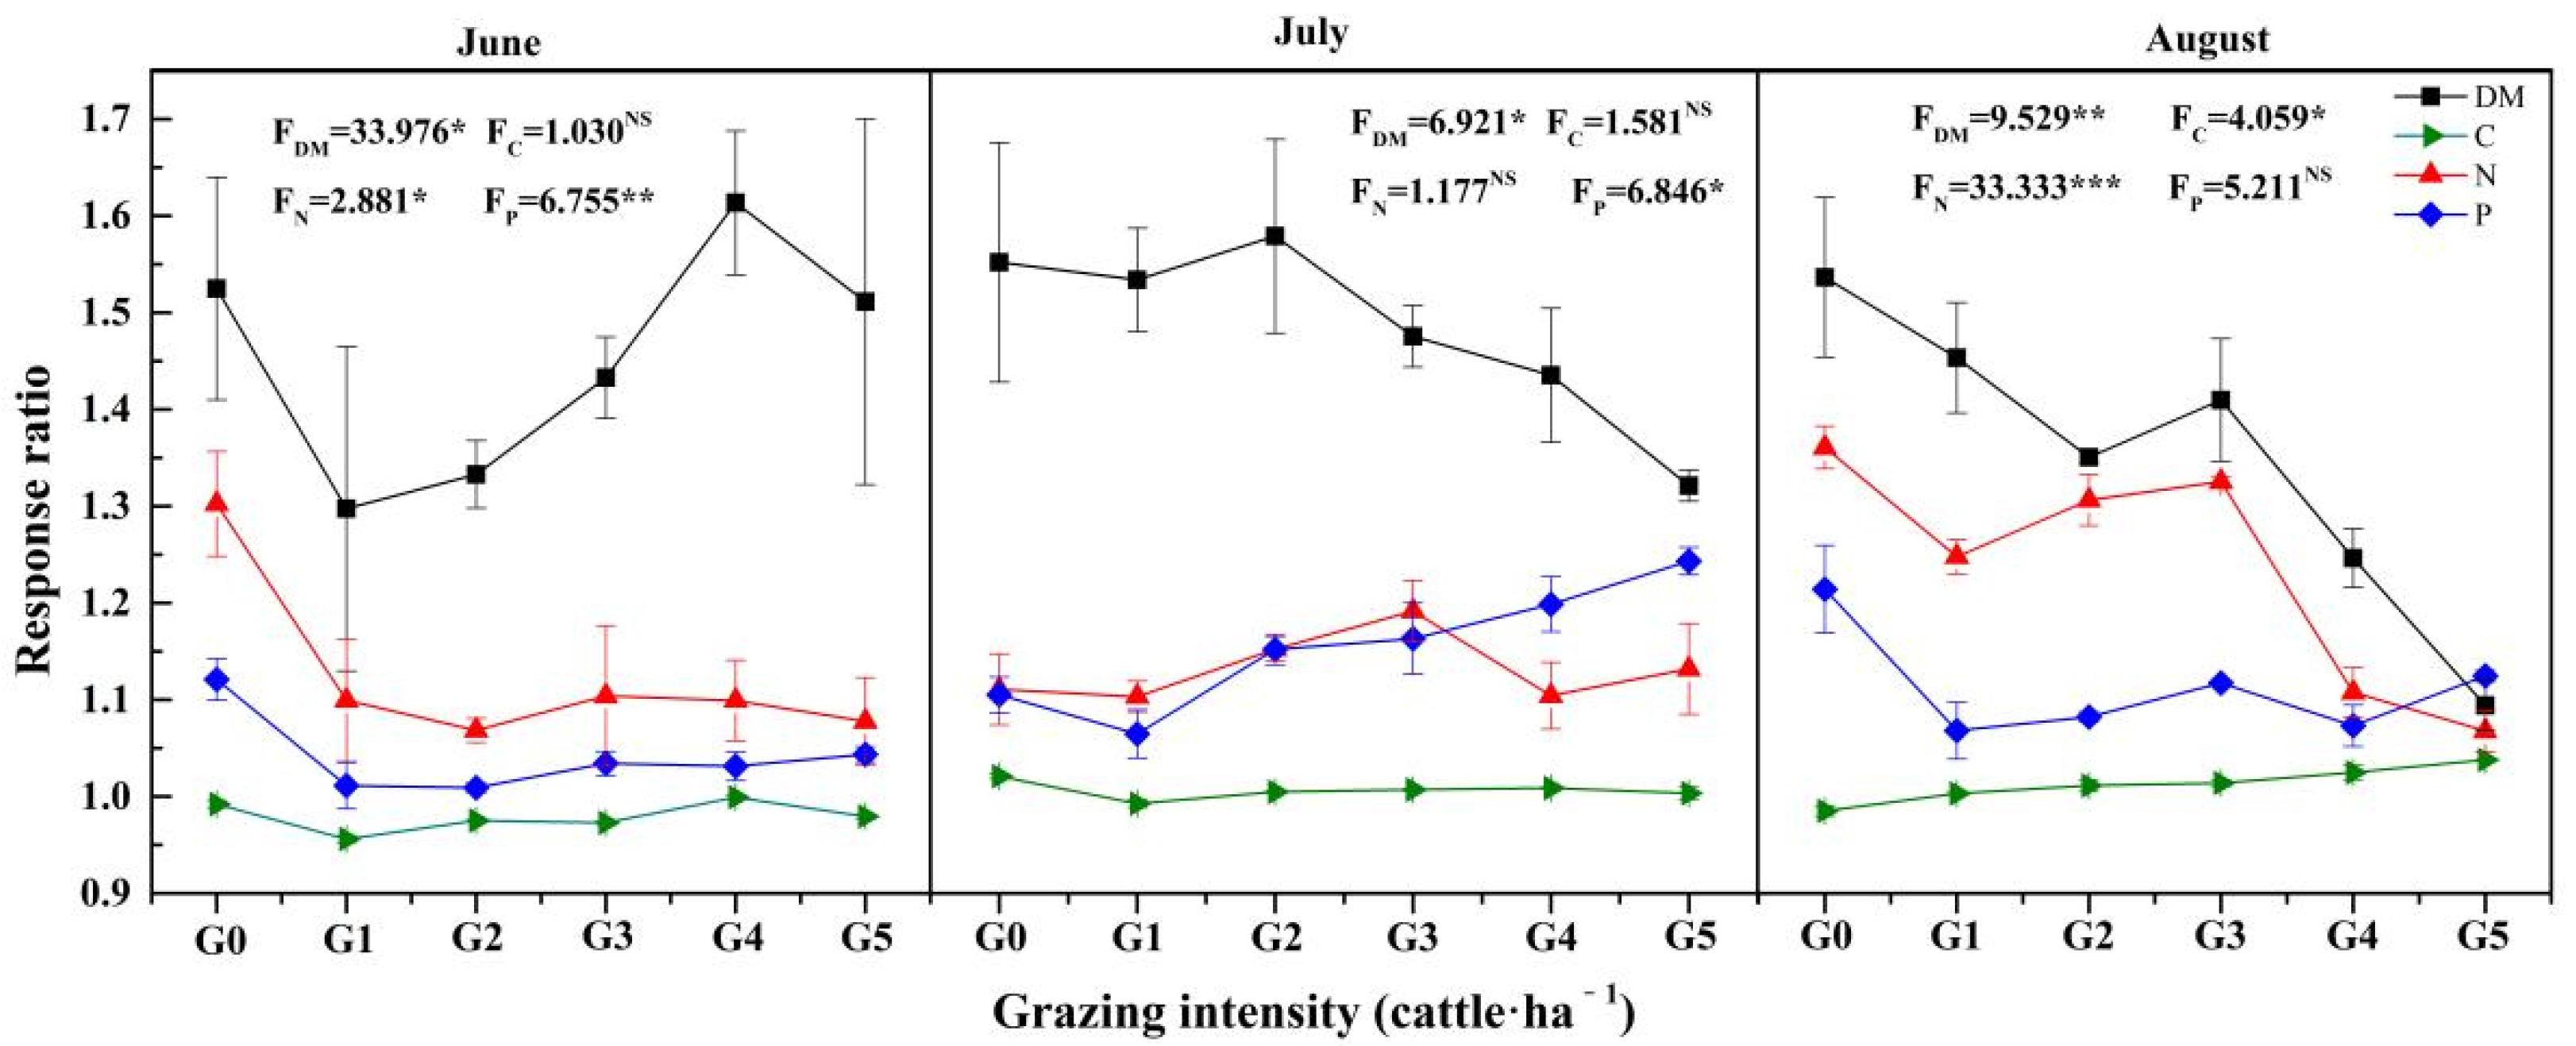
3.4. The Responses Ratios of L. chinensis to Rust

The response ratios of DM fluctuated in June and decreased with the increase of grazing intensity in July and August. The response ratios of N and P were decreased with the increase of grazing intensity in June and August. The response ratio of C was steady under various grazing intensities from June to August (Figure 6).

3.5. The Interactions of Grazing and Rust to L. chinensis

The DM, N, and P content (%), and the C:N and C:P ratios were significantly affected by rust (p < 0.05). The DM, relative growth rate, C, N, and P content (%), and the C:N and C:P ratios were significantly affected by grazing intensities (p < 0.05). All of the measurements were significantly affected by sample date (p < 0.05) and there were only three-way interaction effects of sample date, rust, and grazing intensity on the DM (Table 1).

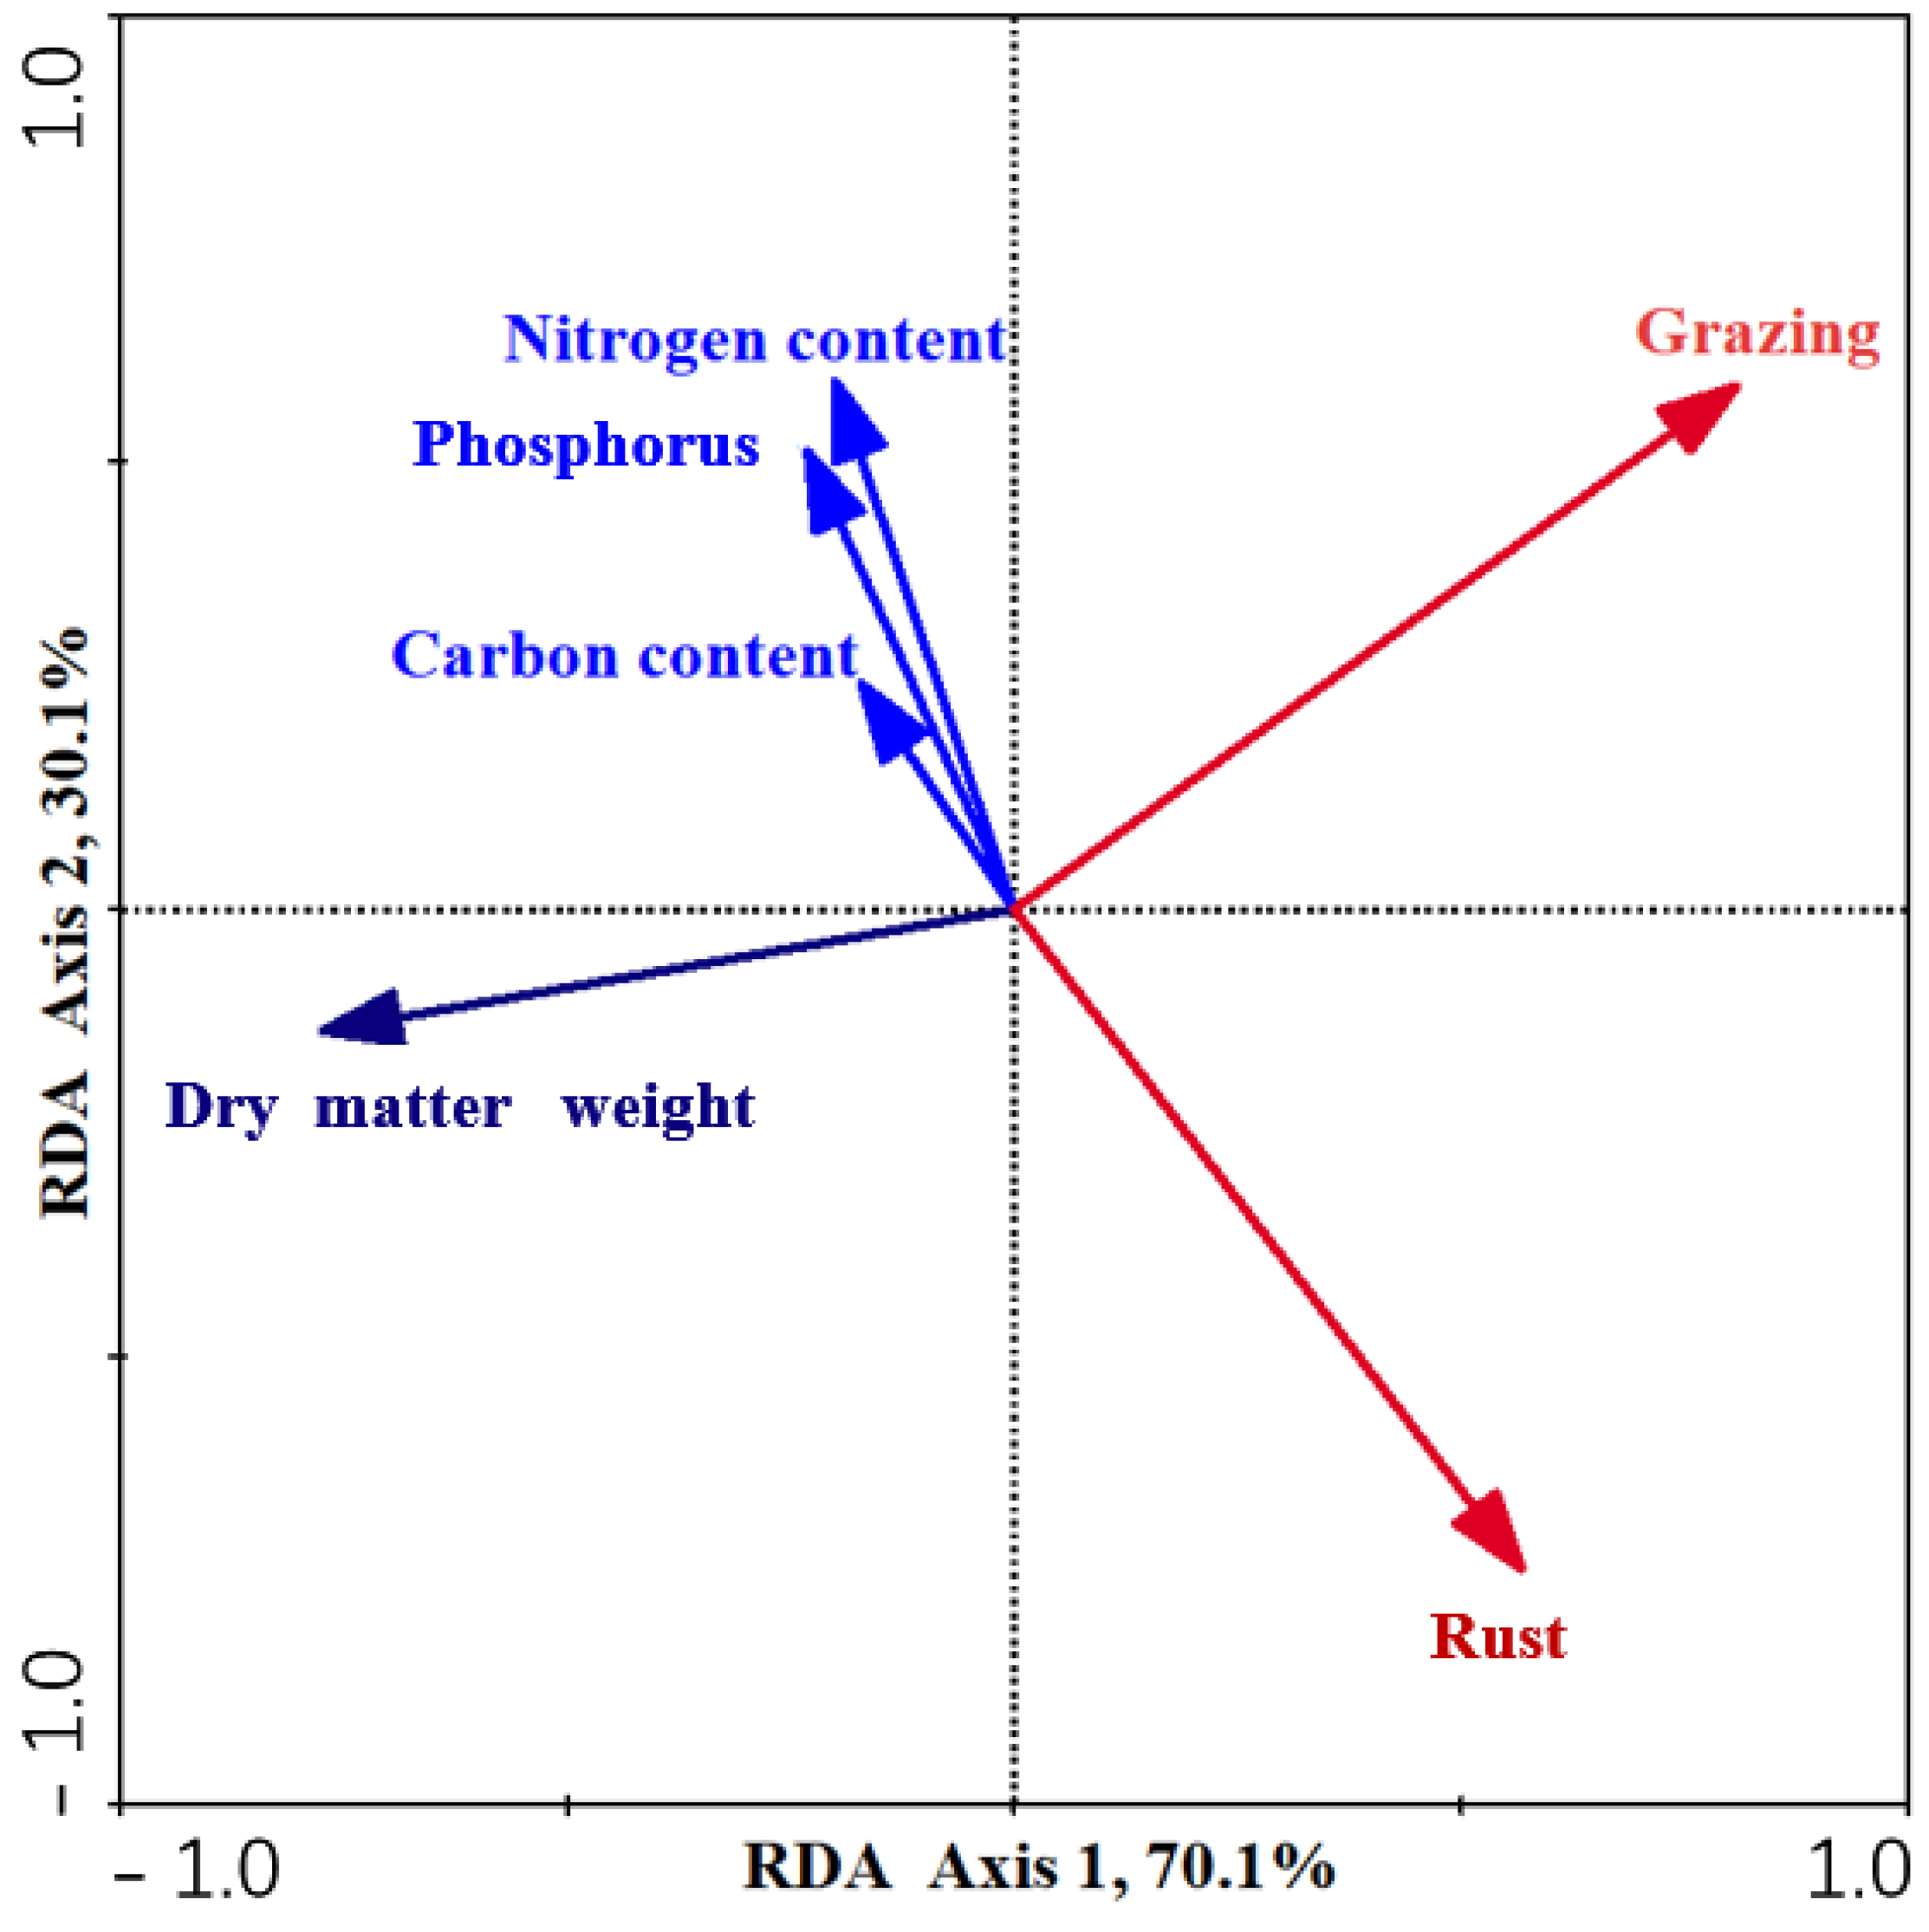
3.6. Factors Influencing DM of L. chinensis

The first axis and second axis of the redundancy analysis (RDA) explained 70.1% and 30.1% of the variance, respectively. The total explained value of grazing intensity and rust to DM and the C, N, and P content (%) was 0.85, and the explained value of grazing intensity was 0.76, while the rust was 0.081. According to RDA, grazing was the most important factor to affect the DM of L. chinensis. The grazing intensity had a negative effect on dry matter, and a negative effect on the N content (%). The rust had a negative effect on the dry matter, and the C, N, and P content (%) (Figure 7).
The structural equation modeling (SEM) analysis revealed that grazing and rust directly altered the N and P content (%), which further influenced the DM of L. chinensis. In contrast, the grazing intensity and rust had no direct influences on the C content. In addition, grazing had a significant (p < 0.05) and direct effect on the DM of L. chinensis and was the most important pathway for determining the dry matter. The rust also notably affected DM directly, but less than grazing (Figure 8).

4. Discussion

The key findings of the present study showed that grazing intensity and rust infection could negatively affect the biomass accumulation and nutrient element content and affect the ecological stoichiometry of L. chinensis. The N:C and P:C ratios were still positively correlated with the relative growth rates of plants. Non-infected L. chinensis had higher N:C and P:C ratios than rust-infected plants, which was consistent with the growth rate hypothesis. Meanwhile, almost all response ratios of DM under various grazing intensities were smaller than that in the G0 treatment. The findings of our study indicated that the growth rate hypothesis, based on ecological stoichiometry, still applied in L. chinensis under the interactive effects of grazing and disease. Additionally, grazing alleviated the loss of DM caused by disease.

4.1. Effects of Grazing on Rust

Grazing could change the relationship between host plants and pathogenic fungi through direct or indirect influence, thereby affecting the occurrence of grassland diseases. According to another of our studies carried out at the same experimental site, pathogen load on plants was directly affected by grazing through ingestion, and indirectly by shifting the plant community structure and the micro-environment [54]. In the case of this study, the incidence of L. chinensis decreased significantly (p < 0.05) with increased grazing intensity. Generally, grazing would increase the population of younger tillers [55], and younger plants are generally more susceptible to disease [56]. This is the opposite of our results, which may be because grazing cattle remove not only infected tissues, but also infectious spores when they selectively graze [22]. Ingestion by cattle under higher grazing intensity treatments (G4 and G5) provided ample space for seedlings and young tillers to grow without being severely restricted by abundant surrounding plants. Additionally, grazing decreased the number of old leaves that contained a high load of rust spores. Increasing numbers of young leaves and seedlings of L. chinensis grew in an environment where there were fewer infectious propagules and a lower pressure imposed by pathogenic plants in this study. Therefore, the young leaves and seedlings are very likely to have a lower incidence of rust infection. This switch from a predominance of old infected leaves to young leaves is likely a main reason why the rust incidence of L. chinensis decreased with increased grazing intensity.
Additionally, the selective ingestion by cattle would also change the species diversity of this grassland. A previous study in this area had verified that the species diversity was increased under the G3 treatment [2]. According to the dilution effect, high plant community diversity could negatively regulate the occurrence of infection [57,58,59]. Thus, the increase of species diversity in grazing treatments may also have resulted in deceased incidence of L. chinensis. This is another potential reason why the incidence of rust is lower in grazing treatments than in non-grazing treatment.

4.2. Effects of Grazing and Disease on DM

The DM of L. chinensis decreased gradually with the increase of grazing intensity, which was consistent with prior research based on the community level of Yan et al. [2] carried out in the same experimental site as the present research, and also similar to most grazing experiments carried out in grasslands in other parts of the world [47,60,61]. However, according to the compensation phenomenon, plants have the ability to compensate for the loss in vegetative biomass or reproductive potential, and to alleviate the detrimental effects of herbivores [62], but the result of the present study is different. This may be because L. chinensis is a constructive species and is the most favored plant species for cattle grazing in the Hulunber grasslands [2]. Compensatory growth, at least above ground, cannot match the rate of ongoing ingestion of this palatable grass by livestock. As a result, the plants even have negative growth in higher grazing intensities (G4 and G5 treatments). However, a previous study [63] in the same experimental plots showed that the below-ground biomass of L. chinensis was the highest in the grazing treatments (G2 and G3) than in the ungrazed treatment, which may also meet predictions of the compensatory phenomenon. In the present study, the DM of rust-infected plants was smaller than the non-infected plants. It is easy to understand that diseases always damage the plant photosynthesis system, further reducing the biomass accumulation and even resulting in plant death [18,21].

4.3. Effects of Grazing and Disease on Relative Growth Rate and Ecological Stoichiometry

Carbon is considered as a relatively stable framework element, thus grazing and disease did not significantly (p > 0.05) affect the C content of L. chinensis, which is consistent with the previous study for the above ground plants in this area [64]. N and P are the most important elements for plant growth and affect plant growth and function [65]. The N content in L. chinensis increased gradually with the increasing of grazing intensity. This may because outcomes of grazing livestock include the introduction of more fresh leaves, plant litter, as well as dung and urine, which promote microbial activity in soil, further increase the soil nutrients available to plants, ultimately changing the content and stoichiometry of the plant community [39,40]. On the other hand, pathogen infection would induce N metabolism and transportation [66,67]. Both N and P are acquired via roots from soil [9]. Transpiration is the main force for N and P absorption. Pathogens produce degrading enzymes to damage leaf tissues, negatively affecting photosynthesis and transpiration [20,46,68], further decreasing the absorption ability of rust-infected plants to N and P from soil. This may be the reasons why N and P content was decreased in rust-infected L. chinensis.
Ecological stoichiometry of living organisms has been important in the understanding of the implications of human disturbance to element cycles [34,69,70]. Previous studies demonstrated that higher N:C and P:C ratios in many heterotrophic organisms were coupled to higher relative growth rates [71,72]. According to our results, the N:C and P:C ratios were significant (p < 0.05) and positively correlated with the relative growth rate of L. chinensis in the six treatments. It was higher in the G1, G2, and G3 grazing treatments than in the G4 and G5 grazing treatments, which is consistent with the growth rate hypothesis [71,72]. Our findings showed that L. chinensis plants under lower grazing intensities had higher growth rates than those under higher grazing intensities. In other words, growth rate hypothesis, based on ecological stoichiometry, still applied in plants under various grazing intensities.
Some of the variation in field measurements of stoichiometric homeostasis was due to parasitism [73]. Therefore, infected hosts will display greater stoichiometric homeostatic variability than non-infected hosts [46]. In our study, the rust also had strong negative impacts on L. chinensis by altering the C, N, and P content (%) as well as the C:N:P stoichiometry. The N:C and P:C ratios of rust-infected plants were higher than those in non-infected plants. This finding confirmed that the stoichiometric ratio would not only reflect the plant growth rate but further reflect the health status of plants.

4.4. Grazing Alleviated the Loss of DM Caused by Disease

Grazing and rust substantially altered the DM and ecological stoichiometry of L. chinensis in the present study. The value of the response ratio could reflect the strength of influence of disease on DM [51]. The larger the value, the greater the impact. Almost all response ratios of DM under various grazing intensities were smaller than that in the G0 treatment, which means grazing alleviated the loss of DM caused by disease. Disease caused the primary loss in production of host plants by damaging the plant photosynthesis system, reducing the content of elements [18,21]. However, grazing increased the content of elements in plants [74]. SEM showed the same result, and this may be one of the potential reasons why grazing could alleviate the loss of DM caused by disease.
Our study provides a stoichiometric approach to understanding the interaction between grass and fungal disease under various grazing intensities, which provides new knowledge linking variation in host and livestock to patterns in the emergence and distribution of fungal pathogens and provides better understanding and prediction of grazing-diseases interactions.

Author Contributions

Conceptualization, Y.Z., Z.N. and X.X.; methodology, Y.Z. and X.X.; software, Y.Z. and N.Z.; formal analysis, Y.Z.; investigation, Y.Z. and X.X.; data curation, Y.Z. and X.X.; writing—original draft preparation, Y.Z. and N.Z.; writing—review and editing, Y.Z., Z.N. and M.J.C.; visualization, Y.Z. and N.Z.; supervision, Z.N.; project administration, Z.N.; funding acquisition, Z.N. and Y.Z. All authors have read and agreed to the published version of the manuscript.

Funding

This research was financially supported by the National Public Welfare Industry of Agricultural Science and Technology Special Projects (201303057) and the Fundamental Research Funds for the Central Universities (561221001).

Institutional Review Board Statement

Not available.

Informed Consent Statement

Not available.

Data Availability Statement

Not available.

Conflicts of Interest

The authors declare no conflict of interest.

Appendix A

Figure A1. Sketch map of the experimental site.
Agriculture 12 00961 g0a1

References

  1. Wang, D.; Wu, G.; Zhu, Y.; Shi, Z. Grazing exclusion effects on above- and below-ground C and N pools of typical grassland on the Loess Plateau (China). Catena 2014, 123, 113–120. [Google Scholar] [CrossRef]
  2. Yan, R.; Xin, X.; Yan, Y.; Wang, X.; Zhang, B.; Yang, G.; Liu, S.; Deng, Y.; Li, L. Impacts of differing grazing rates on canopy structure and species composition in Hulunber Meadow Steppe. Rangel. Ecol. Manag. 2015, 68, 54–64. [Google Scholar] [CrossRef]
  3. Hou, F.J.; Yang, Z.Y. Effects of grazing of livestock on grassland. Acta Ecol. Sin. 2006, 26, 244–264. [Google Scholar]
  4. Xun, W.; Yan, R.; Ren, Y.; Jin, D.; Xiong, W.; Zhang, G.; Cui, Z.; Xin, X.; Zhang, R. Grazing-induced microbiome alterations drive soil organic carbon turnover and productivity in meadow steppe. Microbiome 2018, 6, 170. [Google Scholar] [CrossRef] [PubMed] [Green Version]
  5. Yan, R.R.; Tang, H.J.; Lv, S.H.; Jin, D.Y.; Xin, X.P.; Chen, B.R.; Zhang, B.H.; Yan, Y.C.; Wang, X.; Murray, P.J.; et al. Response of ecosystem CO2 fluxes to grazing intensities-a five-year experiment in the Hulunber meadow steppe of China. Sci. Rep. 2017, 7, 9491. [Google Scholar] [CrossRef] [PubMed] [Green Version]
  6. Hu, X.W.; Huang, X.H.; Wang, Y.R. Hormonal and temperature regulation of seed dormancy and germination in Leymus chinensis. Plant Growth Regul. 2012, 67, 199–207. [Google Scholar] [CrossRef]
  7. Reeder, J.D.; Schuman, G.E.; Morgan, J.A.; Lecain, D.R. Response of organic and inorganic carbon and nitrogen to long-term Grazing of the shortgrass steppe. Environ. Manag. 2004, 33, 485–495. [Google Scholar] [CrossRef]
  8. Estes, J.A.; Terborgh, J.; Brashares, J.S.; Power, M.E.; Berger, J.; Bond, W.J.; Carpenter, S.R.; Essington, T.E.; Holt, R.D.; Wardle, D.A. Trophic downgrading of planet earth. Science 2011, 6040, 301–306. [Google Scholar] [CrossRef] [Green Version]
  9. Bai, Y.; Wu, J.; Clark, C.M.; Pan, Q.; Zhang, L.; Chen, S.; Wang, Q.; Han, X. Grazing alters ecosystem functioning and C:N:P stoichiometry of grasslands along a regional precipitation gradient. J. Appl. Ecol. 2012, 49, 1204–1215. [Google Scholar] [CrossRef]
  10. Sitters, J.; Bakker, E.S.; Veldhuis, M.P.; Veen, G.F.; Olde Venterink, H.; Vanni, M.J. The Stoichiometry of Nutrient Release by Terrestrial Herbivores and Its Ecosystem Consequences. Front. Earth Sci. 2017, 5, 32. [Google Scholar] [CrossRef] [Green Version]
  11. Sitters, J.; Cherif, M.; Egelkraut, D.; Giesler, R.; Olofsson, J. Long-term heavy reindeer grazing promotes plant phosphorus limitation in arctic tundra. Funct. Ecol. 2019, 33, 1233–1242. [Google Scholar] [CrossRef]
  12. Sasaki, T.; Okayasu, T.; Jamsran, U.; Takeuchi, K. Threshold changes in vegetation along a grazing gradient in Mongolian rangelands. J. Ecol. 2007, 96, 145–154. [Google Scholar] [CrossRef]
  13. Hilker, T.; Natsagdorj, E.; Waring, R.H.; Lyapustin, A.; Wang, Y. Satellite observed widespread decline in Mongolian grasslands largely due to overgrazing. Glob. Change Biol. 2014, 20, 418–428. [Google Scholar] [CrossRef] [PubMed] [Green Version]
  14. Eldridge, D.J.; Delgado-Baquerizo, M. Continental-scale impacts of livestock grazing on ecosystem supporting and regulating services. Land Degrad. Dev. 2016, 28, 1473–1481. [Google Scholar] [CrossRef]
  15. Lu, X.; Kelsey, K.C.; Yan, Y.; Sun, J.; Wang, X.; Cheng, G.; Neff, J.C. Effects of grazing on ecosystem structure and function of alpine grasslands in Qinghai- Tibetan Plateau: A synthesis. Ecosphere 2017, 8, e1656. [Google Scholar] [CrossRef]
  16. Zhang, Y.; Chen, T.; Nan, Z.; Christensen, M.J. Cattle grazing alters the interaction of seed-borne fungi and two foliar pathogens of Leymus chinensis in a meadow steppe. Eur. J. Plant Pathol. 2019, 155, 207–218. [Google Scholar] [CrossRef]
  17. Nan, Z.B.; Li, C.J.; Wang, Y.W.; Wang, Y.R. Lucerne common leaf spot forage quality, photosynthesis rate and field resistance. Acta Prataculturae Sin. 2001, 10, 26–34. [Google Scholar]
  18. Fisher, M.C.; Henk, D.A.; Briggs, C.J.; Brownstein, J.S.; Madoff, L.C.; Mccraw, S.L.; Gurr, S.J. Emerging fungal threats to animal, plant and ecosystem health. Nature 2012, 484, 186–194. [Google Scholar] [CrossRef]
  19. Liu, X.; Ma, Z.; Cadotte, M.W.; Chen, F.; He, J.; Zhou, S. Warming affects foliar fungal diseases more than precipitation in a Tibetan alpine meadow. New Phytol. 2019, 221, 1574–1584. [Google Scholar] [CrossRef] [Green Version]
  20. Ding, T.T.; Wang, X.Y.; Duan, T.Y. Effect of disease on photosynthesis, nutrition, and nodulation of leguminous forage. Pratacultural Sci. 2019, 36, 152–160. [Google Scholar]
  21. Nan, Z.B.; Li, C.J. Forage and turfgrass disease in China and their control. In Forage and Turfgrass Pathological Research in China; Nan, Z.B., Li, C.J., Eds.; Ocean Press: Beijing, China, 2003; pp. 3–10. [Google Scholar]
  22. Gray, F.A.; Koch, D.W. Influence of late season harvesting, fall grazing, and fungicide treatment on Verticillium Wilt incidence, plant density, and forage yield of alfalfa. Plant Dis. 2004, 88, 811–816. [Google Scholar] [CrossRef] [PubMed] [Green Version]
  23. Aalto, S.L.; Decaestecker, E.; Pulkkinen, K. A three-way perspective of stoichiometric changes on host–parasite interactions. Trends Parasitol. 2015, 31, 333–340. [Google Scholar] [CrossRef] [PubMed]
  24. Chen, T.; Zhang, Y.W.; Christensen, M.; Li, C.H.; Hou, F.J.; Nan, Z.B. Grazing intensity affects communities of culturable root-associated fungi in a semiarid grassland of northwest China. Land Degrad. Dev. 2017, 29, 361–373. [Google Scholar] [CrossRef]
  25. Wennström, A.; Ericson, L. Variation in disease incidence in grazed and ungrazed sites for the system Pulsatilla pratensis-Puccinia pulsatillae. Oikos 1991, 60, 35–39. [Google Scholar] [CrossRef]
  26. Lu, X.; Nan, Z.B. Perspectives in effects of grazing on diversity of grassland plant community and forage diseases. Pratacultural Sci. 2015, 32, 1423–1431. [Google Scholar]
  27. Liu, X.; Lyu, S.; Zhou, S.; Bradshaw, C.J.A. Warming and fertilization alter the dilution effect of host diversity on disease severity. Ecology 2016, 97, 1680–1689. [Google Scholar] [CrossRef] [Green Version]
  28. Chen, T.; Nan, Z.; Kardol, P.; Duan, T.; Song, H.; Wang, J.; Li, C.; Hou, F. Effects of interspecific competition on plant-soil feedbacks generated by long-term grazing. Soil Biol. Biochem. 2018, 126, 133–143. [Google Scholar] [CrossRef]
  29. Knops, J.M.H.; Tilman, D.; Haddad, N.M.; Naeem, S.; Mitchell, C.E.; Haarstad, J.; Ritchie, M.E.; Howe, K.M.; Reich, P.B.; Siemann, E.; et al. Effects of plant species richness on invasion dynamics, disease outbreaks, insect abundances and diversity. Ecol. Lett. 2002, 2, 286–293. [Google Scholar] [CrossRef]
  30. Keesing, F.; Holt, R.D.; Ostfeld, R.S. Effects of species diversity on disease risk. Ecol. Lett. 2006, 9, 485–498. [Google Scholar] [CrossRef]
  31. Keesing, F.; Belden, L.K.; Daszak, P.; Dobson, A.; Harvell, C.D.; Holt, R.D.; Hudson, P.; Jolles, A.; Jones, K.E.; Mitchell, C.E.; et al. Impacts of biodiversity on the emergence and transmission of infectious diseases. Nature 2010, 468, 647–652. [Google Scholar] [CrossRef]
  32. Rottstock, T.; Joshi, J.; Kummer, V.; Fischer, M. Higher plant diversity promotes higher diversity of fungal pathogens, while it decreases pathogen infection per plant. Ecology 2014, 95, 1907–1917. [Google Scholar] [CrossRef] [PubMed] [Green Version]
  33. Bever, J.D.; Mangan, S.A.; Alexander, H.M. Maintenance of plant species diversity by pathogens. Annu. Rev. Ecol. Evol. 2015, 46, 305–325. [Google Scholar] [CrossRef]
  34. Sterner, R.W.; Elser, J.J. Ecological Stoichiometry: The Biology of Elements from Molecular to the Biosphere; Princeton University Press: Princeton, NJ, USA, 2002. [Google Scholar]
  35. Hessen, D.O.; Jensen, T.C.; Kyle, M.; Elser, J.J. RNA responses to N-and P-limitation; reciprocal regulation of stoichiometry and growth rate in Brachionus. Funct. Ecol. 2007, 21, 956–962. [Google Scholar] [CrossRef]
  36. Allen, A.P.; Gillooly, J.F. Towards an integration of ecological stoichiometry and the metabolic theory of ecology to better understand nutrient cycling. Ecol. Lett. 2009, 12, 369–384. [Google Scholar] [CrossRef]
  37. Van der Wal, R.; Brooker, R.W. Mosses mediate grazer impacts on grass abundance in Arctic. Funct. Ecol. 2004, 18, 77–86. [Google Scholar] [CrossRef]
  38. Bardgett, R.D.; Wardle, D.A. Herbivore-mediated linkages between aboveground and belowground communities. Ecology 2003, 84, 2258–2268. [Google Scholar] [CrossRef]
  39. Holland, J.N.; Cheng, W.; Crossley, D.A. Herbivore-induced changes in plant carbon allocation: Assessment of below-ground C fluxes using carbon-14. Oecologia 1996, 107, 87–94. [Google Scholar] [CrossRef] [Green Version]
  40. Hamilton, W.E.; Frank, D.A. Can plants stimulate soil microbes and their own nutrient supply? Evidence from a grazing tolerant grass. Ecology 2001, 82, 2397–2402. [Google Scholar] [CrossRef]
  41. Hobbie, S.E. Effects of plant species on nutrient cycling. Trends Ecol. Evol. 1992, 7, 336–339. [Google Scholar] [CrossRef]
  42. Ritchie, M.E.; Tilman, D.; Knops, J.M.H. Herbivore effects on plant and nitrogen dynamics in Oak Savanna. Ecology 1998, 79, 165–177. [Google Scholar] [CrossRef]
  43. Elser, J.J.; Dobberfuhl, D.R.; Mackay, N.A.; Schampel, J.H. Organism size, life history, and N:P stoichiometry. Bioscience 1996, 46, 674–684. [Google Scholar] [CrossRef] [Green Version]
  44. Jensen, B.; Munk, L. Nitrogen-induced changes in colony density and spore production of Erysiphe graminis f.sp. hordei on seedlings of six spring barley cultivars. Plant Pathol. 1997, 46, 191–202. [Google Scholar] [CrossRef]
  45. Frenken, T.; Wierenga, J.; Gsell, A.S.; van Donk, E.; Rohrlack, T.; Van de Waal, D.B. Changes in N:P supply ratios affect the ecological stoichiometry of a toxic Cyanobacterium and its fungal parasite. Front. Microbiol. 2017, 8, 1015. [Google Scholar] [CrossRef] [PubMed] [Green Version]
  46. Sanders, A.J.; Taylor, B.W. Using ecological stoichiometry to understand and predict infectious diseases. Oikos 2018, 127, 1399–1409. [Google Scholar] [CrossRef]
  47. Daleo, P.; Silliman, B.; Alberti, J.; Escapa, M.; Canepuccia, A.; Peña, N.; Iribarne, O. Grazer facilitation of fungal infection and the control of plant growth in south-western Atlantic salt marshes. J. Ecol. 2009, 97, 781–787. [Google Scholar] [CrossRef]
  48. Li, Y.Z.; Nan, Z.B. The Methods of Diagnose, Investigation and Loss Evaluation for Forage Diseases; Phenix Press: Nanjing, China, 2015. [Google Scholar]
  49. Wang, Q.; Li, F.; Zhao, L.; Zhang, E.; Shi, S.; Zhao, W.; Song, W.; Vance, M.M. Effects of irrigation and nitrogen application rates on nitrate nitrogen distribution and fertilizer nitrogen loss, wheat yield and nitrogen uptake on a recently reclaimed sandy farmland. Plant Soil 2010, 337, 325–339. [Google Scholar] [CrossRef]
  50. Nelson, D.W.; Sommers, L.E. Total carbon, organic carbon, and organic matter. In Methods of Soil Analysis; Miller, R.H., Keeney, D.R., Eds.; American Society of Agronomy and Soil Science Society of American: Madison, WI, USA, 1982; pp. 1–129. [Google Scholar]
  51. Lajeunesse, M.J. On the meta-analysis of response ratios for studies with correlated and multi-group designs. Ecology 2011, 92, 2049–2055. [Google Scholar] [CrossRef]
  52. Lepš, J.; Petr, Š. Multivariate Analysis of Ecological Data Using CANOCO; Cambridge University Press: Cambridge, UK, 2003. [Google Scholar]
  53. Li, Z.; Wang, X.; Wang, D.L. First report of rust disease caused by Puccinia elymi on Leymus chinensis in China. Plant Pathol. 2008, 57, 376. [Google Scholar] [CrossRef]
  54. Zhang, Y.; Nan, Z.; Xin, X. Response of plant fungal diseases to beef cattle grazing intensity in Hulunber grassland. Plant Dis. 2020, 104, 2905–2913. [Google Scholar] [CrossRef]
  55. Silva, L.S.; Silva, V.J.; Yasuoka, J.I.; Sollenberger, L.E.; Pedreira, C.G.S. Tillering dynamics of ‘Mulato II’ brachiariagrass under continuous stocking. Crop Sci. 2020, 60, 1105–1112. [Google Scholar] [CrossRef]
  56. Develey-Rivière, M.P.; Galiana, E. Resistance to pathogens and host developmental stage: A multifaceted relationship within the plant kingdom. New Phytol. 2007, 175, 405–416. [Google Scholar] [CrossRef] [PubMed]
  57. Dobson, A. Population dynamics of pathogens with multiple host species. Am. Nat. 2004, 164, S64–S78. [Google Scholar] [CrossRef] [PubMed]
  58. Ostfeld, R.S.; Keesing, F. Effects of host diversity on infectious disease. Annu. Rev. Ecol. Evol. 2012, 43, 157–182. [Google Scholar] [CrossRef]
  59. Rudolf, V.H.W.; Antonovics, J. Species coexistence and pathogens with frequency-dependent transmission. Am. Nat. 2005, 166, 112–118. [Google Scholar] [CrossRef] [PubMed] [Green Version]
  60. Yates, C.J.; Norton, D.A.; Hobbs, R.J. Grazing effects on plant cover, soil and microclimate in fragmented woodlands in south-western Australia: Implications for restoration. Austral Ecol. 2000, 25, 36–47. [Google Scholar] [CrossRef]
  61. Altesor, A.; Oesterheld, M.; Leoni, E.; Lezama, F.; Rodríguez, C. Effect of grazing on community structure and productivity of a Uruguayan grassland. Plant Ecol. 2005, 179, 83–91. [Google Scholar] [CrossRef]
  62. Gao, Y.; Wang, D.; Ba, L.; Bai, Y.; Liu, B. Interactions between herbivory and resource availability on grazing tolerance of Leymus chinensis. Environ. Exp. Bot. 2008, 63, 113–122. [Google Scholar] [CrossRef]
  63. Yan, R.R.; Tang, H.J.; Xin, X.P.; Chen, B.R.; Murray, P.J.; Yan, Y.C.; Wang, X.; Yang, G.X. Grazing intensity and driving factors affect soil nitrous oxide fluxes during the growing seasons in the Hulunber meadow steppe of China. Environ. Res. Lett. 2016, 11, 54004. [Google Scholar] [CrossRef] [Green Version]
  64. Cao, J.; Yan, R.; Chen, X.; Wang, X.; Yu, Q.; Zhang, Y.; Ning, C.; Hou, L.; Zhang, Y.; Xin, X. Grazing affects the ecological stoichiometry of the plant–soil–microbe system on the Hulunber Steppe, China. Sustainability 2019, 11, 5226. [Google Scholar] [CrossRef] [Green Version]
  65. McDonald, A.; Davies, W.J. Keeping in touch: Responses of the whole plant to deficits. Adv. Bot. Res. 1996, 22, 229. [Google Scholar]
  66. Loper, G.M.; Hanson, C.H.; Graham, J.H. Coumestrol content of alfalfa as affected by selection for resistance to foliar disease. Crop Sci. 1967, 7, 189–192. [Google Scholar] [CrossRef]
  67. Bernot, R.J. Parasite-host elemental content and the effects of a parasite on host-consumer-driven nutrient recycling. Freshw. Sci. 2013, 32, 299–308. [Google Scholar] [CrossRef]
  68. Jin, Q.; Zhou, G.Y.; Liu, J.A.; He, W.H. The role of cell wall degrading enzymes in the pathogenic process of Camellia oleifera disease caused by Colletotrichum gloeosporioides. Plant Prot. 2016, 43, 97–102. [Google Scholar]
  69. Ågren, G.I. The C: N: P stoichiometry of autotrophs-theory and observations. Ecol. Lett. 2004, 7, 185–191. [Google Scholar] [CrossRef]
  70. Hessen, D.O.; Ågren, G.I.; Anderson, T.R.; Elser, J.J.; de Ruiter, P. Carbon sequestration in ecosystems: The role of stoichiometry. Ecology 2004, 85, 1179–1192. [Google Scholar] [CrossRef]
  71. Elser, J.J.; Acharya, K.; Kyle, M.; Cotner, J.; Makino, W.; Markow, T.; Watts, T.; Hobbie, S.; Fagan, W.; Schade, J.; et al. Growth rate-stoichiometry couplings in diverse biota. Ecol. Lett. 2003, 6, 936–943. [Google Scholar] [CrossRef] [Green Version]
  72. Makino, W.; Cotner, J.B.; Sterner, R.W.; Elser, J.J. Are bacteria more like plants or animals Growth rate and resource dependence of bacterial C: N: P stoichiometry. Funct. Ecol. 2003, 17, 121–130. [Google Scholar] [CrossRef] [Green Version]
  73. Halvorson, H.M.; Small, G.E. Observational field studies are not appropriate tests of consumer stoichiometric homeostasis. Freshw. Sci. 2016, 35, 1103–1116. [Google Scholar] [CrossRef]
  74. Zhang, T.; Weng, Y.; Yao, F.J.; Shi, Y.T.; Cui, G.W.; Hu, G.F. Effect of grazing intensity on ecological stoichiometry of Deyeuxia angustifolia and meadow soil. Acta Prataculturae Sin. 2014, 23, 20–28. [Google Scholar]
Figure 1. Rust (Puccinia elymi) incidence of Leymus chinensis under different grazing intensities from June to August based on the 2-year (2015 and 2016) average. Grazing intensities (0, 0.42, 0.63, 0.83, 1.25, and 1.67 cattle ha−1) are indicated by different colors. The presented data are the mean of three replicates and the bars indicate standard errors.
Agriculture 12 00961 g001
Figure 2. Influence of grazing intensity on the dry matter (a) and relative growth rate (b) of non-infected and rust-infected Leymus chinensis from June to August based on the 2-year (2015 and 2016) average (error bars denote standard errors). Different lower-case and upper-case indicate significant differences among grazing intensities, respectively. The asterisk (*) indicates significant differences between non-infected and rust-infected plants (***, p < 0.001; **, p < 0.01; *, p < 0.05; NS, p > 0.05).
Agriculture 12 00961 g002
Figure 3. Influence of grazing intensity on the carbon (a), nitrogen (b) and phosphorus contents (%) (c) of non-infected and rust-infected Leymus chinensis from June to August based on the 2-year (2015 and 2016) average (error bars denote standard errors). Different lower-case and upper-case indicate significant differences among grazing intensities. The asterisk (*) indicates significant differences between non-infected and rust-infected plants (***, p < 0.001; **, p < 0.01; *, p < 0.05; NS, p > 0.05).
Agriculture 12 00961 g003
Figure 4. Influence of grazing intensity on the C:N (a), C:P (b), and N:P (c) ratios of non-infected and rust-infected Leymus chinensis from June to August based on the 2-year (2015 and 2016) average (error bars denote standard errors). Different lower-case and upper-case indicate significant differences among grazing intensities. The asterisk (*) indicates significant differences between non-infected and rust-infected plants (***, p < 0.001; **, p < 0.01; *, p < 0.05; NS, p > 0.05).
Agriculture 12 00961 g004
Figure 5. The relationship between relative growth rate and C:N:P stoichiometry of Leymus chinensis (non-infected and rust-infected plants) under different grazing intensities. Grazing intensities (0, 0.42, 0.63, 0.83, 1.25, and 1.67 cattle ha−1) are indicated by different colors.
Agriculture 12 00961 g005
Figure 6. The differences of dry matter (DM), carbon (C), nitrogen (N), and phosphorus (P) contents response ratios between non-infected and rust-infected Leymus chinensis under different grazing intensities. Significant differences among grazing intensities are reported from ANOVA as ***, p < 0.001; **, p < 0.01; *, p < 0.05; NS, p > 0.05 and F-values (F) are given.
Agriculture 12 00961 g006
Figure 7. Redundancy analysis (RDA) of the effects of grazing and rust on dry matter, carbon, nitrogen, and phosphorus contents (%) of Leymus chinensis, showing the correlational relationships among grazing intensities (0, 0.42, 0.63, 0.83, 1.25, and 1.67 cattle ha−1), disease (rust), dry matter of L. chinensis, and the content of elements (C, N, and P). Direction of arrow indicates the correlation between the parameters, and the length of the arrow indicates the magnitude of the association.
Agriculture 12 00961 g007
Figure 8. Final results of structural equation modeling (SEM) analysis for the effects of grazing and rust on the dry matter of Leymus chinensis in 2015 and 2016. Red arrows, evidence for positive relationships; blue arrows, evidence for negative relationships; gray arrows, insufficient statistical evidence for path coefficients (p > 0.05). Width of the arrows shows the strength of the causal relationship, and the number adjacent to arrows are standardized path coefficients, which reflect the effect size of the relationship; asterisks indicate statistical significance (***, p < 0.001; **, p < 0.01; *, p < 0.05). The proportion of variance explained (R2) appears alongside each response variable in the model. The final model adequately fitted the data: χ2 = 249.059, Df = 4, P = 0.104, GFI = 0.955.
Agriculture 12 00961 g008
Table 1. General linear mixed-effects model results for the effects of sample date (SD), grazing intensity (GI), and rust (RU) on dry matter (DM g·tiller−1), relative growth rate (RW g g−1·day−1), carbon, nitrogen, and phosphorus contents (%), and C: N: P stoichiometry of Leymus chinensis. F-values (F) and p-values (p) are given. Significant p-values (p < 0.05) in bold.
SourcedfDMRWCarbonNitrogenPhosphorusC:NC:PN:P
FpFpFpFpFpFpFpFp
SD55.520.01541.730.02331.070.031126.570.00817.890.05340.500.02428.610.03427.430.035
RU16.710.0453.110.2510.170.71824.710.0256.380.1115.050.1387.600.1330.750.449
GI524.540.00261.78<0.0014.410.06535.410.00115.540.00515.330.00532.330.0013.600.093
SD × RU48.350.0077.150.0125.500.0243.930.05512.640.00217.720.0016.780.01410.740.043
SD × GI253.820.02310.76<0.0014.210.0167.400.02010.110.0017.610.0026.620.0031.900.164
RU × GI56.520.0060.240.9361.020.4571.560.2582.010.1622.230.1320.460.8004.150.027
SD × RU × GI203.050.0010.710.7140.530.8650.101.0000.530.8670.101.0000.820.6120.111.000
Publisher’s Note: MDPI stays neutral with regard to jurisdictional claims in published maps and institutional affiliations.

