
Effect of Maize (Zeal mays) and Soybean (Glycine max) Intercropping on Yield and Root Development in Xinjiang, China


Abstract
:1. Introduction
- (i)
- Which planting mode is advantageous for root growth of crop in this area?
- (ii)
- Which planting mode of intercropping or sole-cropping provide better yield advantages?
2. Materials and Methods
2.1. Experimental Site
2.2. Plant Materials and Experimental Design
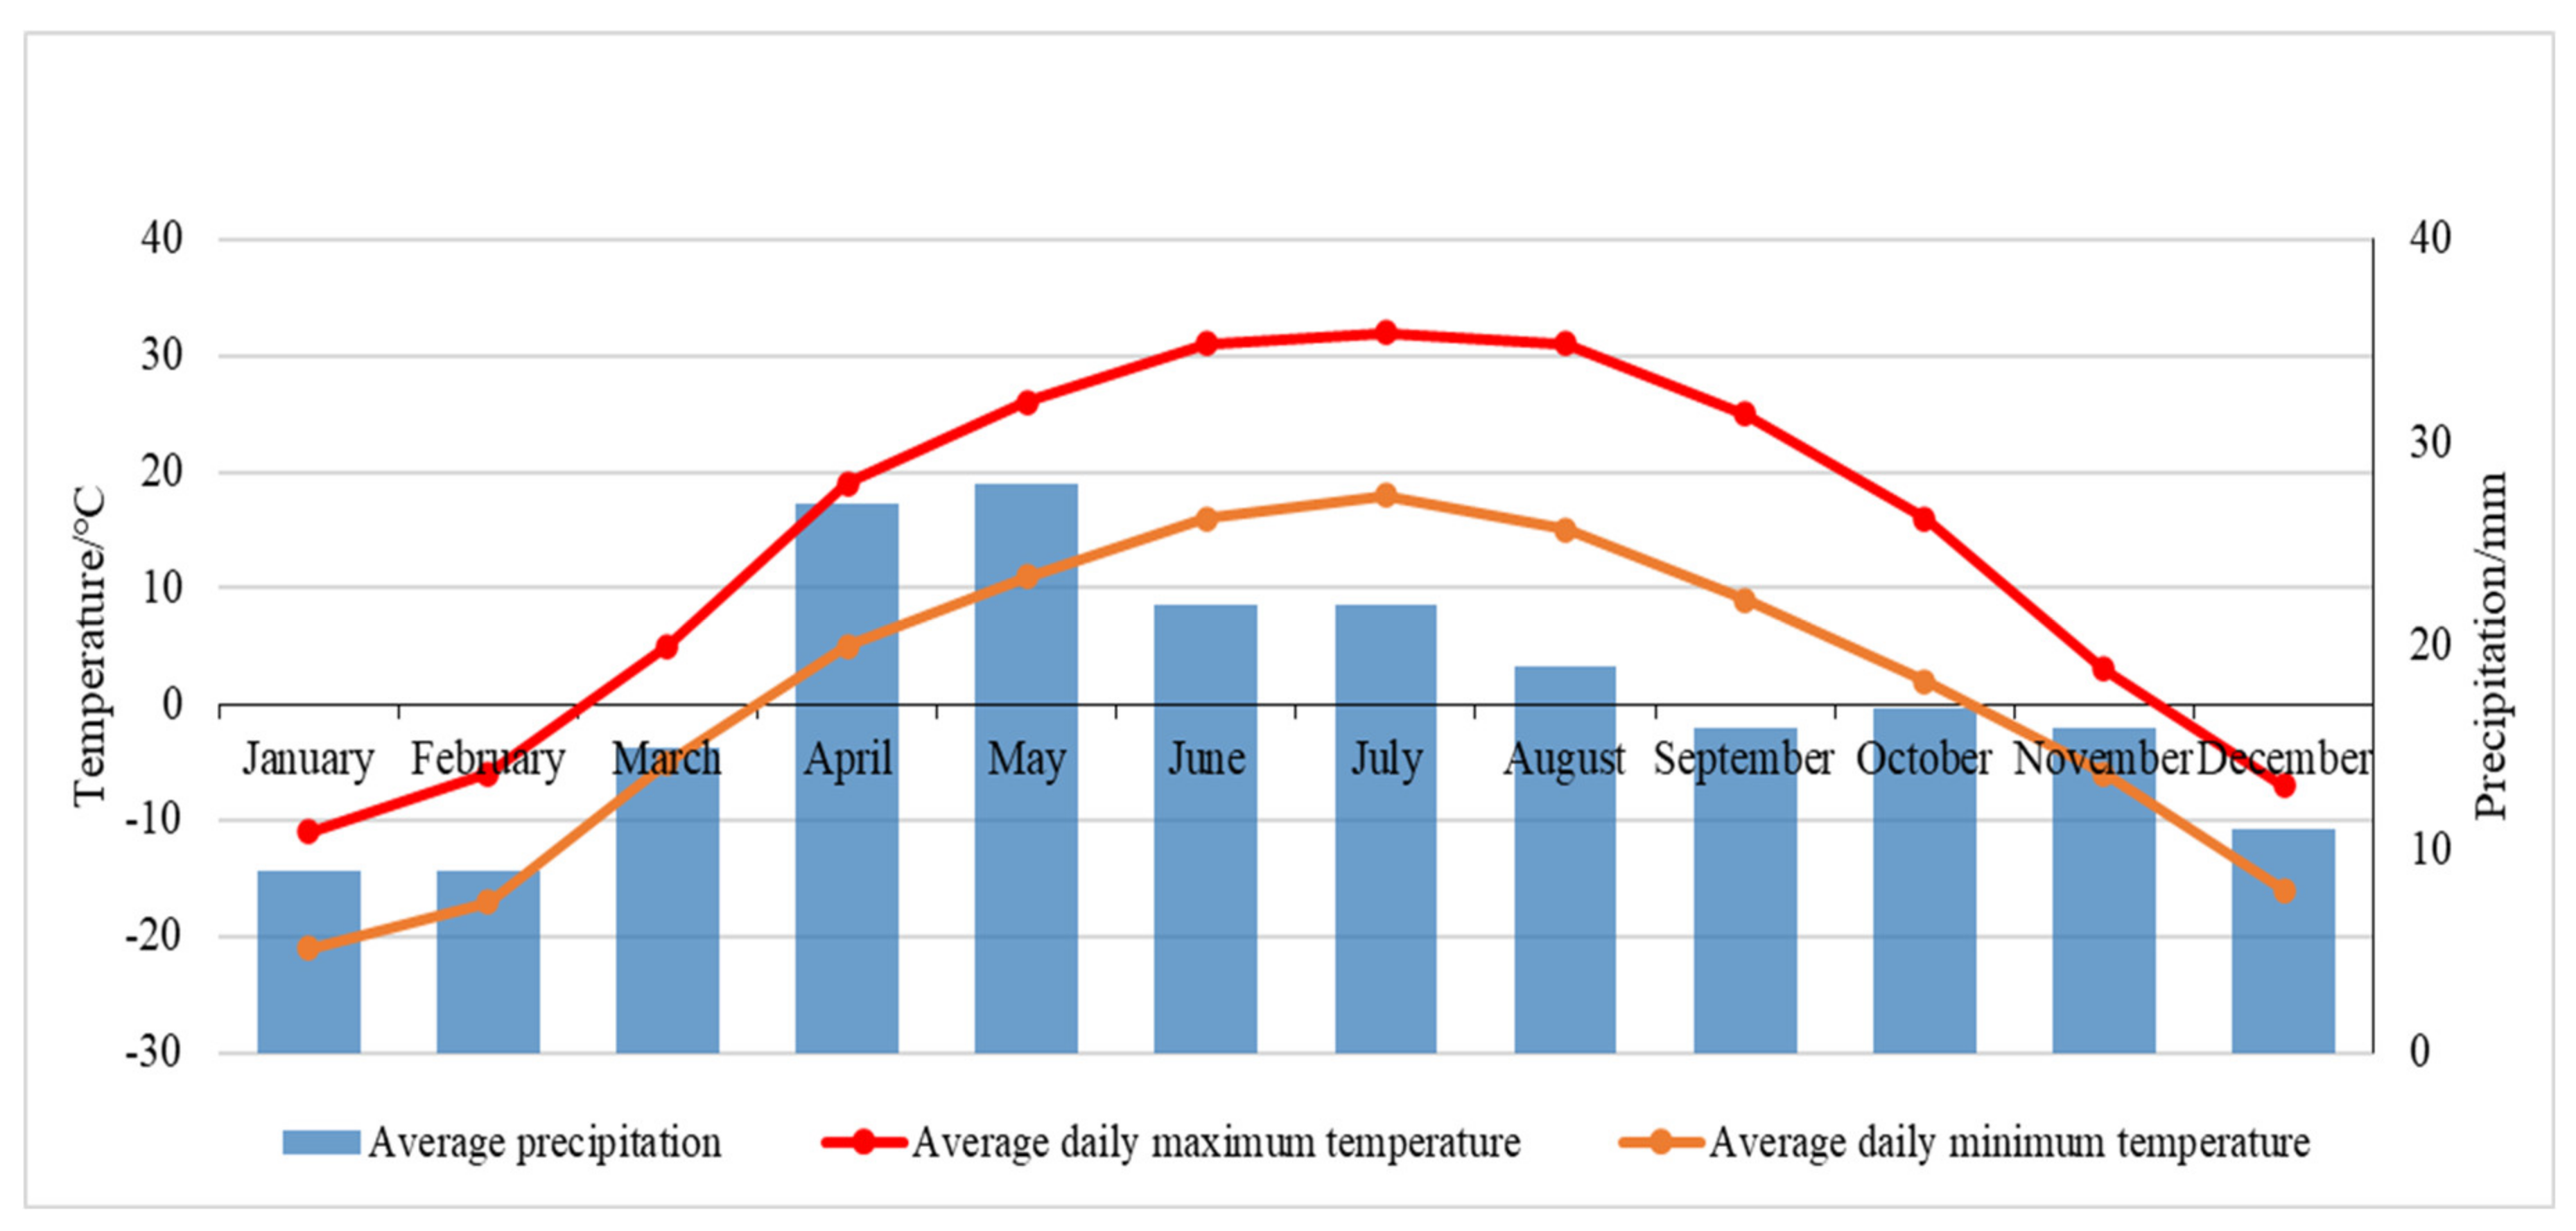
2.3. Weather Conditions
2.4. Data Sampling
2.5. Plant Height
2.6. Chlorophyll Content (SPAD)
2.7. Root Morphological Characteristics
2.8. Root Length Density
2.9. Yield and Competition Index
2.10. Data Analysis
3. Results
3.1. Plant Height
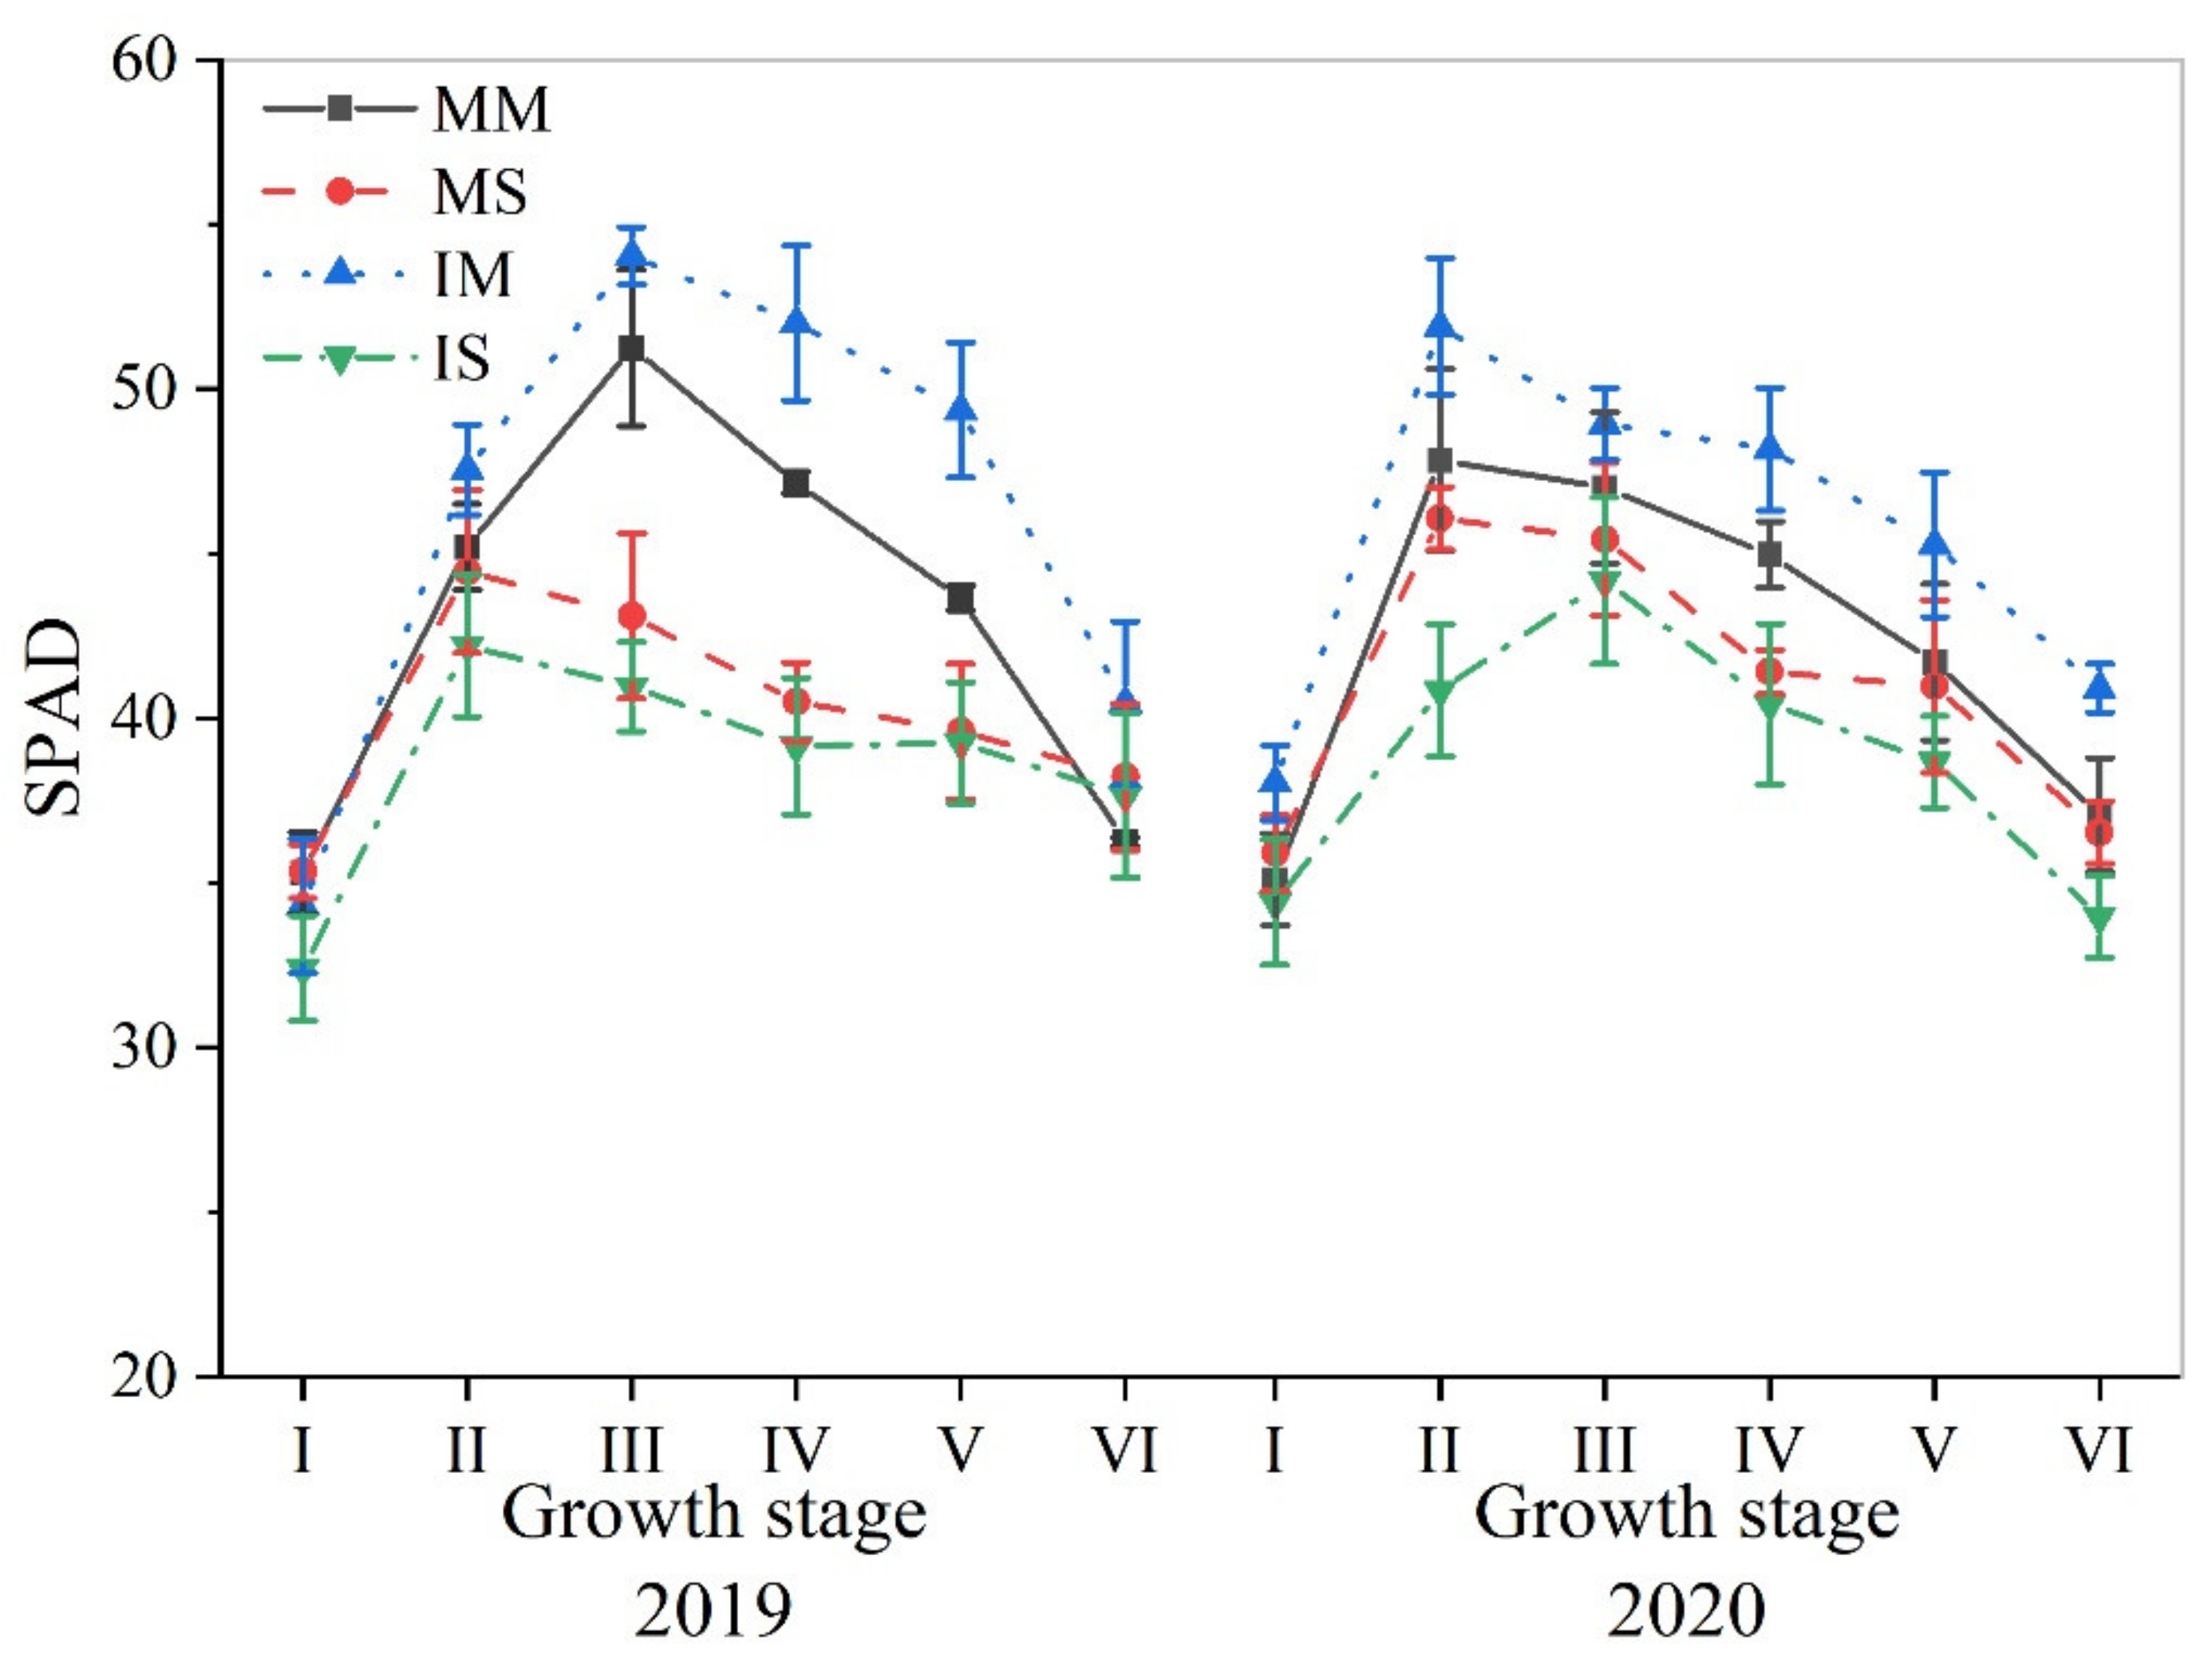
3.2. SPAD Values
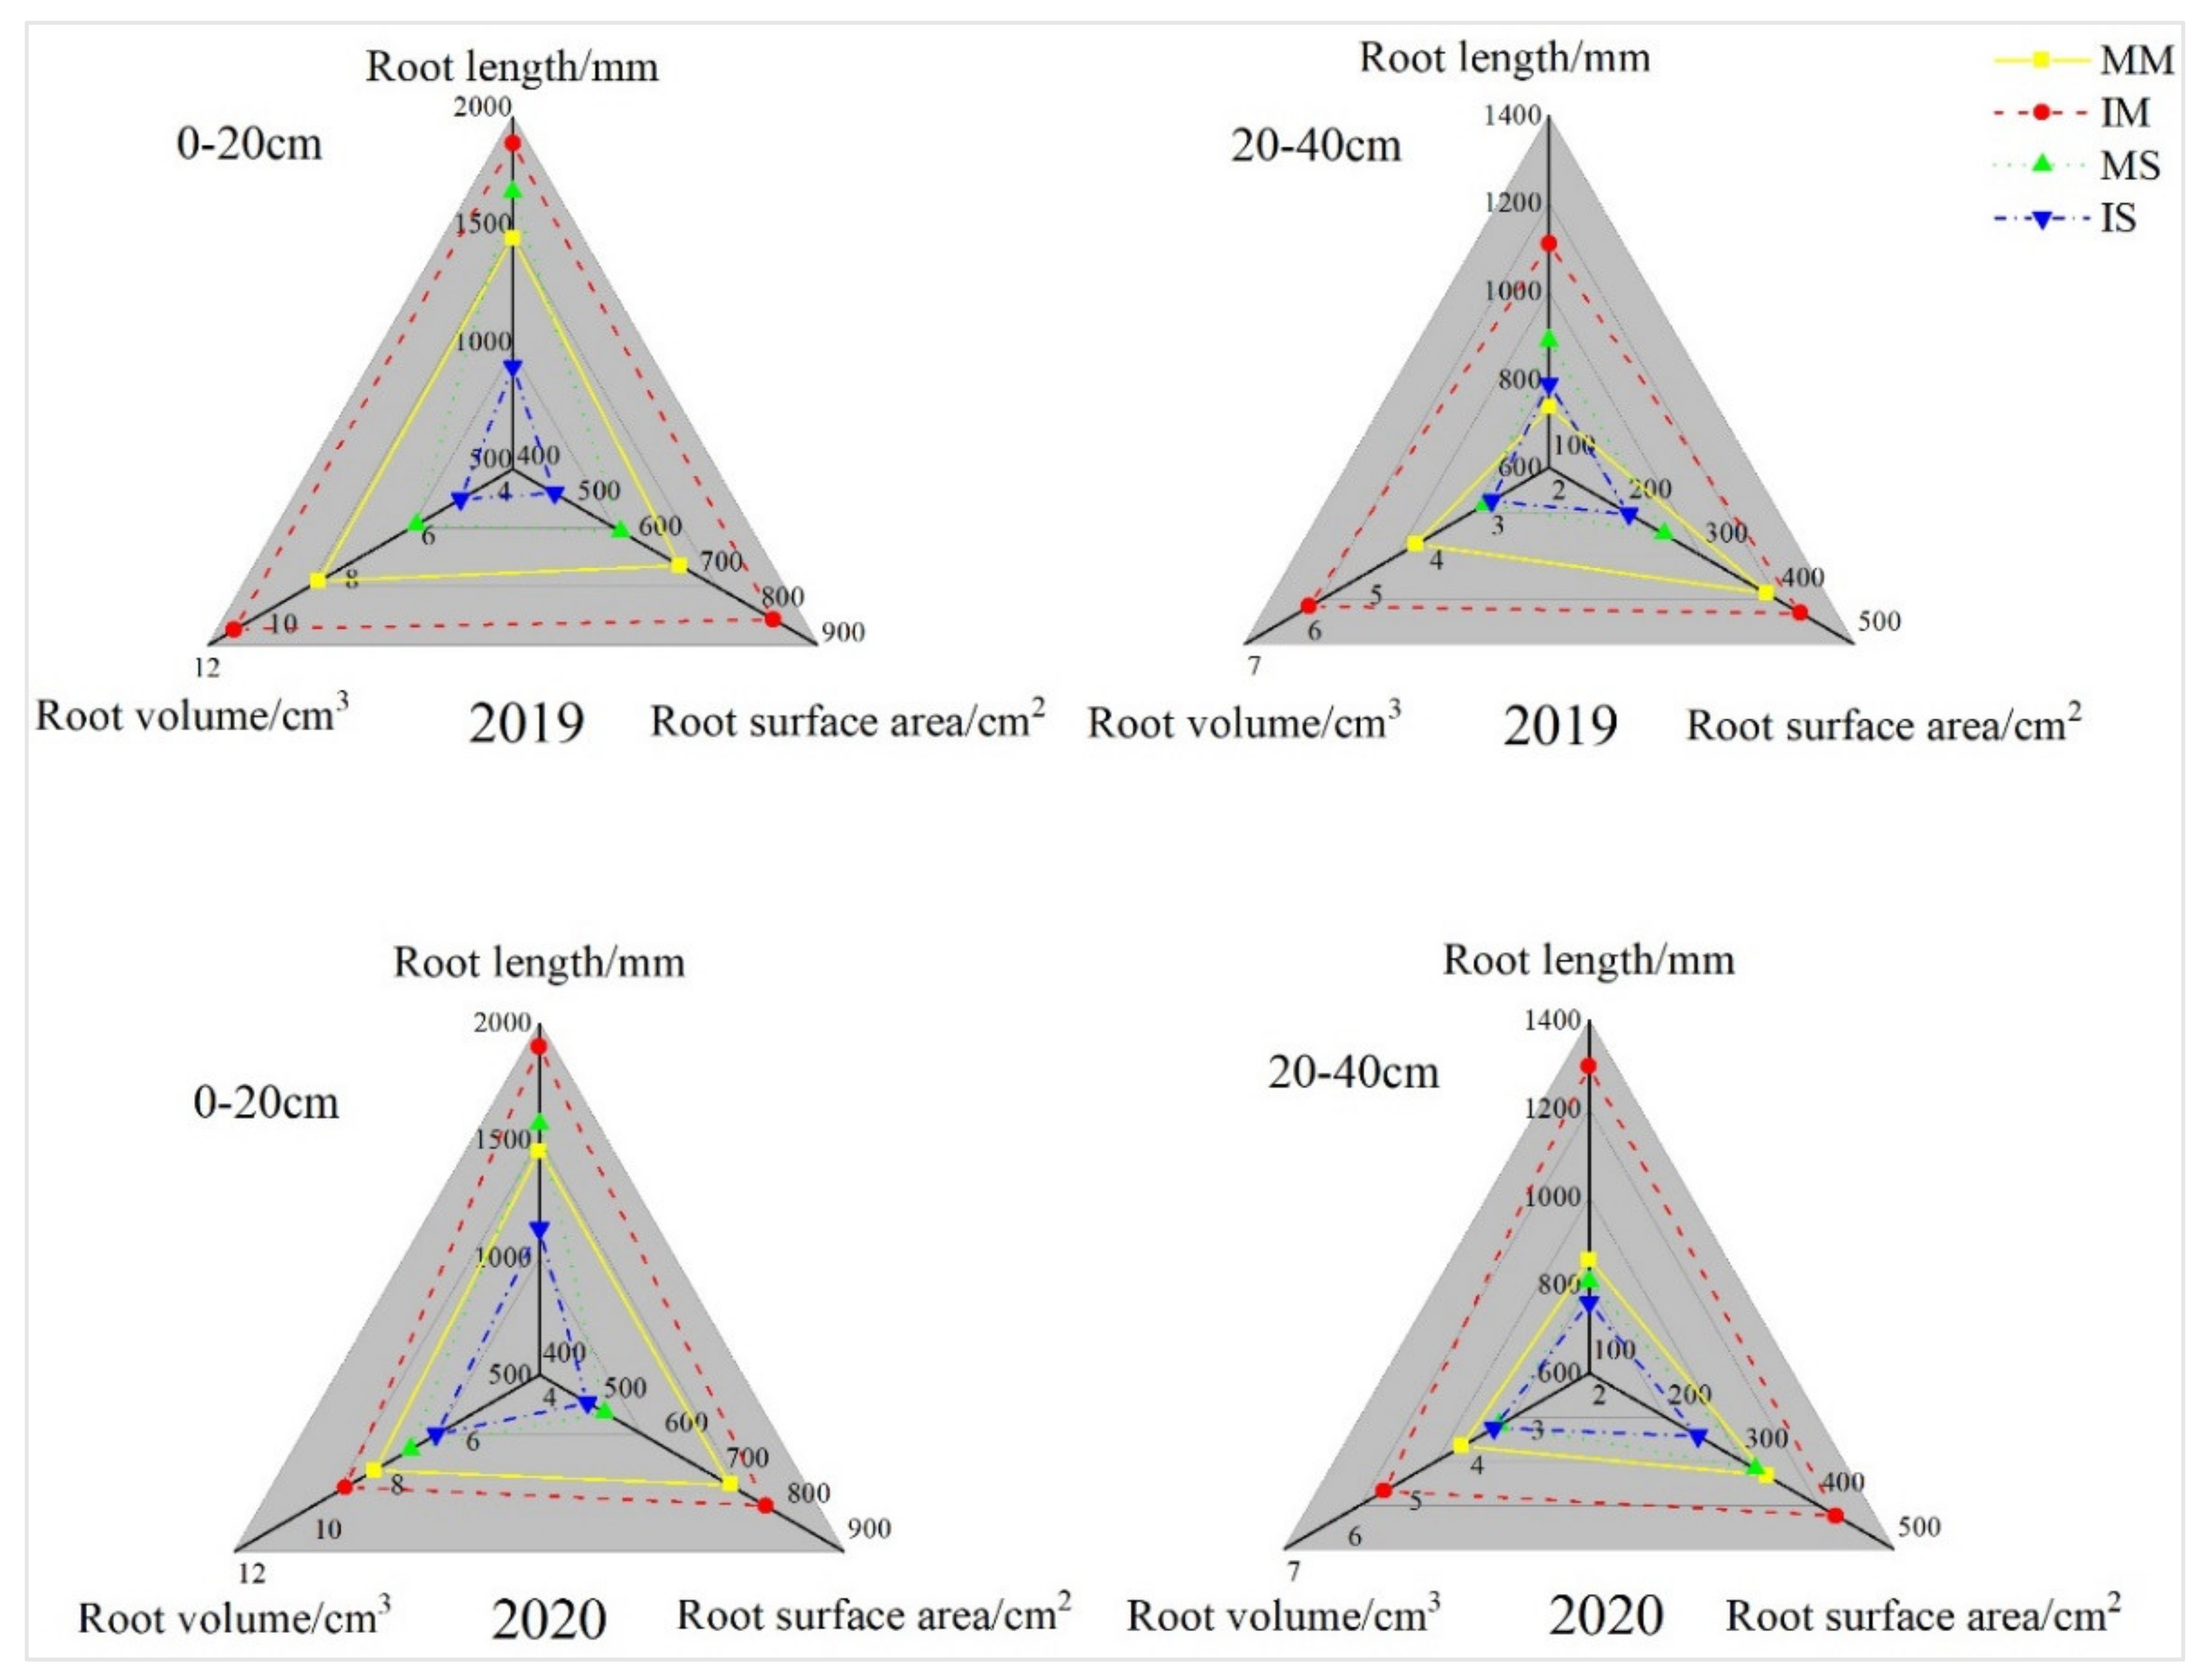
3.3. Root Morphological Characteristics
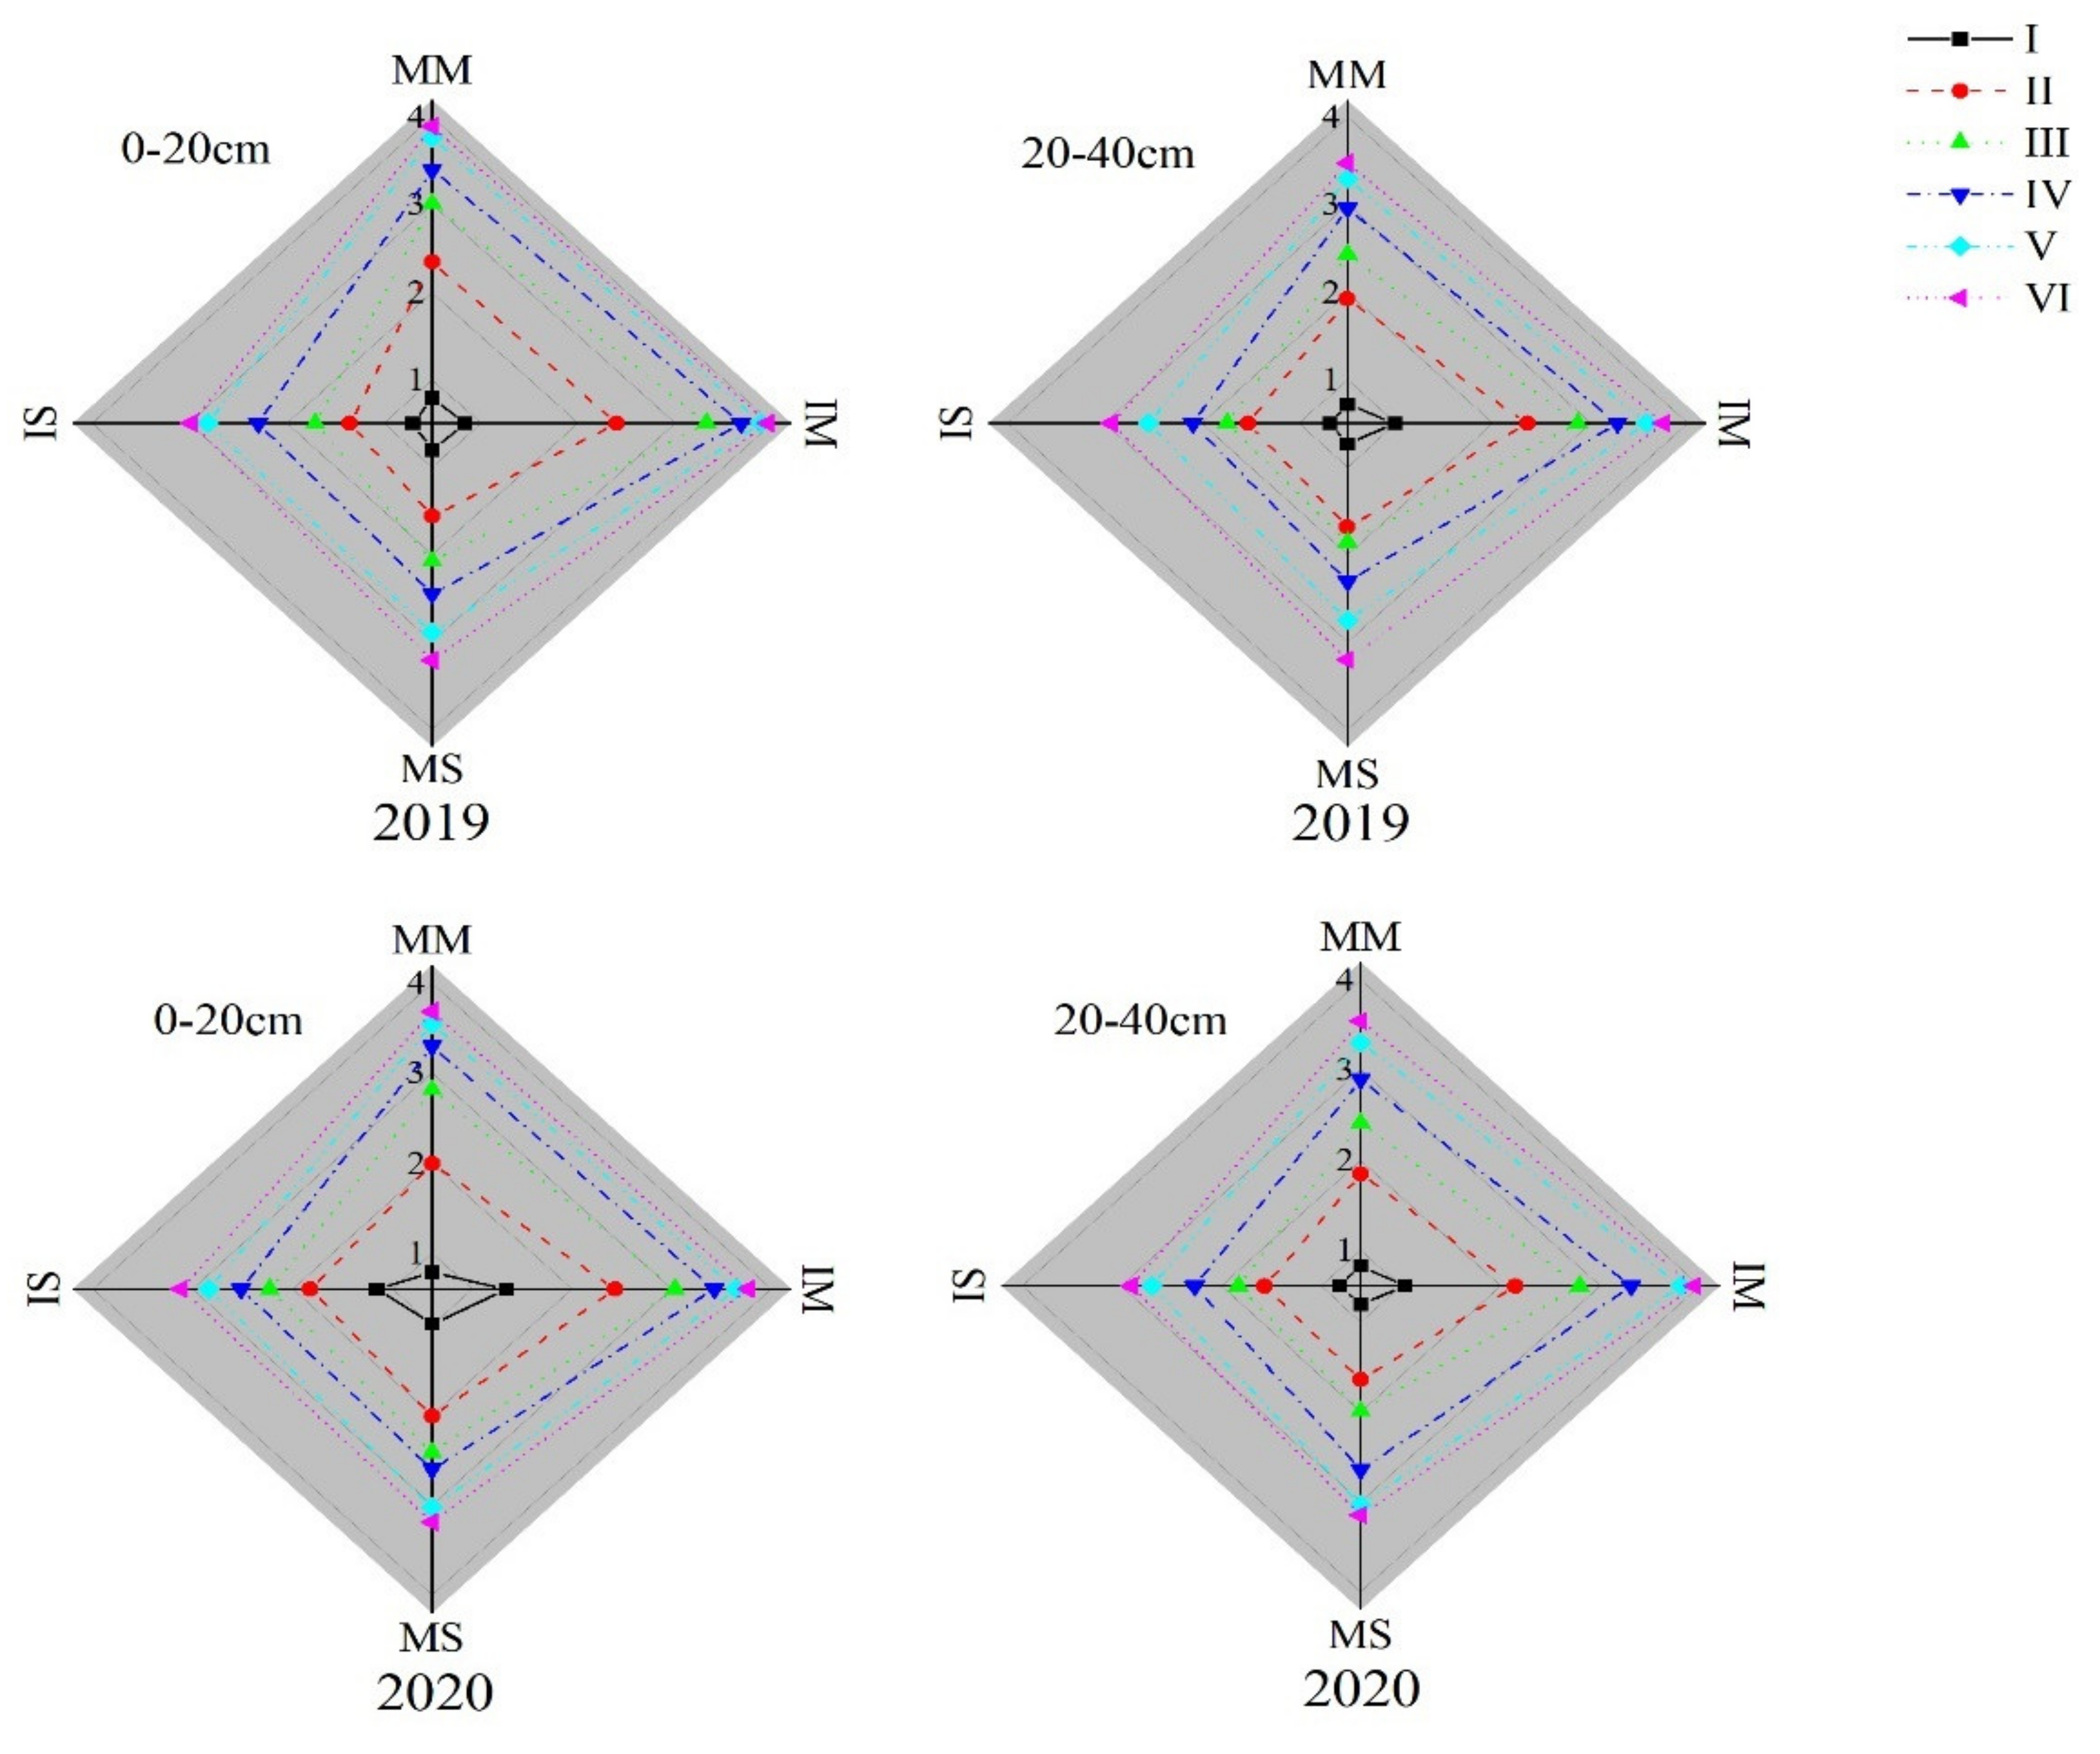
3.4. RLD
3.5. Correlation
3.6. Yield Composition
3.7. Land Equivalent Ratio and Actual Yield Loss
3.8. Aggressivity and Competitive Ratio
4. Discussion
4.1. Agronomic Traits of Crops
4.2. Root Morphological Characteristics
4.3. Yield and Land Productivity
4.4. Interspecific Competition
5. Conclusions
Author Contributions
Funding
Institutional Review Board Statement
Informed Consent Statement
Data Availability Statement
Conflicts of Interest
References
- Li, Y.; Zhang, W.; Ma, L.; Wu, L.; Shen, J.; Davies, W.J.; Dou, Z. An analysis of China’s grain production: Looking back and looking forward. Food Energy Secur. 2015, 3, 19–32. [Google Scholar] [CrossRef]
- Campbell, B.M.; Beare, D.J.; Bennett, E.M.; Hall-Spencer, J.M.; Ingram, J.S.; Jaramillo, F.; Shindell, D. Agriculture production as a major driver of the Earth system exceeding planetary boundaries. Ecol. Soc. 2017, 22, 8. [Google Scholar] [CrossRef]
- Zhang, Z.; Ping, X.-U.; Duan, Z. Food security should be the ultimate goal of agricultural modernization in China. Chin. J. Eco-Agric. 2015, 23, 1215–1219. [Google Scholar] [CrossRef]
- Lin, X.; Qi, L.; Pan, H.; Sharp, B. COVID-19 Pandemic, Technological Progress and Food Security Based on a Dynamic CGE Model. Sustainability 2022, 14, 1842. [Google Scholar] [CrossRef]
- Grassini, P.; Cassman, K.G. High-yield maize with large net energy yield and small global warming intensity. Proc. Natl. Acad. Sci. USA 2012, 109, 1074–1079. [Google Scholar] [CrossRef] [Green Version]
- Ingram, J. Perspective: Look beyond production. Nature 2017, 544, S17. [Google Scholar] [CrossRef]
- Zhang, D.; Sun, Z.; Feng, L.; Bai, W.; Zhang, L. Maize plant density affects yield, growth and source-sink relationship of crops in maize/peanut intercropping. Field Crop. Res. 2020, 257, 107926. [Google Scholar] [CrossRef]
- Ai, P.-R.; Ma, Y.-J.; Ma, L. Study on evaporation variation of jujube trees under drip irrigation of jujube and cotton intercropping in an arid area. Acta Ecol. Sin. 2018, 38, 4761–4769. [Google Scholar] [CrossRef]
- Tong, P.-Y. Achievements and perspectives of tillage and cropping systems in China. Crop. System. Cult. Technol. 1994, 77, 1–5. [Google Scholar]
- Inal, A.; Gunes, A.; Zhang, F.; Cakmak, I. Peanut/maize intercropping induced changes in rhizosphere and nutrient concentrations in shoots. Plant Physiol. Biochem. 2007, 45, 350–356. [Google Scholar] [CrossRef]
- Zhang, L.-Z.; Van der Werf, W.; Zhang, S.-P.; Li, B.; Spiertz, J.H.J. Growth, yield and quality of wheat and cotton in relay strip intercropping systems. Field. Crop. Res. 2007, 103, 178–188. [Google Scholar] [CrossRef]
- Zhao, D.; Yuan, J.; Hou, Y.; Li, T.; Liao, Y. Tempo-spatial dynamics of AMF under maize soybean intercropping. Chin. J. Eco-Agric. 2020, 28, 631–642. [Google Scholar] [CrossRef]
- Zhai, T.; Wu, L. Study on development situation and revitalization strategy of soybean industry in China from an open perspective. Soybean Sci. 2020, 39, 472–478. [Google Scholar]
- Central Committee of the Communist Party of China, State Council. 2020. Available online: http://www.gov.cn/zhengce/2020-02/05/content_5474884.htm (accessed on 22 June 2022).
- Central Committee of the Communist Party of China, State Council. 2022. Available online: http://www.81.cn/yw/2022-02/22/content_10134209.htm (accessed on 20 June 2022).
- Ministry of Agriculture and Rural Affairs of the People’s Republic of China. 2022. Available online: http://news.china.com.cn/2022-01/20/content_78001838.html (accessed on 20 June 2022).
- Li, L.; Zhang, L.; Zhang, F. Crop mixtures and the mechanisms of overyielding. In Encyclopedia of Biodiversity, 2nd ed.; Levin, S.A., Ed.; Academic Press: Waltham, MA, USA, 2013; pp. 382–395. [Google Scholar]
- Li, C.; Hoffland, E.; Kuyper, T.W.; Yu, Y.; Zhang, C.; Li, H.; Zhang, F.; Werf, W.V.D. Syndromes of production in intercropping impact yield gains. Nat. Plants 2020, 6, 653–660. [Google Scholar] [CrossRef]
- Zhu, Y.; Gao, F.; Cao, P.; Wang, L. Effect of plant density on population yield and economic output value in maize-soybean intercropping. J. Appl. Ecol. 2015, 26, 1751–1758. [Google Scholar]
- Liu, X.; Rahman, T.; Song, C.; Yang, F.; Su, B.; Cui, L.; Yang, W. Relationships among light distribution, radiation use efficiency and land equivalent ratio in maize-soybean strip intercropping. Field Crop. Res. 2018, 224, 91–101. [Google Scholar] [CrossRef]
- Yin, W.; Chai, Q.; Zhao, C.; Yu, A.; Fan, Z.; Hu, F.; Coulter, J.A. Water utilization in intercropping: A review. Agric. Water Manag. 2020, 241, 106335. [Google Scholar] [CrossRef]
- Rodriguez, C.; Carlsson, G.; Englund, J.E.; Flöhr, A.; Pelzer, E.; Jeuffroy, M.H.; Jensen, E.S. Grain legume-cereal intercropping enhances the use of soil-derived and biologically fixed nitrogen in temperate agroecosystems. A meta-analysis. Eur. J. Agron. 2020, 118, 126077. [Google Scholar] [CrossRef]
- Mead, R.; Willey, R.W. The Concept of a ‘Land Equivalent Ratio’ and Advantages in Yields from Intercropping. Exp. Agric. 1980, 16, 217–228. [Google Scholar] [CrossRef] [Green Version]
- Banik, P.; Sasmal, T.; Ghosal, P.K. Evaluation of mustard (Brassica compestris Var. Toria) and legume intercropping under 1:1 and 2:1 row-replacement series systems. J. Agron. Crop. Sci. 2000, 185, 9–14. [Google Scholar] [CrossRef]
- Agegnehu, G.; Ghizaw, A.; Sinebo, W. Yield performance and land-use efficiency of barley and faba bean mixed cropping in Ethiopian highlands. Eur. J. Agron. 2006, 25, 202–207. [Google Scholar] [CrossRef]
- Dhima, K.V.; Lithourgidis, A.S.; Vasilakoglou, I.B.; Dordas, C.A. Competition indices of common vetch and cereal intercrops in two seeding ratio. Field Crop. Res. 2007, 100, 249–256. [Google Scholar] [CrossRef]
- Verreynne, J.S.; Rabe, E.; Theron, K.I. The effect of combined deficit irrigation and summer trunk girdling on the internal fruit quality of ‘Marisol’ Clementines. Sci. Hortic. 2001, 91, 25–37. [Google Scholar] [CrossRef]
- Liu, X.; Rahman, T.; Song, C.; Su, B.; Yang, F.; Yong, T.; Yang, W. Changes in light environment, morphology, growth and yield of soybean in maize-soybean intercropping systems. Field Crop. Res. 2017, 200, 38–46. [Google Scholar] [CrossRef]
- Li, Y.-J.; Ma, L.-S.; Wu, P.-T.; Zhao, X.-N.; Chen, X.-L.; Gao, X.-D. Yield, yield attributes and photosynthetic physiological characteristics of dryland wheat (Triticum aestivum L.)/maize (Zea mays L.) strip intercropping. Field Crop. Res. 2020, 248, 107656. [Google Scholar] [CrossRef]
- Li, G.-H.; Xue, L.-H.; You, J. Spatial distribution of leaf N content and SPAD value and determination of the suitable leaf for N diagnosis in rice. Sci. Agric. Sin. 2007, 40, 1127–1134. [Google Scholar]
- Bethlenfalvay, G.J.; Reyes-Solis, M.G.; Camel, S.B.; Ferrera-Cerrato, R. Nutrient transfer between the root zones of soybean and maize plants connected by a common mycorrhizal mycelium. Physiol. Plant. 1991, 82, 423–432. [Google Scholar] [CrossRef]
- Gao, Y.; Duan, A.-W.; Qiu, X.-Q.; Liu, Z.-G.; Sun, J.-S.; Zhang, J.-P.; Wang, H.-Z. Distribution of roots and root length density in a maize/soybean strip intercropping system. Agric. Water. Manag. 2010, 98, 199–212. [Google Scholar] [CrossRef]
- Xia, H.-Y.; Zhao, J.-H.; Sun, J.-H.; Bao, X.-G.; Christie, P.; Zhang, F.-S.; Li, L. Dynamics of root length and distribution and shoot biomass of maize as affected by intercropping with different companion crops and phosphorus application rates. Field Crop. Res. 2013, 150, 52–62. [Google Scholar] [CrossRef]
- Li, L.; Tilman, D.; Lambers, H.; Zhang, F.-S. Plant diversity and overyielding: Insights from belowground facilitation of intercropping in agriculture. New Phytol. 2014, 203, 63–69. [Google Scholar] [CrossRef]
- Shinano, T.; Osaki, M.; Yamada, S.; Tadano, T. Comparison of root growth and nitrogen absorbing ability between Gramineae and Leguminosae during the vegetative stage. Soil Sci. Plant. Nutr. 1994, 40, 485–495. [Google Scholar] [CrossRef]
- Li, Y.-Y.; Pang, F.-H.; Sun, J.-H.; Li, L.; Cheng, X. Effects of root barrier between intercropped maize and faba bean and nitrogen (N) application on the spatial distributions and morphology of crops’ roots. J. China Agric. Univ. 2010, 15, 13–19. [Google Scholar]
- Ren, Y.; Zhang, L.; Yan, M.; Zhang, Y.; Chen, Y.; Palta, J.A.; Zhang, S. Effect of sowing proportion on above-and below-ground competition in maize–soybean intercrops. Sci. Rep. 2021, 11, 15760. [Google Scholar] [CrossRef]
- Wahla, I.H.; Ahmad, R.I.A.Z.; Ehsanullah, A.A.; Jabbar, A.B.D.U.L. Competitive functions of components crops in some barley based intercropping systems. Int. J. Agric. Biol. 2009, 11, 69–72. [Google Scholar]
- Adiku, S.G.K.; Ozier-Lafontaine, H.; Bajazet, T. Patterns of root growth and water uptake of a maize-cowpea mixture grown under greenhouse conditions. Plant Soil 2001, 235, 85–94. [Google Scholar] [CrossRef]
- Gao, Y.-L.; Sun, Z.-X.; Bai, W.; Feng, L.-S.; Cai, Q.; Feng, C.; Zhang, Z. Spatial distribution characteristics of root system and the yield in maize-peanut intercropping system. J. Maize Sci. 2016, 24, 79–87. [Google Scholar] [CrossRef]
- Yang, F.; Huang, S.; Gao, R.; Liu, W.; Yong, T.; Wang, X.; Yang, W. Growth of soybean seedlings in relay strip intercropping systems in relation to light quantity and red:far-red ratio. Field Crop. Res. 2014, 155, 245–253. [Google Scholar] [CrossRef]
- Ceunfin, S.; Prajitno, D.; Suryanto, P.; Putra, E.T.S. Penilaian kompetisi dan keuntungan hasil tumpangsari jagung kedelai di bawah tegakan kayu putih. Savana Cendana 2017, 2, 1–3. [Google Scholar] [CrossRef]
- Gard, L.E.; McKibben, G.E. “No-till” crop production proving a most promising conservation measure. Outlook Agric. 1973, 7, 149–154. [Google Scholar] [CrossRef]
- Hiebsch, C.K.; Tetio-Kagho, F.; Chirembo, A.M.; Gardner, F.P. Plant Density and Soybean Maturity in a Soybean-Maize Intercrop. Agrono. J. 1995, 87, 965–969. [Google Scholar] [CrossRef]
- Muoneke, C.O.; Ogwuche, M.; Kalu, B.A. Effect of maize planting density on the performance of maize/soybean intercropping system in a guinea savannah agroecosystem. Afr. J. Agric. Res. 2007, 2, 667–677. [Google Scholar] [CrossRef]
- Wu, Y.; Gong, W.; Yang, F.; Wang, X.; Yong, T.; Yang, W. Responses to shade and subsequent recovery of soya bean in maize-soya bean relay strip intercropping. Plant Prod. Sci. 2016, 19, 206–214. [Google Scholar] [CrossRef] [Green Version]
- Zhang, W.; Li, S.; Shen, Y.; Yue, S. Film mulching affects root growth and function in dryland maize-soybean intercropping. Field Crop. Res. 2021, 271, 108240. [Google Scholar] [CrossRef]
- Zhang, R.; Meng, L.; Li, Y.; Wang, X.; Ogundeji, A.O.; Li, X.; Li, S. Yield and nutrient uptake dissected through complementarity and selection effects in the maize/soybean intercropping. Food Energy Secur. 2021, 10, 379–393. [Google Scholar] [CrossRef]
- Vandermeer, J.H. The Ecology of Intercropping; Cambridge University Press: Cambridge, UK, 1992. [Google Scholar]
- Hafid, H.; Syaiful, S.A.; Fattah, A.; Djufry, F. The effect of the number of rows and varieties of soybean on growth and yield in intercropping with corn. IOP Conf. Ser. Earth Environ. Sci. 2021, 648, 012204. [Google Scholar] [CrossRef]
- Ndakidemi, P.A. Manipulating legume/cereal mixtures to optimize the above and below ground interactions in the traditional African cropping systems. Afr. J. Biotechnol. 2006, 525, 2526–2533. [Google Scholar] [CrossRef] [Green Version]
- Lithourgidis, A.S.; Vlachostergios, D.N.; Dordas, C.A.; Damalas, C.A. Dry matter yield, nitrogen content, and competition in pea–cereal intercropping systems. Eur. J. Agron. 2011, 34, 287–294. [Google Scholar] [CrossRef]
- Li, Z.; Wang, H.-F.; Wang, Y.-Y.; Yang, J.; Yu, B.-X.; Huang, S. Impact of millet and soybean intercropping on their photosynthetic characteristics and yield. J. Agric. Sci. Technol. 2020, 22, 168. [Google Scholar] [CrossRef]
- Wang, Y.; Zhao, Z.; Li, J.; Zhang, M.; Zhou, S.; Wang, Z.; Zhang, Y. Does maize hybrid intercropping increase yield due to border effects? Field Crop. Res. 2017, 214, 283–290. [Google Scholar] [CrossRef]
- Zhang, X.-C.; Wang, H.-L.; Yu, X.-F.; Hou, H.-Z.; Fang, Y.-J.; Ma, Y.-F. The study on the effect of potato and beans intercropping with whole field plastics mulching and ridge-furrow planting on soil thermal-moisture status and crop yield on semi-arid area. Sci. Agric. Sin. 2016, 49, 468–481. [Google Scholar]


| 2019 | 2020 | Maize | Soybean | |
|---|---|---|---|---|
| I | 19 May | 20 May | Seedling stage | Seedling stage |
| II | 4 Jun | 6 Jun | Jointing stage | Branching stage |
| III | 30 Jun | 2 Jul | Large bell mouth stage | Flowering stage |
| IV | 14 Jul | 16 Jul | Silking stage | Pod setting stage |
| V | 28 Jul | 30 Jul | Grain filling stage | Drumming stage |
| VI | 12 Aug | 14 Aug | Maturation stage | Maturation stage |
| Index | RL | RSA | RV | RLD | SD | |
|---|---|---|---|---|---|---|
| MM | RL | 1 | ||||
| RSA | 0.966 * | 1 | ||||
| RV | 0.986 * | 0.976 * | 1 | |||
| RLD | 0.899 | 0.813 | 0.921 | 1 | ||
| SD | −0.992 ** | −0.991 ** | −0.993 ** | −0.875 | 1 | |
| IM | RL | 1 | ||||
| RSA | 0.973 * | 1 | ||||
| RV | 0.904 | 0.972 * | 1 | |||
| RLD | 0.979 * | 0.916 | 0.842 | 1 | ||
| SD | −0.982 * | −0.994 ** | −0.942 | −0.924 | 1 | |
| MS | RL | 1 | ||||
| RSA | 0.964 * | 1 | ||||
| RV | 0.954 * | 0.935 * | 1 | |||
| RLD | 0.979 * | 0.889 | 0.928 | 1 | ||
| SD | −0.992 ** | −0.966 * | −0.984 * | −0.966 * | 1 | |
| IS | RL | 1 | ||||
| RSA | 0.887 | 1 | ||||
| RV | 0.964 * | 0.956 * | 1 | |||
| RLD | 0.981 * | 0.939 | 0.961 * | 1 | ||
| SD | −0.887 | −0.994 ** | −937 | −0.951 * | 1 |
| Treatment | Number of Spikes per Plant (Piece) | Ear Grain Numbers (Grain) | 1000-Seed Weight (g) | Yield (kg·hm−2) | |
|---|---|---|---|---|---|
| 2019 | Monocropping Maize | 1.37 ± 0.03 a | 318.00 ± 7.79 a | 405.48 ± 5.07 a | 9715.83 a |
| Intercropping Maize | 1.79 ± 0.17 a | 331.67 ± 10.34 b | 436.58 ± 8.35 b | 7257.40 b | |
| 2020 | Monocropping Maize | 1.31 ± 0.09 a | 294.33 ± 6.93 a | 407.32 ± 4.77 a | 8637.82 a |
| Intercropping Maize | 1.76 ± 0.28 a | 318.04 ± 7.55 b | 435.66 ± 7.63 b | 6828.10 b |
| Treatment | Pods per Plant (Piece) | Seeds per Plant (Grain) | 1000-Seed Weight (g) | Yield (kg·hm−2) | |
|---|---|---|---|---|---|
| 2019 | Monocropping Soybean | 32.66 ± 9.32 a | 2.85 ± 0.08 a | 232.59 ± 3.70 a | 1796.93 b |
| Intercropping Soybean | 23.58 ± 5.79 b | 2.72 ± 0.03 a | 221.16 ± 8.71 b | 780.16 a | |
| 2020 | Monocropping Soybean | 31.58 ± 8.80 a | 2.81 ± 0.06 a | 238.35 ± 3.44 a | 1755.543 b |
| Intercropping Soybean | 24.03 ± 6.03 b | 2.65 ± 0.05 a | 230.23 ± 5.99 b | 823.13 a |
| LER | AYL | Am | CRm | CRs | |
|---|---|---|---|---|---|
| 2019 | 1.181 | 0.149 | +0.839 | 3.441 | 0.291 |
| 2020 | 1.259 | 0.289 | +0.873 | 3.372 | 0.297 |
Publisher’s Note: MDPI stays neutral with regard to jurisdictional claims in published maps and institutional affiliations. |
© 2022 by the authors. Licensee MDPI, Basel, Switzerland. This article is an open access article distributed under the terms and conditions of the Creative Commons Attribution (CC BY) license (https://creativecommons.org/licenses/by/4.0/).
Share and Cite
Wei, W.; Liu, T.; Shen, L.; Wang, X.; Zhang, S.; Zhang, W. Effect of Maize (Zeal mays) and Soybean (Glycine max) Intercropping on Yield and Root Development in Xinjiang, China. Agriculture 2022, 12, 996. https://doi.org/10.3390/agriculture12070996
Wei W, Liu T, Shen L, Wang X, Zhang S, Zhang W. Effect of Maize (Zeal mays) and Soybean (Glycine max) Intercropping on Yield and Root Development in Xinjiang, China. Agriculture. 2022; 12(7):996. https://doi.org/10.3390/agriculture12070996
Chicago/Turabian StyleWei, Wenwen, Tingting Liu, Lei Shen, Xiuyuan Wang, Shuai Zhang, and Wei Zhang. 2022. "Effect of Maize (Zeal mays) and Soybean (Glycine max) Intercropping on Yield and Root Development in Xinjiang, China" Agriculture 12, no. 7: 996. https://doi.org/10.3390/agriculture12070996
APA StyleWei, W., Liu, T., Shen, L., Wang, X., Zhang, S., & Zhang, W. (2022). Effect of Maize (Zeal mays) and Soybean (Glycine max) Intercropping on Yield and Root Development in Xinjiang, China. Agriculture, 12(7), 996. https://doi.org/10.3390/agriculture12070996