Article

Rural Transformation Driven by Households’ Adaptation to Climate, Policy, Market, and Urbanization: Perspectives from Livelihoods–Land Use on Chinese Loess Plateau

1
Northwest Land and Resource Research Center, Global Regional and Urban Research Institute, Shaanxi Normal University, Xi’an 710119, China
2
School of Tourism & Research Institute of Human Geography, Xi’an International Studies University, Xi’an 710128, China
3
College of Urban and Environmental Science, Northwest University, Xi’an 710127, China
4
School of Geography and Tourism, Shaanxi Normal University, Xi’an 710119, China
*
Authors to whom correspondence should be addressed.
Agriculture 2022, 12(8), 1111; https://doi.org/10.3390/agriculture12081111
Submission received: 5 July 2022 / Revised: 23 July 2022 / Accepted: 25 July 2022 / Published: 28 July 2022

Abstract

:
Regional rural systems respond to global environmental change with multi-dimensional transformation. However, in the widespread traditional agricultural areas, rural transformation is often seen as invisible and sometimes remains hidden by official statistics of urbanization and industrialization at a regional level. The study implemented field survey and ethnography methods, exploring the trajectory and driving paths of rural transformation in traditional agricultural areas. The findings indicate that the dominant livelihood experienced a transitional trajectory from traditional farming to jujube-oriented and then to a non-farming livelihood. Furthermore, the land use showed an eco-transformation from farmland to forest land, and from cultivated land gradually to uncultivated land. We also find that the household behaviors actively or passively adapted to environmental effects, such as climate change, market change, urbanization impact, and policy regulation, and then drove non-agricultural transformation and eco-transformation in traditional agricultural areas. Based on these findings, the study confirms that there is a clear rural transformation in traditional agricultural areas, and reveals that the Loess Plateau turned green from bottom to top. Finally, the study calls to take the road of green transformation, and proposals are presented in terms of ecology, livelihood, and industry.

1. Introduction

The spatial structure of urban and rural regional systems has changed significantly under global environmental change; rural sustainability has become one of the important development directions and key research fields of international geography, whilst rural transformation has become a worldwide topic [1,2,3,4,5]. Rural change is seen as the interrelated consequences of larger technical, economic, and social changes on a global scale, a perspective which has come to be known under the term ‘rural restructuring’ or ‘rural transformation’ [1,6,7,8,9]. In the mid-1960s, the problem of rural development attracted the attention of scholars from Germany, Britain, the United States, and Japan, and formed many prominent theories, including the stage theory of rural development, location theory, and dual-structure theory [10,11]. At present, rural transformation has been gradually concerned by scholars in the fields of rural geography, rural sociology, rural economics, and other disciplines. The main contents include analyzing the spatial–temporal stages, types, and modes of transformation [12,13]; measuring rural development degree [9,14]; discussing the influencing factors and mechanisms [15,16]; and conducting optimization policy and strategy research [17]. Some scholars have discussed the impact of rural transformation on the ecological environment, poverty reduction, residents’ happiness, and quality of life [18,19,20]. There is an interactive relationship between rural transformation and the agricultural eco-environment, and the deterioration of the agricultural eco-environment poses great challenges to sustainable agriculture [21,22].
Long et al. [9] define rural-transformation development as the reconstruction of social and economic forms and regional spatial patterns in rural areas, which mainly involves changes in the spatial organization structure, rural industrial development mode, employment mode, consumption structure, relations between industry and agriculture, and relations and differences between urban and rural areas, amongst others. This definition has gained broad consensus. Population, land, and industry are the three core elements affecting rural-transformation development [23]; the change in any element will drive the other elements to specific direction change, such as the change in industrial structure reflected by the corresponding land use change, and the upgrading of the industrial structure to promote the transformation of the rural employment structure. The separation of rural human with land leads to the abandonment of land [9]. The dynamic mechanism of rural transformation can be divided into three categories. The exogenous aspect attaches importance to the role of urbanization, whereas the endogenous aspect emphasizes local resource endowment, networks, the characteristic economy and rural idyllic life; the comprehensive aspect is endogenous and exogenous factors in rural development [24].
Since the middle of the 20th century, Western countries have experienced the process from the productive countryside to the consumption countryside, then to the multi-function countryside, and, finally, to the global countryside [25,26]. Woods [27] identified the countryside, since the start of the 21st century, as a global countryside and advocated rural reconstruction. In the process of globalization, natural resources, geographical location, local and non-local political negotiation, and other factors have caused global rural differentiation, and most of the traditional agricultural villages are gradually declining due to rural population loss and capital withdrawal [3,12]. Since the middle of the 20th century, China’s rural areas have undergone a series of economic and management system reforms, such as land reform, the household contract responsibility system, tax and fee system reform, urban–rural integration, beautiful countryside construction, the rural revitalization strategy, and so on [28]. Industrialization and urbanization have driven significant changes in the core elements of the rural regional system, such as land, capital, and labor [9]. China’s rural areas are undergoing continuous transformation and development [9,29]. Owing to regional differences in resource endowment, economic foundation, and policy environment, the modes and mechanisms of rural transformation also vary amongst regions [30]. Therefore, rural transformation presents significant characteristics of zonal evolution. The villages located in the developed coastal areas of eastern China show the mode of small towns and modern rural construction led by township enterprises [22,29]. In central China, the rural areas located in the agricultural plains or the ecological conservation areas have formed a rural construction model led by the export of labor services and distinctive industries [31]. The functions of rural tourism, leisure, and agricultural tourism have been rapidly strengthened. In the Loess Plateau, most rural areas rely on traditional agriculture, which generally has a lack of a resource base, sufficient development foundation, and dynamic support for economic transformation; therefore, rural transformation largely depends on the bottom-up thrust of households [31,32,33].
The household is the most basic social and agricultural production unit in rural areas [33]. It not only responds directly to the external environment [34], such as climate change [35,36,37,38], market change [39], urbanization [40], and policy intervention [41], but it is also the most direct promoter of the rural-transformation process [42]. The land is the carrier of household behaviors in society and production, and the allocation of land resources will affect the choice of livelihood activities [40,43]. The land use changes usually correspond to the transformation of economic, social, and eco-environment development stages, and can reflect the structural changes in the rural population and industrial elements in a region [44]. In addition, land use and land cover change show strong ecological effects [45,46]. Uncultivated land is conducive to the natural restoration of soil and vegetation and can gradually evolve into forest or shrub land for soil and water conservation, which provides the basic conditions for the improvement in the overall ecological environment of the region [47,48]. On the other hand, the change in livelihood activities is inevitably reflected in the change in households’ land use [33,49], and the over-reliance of rural livelihood on land resources has resulted in the decline of rural ecological quality, such as the fact that farming was found to be the activity with the most detrimental ecological impact, followed by processing and labor work [50].
At present, researchers are more interested in the process of urban–rural integration and transformation in suburban, rapidly industrialized areas, including rural–urban migration, land urbanization, and the non-agriculturalization of industry and labor [3,15,29,51]. Most research findings are based on sub-regional levels or national levels, and use macro-statistics published by government departments, such as land use transformation [30,52,53,54], population migration, and ‘population–land–industry’ transformation [13,23], which are often not accessible to the policy community. Meanwhile, micro-scale studies often suffer from limited time-series data, which means that they generally only focus on the current rural transformation [55] or qualitative reviews to track ‘landscape’ level changes [56]. In addition, the existing micro-scale studies pay more attention to the areas with tourism resources or special cultural settlements, and use observation methods or remote-sensing methods to discuss the rural transformation and development [57,58,59].
The traditional agricultural area is the core area of grain production in China and the agglomeration area of the rural population. What is the process of rural transformation in traditional agricultural-production areas? If the characteristics of land urbanization, population urbanization, and non-agricultural transformation in rural areas are not significant, does it mean that rural transformation has not taken place—especially in the Loess Plateau agricultural areas, which are characterized by an insufficient resource and development foundation and insufficient dynamic support for economic transformation [47,60]? The rural-transformation process of the broader traditional agricultural areas deserves the attention of the majority of scholars.
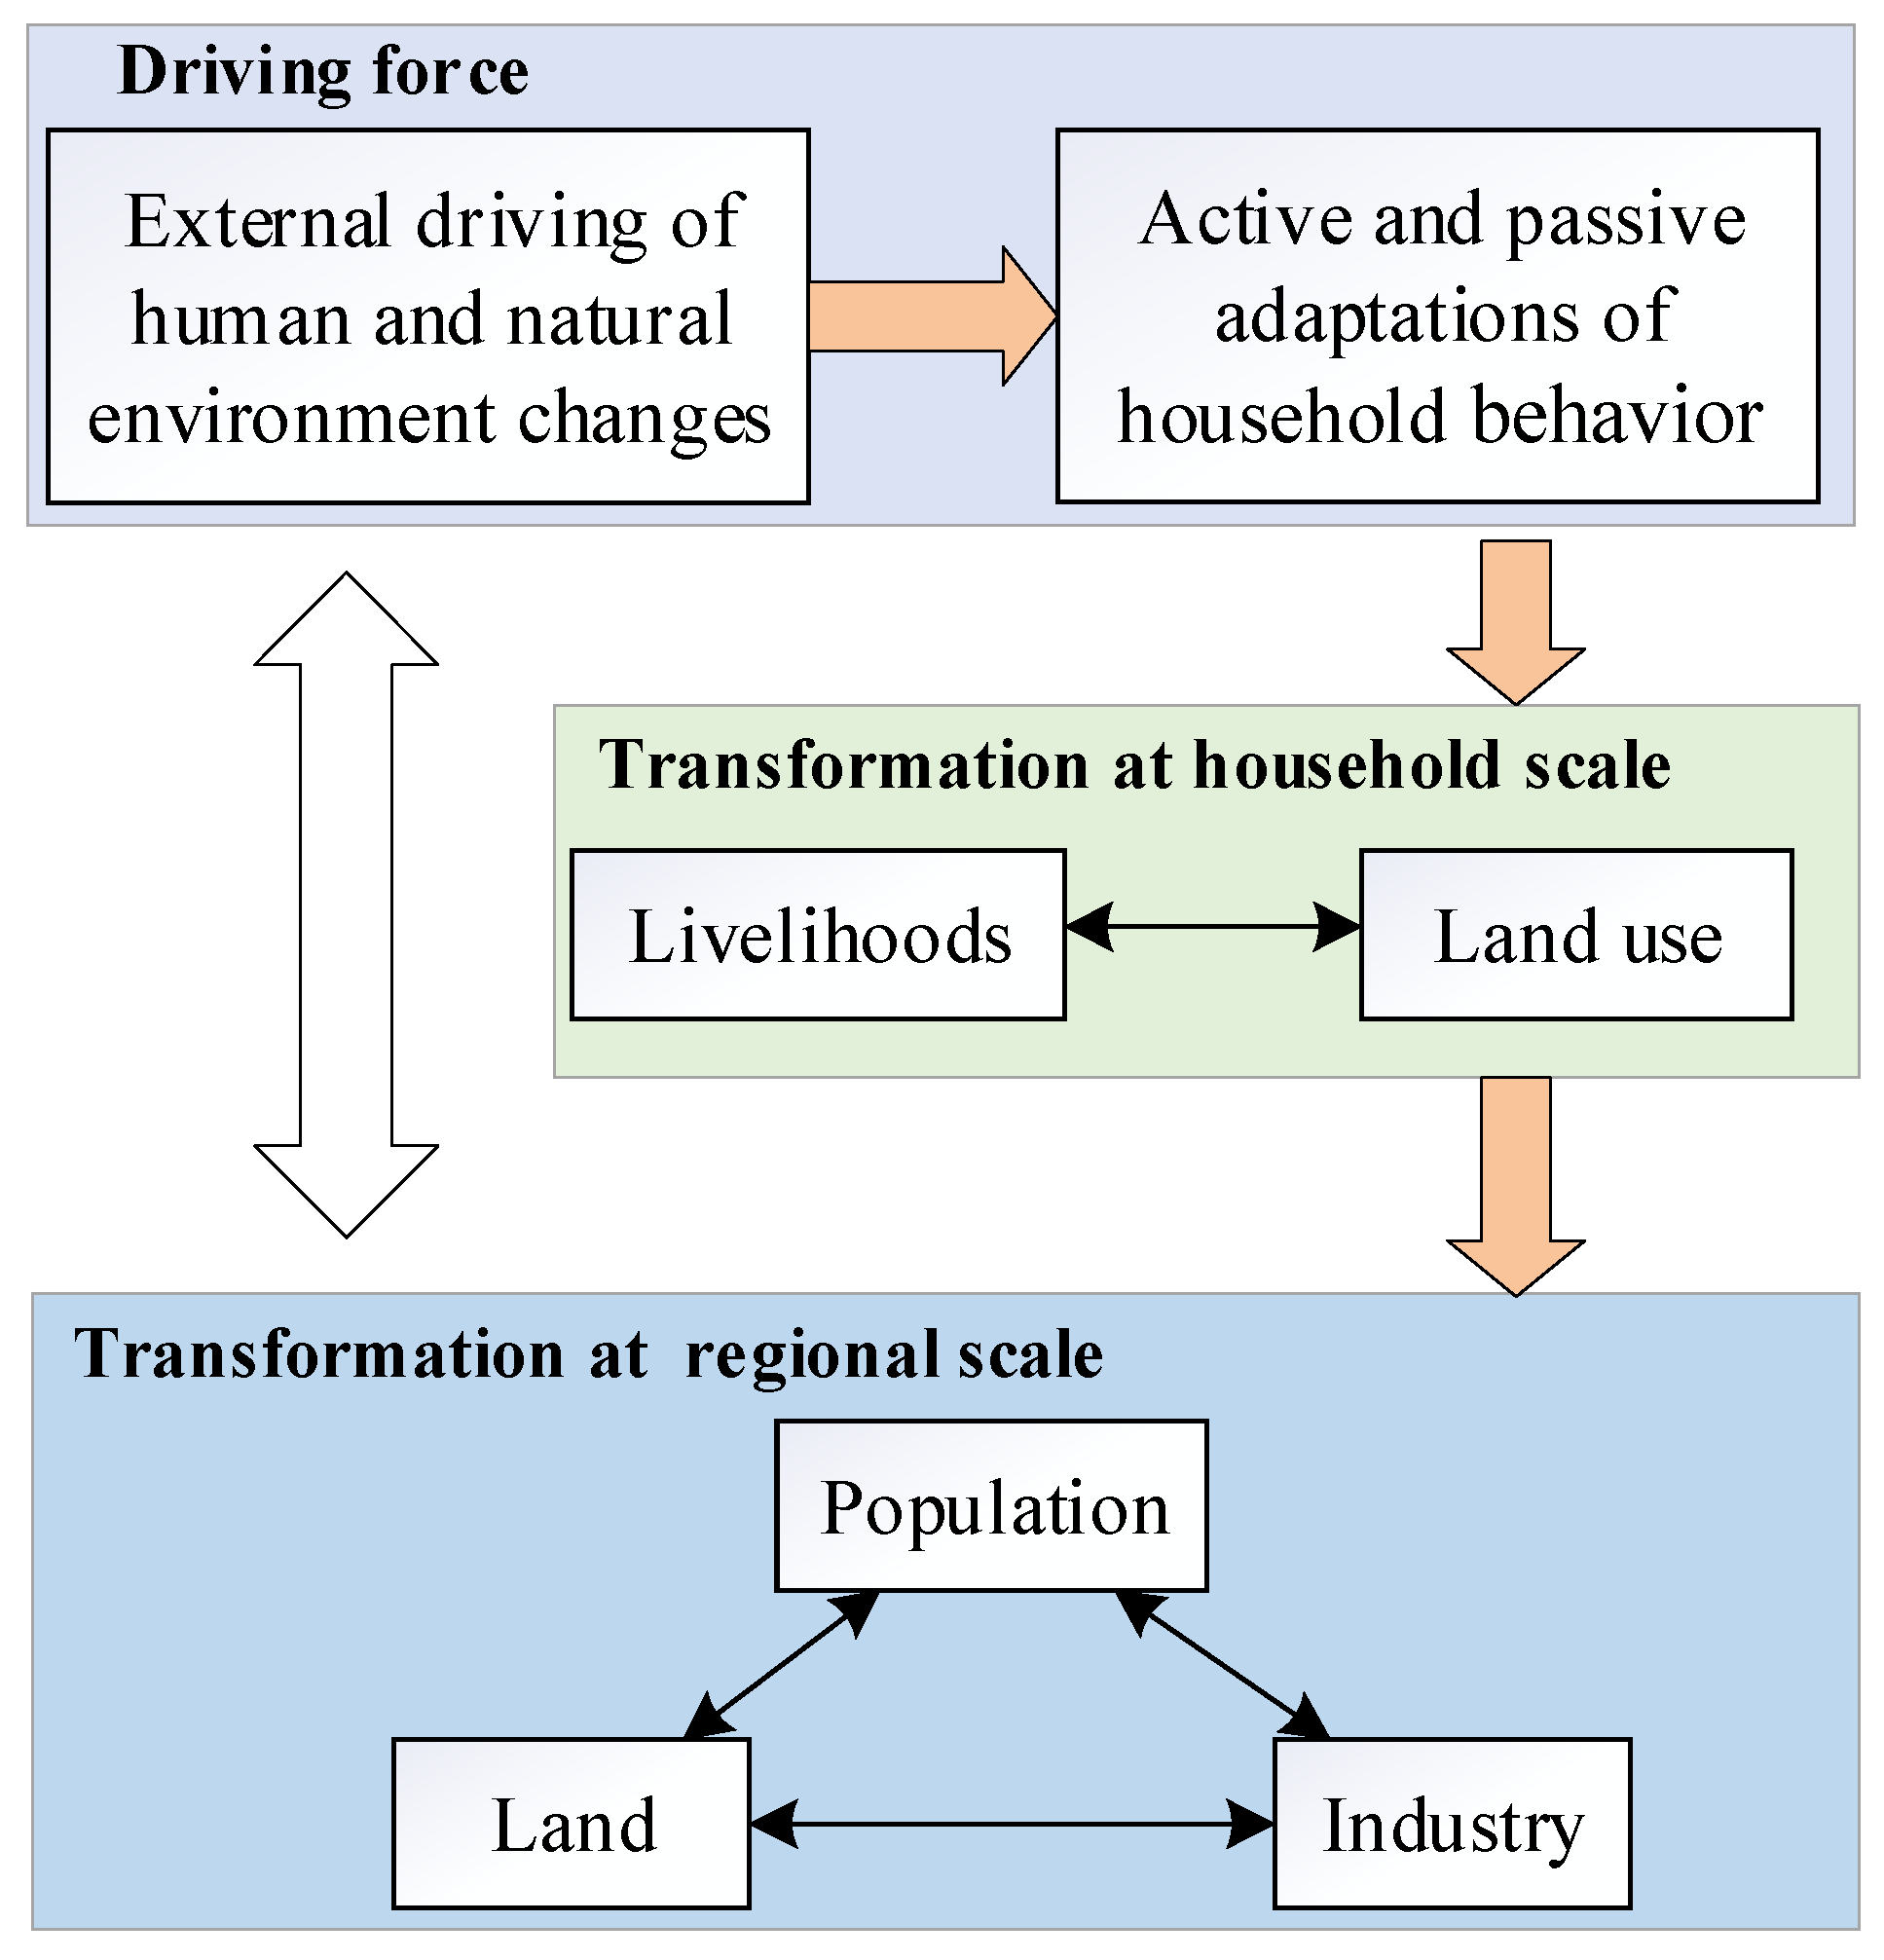
Aiming to answer above questions, we propose a conceptual model to provide a more detailed insight into the process of rural transformation, which is driven from the bottom up by the household, the smallest organizational unit in the countryside. The processes, namely, households’ livelihoods–land use, form the crux of our analysis of the process of rural transformation at the household scale. Household behavior will actively or passively adapt to the change in the external environment, and promote the changes [16,61], such as population migration and the abandonment of land. The external-environment change and the adaptations of households lead to the transformation of livelihoods–land use, which can reflect the structural changes in rural land cover, population, and industrial elements on a regional scale [9,62,63,64,65]. The transformation on the regional scale will eventually feed back to the external environment. The conceptual model is shown in Figure 1.
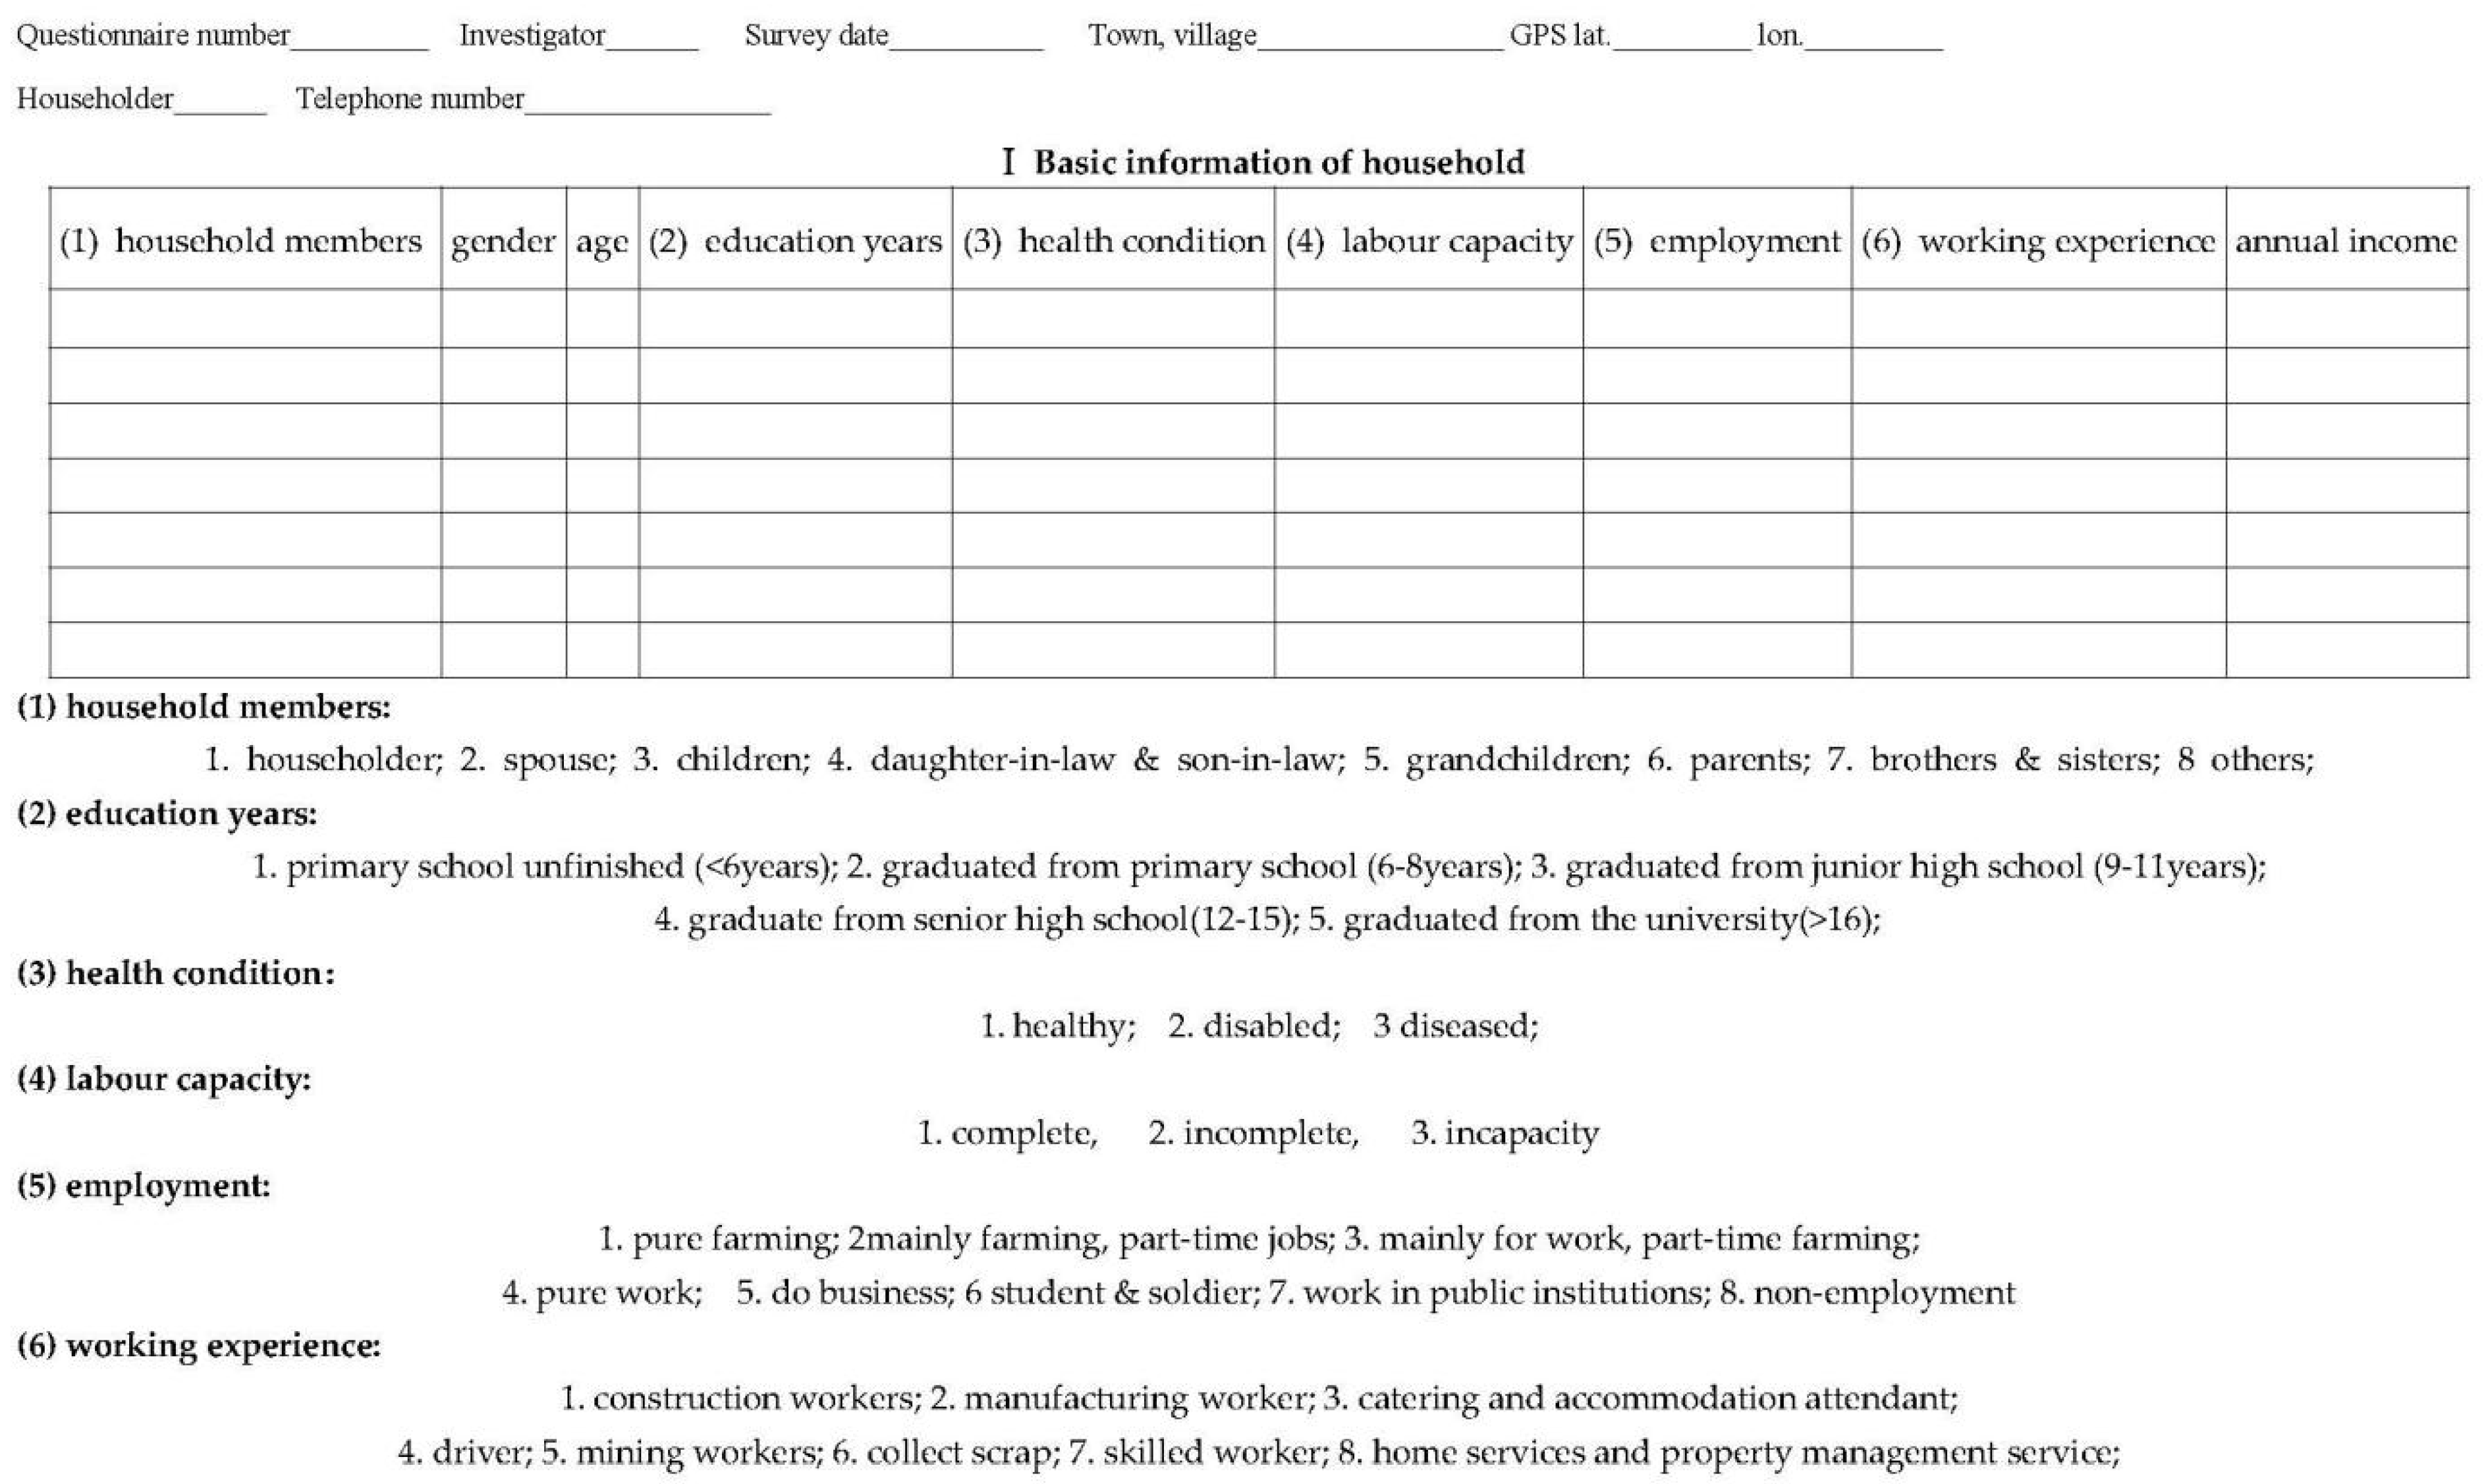
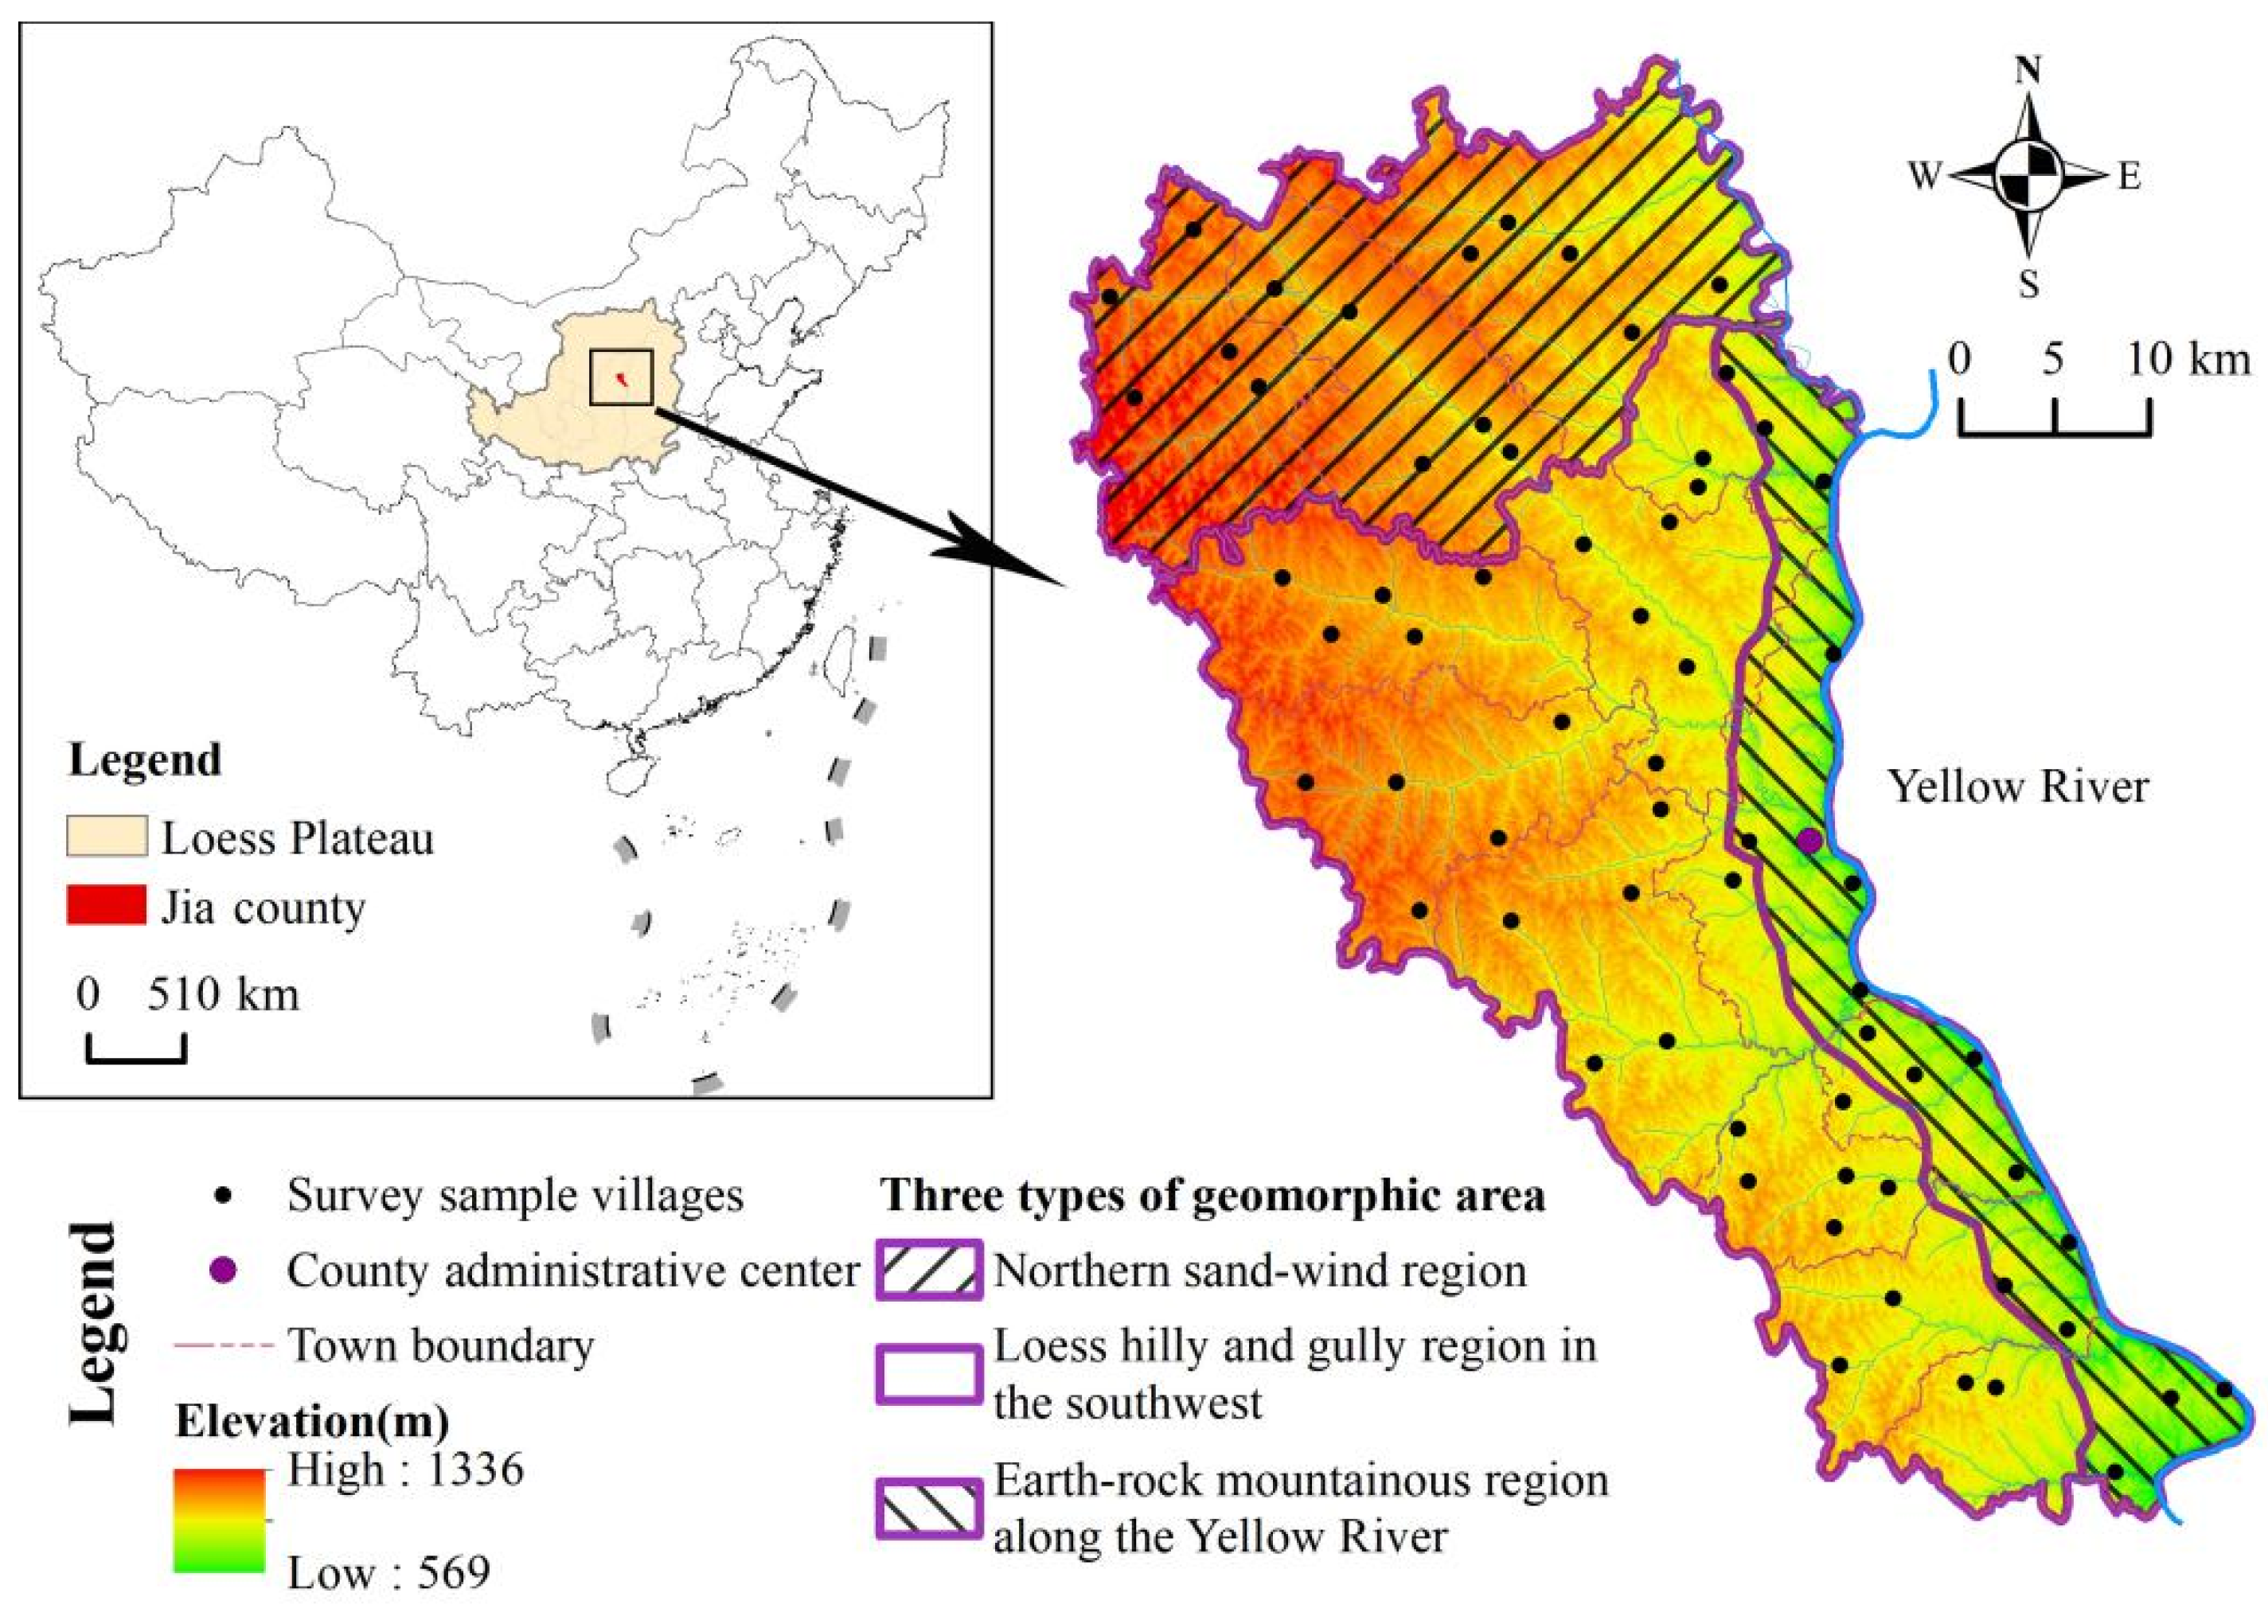
According to the above ideas, we conducted an empirical study based on a household survey to explore the rural livelihoods–land use transformation in traditional farming–pastoral rural areas. We aim to investigate the changes in households’ livelihoods–land use and the regional characteristics. In particular, what are the main external factors that affect the transformation in different periods, and how do household behaviors adapt and further influence transformation? This study took Jia County, located in the Loess Plateau, as the case area, to study the transformation of livelihoods–land use from 1980 to 2017, including key effects, household adaptations, and influence paths. We used micro-household surveys, ethnographic research, and trajectory analysis methods in order to focus more carefully on the bottom-up rural-transformation process driven by household adaptation to environmental change. The analysis focuses on three aspects. Firstly, we focus on the changes in the livelihood structure within the household and the resulting changes in the livelihood activities of different regions. Secondly, the study focuses on the change in household contracted land and the regional variation. Thirdly, as for the driving force of rural transformation, the study explores the key environmental factors influencing household behavior since 1980, and what kinds of adaptive changes occur in household behavior, thus promoting the rural livelihoods–land use transformation.

2. Materials and Methods

2.1. Study Area

The study was conducted in Jiaxian County within the Chinese Loess Plateau. The Chinese Loess Plateau, located in the range of 100°52′ to 114°33′ E and 33°41′ to 41°16′ N, with a total area of 646,200 km2, characterized by drought, fragile ecology, and poverty, and an area of soil and water loss reaching 390,800 km2, is a key practice area for ecological restoration and poverty alleviation in China [66]. Jiaxian County is located at the northern end of the Loess Plateau in northern Shaanxi, the west bank of the middle Reaches of the Yellow River and the southern margin of the Mu Us Desert, with a total land area of 2029.3 km2. Moreover, the Loess Plateau is a key practice area for ecological restoration and poverty alleviation in China. The county has jurisdiction over 12 towns, 1 sub-district office, 8 urban communities, and 330 administrative villages, with a population of 269,400 people under its jurisdiction [47]. The region is a continental arid and semi-arid climate, with an average annual temperature of 10.2 °C and an average annual precipitation of 386.6 mm, and the precipitation generally concentrates in July to September, whilst drought, flood, frost, hail, and other natural disasters are frequent [67].
The jujube industry is an important pillar of the county′s commodity economy and the main source of farmers′ livelihood. Jujube trees are the most widely distributed cash crop with local characteristics, accounting for 26.59% of the total land area as of 2017. Grain crops mainly include beans, potatoes, corn, millet, sorghum, and livestock mainly for breeding pigs, sheep, poultry, and so on.
The terrain of Jiaxian County is complex, high in the northwest and low in the southeast, crisscrossed by gullies, slopes, beams, and hills, forming three distinct areas of agricultural resources: the northern sand–wind region (NSR), the Loess hilly and gully region in the southwest (LHGR) and the earth–rock mountainous region along the Yellow River (EMR), as shown in Figure 2. The NSR belongs to the southern margin of the Mu Us Desert, covering an area of 616 km2, accounting for 30.4% of the total area of the county. This region is relatively high in elevation, ranging from 835 m to 1339 m, with light water erosion and small, short, and shallow gully density. The features of the landform are round girder shape, gentle slope, gully, and girder interval distribution. The LHGR covers an area of 1060 km2, accounting for 52.2% of the total area of the county, with an altitude of 778–1323 m. This region is intersected and divided by rivers and their branches and furrows, and has been eroded for a long time, forming a complex terrain with high pointed loess hills, steep slopes, and narrow gullies. The height difference between gullies and hills is mostly approximately 30 m, some even reaching more than 200 m. The EMR covers 352 km2, accounting for 17.4% of the total area of the county. The topography of the area is fragmented, with altitudes ranging from 633 m to 1022 m and relative heights of 375 m. Geomorphology is characterized by high mountains, mostly by the stone mountain with a thin earth cap, stone gully vertical and horizontal distribution, and the relative cutting depth of 200 m [67].

2.2. Sampling and Data Collection

The data used in this study came from a formal survey from 16 July to 2 August in 2018. According to the method of stratified random sampling, the sample towns covered 13 towns in the study area. According to the shortest travel time from village to town government, all villages in the town were divided into 5 groups by Jenks Natural Breaks Classification in ArcMap, and a single sample village was selected from each group. In turn, 5 sample villages were finally selected from each town, and a total of 65 sample villages were sampled from the study area. The distribution of sample villages is shown in Figure 2. In addition, as studying rural households living in the same village generates higher levels of homogeneity, 7 households were randomly selected from each sample village for a questionnaire survey. In this survey, a total of 455 questionnaires were sent out, of which 455 were recovered and 451 were valid, with an effective rate of 99.1%.
This questionnaire survey [68] adopted the method of recall to collect the information of each sampled household in four historical periods including the 1980s, 2000, 2008, and 2017, covering basic family information, population structure, source of livelihood, and land use, amongst others. The operation time of each questionnaire was controlled within 45 to 60 min. In the process of information collection, to ensure that the respondents’ memories would be clear and accurate and ensure the spatial–temporal comparability and accuracy of the data, the researchers guided the respondents to recall the corresponding historical period by recalling guide words and asked about the content of the questionnaire. The respondents answered the questions, and the answers were recorded by the researchers in a uniform caliber. The key events of the corresponding period were selected as the recall guide words. In particular, the recall guide words were as follows: for the 1980s, ‘the household contract responsibility system has simply been implemented’, ‘30 years ago’ and ‘1980s’; for 2000, ‘at the turn of the century’ and ‘pilot work on the project of Grain for Green’; and for the 2008, ‘Beijing 2008 Olympic Games’ and ‘the new rural cooperative medical insurance’. In addition, for the fourth period, the actual situation of 2017 needed to be answered.
The basic information of householder about the 451 surveyed households is shown in Table A1. The statistical results of livelihood and land use types from 451 surveyed rural households from 1980s to 2017 in Jia County are shown in Table A2 and Table A3. The household questionnaire template used by the research team is shown in Appendix B.

2.3. Key Indicators of Transformation in Livelihoods–Land Use

What will be the transformation process of livelihoods–land use in traditional agricultural villages, especially in the farming areas of the Loess Plateau? To explore this issue, we picked key indicators, including the livelihood activities, livelihood structures, and the typical household land use.
This study mainly considers conventional and unconventional livelihood activities in traditional agricultural areas. Conventional livelihood activities need to have the characteristic of obtaining continuous income, including traditional farming livelihood, local special agricultural livelihood, and non-farming livelihood. Four livelihood activities in Jia County were confirmed, including special jujube (SJ) livelihood, traditional farming (TF) livelihood, non-farm (NF) livelihood, and unconventional (Un) livelihood, and eight types of households’ livelihood structures in the study area were identified (Table 1).
On the other hand, the households’ land use changes as livelihood activities adjust (Wu et al., 2022). In this study, the data on households’ land use came from the actual use of the contracted land of the 451 surveyed households. Jia County began to implement the household contract responsibility system in 1980, which means that the land is distributed to the household, who independently manage and produce, and all of the operating income belongs to the household except for the national taxes. Based on the field survey, we identified five types of households’ land use (Table 1).

2.4. Trajectory Analysis Method in Livelihood Structure

Trajectory-based detections of time series can be described by codes in the form of figures or letters for each unit in the vector layer to track the state changes [23,69]. As numeric codes are convenient for operations and calculations in ArcGIS software for trajectory-computing models, digital coding was applied to obtain the changing trajectory of livelihood structure. Then, the numbers 1 to 8 were used to sequentially represent types Code 1 to Code 8 for each time layer node in the trajectory analysis. Trajectory codes for each sample were computed as below:
Y i = ( G 1 ) i × 10 n 1 + ( G 2 ) i × 10 n 2 + ( G n ) i × 10 n n
where Yi represents the calculated code of sample i in the trajectory-based detection layer; n represents the number of time nodes; (G1)i, (G2)i, and (Gn)i represent the codes of the types of livelihood structure at each time node at the given sampled household.
The trajectory-based codes (e.g., 3333 and 1224) of each sampled household were calculated automatically. For example, ‘3333’ means that the households’ livelihood structure of the given sample had always maintained type 3 from 1980 to 2017. Meanwhile, ‘1224’ means that the family livelihood structure of the given sample was type 1 in the 1980s, then shifted to type 2 in 2000, remained at type 2 in 2008, and, finally, switched to type 4 in 2017.

2.5. Ethnographic Approach

This study draws on ethnographic research conducted from October 2017 to August 2018 in 75 sample villages in Jia County. We conducted semi-structured [70] and oral historical interviews [71] with key people. The interviews were assisted by the village head to provide a list of key people; then, the researchers randomly sampled 1 to 2 respondents from the list in each sample village. In this field work, 113 key people were interviewed and recorded, including ordinary farmers, village administrators, rural elites, and respected elders. Among 113 respondents, 89 were male and 24 were female, with an age range of 45–75. The interviews covered three questions. Firstly, how has the village or residence changed in terms of its natural environment, land use, and sources of livelihood since 1980? Secondly, the reasons for the above changes: have the farmers or local governments contributed to the changes? Thirdly, how can families adapt to the above changes in the village? How are the adverse changes dealt with?
Each interview ranged from about 0.5 to 1 h in length and was audio-recorded for preservation and analysis. The interview was conducted in Chinese; then, the interview recordings were sorted into Chinese texts to form an interview record that could be extracted at any time, with a total of 61,000 words. Next, the research group conducted open coding of the text, and the coding sequence was “interview sample serial number—question serial number—answer content sentence serial number”. Based on the coding text, the researchers sequentially summarized the characteristics of livelihoods–land use transitions, key effects, and household behavior adaptations at three stages. It is worth noting that the interview materials quoted in this article were translated from Chinese into English by the researcher.

3. Results

3.1. Transformation in Livelihoods–Land Use

3.1.1. Temporal–Spatial Changes in Rural Livelihood Activities

The temporal and spatial changes in livelihood activities have the following characteristics. First, livelihood activities in the whole region and three different regions followed a similar trajectory from the 1980s to 2017. As for the SJ livelihood, the proportion continued to rise, reaching the highest value in 2008 and then plunging. As for the TF livelihood, the proportion increased from the 1980s to 2000 and has continued to decline since then. As for the NF livelihood, the proportion showed a gradual increase from the 1980s to 2017, and was more than half of households in each region in 2017. For the Un livelihood, the proportion experienced a trajectory of initially declining and then increasing (Figure 3).
Second, the spatial distribution of the share of livelihood activities varied greatly. In the whole region and LHGR, the TF livelihood activity consistently maintained the highest share in the 1980s and 2000. Thereafter, the SJ livelihood and NF livelihood occupied the highest share in 2008 and 2017, respectively. In NSR, the TF livelihood has always maintained the highest share, the NF livelihood eventually moved up to the second rank, whilst the NF livelihood eventually moved up to first place in the LHGR and EMR. In EMR, SJ livelihood activities have always occupied a larger share, especially in 2017, the where they account for 42.5%, whilst the share is extremely low in the NSR and LHGR. This is due to the extreme shortage of farmland resources in the EMR and that dual-aged households can only rely on jujube forests for their livelihood.

3.1.2. Interconversion of Farmland and Forestland: Spatial Variation

The conversion tracks of forestland and farmland are similar in the whole region and three regions, and the forestland was dominated by jujube forest all of the time (Figure 4). The conversion from farmland to forestland was approximately 30% in stage 1, and approximately 10% in stage 2. Since 2008, the ratio of forestland to the farmland in the whole region and three regions has remained stable, of which the ratio is approximately 2 to 3 in the NSR, slightly higher than 1 in the LHGR, and approximately 4 to 1 in the EMR, while the proportion of jujube forestland decreased by 0.5% in the whole region even though the forestry protection policy prohibited the unauthorized felling of forest land.
However, the proportion of forestland and farmland in different regions varied greatly. In the NSR, the proportion of farmland was always higher than that of forestland, and the proportion of farmland in the 1980s was as high as 95.58%. In the LHGR, in 2008 and 2017, the proportion of forestland was slightly higher than that of farmland. In the EMR, the ratio of forestland to farmland is always much higher than that of other regions; and the forestland is almost entirely jujube trees. In the 1980s, the proportion of forestland was also high at 43.02%. In 2008 and 2017, forestland accounted for more than 80%.

3.1.3. Spatial Differences in Uncultivated Land and Growth Sources

There was significant growth of uncultivated land in the whole region and three regions, but the composition varied greatly (Figure 4). From the 1980s to 2000, uncultivated land in the EMR increased by only a modest 2.05%. Benefiting from the construction of the Three-North Shelterbelt Program initiated by the state in 1980, ecological shelterbelts were built along the traffic road in the NSR and LHGR; therefore, the uncultivated land in the NSR and LHGR increased by 16.74% and 6.9%, respectively, almost all of which was ecological forest.
From 2001 to 2008, SJ livelihood activities gained the best income, and almost no farmers gave up the cultivation of jujube forests. In the EMR, the proportion of jujube forests reached 78.55% and, accordingly, the growth of uncultivated land was extremely small, only 2.29%. In the NSR and LHGR, the uncultivated land increased by 6.43% and 11.42%, respectively, and a small amount of abandoned farmland appeared, but the ecological forest was still the main source.
From 2009 to 2017, uncultivated land increased substantially and now accounts for about half of contracted land. In the NSR and LHGR, the uncultivated land increased by 18.18% and 35.65%, respectively, and mainly came from uncultivated jujube forest and abandoned farmland. Meanwhile, in the EMR, the uncultivated land increased by 38.5%, with more than 80 percent coming from uncultivated jujube forests.

3.2. Evolution Trajectory in Households’ Livelihood Structure

3.2.1. Sankey Diagram of the Evolutions

Adopting the trajectory-computing method, there are actually 260 types of trajectory in the households’ livelihood structure shift from the 1980s to 2017 (Figure 5). The results showed that only 7.98% of 451 households had no changes in livelihood structure, amongst which 21 households maintained the type of TF-income-dominated. Among the trajectory of changing livelihood structures, the largest category was track 3336 with 17 households. Both track 1224 and track 3373 have seven households, whereas track 1154, track 1554, track 3376, track 3776, and track 4554 all have six households. Figure 5 shows the Sankey diagram of the changes in the livelihood structure of 451 households and the top 10 tracks in each stage.

3.2.2. Stage Characteristics of Livelihood Structure Change

In the 1980s, the main types of livelihood structure were the TF income type and barren type (Table 2). From the 1980s to 2000, 44.79% of the households maintained their original livelihood structure, amongst which the majority of the households kept the TF income type or barren type. In addition, the majority of households increased the livelihood activities of SJ, NF, or TF, whilst the number of the barren type decreased significantly (Figure 6). The share of barren type decreased by 19.29%, and the joint income of TF and SJ increased by 13.3% in this stage. As a result, in 2000, the TF income type remained the largest type, followed by the joint income of TF and SJ.
From 2000 to 2008, 42.13% of the households maintained the livelihood structure of 2000. In addition, households generally increased the SJ activities, thus shifting from the TF income type or NF income type to the joint type with SJ income. At the same time, some households changed from the joint type or barren type to the SJ income type. As a result, by 2008, the SJ income type occupied the largest share, followed by the joint income of TF and SJ.
From 2008 to 2017, only 23.95% of the households maintained the livelihood structure of 2008, amongst which more households maintained the TF income type and the NF income type, while most households reduced SJ activities or increased NF activities. Notably, 35 households changed from the SJ income type to barren type, and 15 households changed from joint income of TF and SJ to barren type. As a result, by 2017, the NF income type occupied the largest share of livelihood structures compared with less than 8% in the 1980s and 2008. Barren type moved up to a second place, with its share jumping 16% from 2008, whilst the comprehensive type decreased by 5%.

3.3. External Environment Change and Household Behaviors

According to the materials of semi-structured and oral historical interviews, households actively or passively adjusted their behaviors in adaptation to the external environment change, and their livelihoods and land use were changed accordingly, thus promoting rural transformation (Table 3). In addition, it was found that market attraction and ecological restoration policy in stage 1; market attraction, welfare policy, urbanization, and basic education planning adjustment in stage 2; and climate change, jujube unmarketable, and rural hollowing in stage 3 were the key effects, respectively.

3.3.1. Government Policy and Household Behaviors

Driven by the projects of ecological protection and restoration [72], households actively or passively responded to the government policies, and converted farmland to jujube forest or converted farmland to ecological forest in stage 1 and 2. Firstly, the Three-North Shelterbelt Program was started in 1980. Furthermore, a total of 2800 hectares of ecological shelterbelts were completed in the research area. Secondly, with the development of rural commodity production, the local govt. listed jujube production as an important pillar industry of the county’s commodity economy and vigorously developed it. Additionally, a plan was devised to build a production base of 35,000 hectares of jujube in Jia County in 1994 [67]. Third, the central govt. implemented the ‘Grain for Green’ project since 1998, and the central govt. has focused on implementing projects to protect natural forest resources since 2000. Owing to the planting history, optimistic market, suitable climate, and other reasons, jujube trees were selected for the forest project as the main economic forest. In addition, the local govt. has implemented the jujube seedling subsidy policy and the central govt. began to implement the rural tax reform in 2002, and the agriculture special tax and agricultural tax were canceled in 2004 and 2005, respectively. Official figures show that a total of 1400 hectares of farmland were turned into forest, 133 hectares of grass, and 280 hectares of barren mountain greening in 1999, 13,000 hectares of forest resources were managed and protected in 2000, and more than 1000 hectares of forests were closed off for cultivation from 2002 to 2005 [67].
In addition, the Family Planning of “Encourage couples to have only one child” and the transfer of labor force have greatly reduced the size of rural basic education students. In 2005, the plan for adjusting the layout of primary and secondary schools in Jia County was formulated and implemented, and 271 rural primary schools were closed or merged [67]. Since then, the number of primary schools in rural areas has been further reduced from 65 in 2009 to 25 in 2017, with most of the remaining schools located in township centers. After the nearby schools closed, local families adopted two modes in access to education, that is, either rented houses around the schools, accompanied by family members to take care of children, or chose to move to cities for the long term with their children aiming to obtain better educational resources. As a result, the combination of schools closed and the loss of students formed a vicious circle, and ultimately aggravated the hollowing out of rural areas. Additionally, the livelihood of households was changed to NF livelihood, thus transitioning the land use from cultivated land to abandoned land.

3.3.2. Market Change and Household Behaviors

In stage 1 and 2, the jujube market prospered and the market purchase price was high, and purchase price in stage 2 remained at approximately 2 CNY/kg, up to 6 CNY/kg, whilst the per-capita disposable income in rural China was CNY 3254.9 in 2005. Attracted by positive markets, farmers spontaneously changed from the TF livelihood to the SJ livelihood, or generally increased the SJ livelihood. After the large-scale planting of jujube trees in stage 1, the jujube can yield a large amount stage 2. It can be considered that the income of the SJ livelihood in stage 2 was the most considerable due to the high yield and high unit price. In this context, farmers continued to return farmland to forest, and increased the investment and management of jujube forest, showing the behavior of excessive weeding, even the abuse of herbicides, and over-fertilization on jujube forest.
However, by stage 3, the jujube market changed dramatically. In the last five years, the market price of jujube fruit, generally, has been approximately 0.4 CNY/kg, whilst the per-capita disposable income of rural China in 2017 was CNY 13,432. One possible reason is that the large-scale planting of jujube trees in the first two stages led to the oversupply of jujube in the current market. In addition, under the competition of high-quality jujube in Xinjiang, the jujube of Jia County is at a competitive disadvantage in the market, leading to a sharp decline in the purchase price and continuous unsalable, which has been confirmed by the management staff of the Forestry Bureau. In this context, most households gave up management and fertilization, and even gave up picking jujubes, removed jujube from households’ livelihood activities, and abandoned jujube forest land.

3.3.3. Climate Change and Household Behaviors

Livelihood adaptation and transitions in most agricultural areas are conditioned by climate changes [35,38]. September to October is the mature period of jujube. The excessive rainfall in the mature period will lead to mildew and yield reduction in jujube, resulting in great losses to jujube farmers. The study area used to have the climatic characteristics of “nine droughts in ten years”. Jujube trees are drought-tolerant plants, and jujube fruits were abundant before 2010 due to adaptation to the climate. For this reason, the local govt. chose jujube as an economic tree for the ‘GfG’ project.
The annual precipitation and the precipitation in the mature period of jujube fruit in Jia County showed an obvious upward trend since 1980. According to the precipitation data provided by Jia County Meteorological Bureau, the average annual precipitation in stage 3 is 572.76 mm, 185.43 mm higher than that in stage 1. The higher the precipitation in the mature stage, the higher the rotten rate of jujube pulp, whereas the annual precipitation in the mature period remained above 100 mm from 2007 to 2017. According to a survey of 358 households with jujube forests, the rot rate of jujube reached 87.49%, amongst which 183 households had a rot rate of more than 90%. On the other hand, increased rainfall was conducive to the growth of traditional crops, and agricultural income was in line with expectations. The head of Liujiawa village pointed out that ‘returning farmland to forest has caused climate change. We used to have little rain here, but now it rains more in autumn. At harvest time, the dates will rot when they meet rain’. Some residents have repeatedly mentioned, ‘When it rains a lot in autumn, the dates will rot...This has not been ten years, the climate changed suddenly, you should know more about the climate here, jujube trees cannot adapt to the current climate.’
In the context of climate change, some farmers gave up managing jujube forests, gave up picking jujubes, and gave up the SJ livelihood. Notably, the increased rainfall is conducive to the growth of traditional crops, which urges farmers to cut down jujube trees and turn them into farmland. There are even a small number of households violating the policy of GfG, the unauthorized cutting of jujube forest land. In the survey, 58 families admitted to the practice.

3.3.4. Urbanization Shock and Household Behaviors

Under the shock or attraction of urbanization, the rural population continues to lose; households showed the behavior of abandoning farmland, which promoted the transformation of land use and livelihood, such as changing to non-farming livelihood, promoting the cultivated land to abandoned land.
Since the 21st century, China’s urbanization process has accelerated, and urban construction has provided a wealth of jobs. Furthermore, rural transport accessibility has gradually improved under the ‘village to village’ project, and the increase in employment opportunities has attracted the rural population to migrate to cities spontaneously. On the other hand, the local govt. actively responds to the attraction of urbanization to conduct labor skills training and organize surplus rural labor to turn into secondary and tertiary industries. In 2004, the local govt. set up the ‘Sunshine Engineering Office’ in the agriculture bureau, set up two training bases of agricultural and Guangzhou schools and a vocational education center, opened the green certificate project, practical technology, and the cross-century young farmers training class. The labor export of the county amounted to 72,000 people, accounting for 26% of the total population of the county in 2004 and 2005 [67]. Especially in stage 3, the loss of the young population and the leaving behind of the old and the weak are the important characteristics of the current rural depression and the driving factors of rural transformation.
A village director, who returned from the city in recent years and has contracted most of the village′s farmland, points out: ‘Nowadays, the left-behind elderly no longer have the ability to cultivate land...For four or five years only one child in the village has attended the local school. Ten years ago, we went to Yulin to work, our son also went out with us...I came back (village) to take care of my mother, and if I didn’t have to take care of the elderly, I would always work outside’.

4. Discussion and Conclusions

4.1. Influencing Pathways of Rural Transformation

Since 1980, rural areas on the Loess Plateau have gradually changed from a traditional backward and closed environment to an open, convenient and abundant life [47]. However, under the impact of urbanization and other factors, a large number of the rural population has been lost, and villages have been gradually hollowed out and depressed, which are in urgent need of revitalization. At the same time, as for the natural ecological environment, it has gradually improved from the bad state represented by serious soil erosion and rampant sandstorms to the suitable state of rich vegetation and clean air; now, it is moving toward the spontaneous recovery of the ecological environment. This study provides evidence for understanding how to realize rural transformation in traditional agricultural areas where urbanization and industrial transformation are not significant [73]. Different from previous studies that identified rural transformation through land urbanization, population urbanization, and industrial non-agricultural transformation [9,23,54,74,
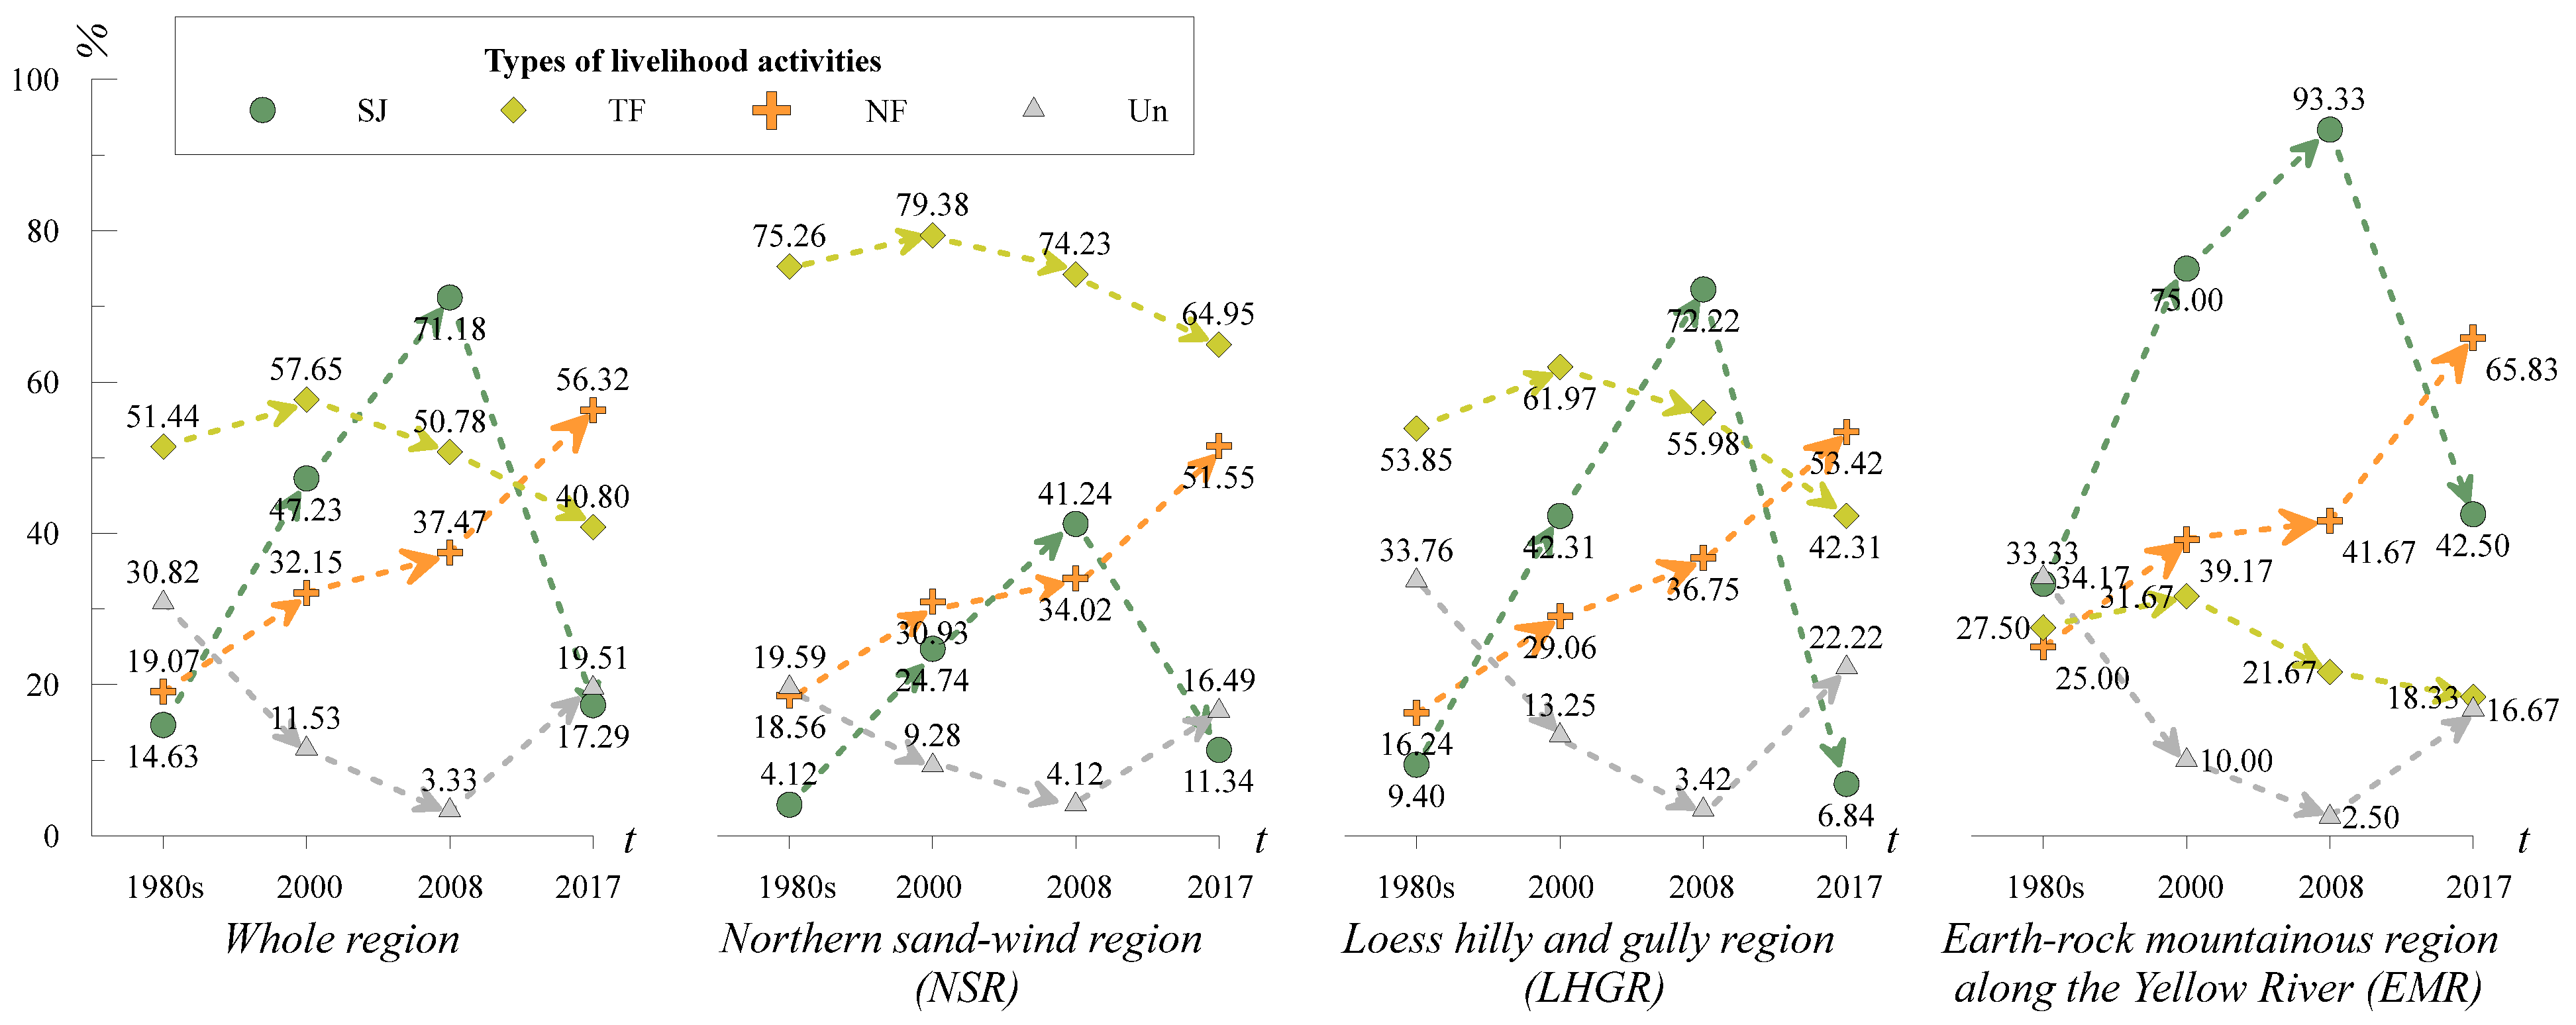
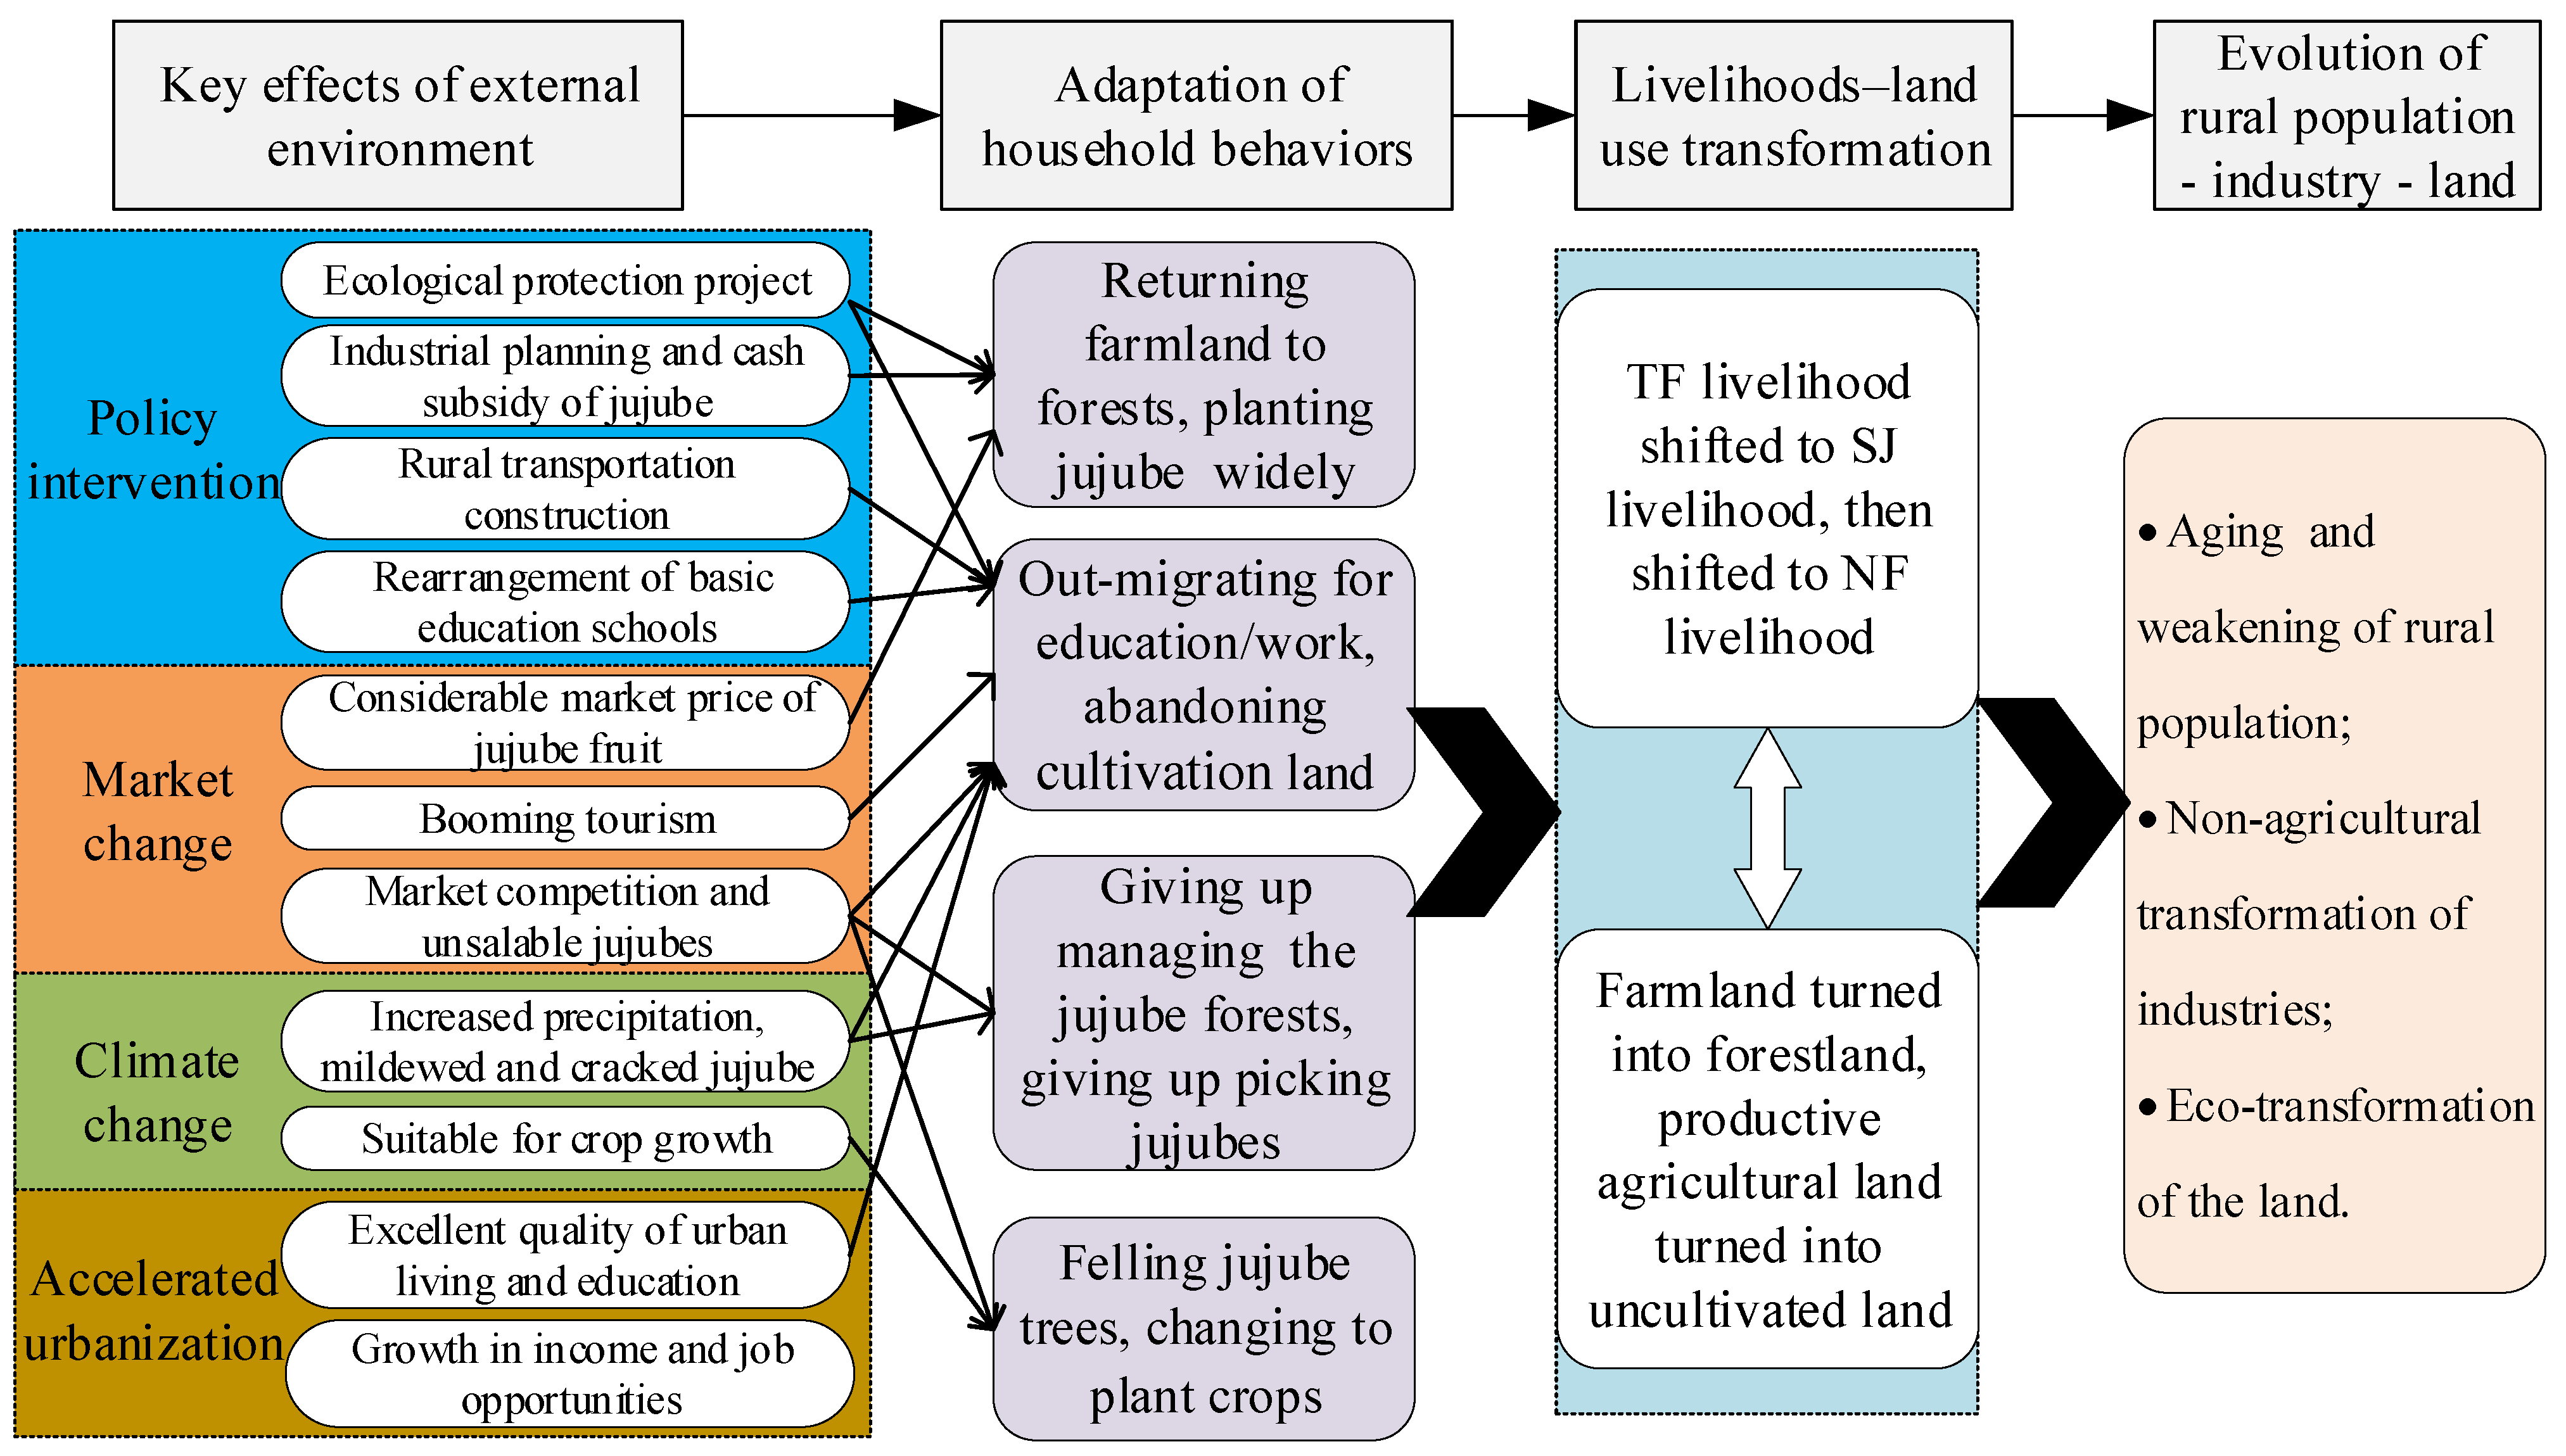
75], this study confirmed that there are clear transformation directions in traditional agricultural areas, namely, the non-agricultural transformation of rural livelihood and eco-transformation of land use. Such transition paths are usually hidden by official statistics, but this study provides evidence of transitions through household livelihoods–land use changes. In addition, although the foundation and range of the livelihoods–land use transitions have spatial differences, we can still find clear driving paths of rural transformation, which is consistent in the NSR, LHGR, and EMR areas, as shown in Figure 7.
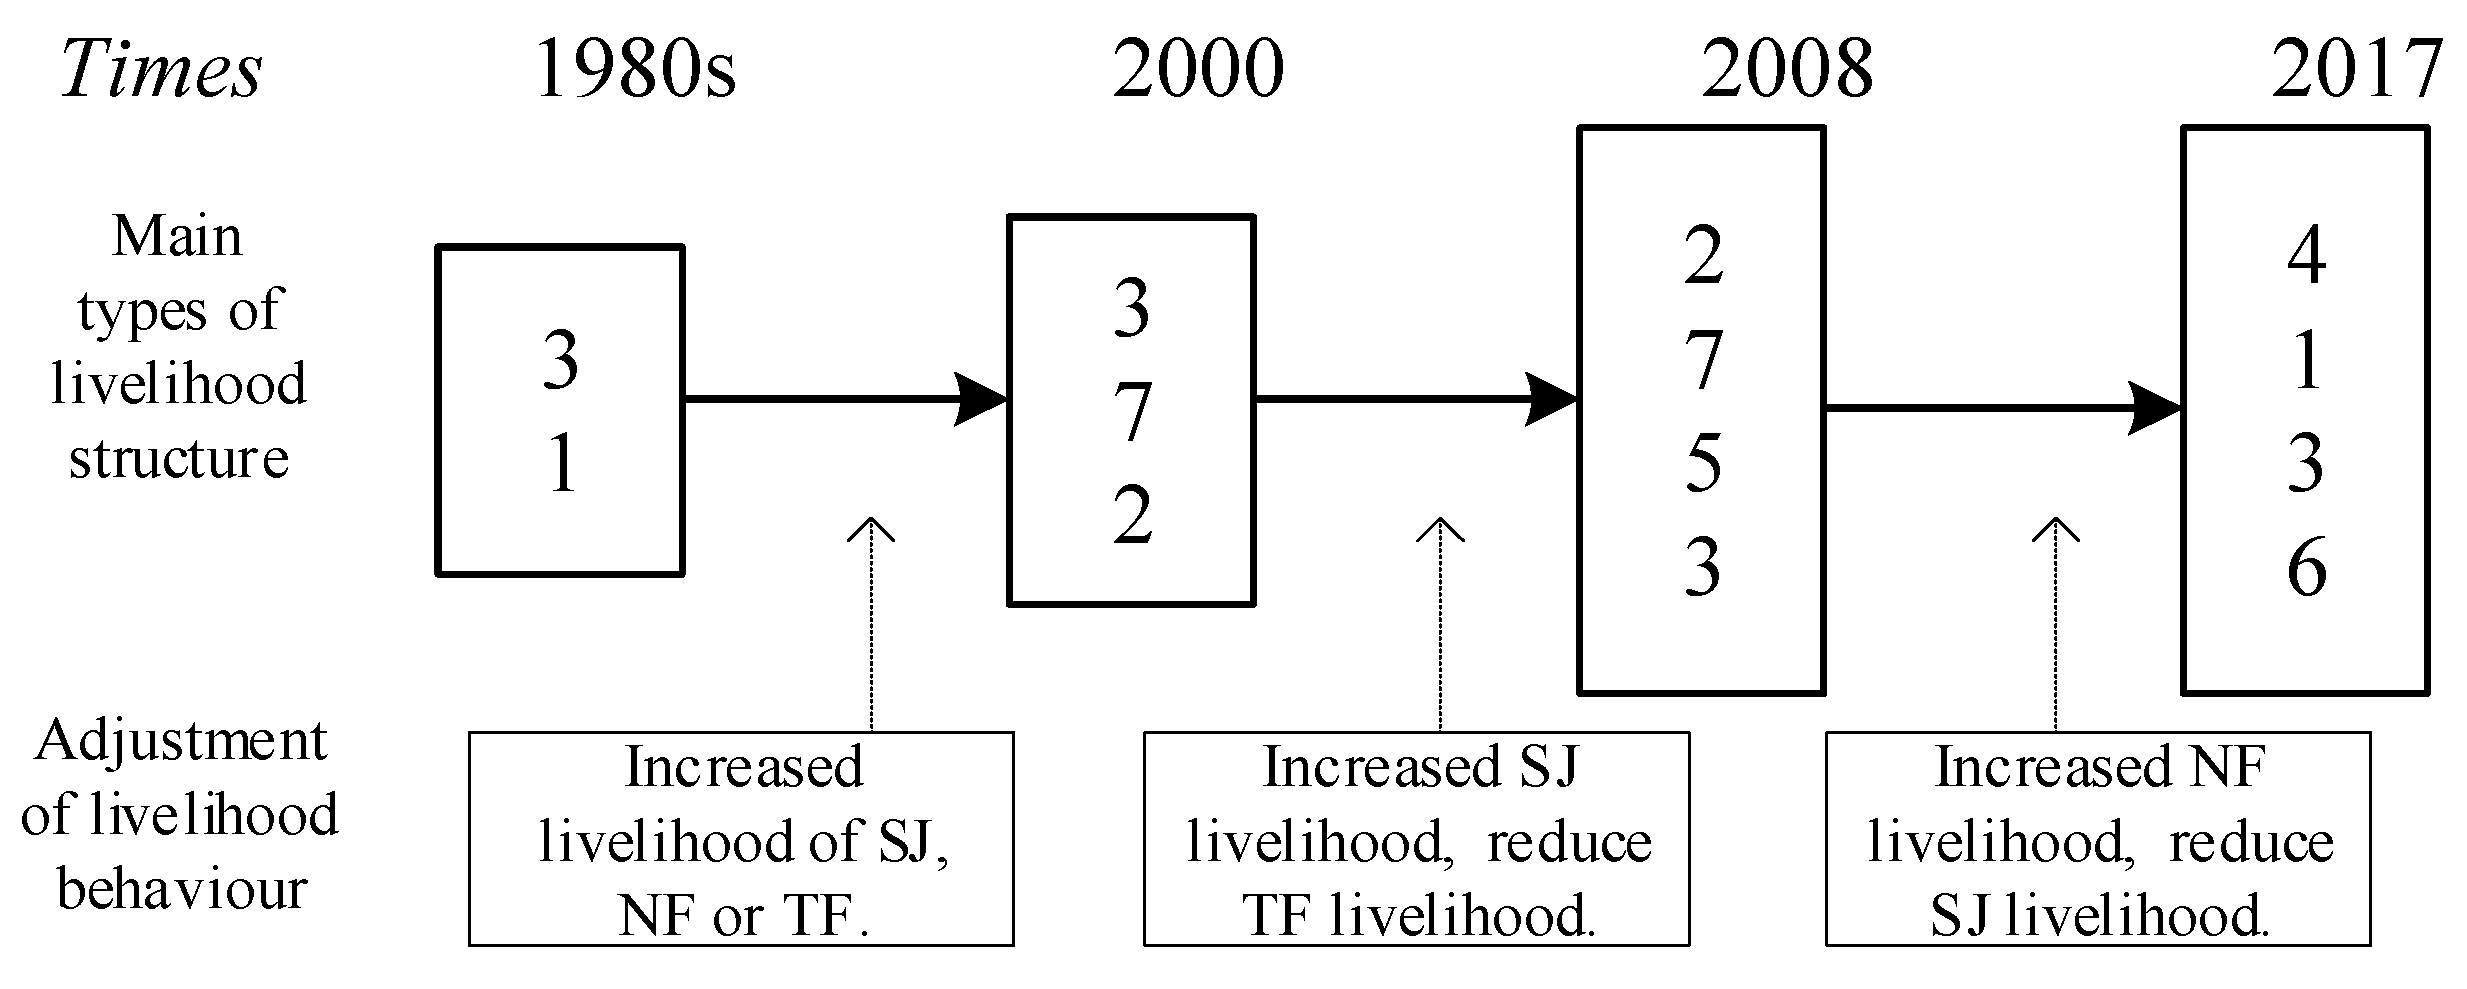
Since 1980, national and local govt. policies, climate change, market change, and regional urbanization are the key forces affecting household behaviors in traditional agricultural areas. Subsequently, household livelihoods and land use behaviors adapt to the changes actively or passively, such as returning farmland to forest, widely planting jujube, out-migrating for work, giving up jujube management, and, ultimately, leading to the transformation of households’ livelihoods–land use. Finally, the local livelihood showed a transition trajectory from the TF livelihood to SJ livelihood, and then to the NF livelihood; the local land use showed a transition trajectory from farmland to forestland, and from productive agricultural land to uncultivated land. The transformation of livelihoods–land use leads to the evolution of industry and population at the rural regional scale, which is mainly manifested as the weakening of the rural population, the non-agricultural transformation of industry, and eco-transformation of the land.

4.2. The Gap with Green Transformation

Green transformation emphasizes reducing overexploitation of natural resources and environmental degradation [76], whilst the process of non-agricultural transformation and eco-transformation in the study area coincide with the process of green transformation to a certain extent. In the 1980s, the study area was characterized by drought, frequent sandstorms, and extremely low forest proportion. Between 1980 and 2000, under the national ecological restoration project, farmers actively responded to the call of govt. policies, and switched from a livelihood in traditional farming and animal husbandry to a jujube livelihood on a large scale, and from farmland to jujube or ecological forest land. At this stage, the forest began to rebuild, and soil and water conservation achieved important results. Between 2001 and 2008, encouraged by the market, farmers began excessive cultivation of jujube forests, which was mainly manifested by the frequent application of chemical fertilizers, pesticides, and herbicides, followed by obvious problems of fertilizer and pesticide flooding and the destruction of meadow vegetation in the countryside. Of course, due to the afforestation project, the sandstorm disaster has been significantly reduced in stage 2. Between 2009 and 2017, when precipitation increased and the jujube market cooled, the natural ecosystem also showed the simultaneous occurrence of vegetation restoration and forest damage due to the different adaptation behaviors of farmers. The former is derived from behaviors of abandoning jujube forest or transforming into non-agricultural livelihood activity, whilst the latter originated from the behaviors of a few farmers felling jujube forest and planting crops instead. In addition, at the current stage, most of the ecological forests have notably exceeded the vigorous growth period of 5–10 years, and the ecological and economic concurrent forestry such as jujube has been degraded to varying degrees, gradually losing the original ecological protection benefits [77]. Additionally, although carbon storage has increased due to afforestation, this also reduces the water yield supply and exacerbates the water shortage on the Loess Plateau [46]. The restoration projects of degraded forests and the projects to balance water and soil resources should be urgently implemented.
On the other hand, a gap continues to exist between rural transformation and the goals of green transformation, such as poverty reduction, robust livelihood, and rural prosperity [76]. Different from crop planting or animal husbandry, forestry operation has a long operation cycle and poor flexibility. Therefore, when disturbances occur, the livelihood of farmers relying on forestry will become unsustainable and difficult to adjust in a short time. Since 1980, the jujube industry has experienced a process from growth and prosperity to decline, and farmers have also experienced a transition from the TF livelihood to rely on the SJ livelihood, and finally lost confidence in the SJ livelihood. By 2017, the share of the livelihood structure with the barren type reached 19.51%, an increase of 16% compared with 2008, and the share of the comprehensive type decreased from 9.66% in 2008 to 4.66%. At the same time, the livelihood diversity index decreased from 2.07 in 2008 to 1.42, both lower than the value in 2000.
Rural–urban migration and transformation, in a positive sense, can generally increase household income, help narrow the gap between urban and rural areas, and promote urban–rural integration [9,15,18]. However, urbanization, counter-urbanization, and transformation have caused rural decline and inequality to a certain extent [13,78,79,80], especially in areas with a monotonous economic structure, which is manifested in the coexistence of population urbanization and a hollowing out of villages, the aging and weakening of the rural resident population, and the fragmentation of the agricultural landscape [39,47,81,82]. This process has been highlighted in the studies at the village level, whereas it is often ignored at the macro-scale [80,83]. In fact, the transformation on the macro-scale, such as the non-agricultural transformation of industry and the ‘citizenization’ of population, are precisely based on the phenomenon of labor loss and population loss in rural communities. It is worth noting that some scholars pointed out that rural structural transformation will lead to further divergence of economic and health inequalities in the future, such as reducing families’ access to healthy food and increasing the risk of obesity and malnutrition [84].
We also pay attention to the transformation process of other agricultural regions on the Chinese Loess Plateau. Most rural communities show the characteristics of green transformation, such as reduced community dependence on food and subsidy income, diversified livelihood strategies, and improved environmental indicators [32,64,77,85]. In the Yangou watershed, under the influence of agricultural practices such as building terraced fields, returning farmland to forest land and grassland, and expanding orchards, almost all sloping farmlands were replanted, and the orchard area increased sharply; furthermore, the percentages of income for fruit sales and sale of labor in total income have increased dramatically [32]. In the apple eugenic belt in the central part of the Loess Plateau, as the local government widely promoted apple planting in the early 1990s, the livelihood of rural households has also undergone a process from traditional agricultural to apple planting and then to non-agricultural [60]. Moreover, the increased precipitation in autumn had no significant effect on the growth of apples, and the region did not show the characteristics of abandoning the apple-planting livelihood and apple land. However, it is worth considering whether farmers will significantly shift to non-agricultural livelihoods or families will fall into poverty if some factors render the apple-related livelihood to be unsustainable in the future. In November 2020, the General Office of the State Council of the People’s Republic of China issued the Opinions on Preventing the ‘Non-Grain Conversion’ of Cultivated Land to Stabilize Grain Production, explicitly prohibiting the occupation of permanent basic farmland for the forestry and fruit industry, which has a certain restriction on the expansion of apple planting scale. In addition, apple orchards currently occupying permanent prime farmland may need to be gradually converted into food crops in the future. Therefore, in the context of the policy of ensuring food security, the issues of green transformation and livelihood vulnerability of forestry communities deserve researchers’ attention.

4.3. Policy Proposals in Terms of Ecology, Livelihood, and Industry

In 2018, the Chinese government proposed the ‘Rural revitalization strategy’. Since then, the future of rural areas and the path of rural-transformation development at the micro-level have further attracted academic attention. We call for rural areas to be guided toward green transformation instead of traditional growth-oriented development strategies, which is particularly important in ecologically fragile and ecologically functional areas. The study proposes three policy suggestions to ensure the successful realization of green transformation. Firstly, the ecological value and livelihood vulnerability of rural communities should be comprehensively assessed, the ecological benefits of forest production land should be measured, farmland and other types of land should be abandoned, the decoupling of livelihoods from land use should be guided, and continuous ecological compensation for the corresponding families should be implemented. Secondly, we should increase the added value of agriculture, guide the non-agricultural development of local industries, integrate the development of agriculture with tourism and ecological industries, promote the deep processing of local agricultural and forestry products, and, subsequently, attract human capital back to rural areas. Thirdly, we should guide households to enhance the diversity of their livelihoods and reduce their vulnerability to avoid the emergence of barren livelihoods caused by changes in the external environment such as climate, market, and policy.

4.4. Conclusions

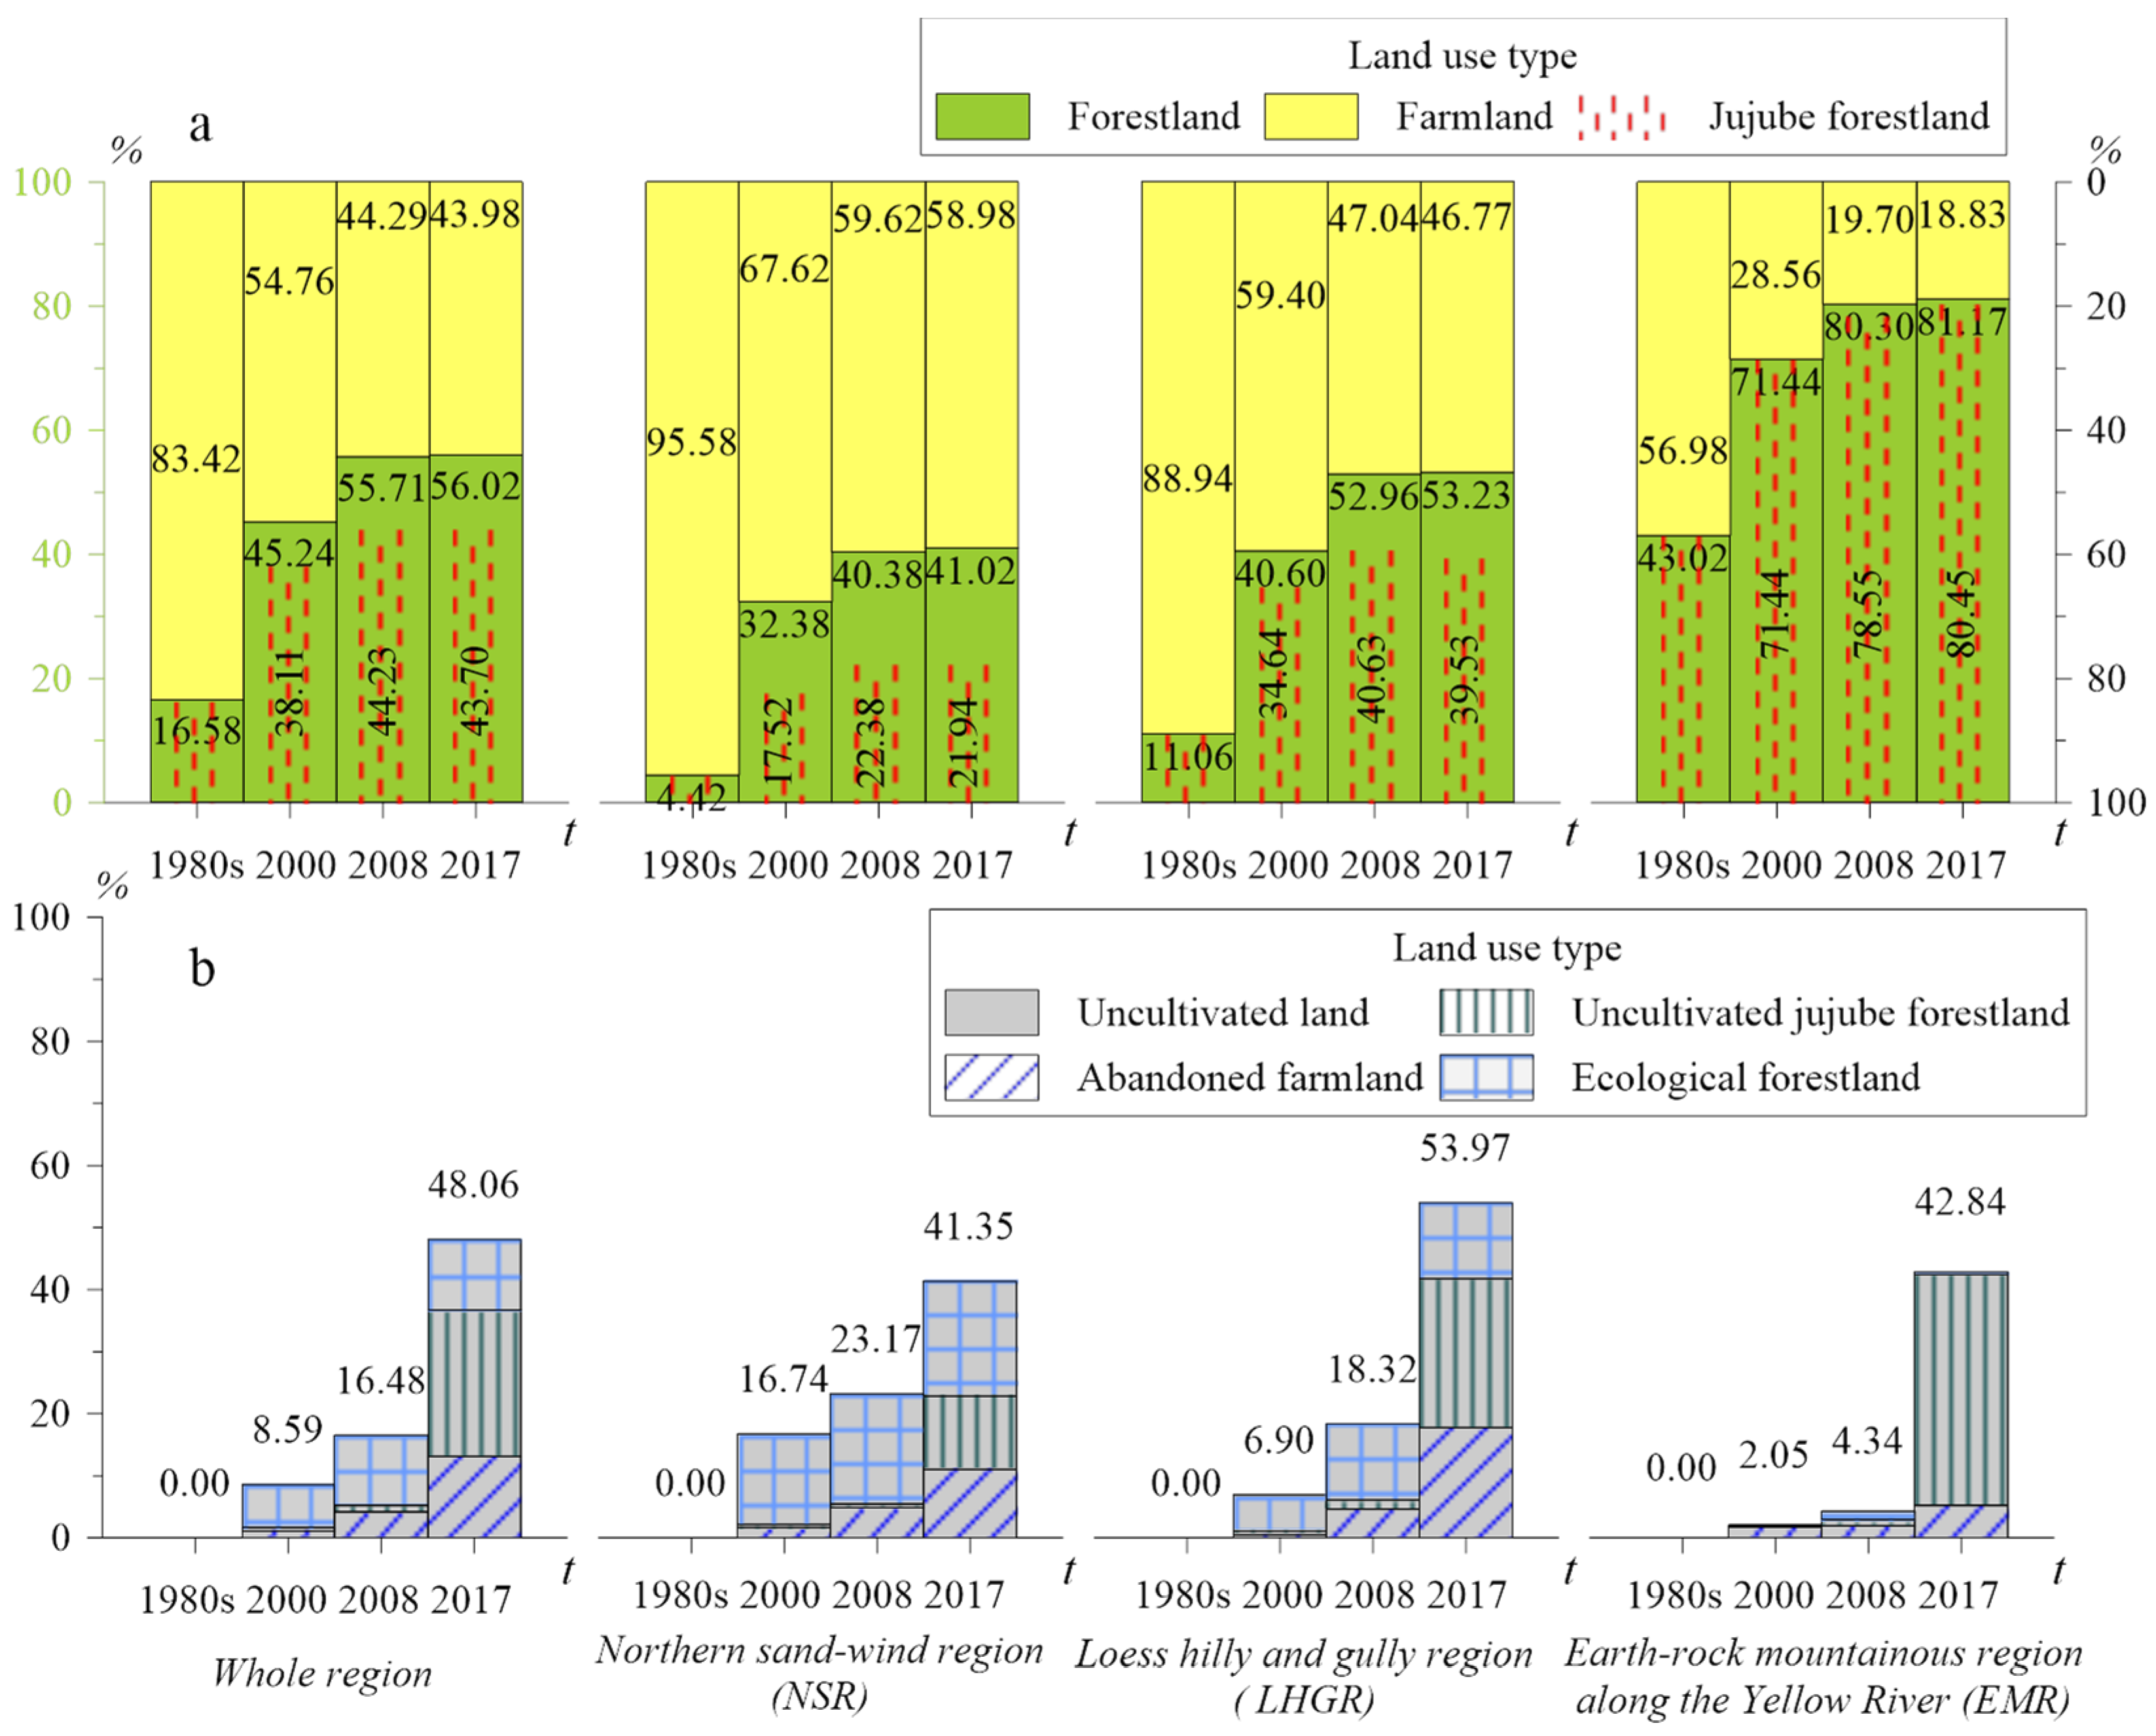
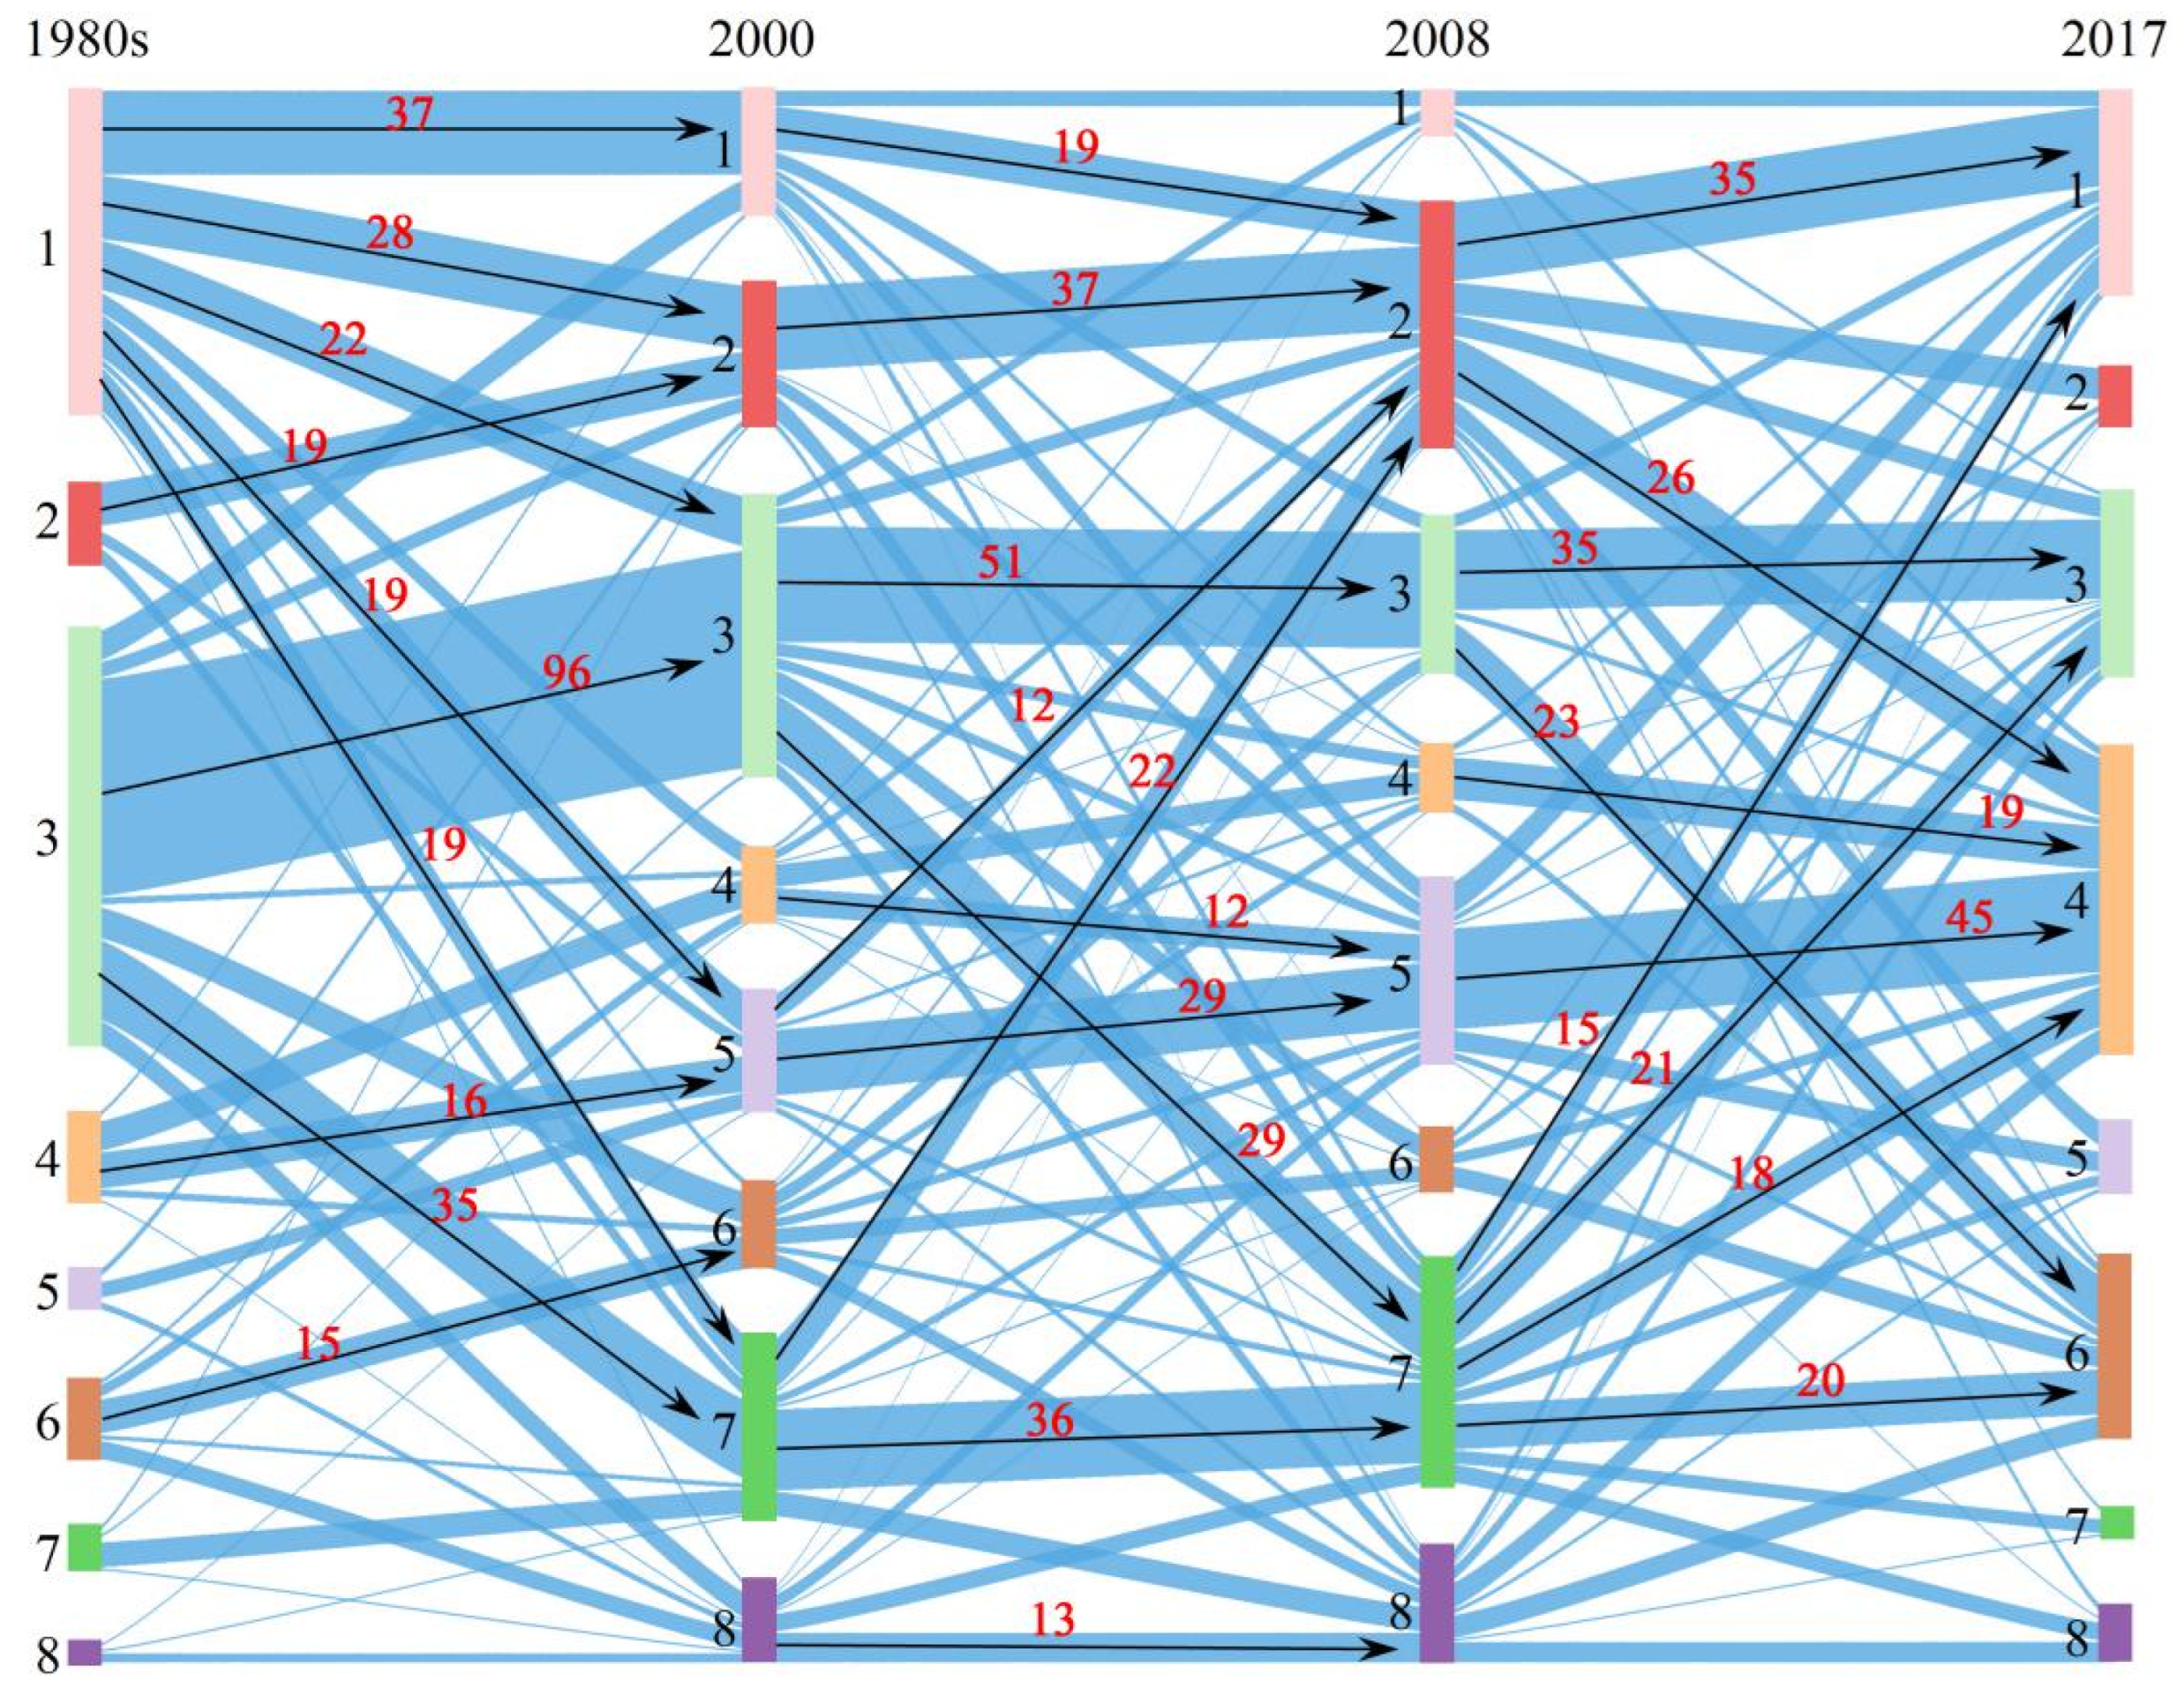
Since 1980, the rural livelihoods–land use in Jia County on the Loess Plateau of China showed a clear transformation of non-agricultural and ecological. As for livelihoods, they are manifested as a trajectory from the traditional farming livelihood to jujube-oriented and then to non-farming, and the share of traditional farming has gradually decreased, whilst that of non-farming has gradually increased and that of jujube livelihood has experienced a process of steep rising to a steep decline. As for land use, it is manifested as a large increase in uncultivated land, and farmland turned into forestland on a large scale. Of course, regional variation can be observed in the share of livelihood activities, the forest–tillage ratio, and the source of uncultivated land at different stages. Household behaviors actively or passively adapting to the change in the external environment is the power source of transformation, and climate change, market change, urbanization impact, and policy regulation are the key factors. The behaviors experienced a process from over-reclamation to reforestation and extensive planting of jujube trees, and, finally, to migrant work and land abandonment. National and local govt. policies, climate change, market change, and urban attraction are the key effects.
Of course, there are still some deficiencies in this study and further work to be carried out. On the one hand, this study adopted field survey data of the trajectory of livelihoods and land use change, but the influencing factors, households’ adaptation, and drive path only use ethnographic research methods. This qualitative-analysis method is inevitably influenced by the interviewees, reporters, and interview outline, so this study also has certain “construction” characteristics. Therefore, this study provides a clear direction for the influencing factors, paths, and driving mechanisms of rural transformation, but it still needs to be verified quantitatively in the future and widely applied internationally. On the other hand, although this study is based on the perspective of households′ livelihood and land use, due to the lack of data, it lacks the analysis of changes in rural homesteads, whereas cultivated land and rural homesteads are the important sources of rural development and land use transformation [30]. In addition, the non-agricultural transformation of rural livelihood is accompanied by the change in rural population structure. However, the current analysis only shows the phenomenon and causes of rural population loss, aging, and weakening based on the interview materials, and the trajectory and regional impact of rural population change were not quantitatively analyzed. At present, it is a realistic challenge and inevitable choice for global rural development to solve the development dilemma and move toward revitalization. The current significant changes in rural areas, such as population return and livelihood development, agricultural modernization, and diversification of rural organizations, need to be extensively explored by international scholars in the field of rural transformation and development. It is also urgent to carry out more extensive field investigations involving multi-stakeholder rural areas.

Author Contributions

Conceptualization, Q.Y., Y.G. and X.Y.; methodology, Q.Y.; software, Q.Y.; validation, Q.Y., Y.G., X.Y. and J.Z.; formal analysis, Q.Y. and Y.G.; investigation, Q.Y. and J.Z.; data curation, X.Y.; writing—original draft preparation, Q.Y.; writing—review and editing, Q.Y. and Y.G.; visualization, Q.Y.; supervision, X.Y.; project administration, X.Y.; funding acquisition, Q.Y. All authors have read and agreed to the published version of the manuscript.

Funding

This research was funded by National Natural Sciences Foundation of China, grant number 42001202, 41831284.

Institutional Review Board Statement

Not applicable.

Informed Consent Statement

Not applicable.

Data Availability Statement

Not applicable.

Conflicts of Interest

The authors declare no conflict of interest.

Appendix A

Table A1. The basic information of householders about the 451 surveyed households in 2017.
Basic IndicatorsCategoryNumberBasic IndicatorsCategoryNumber
gendermale419employmentpure farming197
female32mainly farming, part-time jobs40
age25–4431mainly for work, part-time farming34
45–64252pure work39
65–74126do business26
75–8242student and soldier0
household size1–2193work in public institutions13
3–5205non-employment102
6–1253working experienceconstruction workers108
health conditionhealthy299manufacturing worker4
diseased132catering and accommodation attendant5
disabled20driver4
labor capacitycomplete338mining workers8
incomplete87skilled worker13
incapacity26home services and property management services2
education years<6140no working experience307
6–8126
9–11135
>1150
Table A2. Number and proportion of households by participation in different livelihood activities from 1980s to 2017, among 451 surveyed rural households in the Jia County.
Livelihood Activity1980s200020082017
N%N%N%N%
Special jujube (SJ)6614.6321347.2332171.187817.29
Traditional farming (TF)23251.4426057.6522950.7818440.80
Non-farm (NF)8619.0714532.1516937.4725456.32
Unconventional (Un)13930.825211.53153.338819.51
Notes: % columns denote participation percentages of households and need not add up to 100%.
Table A3. Area and proportion of land use types contracted by 451 households from 1980s to 2017 in Jia County.
Land Use Categories1980s200020082017
Area (ha.)%Area (ha.)%Area (ha.)%Area (ha.)%
Household contracted land491.19100561.46100560.00100555.94100
Forestland 81.4316.58253.9945.24311.9955.71311.4556.02
Jujube forest81.4316.58213.9638.11247.6744.23242.9443.70
Ecological forest0039.307.0063.2511.3063.1211.35
Farmland 409.7583.42307.4754.76248.0144.29244.4943.98
Uncultivated land 0048.238.5992.3016.48267.1748.06
Abandoned farmland006.201.1023.014.1173.1913.16
Uncultivated jujube forest002.730.496.031.08136.1724.49
Ecological forest0039.307.0063.2511.3063.1211.35

Appendix B

The household questionnaire template used by the research team. The original questionnaire template was in Chinese and included information of other research projects. The questionnaire shown below was extracted by the researcher and translated into English.
Agriculture 12 01111 g0a1Agriculture 12 01111 g0a2

References

  1. Woods, M. Rural geography: Blurring boundaries and making connections. Prog. Hum. Geogr. 2009, 33, 849–858. [Google Scholar] [CrossRef]
  2. Kates, R.W. What kind of a science is sustainability science? Proc. Natl. Acad. Sci. USA 2011, 108, 19449–19450. [Google Scholar] [CrossRef] [PubMed] [Green Version]
  3. Long, H.; Woods, M. Rural restructuring under globalization in eastern coastal China: What can be learned from wales? J. Rural Community Dev. 2011, 6, 70–94. [Google Scholar]
  4. Fink, M.; Lang, R.; Harms, R. Local responses to global technological change: Contrasting restructuring practices in two rural communities in Austria. Technol. Forecast. Soc. Chang. 2013, 80, 243–252. [Google Scholar] [CrossRef]
  5. Liu, Y.; Li, Y. Revitalize the world’s countryside. Nature 2017, 548, 275–277. [Google Scholar] [CrossRef] [PubMed]
  6. Marsden, T.; Lowe, P.; Whatmore, S. Rural Restructuring: Global Processes and Their Responses; Fulton: London, UK, 1990. [Google Scholar]
  7. Hoggart, K.; Paniagua, A. What rural restructuring? J. Rural Stud. 2001, 17, 41–62. [Google Scholar] [CrossRef]
  8. Woods, M. Rural Geography; SAGE: London, UK, 2005. [Google Scholar]
  9. Long, H.; Zou, J.; Pykett, J.; Li, Y. Analysis of rural transformation development in China since the turn of new millennium. Appl. Geogr. 2011, 31, 1094–1105. [Google Scholar]
  10. Weitz, R. Rural development through regional planning in Israel. J. Farm Econ. 1965, 47, 634–651. [Google Scholar] [CrossRef]
  11. Kawaguchi, H. The “Dual Structure” of finance in post-war Japan. Dev. Econ. 1967, 5, 301–311. [Google Scholar] [CrossRef]
  12. Woods, M. Regions engaging globalization: A typology of regional responses in rural Europe. J. Rural Community Dev. 2013, 8, 113–126. [Google Scholar]
  13. Hedlund, M.; Lundholm, E. Restructuring of rural Sweden: Employment transition and out- migration of three cohorts born 1945–1980. J. Rural Stud. 2015, 42, 123–132. [Google Scholar] [CrossRef]
  14. Liu, X.; Liu, Z.; Zhong, H.; Jian, Y.; Shi, L. Multi-dimension evaluation of rural development degree and its uncertainties: A comparison analysis based on three different weighting assignment methods. Ecol. Indic. 2021, 130, 108096. [Google Scholar] [CrossRef]
  15. Brauw, A.D.; Mueller, V.; Lee, H.L. The Role of Rural-Urban Migration in the Structural Transformation of Sub-Saharan Africa. World Dev. 2014, 63, 33–42. [Google Scholar] [CrossRef]
  16. González-Ávila, S.; Lopez-Leiva, C.; Bunce, R.; Elena-Rossello, R. Changes and drivers in spanish landscapes at the rural-urban interface between 1956 and 2018. Sci. Total Environ. 2020, 714, 136858. [Google Scholar] [CrossRef] [PubMed]
  17. Benessaiah, K. Reconnecting to nature amidst crisis: Harnessing capacities and mobilities for livelihood and land transformations in the Greek back-to-the-land trend. J. Rural Stud. 2021, 84, 76–89. [Google Scholar] [CrossRef]
  18. Christiaensen, L.; Todo, Y. Poverty Reduction During the Rural–Urban Transformation—The Role of the Missing Middle. World Dev. 2014, 63, 43–58. [Google Scholar] [CrossRef]
  19. Fahmi, F.Z.; Sari, I.D. Rural transformation, digitalisation and subjective wellbeing: A case study from Indonesia. Habitat Int. 2020, 98, 102150. [Google Scholar] [CrossRef]
  20. Jia, P.; Zhuang, J.; Lucero, A.M.V.; Li, J. Does the energy consumption revolution improve the health of elderly adults in rural areas? evidence from china. Sci. Total Environ. 2022, 807, 150755. [Google Scholar] [CrossRef]
  21. Zhu, C.; Lin, Y.; Zhang, J.; Gan, M.; Xu, H.; Li, W.; Yuan, S. Exploring the relationship between rural transition and agricultural eco-environment using a coupling analysis: A case study of Zhejiang Province, China. Ecol. Indic. 2021, 127, 107733. [Google Scholar] [CrossRef]
  22. Liu, Y.; Long, H.; Li, T.; Tu, S. Land use transitions and their effects on water environment in Huang-Huai-Hai Plain, China. Land Use Policy 2015, 47, 293–301. [Google Scholar] [CrossRef]
  23. Yang, Y.; Liu, Y.; Li, Y.; Li, J. Measure of urban-rural transformation in Beijing-Tianjin-Hebei region in the new millennium: Population-land-industry perspective. Land Use Policy 2018, 79, 595–608. [Google Scholar] [CrossRef]
  24. Terluin, I.J. Differences in economic development in rural regions of advanced countries: An overview and critical analysis of theories. J. Rural Stud. 2003, 19, 327–344. [Google Scholar] [CrossRef]
  25. Woods, M.; McDonagh, J. Rural Europe and the world: Globalization and rural development. Eur. Ctries. 2011, 3, 153–163. [Google Scholar] [CrossRef] [Green Version]
  26. Yang, R.; Pan, Y.; Xu, Q. Space diversification process and evolution mechanism of typical village in the suburbs of Guangzhou. J. Geogr. Sci. 2020, 30, 1155–1178. [Google Scholar] [CrossRef]
  27. Woods, M. Engaging the global countryside: Globalization, hybridity and the reconstitution of rural place. Prog. Hum. Geogr. 2007, 31, 485–507. [Google Scholar] [CrossRef] [Green Version]
  28. Zhou, G.; He, Y.; Tang, C.; Yu, T.; Xiao, G.; Zhong, T. Dynamic mechanism and present situation of rural settlement evolution in China. J. Geogr. Sci. 2013, 23, 513–524. [Google Scholar] [CrossRef]
  29. Liu, Y.; Zhang, F.; Zhang, Y. Appraisal of typical rural development models during rapid urbanization in the eastern coastal region of China. J. Geogr. Sci. 2009, 19, 557–567. [Google Scholar] [CrossRef]
  30. Long, H.; Li, T. The coupling characteristics and mechanism of farmland and rural housing land transition in China. J. Geogr. Sci. 2012, 22, 548–562. [Google Scholar] [CrossRef]
  31. Ge, D.; Wang, Z.; Tu, S.; Long, H.; Yan, H.; Sun, D.; Qiao, W. Coupling analysis of greenhouse-led farmland transition and rural transformation development in China’s traditional farming area: A case of Qingzhou City. Land Use Policy 2019, 86, 113–125. [Google Scholar] [CrossRef]
  32. Tang, Q.; Bennett, S.J.; Xu, Y.; Li, Y. Agricultural practices and sustainable livelihoods: Rural transformation within the Loess Plateau, China. Appl. Geogr. 2013, 41, 15–23. [Google Scholar] [CrossRef]
  33. Wu, K.; Yang, X.; Zhang, J.; Wang, Z. Differential Evolution of Farmers’ Livelihood Strategies since the 1980s on the Loess Plateau, China. Land 2022, 11, 157. [Google Scholar] [CrossRef]
  34. Fang, Y.P.; Zhao, C.; Rasul, G.; Wahid, S.M. Rural household vulnerability and strategies for improvement: An empirical analysis based on time series. Habitat Int. 2016, 53, 254–264. [Google Scholar] [CrossRef]
  35. Escarcha, J.F.; Lassa, J.A.; Palacpac, E.P.; Zander, K.K. Livelihoods transformation and climate change adaptation: The case of smallholder water buffalo farmers in the Philippines. Environ. Dev. 2020, 33, 100468. [Google Scholar] [CrossRef]
  36. Chepkoech, W.; Mungai, N.W.; Stöber, S.; Lotze-Campen, H. Understanding adaptive capacity of smallholder African indigenous vegetable farmers to climate change in Kenya. Clim. Risk Manag. 2020, 27, 100204. [Google Scholar] [CrossRef]
  37. Matewos, T. The state of local adaptive capacity to climate change in drought-prone districts of rural Sidama, southern Ethiopia. Clim. Risk Manag. 2020, 27, 100209. [Google Scholar] [CrossRef]
  38. Yang, X.; Guo, S.; Deng, X.; Wang, W.; Xu, D. Study on livelihood vulnerability and adaptation strategies of farmers in areas threatened by different disaster types under climate change. Agriculture 2021, 11, 1088. [Google Scholar] [CrossRef]
  39. Jin, S.; Min, S.; Huang, J.; Waibel, H. Falling price induced diversification strategies and rural inequality: Evidence of smallholder rubber farmers. World Dev. 2021, 146, 105604. [Google Scholar] [CrossRef]
  40. Nguyen, Q.; Kim, D.C. Reconsidering rural land use and livelihood transition under the pressure of urbanization in Vietnam: A case study of Hanoi. Land Use Policy 2020, 99, 104896. [Google Scholar] [CrossRef]
  41. Tahiru, A.; Sackey, B.; Owusu, G.; Bawakyillenuo, S. Building the adaptive capacity for livelihood improvements of Sahel Savannah farmers through NGO-led adaptation interventions. Clim. Risk Manag. 2019, 26, 100197. [Google Scholar] [CrossRef]
  42. May, C.K. Resilience, vulnerability, & transformation: Exploring community adaptability in coastal North Carolina. Ocean Coast. Manag. 2019, 169, 86–95. [Google Scholar]
  43. Kilawe, C.J.; Mertz, O.; Silayo, D.A.; Birch-Thomsen, T.; Maliondo, S.M. Transformation of shifting cultivation: Extent, driving forces and impacts on livelihoods in tanzania. Appl. Geogr. 2018, 94, 84–94. [Google Scholar] [CrossRef]
  44. MelenDe Z-Pastor, I.; Hernández, E.I.; Navarro-Pedreño, J.; Gómez, I. Socioeconomic factors influencing land cover changes in rural areas: The case of the sierra de albarracín (spain). Appl. Geogr. 2014, 52, 34–45. [Google Scholar] [CrossRef]
  45. Peng, J.; Liu, Y.; Li, T.; Wu, J. Regional ecosystem health response to rural land use change: A case study in Lijiang City, China. Ecol. Indic. 2017, 72, 399–410. [Google Scholar] [CrossRef]
  46. Fang, Z.; Ding, T.; Chen, J.; Xue, S.; Zhou, Q.; Wang, Y.; Wang, Y.; Huang, Z.; Yang, S. Impacts of land use/land cover changes on ecosystem services in ecologically fragile regions. Sci. Total Environ. 2022, 831, 154967. [Google Scholar] [CrossRef]
  47. Yang, Q.; Yang, X.; Gao, Y. Change in vulnerability of rural human settlement in the semi-arid area of the Loess Plateau since 1980: A case study of Jia County, Shaanxi Province. Prog. Geogr. 2019, 38, 756–771. (In Chinese) [Google Scholar]
  48. Dale, V.H.; Polasky, S. Measures of the effects of agricultural practices on ecosystem services. Ecol. Econ. 2007, 64, 286–296. [Google Scholar] [CrossRef]
  49. Diao, X.; Magalhaes, E.; Silver, J. Cities and rural transformation: A spatial analysis of rural livelihoods in Ghana. World Dev. 2019, 121, 141–157. [Google Scholar] [CrossRef]
  50. Baffoe, G.; Matsuda, H. A perception based estimation of the ecological impacts of livelihood activities: The case of rural Ghana. Ecol. Indic. 2018, 93, 424–433. [Google Scholar] [CrossRef]
  51. Ge, D.; Long, H.; Qiao, W.; Wang, Z.; Sun, D.; Yang, R. Effects of rural–urban migration on agricultural transformation: A case of Yucheng City, China. J. Rural Stud. 2020, 76, 85–95. [Google Scholar] [CrossRef]
  52. Leisz, S.J.; Yasuyuki, K.; Fox, J.; Masayuki, Y.; Rambo, T.A. Land use changes in the uplands of Southeast Asia: Proximate and distant causes. Southeast Asian Stud. 2009, 47, 237–243. [Google Scholar]
  53. Meiyappan, P.; Roy, P.S.; Sharma, Y.; Ramachandran, R.M.; Joshi, P.K.; Defries, R.S.; Jain, A.K. Dynamics and determinants of land change in India: Integrating satellite data with village socioeconomics. Reg. Environ. Chang. 2017, 17, 753–766. [Google Scholar] [CrossRef] [PubMed]
  54. Yang, R.; Zhang, J.; Xu, Q.; Luo, X. Urban-rural spatial transformation process and influences from the perspective of land use: A case study of the Pearl River Delta Region. Habitat Int. 2020, 104, 102234. [Google Scholar] [CrossRef]
  55. Yang, R.; Lin, Y. Rural Spatial transformation and governance from the perspective of land development rights: A case study of Fenghe village in Guangzhou. Growth Chang. 2021, 1–20. [Google Scholar] [CrossRef]
  56. Belton, B.; Filipski, M. Rural transformation in central Myanmar: By how much, and for whom? J. Rural Stud. 2019, 67, 166–176. [Google Scholar] [CrossRef]
  57. Gao, C.; Cheng, L. Tourism-driven rural spatial restructuring in the metropolitan fringe: An empirical observation. Land Use Policy 2020, 95, 104609. [Google Scholar] [CrossRef]
  58. Yu, P.; Zhang, J.; Wang, Y.; Wang, C.; Zhang, H. Can tourism development enhance livelihood capitals of rural households? Evidence from Huangshan National Park adjacent communities, China. Sci. Total Environ. 2020, 748, 141099. [Google Scholar] [CrossRef] [PubMed]
  59. Li, H.; Yuan, Y.; Zhang, X.; Li, Z.; Wang, Y.; Hu, X. Evolution and transformation mechanism of the spatial structure of rural settlements from the perspective of long-term economic and social change: A case study of the sunan region, china. J. Rural Stud. 2022, 93, 234–243. [Google Scholar] [CrossRef]
  60. Lu, D.; Yang, X.; Shi, Y.; Wang, Z. Rural regime shifts and transformation development on the Loess Plateau. Acta Geogr. Sin. 2020, 75, 348–364. (In Chinese) [Google Scholar]
  61. Shah, J.; Alharthi, M. The Association between Farmers’ Psychological Factors and Their Choice to Adopt Risk Management Strategies: The Case of Pakistan. Agriculture 2022, 12, 412. [Google Scholar] [CrossRef]
  62. Grainger, A. National land use morphology: Patterns and possibilities. Geography 1995, 80, 235–245. [Google Scholar]
  63. Kong, R.; Diepart, J.C.; Castella, J.C.; Lestrelin, G.; Tivet, F.; Belmain, E.; Bégué, A. Understanding the drivers of deforestation and agricultural transformations in the northwestern uplands of cambodia. Appl. Geogr. 2019, 102, 84–98. [Google Scholar] [CrossRef] [Green Version]
  64. Liu, S.; Zhang, J.; Zhang, J.; Guo, Y. Simultaneously tackling ecological degradation and poverty challenges: Evidence from desertified areas in northern China. Sci. Total Environ. 2022, 815, 152927. [Google Scholar] [CrossRef]
  65. Olowo, S.F.; Omotayo, A.O.; Lawal, I.O.; Aremu, A.O. Improving Rural Livelihood through the Cultivation of Indigenous Fruits and Vegetables: Evidence from Ondo State, Nigeria. Agriculture 2022, 12, 372. [Google Scholar] [CrossRef]
  66. Gao, H.; Li, Z.; Li, P.; Jia, L.; Xu, G.; Ren, Z.; Pang, G.; Zhao, B. The capacity of soil loss control in the Loess Plateau based on soil erosion control degree. Acta Geogr. Sin. 2015, 70, 1503–1515. [Google Scholar] [CrossRef] [Green Version]
  67. Jia County Local Chronicle Compilation Committee. Shaanxi Local Chronicles Series: Jia County Chronicles; Shaanxi Tourism Press: Xi’an, China, 2008. [Google Scholar]
  68. McManus, P.; Walmsley, J.; Argent, N.; Baum, S.; Bourke, L.; Martin, J.; Pritchard, B.; Sorensen, T. Rural Community and Rural Resilience: What is important to farmers in keeping their country towns alive? J. Rural Stud. 2012, 28, 20–29. [Google Scholar] [CrossRef]
  69. Wang, D.C.; Gong, J.H.; Chen, L.D.; Zhang, L.H.; Song, Y.Q.; Yue, Y.J. Spatiotemporal pattern analysis of land use/cover change trajectories in Xihe watershed. Int. J. Appl. Earth Obs. Geoinf. 2012, 14, 12–21. [Google Scholar]
  70. Bernard, H.R. Research Methods in Anthropology: Qualitative and Quantitative Approaches, 4th ed.; Altamira Press: Walnut, Creek, 2005. [Google Scholar]
  71. Ritchie, D.A. Doing Oral History: A Practical Guide; Oxford University Press: New York, NY, USA, 2003. [Google Scholar]
  72. Xu, Y.; Tang, Q.; Zhang, T.; Yang, Q. Influence of ecological defarming scenarios on agriculture in Ansai county, Loess Plateau, China. Mt. Res. Dev. 2009, 29, 36–45. [Google Scholar]
  73. Duijne, R.J. Why India’s urbanization is hidden: Observations from “rural” Bihar. World Dev. 2019, 123, 104610. [Google Scholar] [CrossRef]
  74. Wang, C.C.; Miao, J.T.; Phelps, N.A.; Zhang, J. E-commerce and the transformation of the rural: The Taobao village phenomenon in Zhejiang Province, China. J. Rural Stud. 2021, 81, 159–169. [Google Scholar] [CrossRef]
  75. Maharjan, A.; Kochhar, I.; Chitale, V.S.; Hussain, A.; Gioli, G. Understanding rural outmigration and agricultural land use change in the Gandaki Basin, Nepal. Appl. Geogr. 2020, 124, 102278. [Google Scholar] [CrossRef]
  76. Barbier, E.B. Is green rural transformation possible in developing countries? World Dev. 2020, 131, 104955. [Google Scholar] [CrossRef]
  77. Dang, X.; Gao, S.; Tao, R.; Liu, G.; Xia, Z.; Fan, L.; Bi, W. Do environmental conservation programs contribute to sustainable livelihoods? Evidence from China’s grain-for-green program in northern Shaanxi province. Sci. Total Environ. 2020, 719, 137436. [Google Scholar] [CrossRef] [PubMed]
  78. Falk, M.D.; Schulman, A.R. Communities of work: Rural restructuring in local and global. Contexts 2007, 23, 118–124. [Google Scholar]
  79. Hu, S.; Yu, B.; Wang, M. Rural restructuring and transformation: Western experience and its enlightenment to China. Geogr. Res. 2019, 38, 2833–2845. [Google Scholar]
  80. Suesse, M.; Wolf, N. Rural transformation, inequality, and the origins of microfinance. J. Dev. Econ. 2020, 143, 102429. [Google Scholar] [CrossRef] [Green Version]
  81. Ma, W.; Jiang, G.; Li, W.; Zhou, T. How do population decline, urban sprawl and industrial transformation impact land use change in rural residential areas? A comparative regional analysis at the peri-urban interface. J. Clean. Prod. 2018, 205, 76–85. [Google Scholar] [CrossRef]
  82. Su, S.; Jiang, Z.; Zhang, Q.; Zhang, Y. Transformation of agricultural landscapes under rapid urbanization: A threat to sustainability in Hang-Jia-Hu region, China. Appl. Geogr. 2011, 31, 439–449. [Google Scholar] [CrossRef]
  83. Xu, J.; Song, J.; Li, B.; Liu, D.; Dong, W.; Cao, X. Do settlements isolation and land use changes affect poverty? evidence from a mountainous province of china. J. Rural Stud. 2020, 76, 163–172. [Google Scholar] [CrossRef]
  84. Aiyar, A.; Rahman, A.; Pingali, P. India’s rural transformation and rising obesity burden. World Dev. 2021, 138, 105258. [Google Scholar] [CrossRef]
  85. Peng, H.; Cheng, G.; Xu, Z.; Yin, Y.; Xu, W. Social, economic, and ecological impacts of the ‘‘Grain for Green’’ project in China: A preliminary case in Zhangye, Northwest China. J. Environ. Manag. 2007, 85, 774–784. [Google Scholar] [CrossRef] [PubMed]
Figure 1. Conceptual model of rural transformation linking household scale and regional scale.
Agriculture 12 01111 g001
Figure 2. Map of the study area and sample villages.
Agriculture 12 01111 g002
Figure 3. Trajectory of the share of households participating in livelihood activities in different regions.
Agriculture 12 01111 g003
Figure 4. Proportion and changes in land use categories in different regions since 1980s.
Agriculture 12 01111 g004
Figure 5. Sankey diagram of the evolution of livelihood structure of 451 households since the 1980s. Notes: Arrows indicate the top 10 tracks in each stage, arrows numbers represent the number of households on the track; Code1–8 in the vertical coordinates in order denotes Barren type, SJ income type, TF income type, NF income type, Joint income of SJ & NF, Joint income of TF & NF, Joint income of TF & SJ, Comprehensive type.
Agriculture 12 01111 g005
Figure 6. Transition of households’ livelihood structure caused by livelihood behaviors since 1980s. Notes: Code 1–7 in order denotes Barren type, SJ income type, TF income type, NF income type, Joint income of SJ & NF, Joint income of TF & NF, and Joint income of TF & SJ.
Agriculture 12 01111 g006
Figure 7. Driving force and path of rural transformation in the Loess Plateau region.
Agriculture 12 01111 g007
Table 1. Indicators of household livelihood and land use were used in the analysis.
IndicatorsDescription
Livelihood activity types
Traditional farming livelihoodHouseholds engaged in the cultivation of crops, including grain crops and cash crops, or engaged in traditional livestock-farming activities.
Special jujube livelihoodHouseholds engaged in planting jujube trees and selling jujube fruit.
Non-farming livelihoodHouseholds engaged in sustainable employment or business activities.
Unconventional livelihoodHouseholds’ income from being engaged in odd jobs, social security support, or ecological compensation.
Livelihood structure type
Barren type (Code 1)Income only relies on odd jobs or social security support, ecological compensation, or maintaining life by self-sufficiency.
SJ income type (Code 2)Income depends on specialty livelihood activities.
TF income type (Code 3)Income depends on traditional farming livelihood.
NF income type (Code 4)Income depends on non-farming livelihood.
Joint income of SJ and NF (Code 5)Income channels cover SJ and NF livelihood activities.
Joint income of TF and NF (Code 6)Income channels cover TF and NF livelihood activities.
Joint income of TF and SJ (Code 7)Income channels cover TF and SJ livelihood activities.
Comprehensive type (Code 8)Income channels cover SJ, TF, and NF livelihood activities.
Land use types
FarmlandUsed for the cultivation of grain, oil, or vegetable crops.
ForestlandIncludes economic forest land, such as jujube forest land, and ecological forest land. Ecological forests are controlled by the policy and prohibited from farming and grazing and bear the ecological functions of windbreak and sand fixation and soil and water conservation.
Uncultivated landThe land that has been abandoned for cultivation, which includes ecological forestland, abandoned economic forestland, and abandoned farmland.
Notes: The code refers to different types of livelihood structures, which are needed to detect the temporal trajectory in livelihood structures.
Table 2. Number and proportion of households with different livelihood structures in four periods.
Households’ Livelihood Structure1980s200020082017
N%N%N%N%
Barren type13930.825211.53153.338819.51
SJ income type327.105913.0810423.06214.66
TF income type17939.6912026.616714.867917.52
NF income type357.76316.87275.9913129.05
Joint income of SJ and NF132.884910.867616.85275.99
Joint income of TF and NF327.10357.76214.667516.63
Joint income of TF and SJ153.337516.639621.2992.00
Comprehensive type61.33306.65459.98214.66
Table 3. A synthesis of livelihoods–land use transitions, key effects, household behavior adaptations, and cited interview materials at three stages.
Stage, ContextKey EffectsHousehold Behavior AdaptationsCited Representative Materials of Interview
1980–2000.
  • Share of SJ livelihood increased by 32.60%.
  • Share of forestland increased by 28.66%.
  • TF livelihood and farmland remained the largest share.
  • Local govt. listed jujube production as an important pillar industry.
  • Govt. carried out Three-North Shelterbelt Program, ‘GfG’ project.
  • Convenient transportation and more accessible.
  • Jujube fruit market supply was far less than demand.
  • Low rainfall and arid climate.
  • Actively or passively responded to the forest projects, and converted farmland to jujube forest or ecological forest.
  • Spontaneously or following other farmers to plant jujube under the drive of the market, and changed farmland into jujube forest land.
  • If you don′t return the farmland to forestland, you will not be forced to do so. However, if you don’t, your piece of farmland will be separated by other’s forest, which makes it inconvenient to plant crops.
  • Later, the traffic became more convenient and it was convenient to buy food, so I did not need so much farmland.
  • We began to plant jujube trees, because the neighbours say that the economic development of jujube is better.
  • There was no competition from Xinjiang jujubes, the market price of jujube was high, and there was not much rain in autumn, so jujube was very valuable.
2001–2008.
  • Share of SJ livelihood exceeded that of TF activities by 20.4%, reaching 71.18%.
  • Share of forestland exceeded that of farmland by 11.42%, reaching 55.71%.
  • Govt. implemented ‘GfG’ project and natural forest protection project.
  • Govt. carried out agricultural welfare policy.
  • Siphon of urbanization and the govt. promoted labor transfer.
  • Adjusted the layout of basic education facilities.
  • The yield of jujube and the purchase price both performed well.
  • Responded to ecological restoration policies, and turned farmland into ecological forest.
  • Rural labor force migrated for work, shifted from farming to non-farming activities, and abandoned farmland.
  • Changed from TF livelihood to SJ livelihood, or increased SJ livelihood, and returned farmland to forest.
  • Some people planted jujube trees under the GfG project, whilst others planted jujube trees for profit without the policy subsidies. the state gave us two or three yuan for each seedling..
  • The return of farmland to forest in this village is mainly ecological forest, and…alfalfa is planted under the forest. There are small livestock farms in the village, and the sheep usually have to be shut up and can′t go to the eco-forest to graze sheep.
  • Probably since the school was closed down, children have to study in the towns or cities, go to the town or the city, so more families go out to work. The local school closed in 2007.
  • Some families in our town could earn over 180,000 or 200,000 RMB from jujube sales, and generally could earn over 20,000 or 30,000 RMB.
2009–2017.
  • Share of NF livelihood exceeded that of SJ livelihood by 15.52%, reaching 56.32%.
  • Share of uncultivated land reached 48.06%.
  • Excessive rainfall led to mildew and yield reduction in jujube.
  • Increased rainfall was conducive to the growth of traditional crops.
  • Jujube market changed, with a sharp decrease in the purchase price and continuous unsalable.
  • Loss of young population and leaving behind of the old and the weak.
  • Gave up the management of jujube forests and even gave up picking jujubes.
  • Removal of jujube from households’ livelihood activities, turning into NF or TF livelihood.
  • Abandoned farmland and jujube forest.
  • Cut down jujube trees and turned forestland into farmland.
  • Many people go to work outside, and the land has been abandoned. When we toiled the jujube forest for a year, we couldn’t even sell it for 10,000 yuan. Whilst if we go out to work, we may be able to accumulate 40,000 yuan of savings, so we certainly don’t want to farm.
  • No one has picked jujube in recent years, and the traders not come. Now, when the price of jujube is 0.2 yuan/kg, which is not even worth to pick up.
  • In the past, jujube trees were planted even in good terraced fields…In recent years, jujube cannot earn profits any more, and trees on the terraces have all been cut down and replaced with crops.
Publisher’s Note: MDPI stays neutral with regard to jurisdictional claims in published maps and institutional affiliations.

