Article

Metabolomics Analysis of Lettuce (Lactuca sativa L.) Affected by Low Potassium Supply

1
School of Agricultural Engineering, Jiangsu University, Zhenjiang 212013, China
2
Key Laboratory of Agriculture Equipment and Intelligence of Jiangsu Province, Zhenjiang 212013, China
3
College of Grain Science and Technology, Shenyang Normal University, Shenyang 110034, China
*
Author to whom correspondence should be addressed.
Agriculture 2022, 12(8), 1153; https://doi.org/10.3390/agriculture12081153
Submission received: 20 June 2022 / Revised: 27 July 2022 / Accepted: 1 August 2022 / Published: 4 August 2022

Abstract

:
Lettuce is a commercially significant leafy vegetable worldwide. Potassium (K) is an essential macronutrient for lettuce growth and development and significantly impacts its metabolites. Biomarkers that are indicative of variations in the K status of lettuce before the occurrence of biophysical changes (e.g., leaf or canopy morphological, textural and color features), can be adopted to determine the early K status of lettuce. To understand the effect of low K on diverse metabolites, we examined the metabolic response of lettuce in a closed cultivation room under controlled conditions. The evaluation was based on large-scale untargeted metabolomics assay of the K group using liquid chromatography-mass spectrometry. Data were analyzed with a fold-change (FC) analysis, t-test, and orthogonal partial least square-discriminant analysis. Fifty-two metabolites were classified into two groups by the FC, p, and the variable importance in projection (VIP). Low K led to an increment in 40 metabolites (FC > 2, p < 0.05, VIP > 1) and a decrease in 12 metabolites (FC < 0.5, p < 0.05, VIP > 1). Ten pathways were significantly enriched with metabolic biomarkers. In light of the complex interactive relationships among N, P, and K, the top five biomarkers were screened further by VIP > 4.00. Adenosine, FA 18:1+3O, uridine, cis-aconitate, and D(-)-gulono-gamma-lactone showed an increase in low-K stress samples, and may be considered potential metabolic biomarkers. This study validates the impact of low K on lettuce metabolism, and identifies biomarkers that can be used to monitor the K status in lettuce.

1. Introduction

Lettuce (Lactuca sativa L.) is a common leaf vegetable that provides a variety of antioxidant phytochemicals, including vitamin C, tocopherols, carotenoids, and polyphenols. These compounds decrease the production of reactive oxygen species and thus alleviate damage to cell components [1,2]. FAO statistics show that the worldwide production of lettuce has reached 27 million tons, about 57% of which come from China. Potassium (K), one of three major nutrients needed for plant growth [3], accounts for up to 5% of dry plant weight [4]. K is engaged in multiple physiological procedures (e.g., photosynthesis, transpiration, growth, development) and is important for pathogen and pest resistance [5]. K shortage destroys ion homeostasis, osmotic modulation, enzymic behaviors, membrane polarization, and diverse metabolic steps [6,7]. A reduction in K in the nutrient solution considerably lowers plant biomass in all lettuce species, especially leaves, total leaf area, shoot weight, and relative chlorophyll level [8].
Monitoring changes in K is difficult, and it relies on the soil properties, the genetic cross, and other nutrition [9]. Spectroscopy is applied to evaluate plant quality, particularly nutrient elements. Mutanga et al. [10] reported that K affects absorption in the visible region of the spectrum. Xiong et al. [11] applied visible shortwave near-infrared spectra and chemometry to assess the K concentration in fresh lettuce. Liu et al. [12] tested the K content in tobacco leaves by building a partial least squares model with a determination coefficient of 0.909 and a root mean square error of 0.119, which falls in the NIR spectrum. K shortage usually leads to dark green plants with yellow-brown leaf edges and it causes dark brown necrotic spots on the tips of old leaves [13]. Chen et al. [14] identified K nutritional stress in rice based on machine vision and object-targeted division. Weksler et al. [15] detected a K deficiency at the early stages using proximal hyper-spectra and extreme gradient boosting.
Leaf biomarkers that indicate variations in K status before the onset of symptoms are important to precisely determine K stress during cultivation [16,17]. Metabolomics is used to understand the effect of culturing conditions on plants and to evaluate the quality of agricultural goods [18,19,20,21]. K shortage is linked with the initiation of certain pathways and the gathering of metabolic biomarkers [22]. Attempts have been made in the last ten years to understand the mechanisms of plant reactions to low K. Sung et al. [5] investigated the broad-scale metabolic reactions of tomato leaves and roots to K deficiency. Mirande-Ney et al. reported that K availability quickly led to variations in leaf primary metabolism, creating way to utilize the leaf metabolic signature to reflect K nutrition in oil palm [9]. Cui et al. studied the changes in oil palm and sunflower leaf metabolites under low K stress [4,19].
Ignoring early events can be detrimental when detecting the K status of crops, as recognizing the first symptoms of shortage is critical for modulating fertilization quickly, and thus avoiding negative impacts on yield [16]. Herein, the metabolites of lettuce leaves were tested by liquid chromatography-mass spectrometry (LC-MS) to provide a reference for clarifying the changes in the abundance of metabolites and the metabolic pathways under low K stress.

2. Materials and Methods

2.1. Samples Cultivation Procedure

Lettuce (L. sativa L. Italian, Woshu Seeds Co. Ltd., Nanjing, China) was planted in a closed culturing room with an air conditioner and artificial lighting. The cultivation procedure is shown in the Supplementary Figure S1. The lettuce seeds were sown in sponge blocks until five leaves were present. Then, the lettuce seedlings with similar growth were selected and transplanted into rockwool cubes (50 × 50 × 50 mm). Nine lettuce plants were placed in a stainless-steel tray, and four stainless-steel trays were placed in a micro-plant factory. The lettuces were grown under red and blue LED lamps (red/blue ratio 5:1), the red LEDs had a range of 600 to 700 nm, with a peak at 660 nm; the blue LEDs had a range of 400 to 500 nm, with a peak at 450 nm. The photosynthetic photon flux density was 200 µmol photons m−2 s−1 with 12 h/day of lighting. The mean air temperature was 20 ± 5 °C, with 60–80% relative humidity and 400 ± 10 μmol mol−1 CO2.

2.2. Fertilization

Lettuces were grown using Yamasaki formula lettuce nutrient solution (mg L−1) (Ca(NO3)2·4H2O, 236; KNO3, 404; NH4H2PO4, 57; MgSO4·7H2O, 123; Fe–EDTA, 16; MnCl2·4H2O, 1.2; H3BO3, 0.72; ZnSO4·4H2O, 0.09; CuSO4·5H2O, 0.04; (NO4)2Mo7O4, 0.01). Reduced K treatments were done from the day of transplanting, with NaNO3 instead of KNO3 in nutrient solutions. All other nutrient contents were keeping constant. The treatments were as follows: (1) control group (C), lettuces were cultured in Yamasaki formula lettuce nutrient solution containing 100% level of KNO3; (2) low K group (K), lettuces were cultured in Yamasaki formula lettuce nutrient solution containing 0% level of KNO3. The conductivity of the nutrient solutions was 1.6 dS·m−1, pH 6.0.

2.3. Chemical and Metabolomics Analyses

After 2 weeks, 36 lettuce plants from the control and low K groups were harvested between 10:00 and 12:00. After removal of the roots, the lettuce was divided into two equal parts, which were used separately for metabolomics analyses and determination of the nitrogen (N), phosphorus (P), and K content. Then, the fresh samples were oven-dried at 70 °C for 24 h and then ground and oven-dried again at 70 °C to a constant weight, forming a powder that was sieved to 0.5 mm. The powder was dissolved with 98% sulfuric acid (w/w) until the solution was transparent. N was determined by the Kjeldhal method, those of P by colorimeter, and the determination of K was made by the flame spectrophotometer. Total N, P, and K content were measured by chemical analysis. In the control group (C), the K content was 36.78 ± 1.17 g/kg, the P content was 7.51 ± 0.33 g/kg, and the K content was 71.33 ± 3.02 g/kg. In the low K group, the total N content was 40.45 ± 1.85 g/kg, and the P content was 8.32 ± 0.37 g/kg.
Metabolites were measured by metabolomics analyses. The leaves were washed gently in deionized water and quickly frozen in liquid nitrogen. After lyophilization, the leaflets were ground into fine powder in 1 mL methanol–acetonitrile–water (2:2:1, v/v/v). The samples were placed at 4 °C for 15 min, centrifuged at 16,626× g, and shaken in a thermomixer. The extracted specimens were analyzed by LC-MS after centrifugation. A pooled quality control (QC) specimen was made by blending equal amounts of the supernatant from each sample to detect the system stability.
The compounds were separated with an Agilent 1290 Infinity LC system (Agilent Technologies, Palo Alto, CA, USA) equipped with an Acquity UPLC BEH amide column (2.1 mm × 100 mm, 1.7 μm) (Waters Corp., Milford, MA, USA). The metabolites were detected using an ultra-HPLC (UPL)-quadrupole time-of-flight MS system. Assays were carried out with a triple time-of-flight 5600+ MS meter (AB SCIEX, Framingham, MA, USA). Details were provided previously in [23].

2.4. Statistics

Data preprocessing included peak alignment, retention time correction, and peak area extraction of the raw data. Univariate (fold-change (FC) analysis, t-test) and multivariate algorithms (orthogonal partial least squares-discriminant analysis (OPLS-DA)) of the metabolomics data were used to screen the metabolites. The univariate statistical analysis was conducted using SPSS 20.0 (SPSS Inc., Chicago, IL, USA) and Origin 8.0 (Origin Laboratories, Northampton, MA, USA). The OPLS-DA was used to distinguish the groups while calculating the mathematical models ignoring the intra-group random discrepancies to focus on inter-group systematic differences, enhancing the efficiency and analytical strength of the model [24]. Unsupervised multivariate analysis was done on SIMCA-P 14.1 (Umetric, Umea, Sweden). The metabolic biomarkers were selected between the two treatments. The FC, p, and variable importance in projection (VIP) were the variables. MetaboAnalyst [25], based on the KEGG metabolic pathway database, was used for the pathway analysis.

3. Results

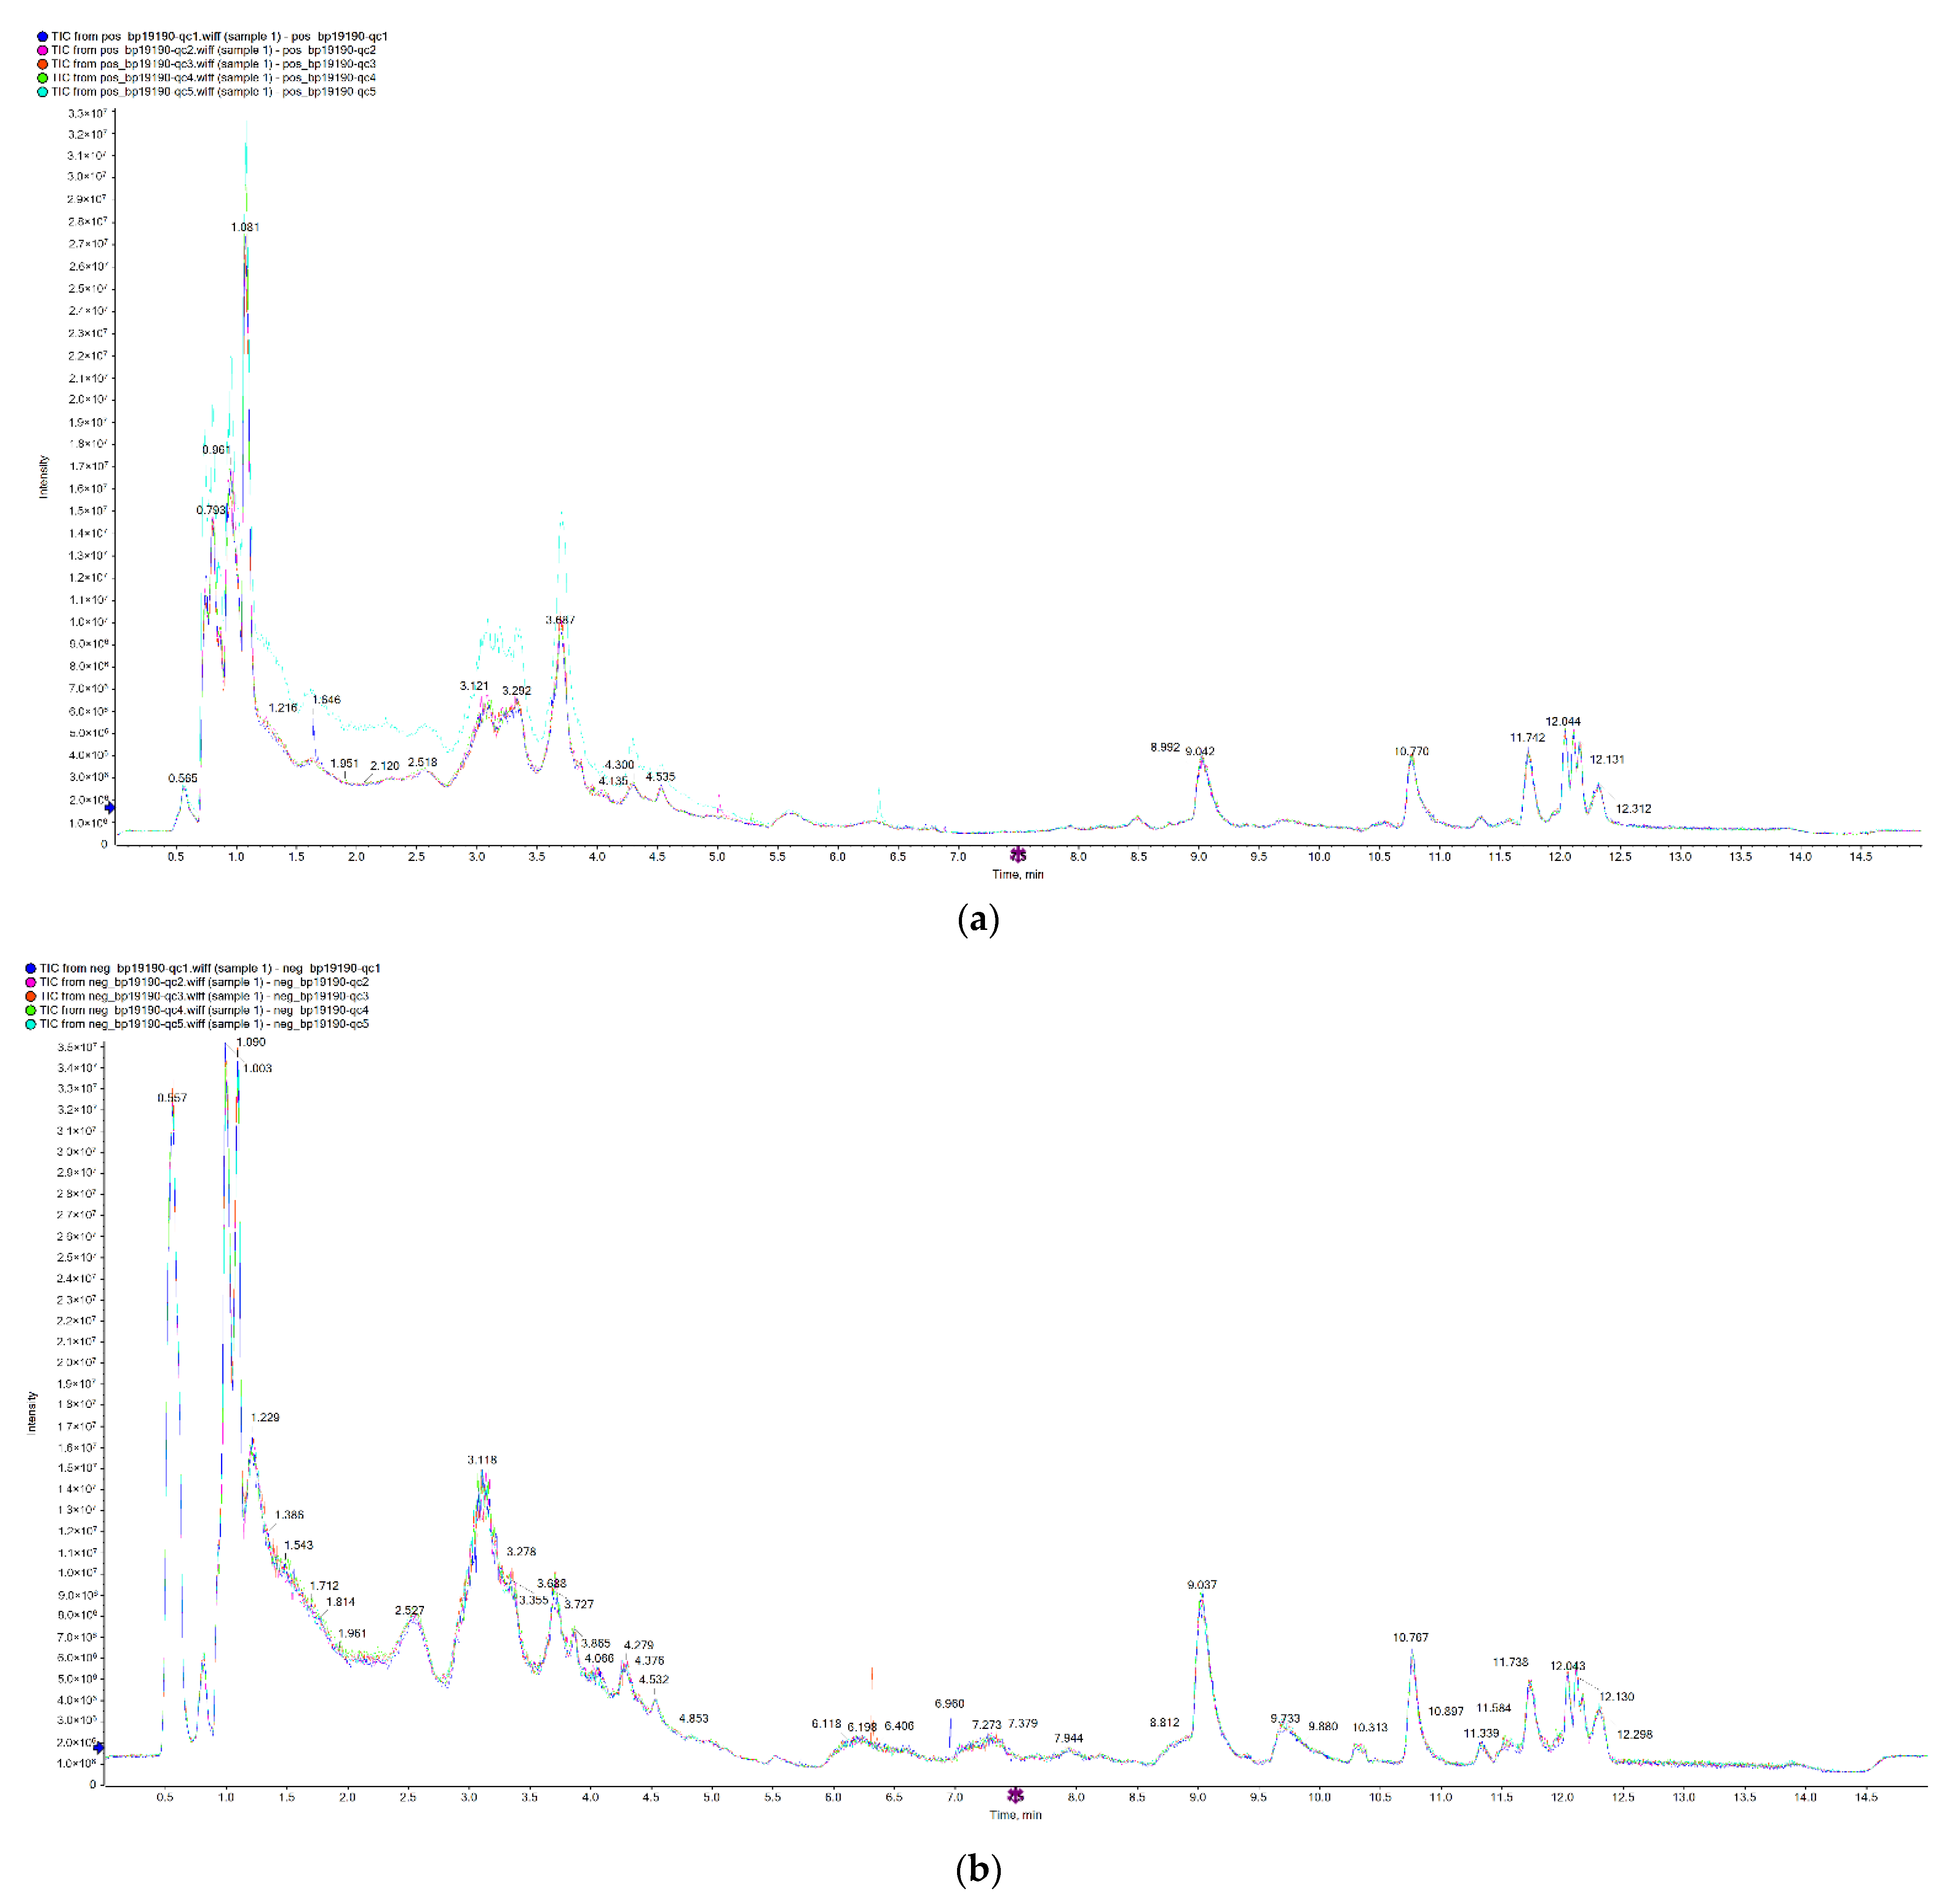
3.1. System Stability Analysis

Figure 1a,b illustrates the total ion current chromatograms of the QC specimens in positive (ESI+) and negative (ESI−) ion modes, respectively. The reaction intensity and retention time overlapped, indicating that the instrumental discrepancy in the assays was small (Figure 1). The correlation between the QC samples was >0.9, and no outliers were detected in Hotelling’s T2 region (95% confidence interval).

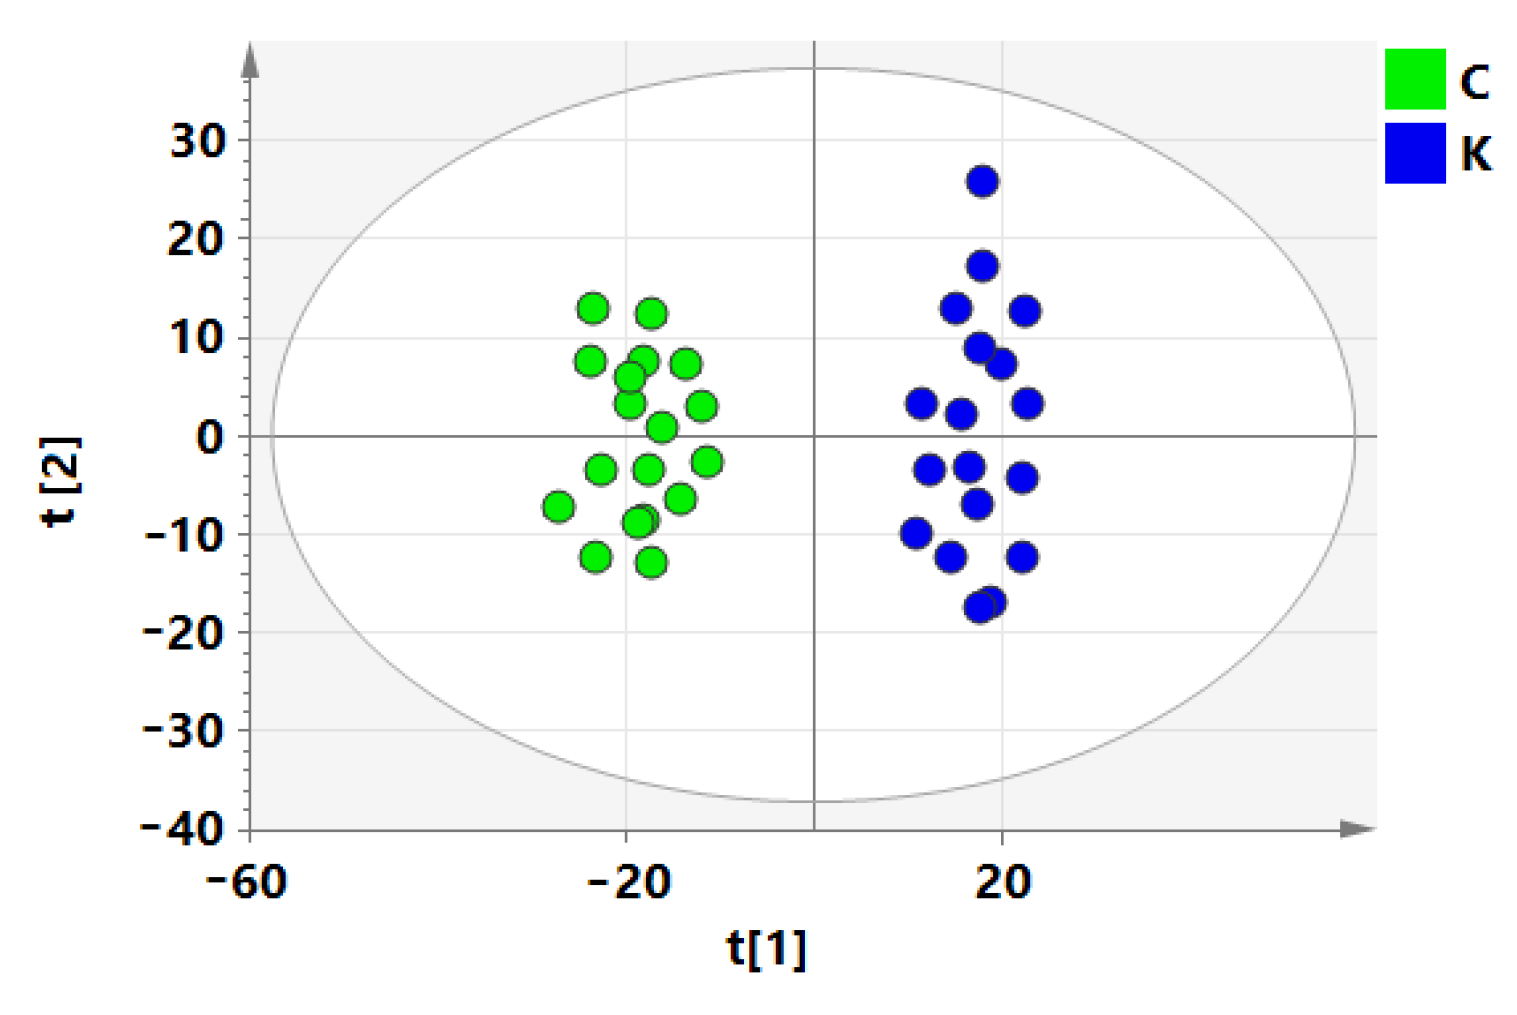
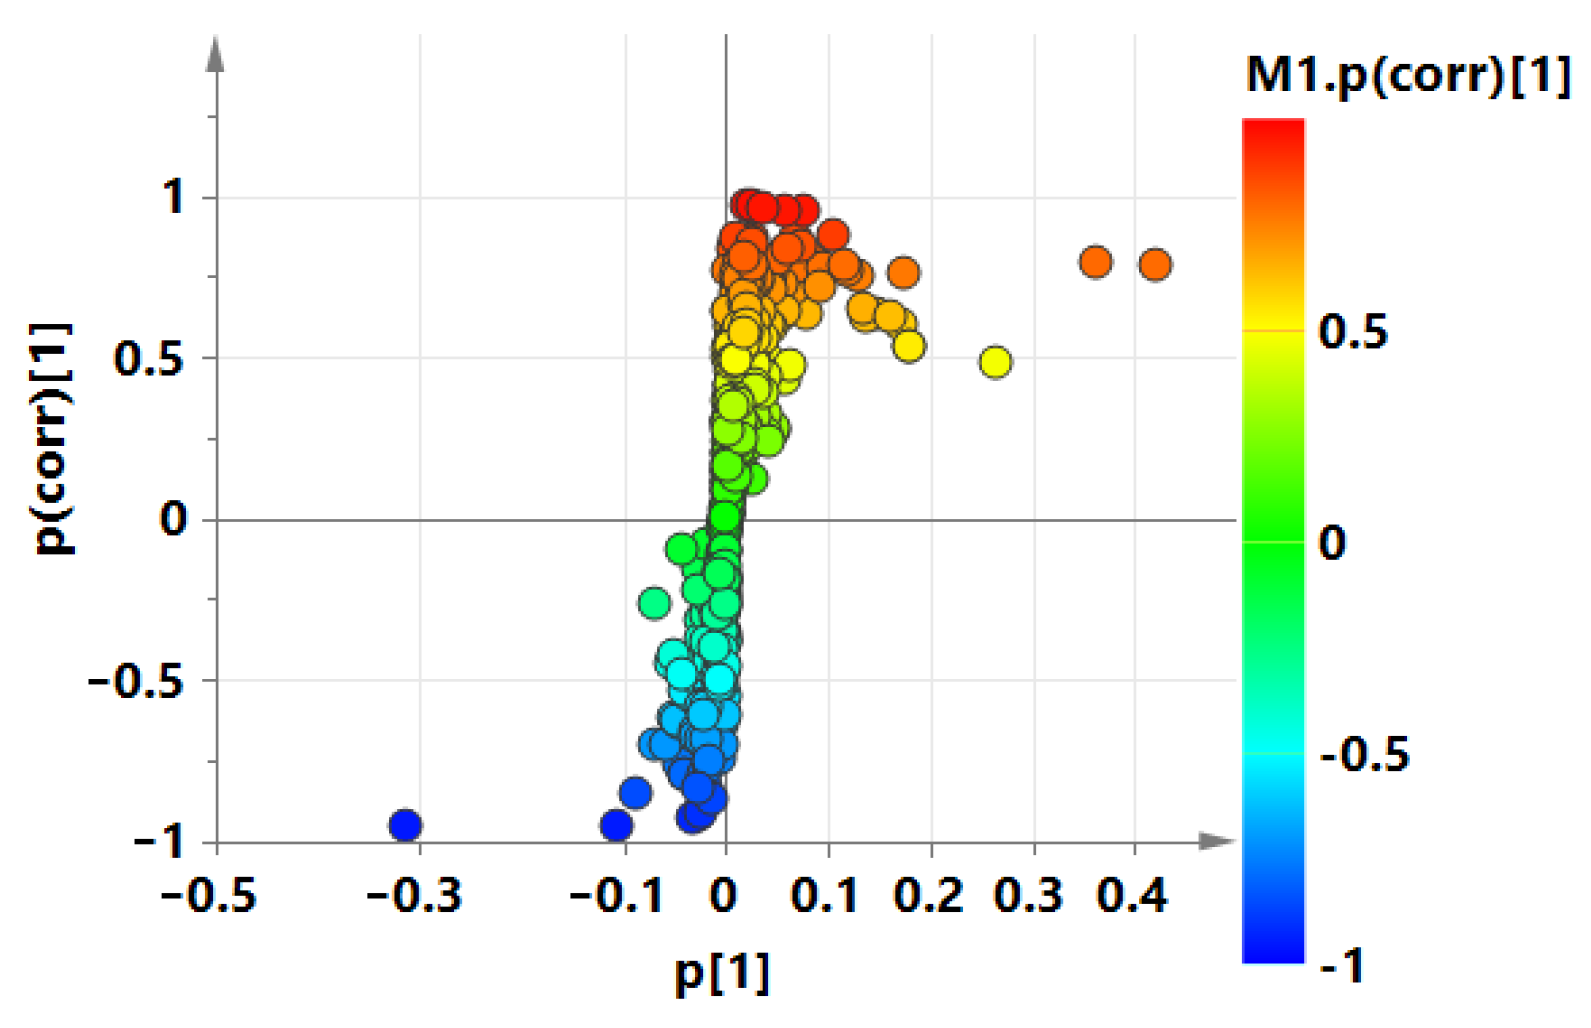
3.2. Screening of Differential Metabolites

The structure of the metabolites was recognized by mass number matching (<25 ppm) and secondary spectral matching. The ion peaks with >50% missing data were deleted, the data were standardized using Pareto-scaling. A total of 22,807 metabolite ions were detected, of which 13,035 were acquired in ESI− and 9772 were acquired in ESI+.
The upregulated (FC > 2) (p < 0.05) and downregulated (FC < 0.5) (p < 0.05) metabolites were sought using a volcano map. The red, green and blue dots in Figure 2 are upregulated, downregulated and unchanged metabolites, respectively. Low K induced an increase in 5106 (22.39%) metabolites and a decrease in 6275 (27.51%) metabolites. According to the structural features of the downregulated and upregulated metabolites, 508 metabolites were identified (281 (1.23%) metabolites in ESI− and 227 (0.99%) in ESI+).
To investigate the influence of low K on the lettuce metabolites, OPLS-DA was used to filter and classify the uncorrelated or orthogonal signals, and the OPLS-DA model was obtained. The OPLS-DA model score (Figure 3) confirmed that the metabolites differed between the two groups. Next, to avoid overfitting, the model quality was tested by seven-fold interactive verification and the 200-reaction sequencing test. The OPLS-DA model was established to obtain the corresponding stochastic models for the R2 and Q2 values, which were used to determine whether the model was overfitted. As shown in Figure 4, the model was valid when the Q2 intercept was less than zero. The results based on the specimens were highly predictable.
The metabolites that critically contributed to sample division were recognized on the basis of the distribution of the V and S plots for the OPLS-DA model. The V plot of the OPLS-DA model is shown in Figure 5. The metabolites that were significantly discrepant between the two groups were chosen using VIP > 1. The S-plot of the OPLS-DA model (Figure 6) demonstrates that the spot further away from the origin makes more contribution to the division. The compounds closer to the lower left and upper right corners contributed more to the sample classification. In sum, 52 compounds were recognized as critical factors that contribute to low K stress.

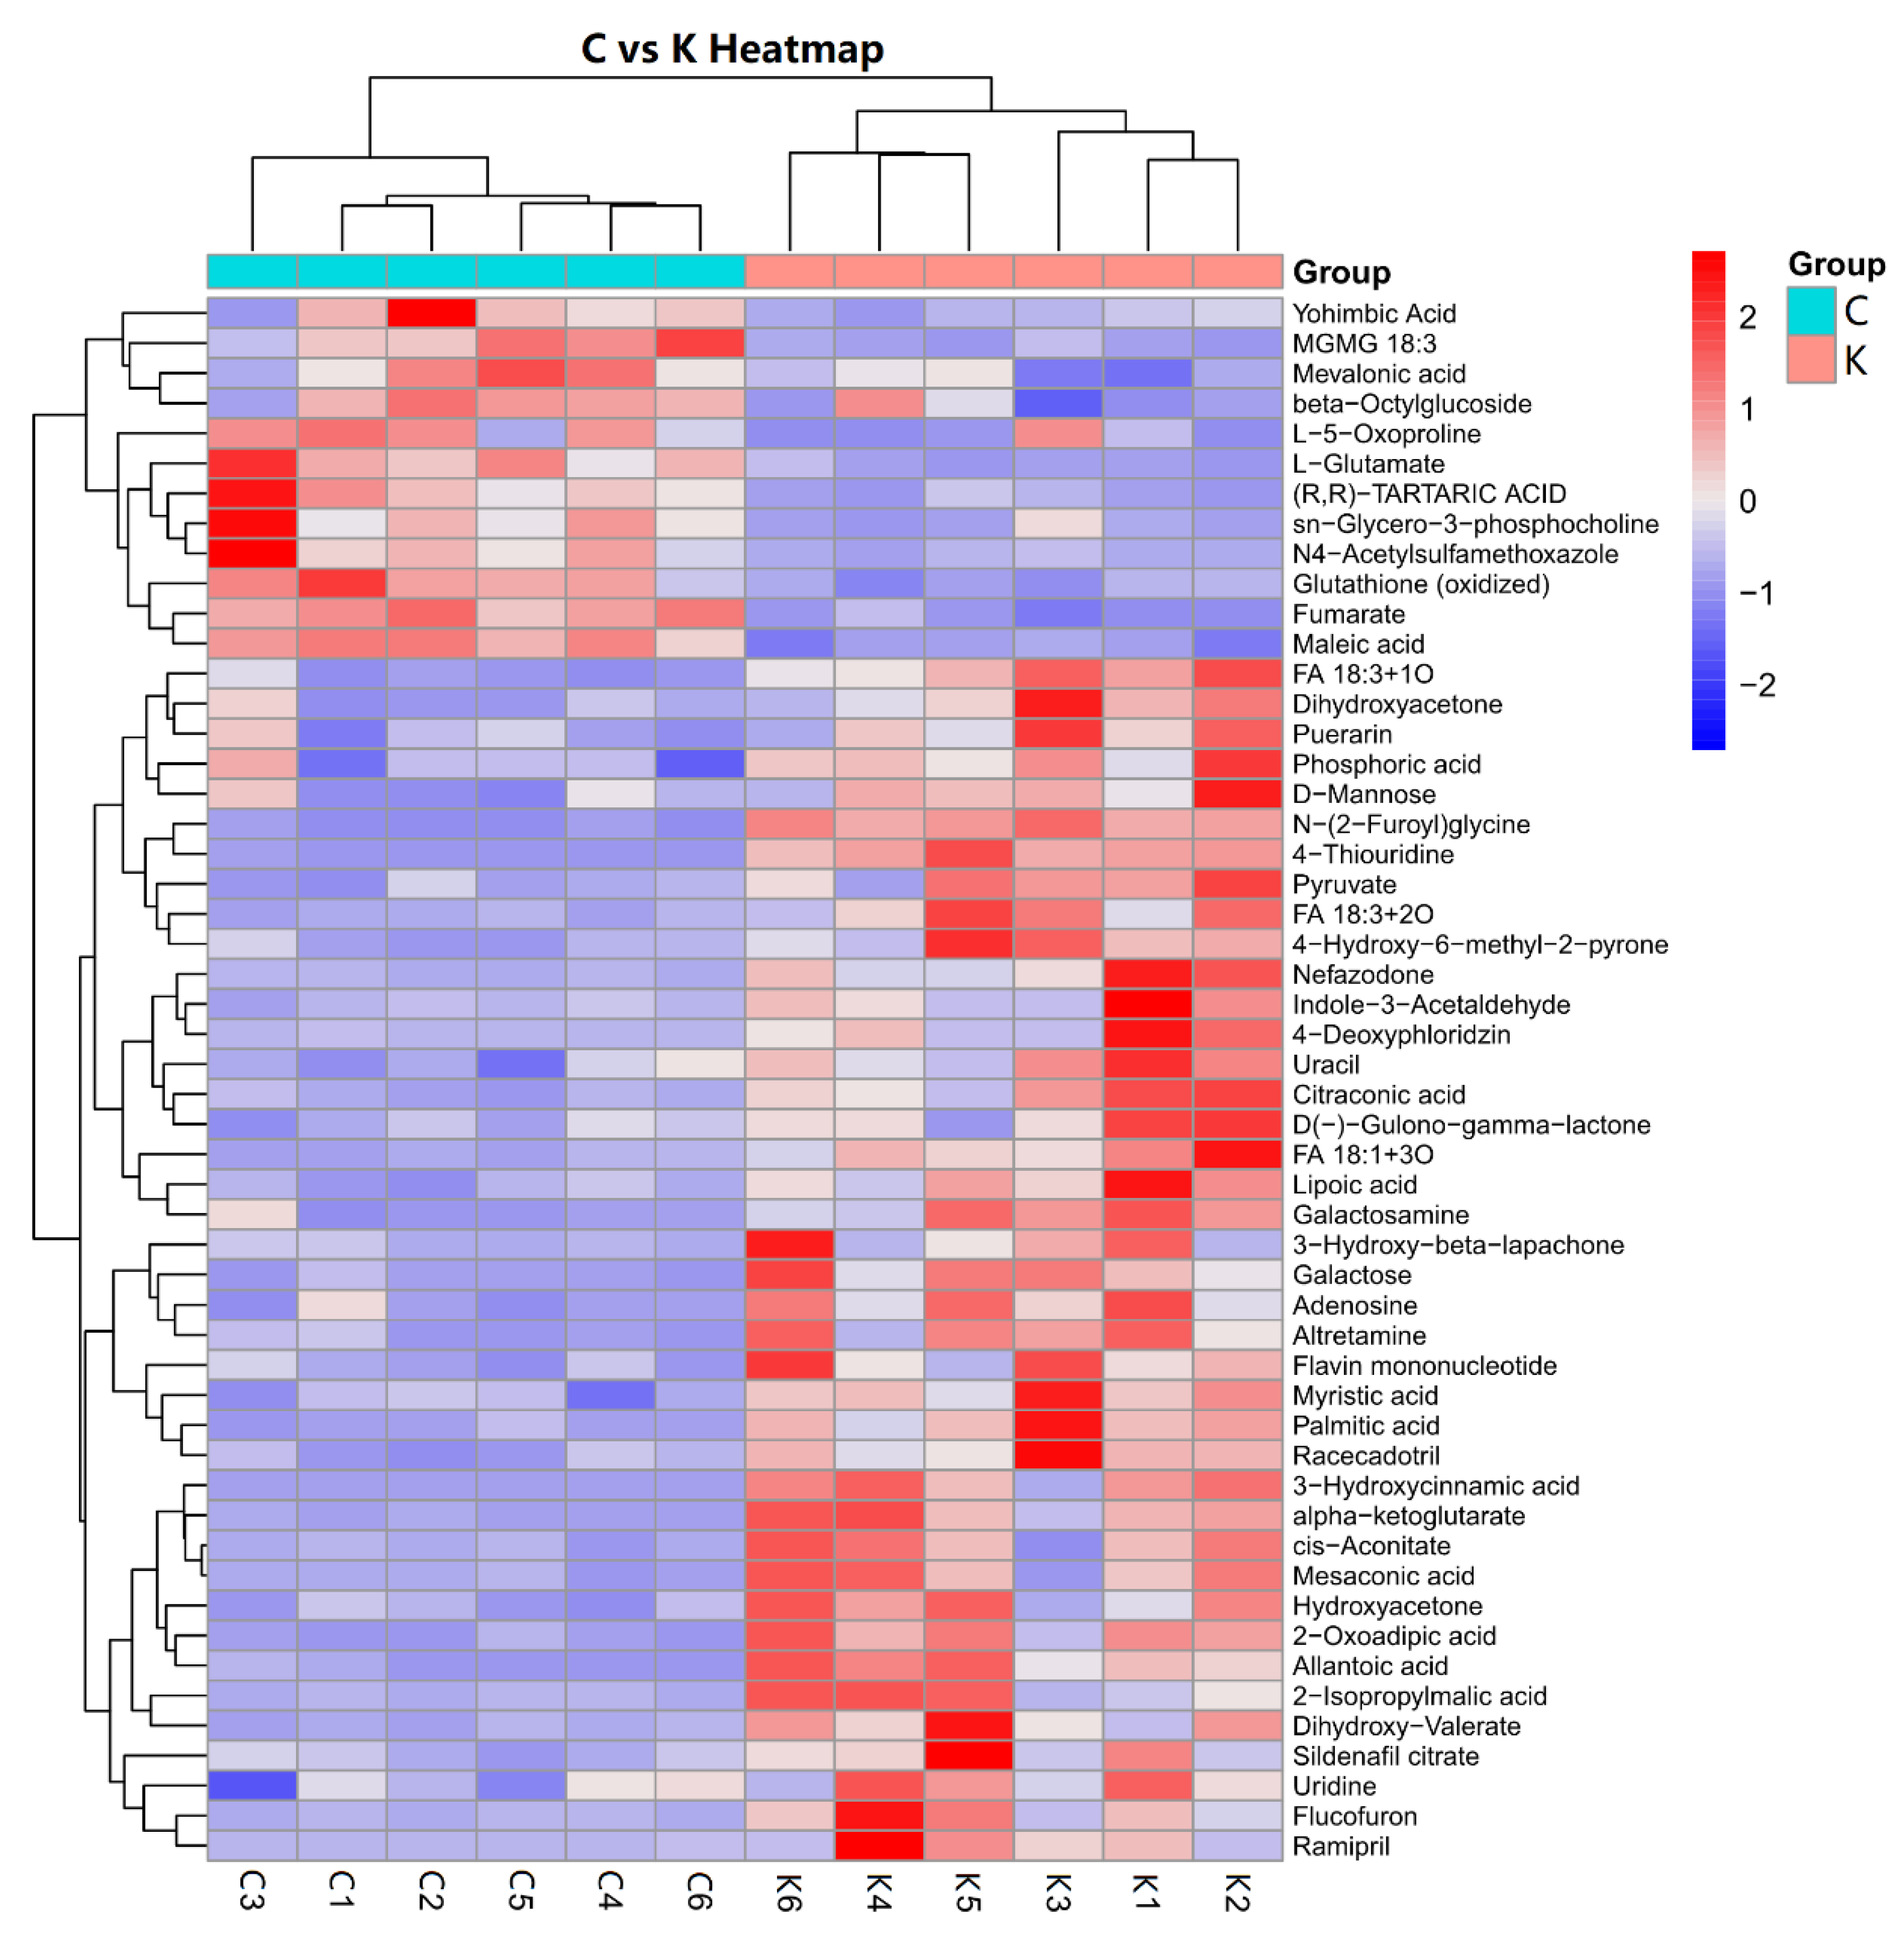
3.3. Hierarchical Clustering for Screening of Differential Metabolites

The hierarchical clustering heat map is another useful tool to evaluate the relationship among the samples in the OPLS-DA model [26] and to reveal the differences in metabolites. Twelve samples were randomly selected from the normal and K-stressed samples, and 52 metabolic biomarkers were analyzed. The left side of the horizontal axis of the heat map in Figure 7 is the control group; the right side is the low K group, and the vertical axis has the names of the metabolic biomarkers. Blue and red reflect a decline and a rise in metabolites, respectively. Low K stress led to an increment in 40 metabolites and a drop in 12 metabolites.

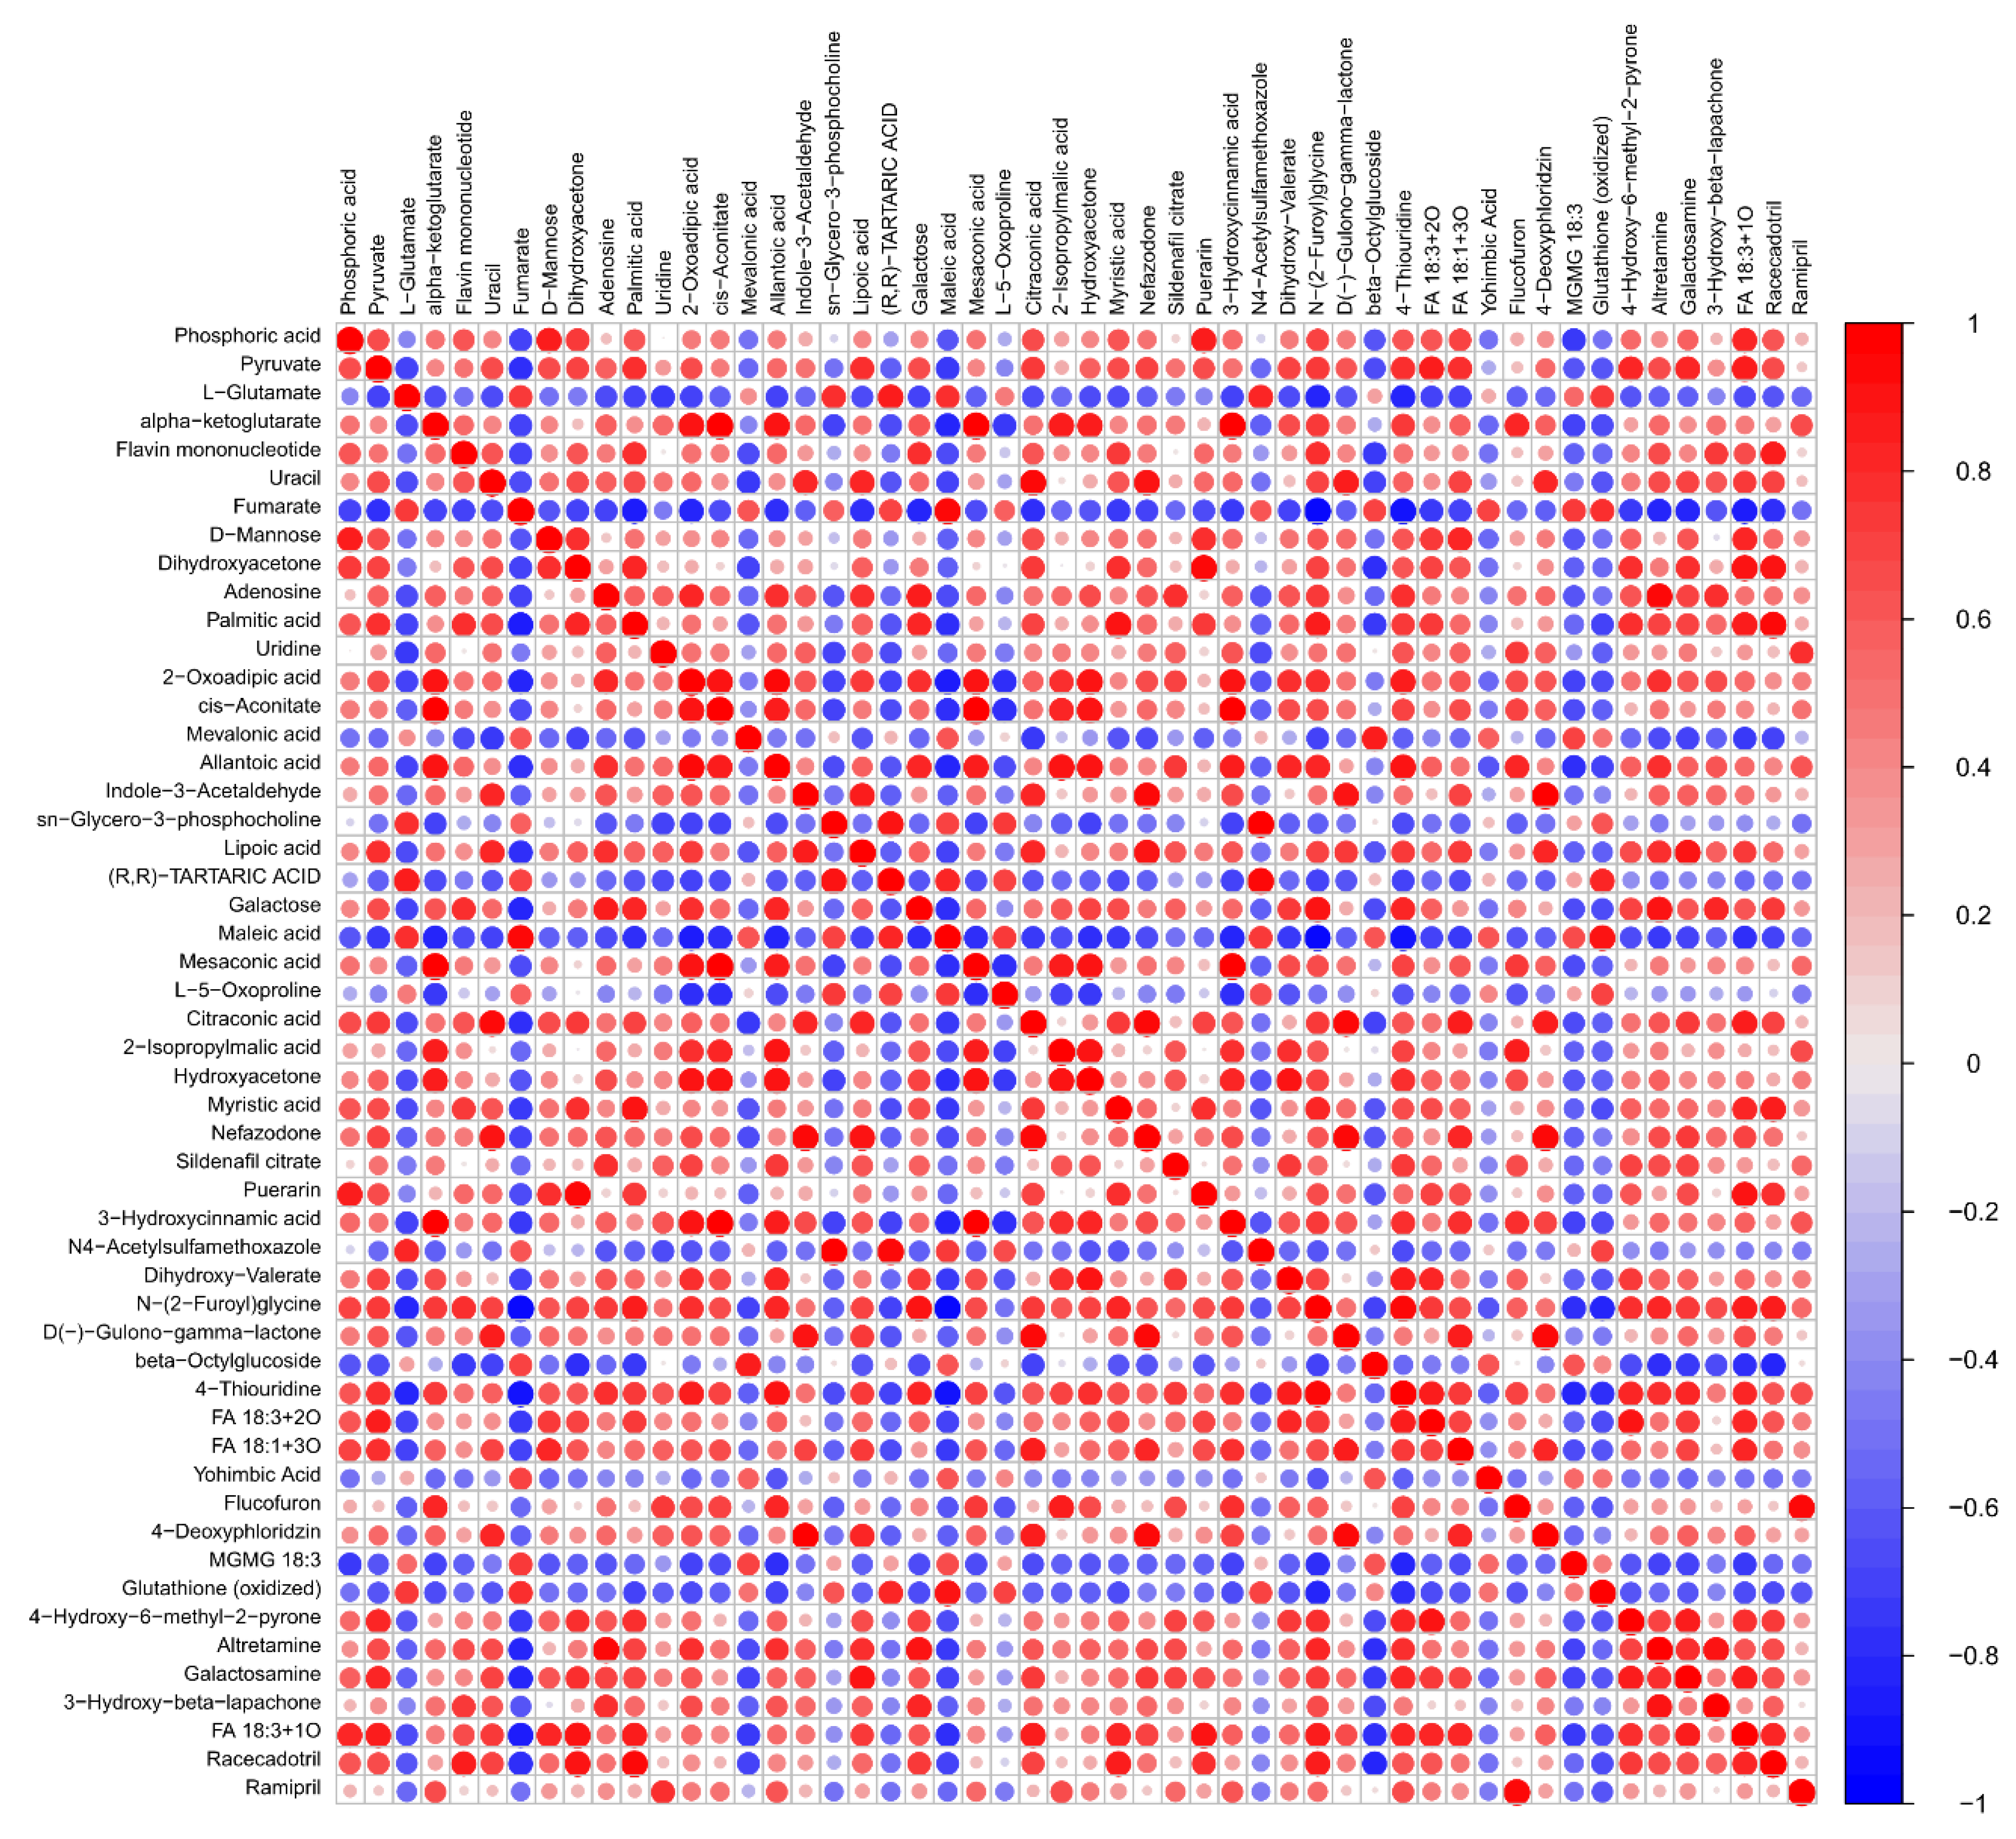
3.4. Metabolite Correlation Analysis

Correlation analysis is a powerful way to characterize the proximities of the differential metabolites and it can identify the modulation relationships among metabolites during growth [27]. Pearson’s correlation analysis was chosen to determine the correlations between the 52 metabolic biomarkers under low K stress. The correlation results are displayed visually in a correlation heat map (Figure 8). The color bars that range from blue to red represent correlation coefficients from −1 to 1.

3.5. KEGG Annotation and Pathway Analysis

KEGG is a database for pathway research that can be used to determine the biological functions of metabolites. Thus, an investigation of KEGG pathways helps identify the biofunctions. Here, the 52 metabolites were mapped to 113 pathways, indicating that 42 of these pathways with p-values < 0.05 had apparent effects on a variety of metabolites. The top 10 KEGG pathways were clarified (Figure 9). The metabolic pathways with the largest bubble and darkest color were the most significant.

4. Discussion

In regard to their external physical properties, plants reduce the density of leaves or branches, leaf area, height, or root volume when faced with certain nutritional stresses [28,29]. Plants have various defense functions to address stresses, metabolically relieve nutritional stress, and promote the gathering or lessening of metabolic biomarkers during stress [30,31]. The change in metabolic biomarkers must occur earlier than changes in the morphological characteristics [32]. Hence, identifying biomarkers is a promising approach to detect the type of nutritional stress that drives the defense reactions to protect the plant from the stressor [33].
However, N, P, and K, the three richest mineral elements obtained by plants, directly or indirectly impact plant metabolic pathways and thus influence the amount of metabolites [5]. The complicated relationships among N, P, and K metabolism have been reported [9,34,35]. In a previous study [23], we examined the metabolic effects of low N and low P on lettuce under identical controlled conditions. The following discussion illustrates the differences in the metabolic pathways and biomarkers in reaction to low levels of N, P, and K.

4.1. Impact of N, P, K Deficiencies on Lettuce Metabolic Pathways

The Venn diagram of the top 10 metabolic pathways is shown in Figure 10a, aside from the global and overview map (map01100), three enriched pathways were evident after comparing N and K stress, including biosynthesis of plant secondary metabolites (map01060), C5-branched dibasic acid metabolism (map00660), and butanoate metabolism (map00650). Biosynthesis of plant secondary metabolites, biosynthesis of plant hormones (map01070), the citrate (TCA) cycle (map00020), biological generation of alkaloids derived from ornithine, lysine, and nicotinic acid (map01064), glyoxylate and dicarboxylate metabolism (map00630) were the five metabolic pathways under the P and K stressors. The biosynthesis of the plant secondary metabolites pathway responded to all three stressors. Plants generate chemically diverse secondary metabolites, which often function as defense factors to protect plants from all kinds of unfavorable conditions [33,36]. Among these, pyruvate is a 2-oxo monocarboxylic acid anion resulting from the deprotonated carboxy group, which involved 39 metabolic pathways.

4.2. Impact of N, P, K Deficiencies on Lettuce Downregulated Metabolic Biomarkers

The Venn diagram of downregulated metabolic biomarkers is shown in Figure 10b. Low N stress caused a decrease in 34 metabolites, low P stress induced a decrease in 31 metabolites [23], and low K stress caused a decrease in 12 metabolites. On these, low N and low K stress led to a decrease in six metabolites, which were L-glutamate, fumarate, maleic acid, L-5-oxoproline, MGMG 18:3 and glutathione (oxidized). Low P and low K stress caused a decrease in eight metabolites, which were L-glutamate, fumarate, mevalonic acid, sn-glycero-3-phosphocholine, maleic acid, N4-acetylsulfamethoxazole, yohimbic acid and glutathione (oxidized).

4.3. Effect of N, P, K Deficiencies on Lettuce Upregulated Metabolic Biomarkers

The Venn diagram of upregulated metabolic biomarkers is displayed in Figure 10c. Low N initiated an increase in 21 metabolites, low P resulted in an increment in 45 metabolites [23], and low-K stress caused an increase in 40 metabolites. Low N and low P led to an increase in 16 metabolites, and low N and low K induced an increase in 2 metabolites, which were identified as sildenafil citrate and FA 18:3+2O. These results show that N and P had significant interactive impacts, which is consistent with previous observations [37,38].
Studies prove the close relationship between K and N in plants. Particularly, NH4+ can significantly inhibit the high-affinity K+ uptake system [39,40]. Though K is not metabolized, K is vital in many parts of plant metabolism and is engaged in the functions of 46 enzymes [41]. K is also important for protein formation, including enzyme activation, ribosome production and mRNA turnover [42].
The low-K stress biomarker panel included 38 metabolites, except sildenafil citrate and FA 18:3+2O. The biomarkers are listed in Table 1 and are not suitable for practical applications. Therefore, the top five biomarkers were further identified with VIP > 4.00, which were adenosine, FA 18:1+3O, uridine, cis-aconitate, and D(-)-gulono-gamma-lactone. Adenosine, which is a ribonucleoside comprised of adenine bound to ribose was involved in seven metabolic pathways. Phosphorylated forms of adenosine play a role in cellular energy transfer, signal transduction and the synthesis of RNA.

5. Conclusions and Perspectives

Metabolomics is a novel post-genomic field. This study suggests that mineral deficiencies, particularly K, has various effects on lettuce metabolism as indicated by the remarkable changes and the differences in the metabolic biomarkers and pathways. In this report, the variations in lettuce metabolites under low K stress were investigated using the LC-MS platform. We found 52 regulated biomarkers that facilitated the classification. In particular, among the 40 upregulated biomarkers, and after eliminating the effects of the complex interaction relationships between N, P and K, the top five were further screened by VIP > 4.00. Metabolic biomarkers can be used to detect the early K status of lettuce, and the use of metabolomics methods will help us to further understand the effects of nutritional stress in agriculture. Nevertheless, more work on quantitation under different levels of low-K stress is needed, which will be done in the future.

Supplementary Materials

The following are available online at https://www.mdpi.com/article/10.3390/agriculture12081153/s1, Figure S1: Samples cultivation.

Author Contributions

Conceptualization, H.G. and L.G.; software, H.G.; writing—original draft preparation, H.G.; writing—review and editing, H.G., L.G., J.N. and Q.L.; project administration, H.G., L.G., J.N. and Q.L.; funding acquisition, H.G. and Q.L. All authors have read and agreed to the published version of the manuscript.

Funding

Funding was received for this project from the Faculty of Agricultural Equipment of Jiangsu University (NZXB20200203); Key Technologies Research and Development Program of China (2018YFF0213601); Open Fund of the Ministry of Education Key Laboratory of Modern Agricultural Equipment and Technology (JNZ201903); Priority Academic Program Development of Jiangsu Higher Education Institutions (PAPD-2018-87).

Conflicts of Interest

The authors declare no conflict of interest.

References

  1. Zhou, W.; Liang, X.; Li, K.; Dai, P.; Li, J.; Liang, B.; Sun, C.; Lin, X. Metabolomics analysis reveals potential mechanisms of phenolic accumulation in lettuce (Lactuca sativa L.) induced by low nitrogen supply. Plant Physiol. Biochem. 2021, 158, 446–453. [Google Scholar] [CrossRef] [PubMed]
  2. Saah, K.J.A.; Kaba, J.S.; Abunyewa, A.A. Inorganic nitrogen fertilizer, biochar particle size and rate of application on lettuce (Lactuca sativa L.) nitrogen use and yield. All Life 2022, 15, 624–635. [Google Scholar] [CrossRef]
  3. Pettigrew, W.T. Potassium influences on yield and quality production for maize, wheat, soybean and cotton. Physiol. Plant 2010, 133, 670–681. [Google Scholar] [CrossRef]
  4. Cui, J.; Abadie, C.; Carroll, A.; Lamade, E.; Tcherkez, G. Responses to K deficiency and waterlogging interact via respiratory and nitrogen metabolism. Plant Cell Environ. 2019, 42, 647–658. [Google Scholar] [CrossRef]
  5. Sung, J.; Lee, S.; Lee, Y.; Ha, S.; Song, B.; Kim, T.; Waters, B.M.; Krishnan, H.B. Metabolomic profiling from leaves and roots of tomato (Solanum lycopersicum L.) plants grown under nitrogen, phosphorus or potassium-deficient condition. Plant Sci. 2015, 241, 55–64. [Google Scholar] [CrossRef]
  6. Lu, Z.; Ren, T.; Pan, Y.; Li, X.; Cong, R.; Lu, J. Differences on photosynthetic limitations between leaf margins and leaf centers under potassium deficiency for Brassica napus L. Sci. Rep. 2016, 6, 21725. [Google Scholar] [CrossRef] [Green Version]
  7. Chérel, I.; Michard, E.; Platet, N.; Mouline, K.; Thibaud, J.B. Physical and Functional Interaction of the Arabidopsis K+ Channel AKT2 and Phosphatase AtPP2CA. Plant Cell 2002, 14, 1133–1146. [Google Scholar] [CrossRef] [Green Version]
  8. Zhang, G.; Johkan, M.; Hohjo, M.; Tsukagoshi, S.; Maruo, T. Plant Growth and Photosynthesis Response to Low Potassium Conditions in Three Lettuce (Lactuca sativa) Types. Hortic. J. 2017, 86, 229–237. [Google Scholar] [CrossRef] [Green Version]
  9. Mirande-Ney, C.; Tcherkez, G.; Balliau, T.; Zivy, M.; Gilard, F.; Cui, J.; Ghashghaie, J.; Lamade, E. Metabolic leaf responses to potassium availability in oil palm (Elaeis guineensis Jacq.) trees grown in the field. Environ. Exp. Bot. 2020, 175, 104062. [Google Scholar] [CrossRef]
  10. Mutanga, O.; Skidmore, A.K.; Prins, H.H.T. Predicting in situ pasture quality in the Kruger National Park, South Africa, using continuum-removed absorption features. Remote Sens. Environ. 2004, 89, 393–408. [Google Scholar] [CrossRef]
  11. Xiong, Y.T.; Ohashi, S.; Nakano, K.; Jiang, W.Z.; Takizawa, K.; Iijima, K.; Maniwara, P. Quantification of potassium concentration with Vis-SWNIR spectroscopy in fresh lettuce. J. Innov. Opt. Health Sci. 2020, 13, 2050029. [Google Scholar] [CrossRef]
  12. Liu, D.S.; Jin, L.S.; Yang, Z.H.; Han, X.R.; Lin, G.L. Rapid Determination of Potassium Content in Flue-cured Tobacco Leaves by Near Infrared Reflectance Spectroscopy. Chin. J. Soil Sci. 2010, 41, 417–419. [Google Scholar]
  13. Xu, Z.; Guo, X.; Zhu, A.; He, X.; Zhao, X.; Han, Y.; Subedi, R. Using Deep Convolutional Neural Networks for Image-Based Diagnosis of Nutrient Deficiencies in Rice. Comput. Intell. Neurosci. 2020, 2020, 7307252. [Google Scholar] [CrossRef]
  14. Chen, L.S.; Huang, S.H.; Sun, Y.Y.; Zhu, E.Y.; Wang, K. Rapid Identification of Potassium Nutrition Stress in Rice Based on Machine Vision and Object-Oriented Segmentation. J. Spectro. 2019, 2019, 4623545. [Google Scholar] [CrossRef]
  15. Weksler, S.; Rozenstein, O.; Haish, N.; Moshelion, M.; Wallach, R.; Ben-Dor, E. Detection of Potassium Deficiency and Momentary Transpiration Rate Estimation at Early Growth Stages Using Proximal Hyperspectral Imaging and Extreme Gradient Boosting. Sensors 2021, 21, 958. [Google Scholar] [CrossRef]
  16. Cui, J.; Nieves-Cordones, M.; Rubio, F.; Tcherkez, G. Involvement of salicylic acid in the response to potassium deficiency revealed by metabolomics. Plant Physiol. Biochem. 2021, 163, 201–204. [Google Scholar] [CrossRef]
  17. Alexandersson, E.; Jacobson, D.; Vivier, M.A.; Weckwerth, W.; Andreasson, E. Field-omics-understanding large-scale molecular data from field crops. Front Plant Sci. 2014, 5, 286. [Google Scholar] [CrossRef] [Green Version]
  18. Yoshio, T.; Tetsuya, M.; Ryo, N.; Makoto, K.; Kazuki, S.; Seiichi, O.; Wang, N.; Miyako, K. Metabolomic Evaluation of the Quality of Leaf Lettuce Grown in Practical Plant Factory to Capture Metabolite Signature. Front. Plant Sci. 2018, 9, 665. [Google Scholar]
  19. Cui, J.; Davanture, M.; Zivy, M.; Lamade, E.; Tcherkez, G. Metabolic responses to potassium availability and waterlogging reshape respiration and carbon use efficiency in oil palm. New Phytol. 2019, 223, 310–322. [Google Scholar] [CrossRef]
  20. Cui, J.; Pottosin, I.; Lamade, E.; Tcherkez, G. What is the role of putrescine accumulated under potassium deficiency? Plant Cell Environ. 2020, 43, 1331–1347. [Google Scholar] [CrossRef]
  21. Jing, C.A.; El, B.; Gt, A. Potassium deficiency reconfigures sugar export and induces catecholamine accumulation in oil palm leaves. Plant Sci. 2020, 300, 110628. [Google Scholar]
  22. Takahashi, H.; Imamura, T.; Miyagi, A.; Uchimiya, H. Comparative metabolomics of developmental alterations caused by mineral deficiency during in vitro culture of Gentiana triflora. Metabolomics 2012, 8, 154–163. [Google Scholar] [CrossRef]
  23. Gao, H.Y.; Mao, H.P.; Ullah, I. Analysis of Metabolomic Changes in Lettuce Leaves under Low Nitrogen and Phosphorus Deficiencies Stresses. Agric.-Basel 2020, 10, 406. [Google Scholar] [CrossRef]
  24. Zhang, Y.; Ma, X.M.; Wang, X.C.; Liu, J.H.; Huang, B.Y.; Guo, X.Y.; Xiong, S.P.; La, G.X. UPLC-QTOF analysis reveals metabolomic changes in the flag leaf of wheat (Triticum aestivum L.) under low-nitrogen stress. Plant Physiol. Biochem. 2017, 111, 30–38. [Google Scholar] [CrossRef]
  25. MetaboAnalyst 4.0. Available online: https://www.metaboanalyst.ca/ (accessed on 15 December 2021).
  26. Shen, T.H.; Xiong, Q.Q.; Zhong, L.; Shi, X.; Cao, C.H.; He, H.H.; Chen, X.R. Analysis of main metabolisms during nitrogen deficiency and compensation in rice. Acta Physiol. Plant. 2019, 41, 68. [Google Scholar] [CrossRef]
  27. Chen, J.; Wang, W.; Kong, J.; Yue, Y.; Dong, Y.; Zhang, J.; Liu, L. Application of UHPLC-Q-TOF MS based untargeted metabolomics reveals variation and correlation amongst different tissues of Eucommia ulmoides Oliver. Microchem. J. 2022, 172, 106919. [Google Scholar] [CrossRef]
  28. Kralova, K.; Jampilek, J. Responses of Medicinal and Aromatic Plants to Engineered Nanoparticles. Appl. Sci.-Basel 2021, 11, 1813. [Google Scholar] [CrossRef]
  29. Yue, H.F.; Zhou, M.; Hou, X.K.; Yang, X.; Zhao, H.; Xu, M.S.; Wang, L.; Liu, H.M.; Wuyun, T.N.; Zhu, G.P.; et al. Effect of elements nitrogen, phosphorus and potassium on phenotype, photosynthesis and biomass accumulation in juvenile phase of Prunus armeniaca × Sibirica. Pak. J. Bot. 2022, 54, 577–588. [Google Scholar] [CrossRef]
  30. Cao, Y.W.; Qu, R.J.; Tang, X.Q.; Sun, L.Q.; Chen, Q.Q.; Miao, Y.J. UPLC-Triple TOF-MS/MS based metabolomics approach to reveal the influence of nitrogen levels on Isatis indigotica seedling leaf. Sci. Hortic. 2020, 266, 109280. [Google Scholar] [CrossRef]
  31. Chen, J.; Zeng, H.; Zhang, X. Integrative transcriptomic and metabolomic analysis of D-leaf of seven pineapple varieties differing in N-P-K% contents. BMC Plant Biol. 2021, 21, 550. [Google Scholar] [CrossRef]
  32. Groher, T.; Schmittgen, S.; Noga, G.; Hunsche, M. Limitation of mineral supply as tool for the induction of secondary metabolites accumulation in tomato leaves. Plant Physiol. Biochem. 2018, 130, 105–111. [Google Scholar] [CrossRef]
  33. Jan, R.; Asaf, S.; Numan, M.; Lubna; Kim, K.M. Plant Secondary Metabolite Biosynthesis and Transcriptional Regulation in Response to Biotic and Abiotic Stress Conditions. Agron.-Basel 2021, 11, 968. [Google Scholar] [CrossRef]
  34. Wang, Y.; Wu, W.H. Regulation of potassium transport and signaling in plants. Curr. Opin. Plant Biol. 2017, 39, 123–128. [Google Scholar] [CrossRef]
  35. Armengaud, P.; Sulpice, R.; Miller, A.J.; Stitt, M.; Amtmann, A.; Gibon, Y. Multilevel analysis of primary metabolism provides new insights into the role of potassium nutrition for glycolysis and nitrogen assimilation in Arabidopsis roots. Plant Physiol. 2009, 150, 772–785. [Google Scholar] [CrossRef] [Green Version]
  36. Patra, B.; Schluttenhofer, C.; Wu, Y.; Pattanaik, S.; Ling, Y. Transcriptional regulation of secondary metabolite biosynthesis in plants-ScienceDirect. Biochim. Et Biophys. Acta (BBA)-Gene Regul. Mech. 2013, 1829, 1236–1247. [Google Scholar] [CrossRef]
  37. Jiang, J.; Wang, Y.P.; Yang, Y.H.; Yu, M.X.; Wang, C.; Yan, J.H. Interactive effects of nitrogen and phosphorus additions on plant growth vary with ecosystem type. Plant Soil 2019, 440, 523–537. [Google Scholar] [CrossRef]
  38. Li, Y.; Niu, S.; Yu, G. Aggravated phosphorus limitation on biomass production under increasing nitrogen loading: A meta-analysis. Glob. Change Biol. 2016, 22, 934–943. [Google Scholar] [CrossRef]
  39. Coskun, D.; Britto, D.T.; Kronzucker, H.J. Regulation and mechanism of potassium release from barley roots: An in planta 42K+ analysis. New Phytol. 2010, 188, 1028–1038. [Google Scholar] [CrossRef]
  40. Coskun, D.; Britto, D.T.; Li, M.; Oh, S.; Kronzucker, H.J. Capacity and plasticity of potassium channels and high-affinity transporters in roots of barley and Arabidopsis. Plant Physiol. 2013, 162, 496–511. [Google Scholar] [CrossRef] [Green Version]
  41. Cui, J.; Tcherkez, G. Potassium dependency of enzymes in plant primary metabolism. Plant Physiol. Biochem. 2021, 166, 522–530. [Google Scholar] [CrossRef]
  42. Coskun, D.; Britto, D.T.; Kronzucker, H.J. The nitrogen-potassium intersection: Membranes, metabolism, and mechanism. Plant Cell Environ. 2017, 40, 2029–2041. [Google Scholar] [CrossRef]
Figure 1. Total ion current (TIC) chromatograms of the QC samples. (a) TICs of ESI+. (b) TICs of ESI−.
Agriculture 12 01153 g001
Figure 2. Volcano plots for lettuce samples. Red dots were upregulated metabolites, green dots were downregulated metabolites, blue dots were metabolites with no change.
Agriculture 12 01153 g002
Figure 3. OPLS-DA score scatter plot.
Agriculture 12 01153 g003
Figure 4. Permutation test of OPLS-DA.
Agriculture 12 01153 g004
Figure 5. V plot.
Figure 5. V plot.
Agriculture 12 01153 g005
Figure 6. S plot.
Figure 6. S plot.
Agriculture 12 01153 g006
Figure 7. Heatmap of clustering analysis of control group and low potassium group.
Agriculture 12 01153 g007
Figure 8. Pearson correlation analysis of metabolic biomarkers.
Agriculture 12 01153 g008
Figure 9. Pathway analysis showing metabolic biomarkers.
Agriculture 12 01153 g009
Figure 10. Venn diagrams of metabolic pathways and metabolic biomarkers under N, P, K deficiency. The number represents the quantity of metabolic pathways or metabolic biomarkers. (a) metabolic pathways. (b) downregulated metabolic biomarkers. (c) upregulated metabolic biomarkers.
Agriculture 12 01153 g010
Table 1. Metabolic biomarkers under low K stress.
Metabolite NameESI ModeAdductVIPm/zRT (min)
AdenosineESI+[M+H]+11.07268.103.96
FA 18:1+3OESI−[M-H]−9.51329.233.22
UridineESI−[M-H]−4.81243.063.73
cis-AconitateESI−[M-H]−4.76173.0110.54
D(-)-Gulono-gamma-lactoneESI−[M-H]−4.28177.042.55
2-Isopropylmalic acidESI−[M-H]−3.99175.066.95
DihydroxyacetoneESI−(2M-H)−3.96179.066.17
D-MannoseESI−[M-H]−3.91179.067.17
Mesaconic acidESI−[M-H]−3.57129.0210.55
GalactosamineESI+[M+NH4]+3.08180.096.09
Dihydroxy-ValerateESI−[M-H]−3.06133.051.96
2-Oxoadipic acidESI−(M-H2O-H)−2.71141.029.83
Myristic acidESI−[M-H]−2.65227.201.12
Palmitic acidESI−[M-H]−2.65255.231.13
HydroxyacetoneESI−(M+CH3COO)−2.50133.052.02
Phosphoric acidESI−[M-H]−2.1696.9610.34
PyruvateESI−(M-H)−2.1387.012.34
N-(2-Furoyl)glycineESI−[M-H]−2.08168.039.72
3-Hydroxycinnamic acidESI−[M-H]−2.02163.041.19
Citraconic acidESI−(M-H)−1.88129.022.51
UracilESI−[M-H]−1.88111.023.74
Allantoic acidESI−[M-H]−1.80175.058.54
FA 18:3+1OESI+[M+H]+1.64295.233.14
alpha-ketoglutarateESI−(M-H)−1.56145.018.68
GalactoseESI+[M+NH4]+1.55198.109.02
4-DeoxyphloridzinESI−[M-H]−1.52419.133.81
4-ThiouridineESI−[M-H]−1.51261.069.80
Lipoic acidESI−[M-H]−1.50205.041.39
NefazodoneESI+[M+H]+1.47470.233.09
Indole-3-AcetaldehydeESI−[M-H]−1.43240.042.56
Flavin mononucleotideESI−(M-H)−1.40455.100.56
3-Hydroxy-beta-lapachoneESI+[M+H]+1.37259.101.00
AltretamineESI+(M+NH4)+1.36228.190.89
RacecadotrilESI+[M+H]+1.30386.146.14
FlucofuronESI−[M-H]−1.15414.989.73
4-Hydroxy-6-methyl-2-pyroneESI+[M+H]+1.10127.046.17
RamiprilESI+[M+H]+1.08417.245.91
PuerarinESI−[M-H]−1.00415.119.10
Publisher’s Note: MDPI stays neutral with regard to jurisdictional claims in published maps and institutional affiliations.

