Abstract
The traffic-induced soil compaction in the field has gradually become an important constraint to sustainable agricultural development. A field experiment was conducted to acquire the stress transmitted caused by multiple passes with different types of tractors and to investigate the impact of these stresses on soil bulk density and crop growth. The experiment applied two tractors with different masses: LOVOL M904 (HC) and John Deer 280 (LC), and six different treatments of 0 (C0), 1 (C1), 3 (C3), 5 (C5), 7 (C7), and 9 (C9) tractor passes for each tractor. The results showed that at each number of passes, tractors with small axle-loads at 0–20 cm depth generated higher soil additional stress, while tractors with large axle-loads at 20–80 cm depth generated higher soil additional stress. In the 0–20 cm soil layer, when the number of continuous passes is less than 7 times, the passes of a small axle-load tractor lead to larger soil bulk density, and when the number of continuous passes is more than 7, the compaction of large axle-load tractor leads to larger soil bulk density. At depths of 20–80 cm, compaction by large axle-load tractors results in larger soil bulk density. In this study, different levels of tractor compaction inhibited key growth indicators of maize, resulting in yield reductions. The effect of different tractor load compaction on maize yield increased significantly with the number of compaction passes, with 1–5 tractor passes having no significant effect on yield and 7–9 passes producing greater yield reductions for HC. This study will provide a theoretical basis and technical support for the selection of agricultural machinery and reasonable tillage technology.
1. Introduction
Winter wheat and a summer maize rotation system is the main agricultural production mode in North China Plain, and the comprehensive mechanization rate in this region is over 90% [1]. Traffic-induced compaction is of growing importance as field machinery continues to increase in power and mass [2,3]. Compaction affects soil structure and crop growth adversely, in particular by increasing the soil bulk density and mechanical resistance [4]. Therefore, the soil compaction has become the main cause of soil degradation [5].
The mechanical composition of the soil has a great influence on soil compaction, the soil structures with coarse, medium, and medium-fine textured soils are more easily compacted [2]. In addition, the farm machinery wheel load, tire parameters, tire–soil contact characteristics, and the number of passes of wheels significantly affect the extent of soil compaction [6,7]. The tractors with a mass of more than 4100 kg can cause serious and lasting damage to soil structure (under plough layer) at one time, and the damage effect will increase with the increase in equipment passes [8]. Gysi et al. reported that tire–soil contact stress of 160 kPa under wet soil conditions can cause compaction damage to soil structure at 0–40 cm depth [9]. Tire pressure affects the driving performance of agricultural machines and the stress transfer characteristics in soil by affecting the stress distribution on the tire–soil contact surface [10]. Previous studies have shown that tire pressure and tire–soil contact stress determine surface soil compaction but have no significant effect on deep soil compaction [11,12]. The degree of soil compaction increases with the number of passes, but the first three passes have the most significant effect on the surface and deep soil compaction [13,14]. Taking the soil as equivalent to a nonlinear elastoplastic medium, numerous researchers have predicted soil compaction risk by measuring soil stress transfer, where higher additional stresses in soil represent greater susceptibility of soil to plastic deformation [15]. However, the proposed soil compaction models are mainly empirical models that can predict the compaction risk theoretically, but it is still difficult to accurately simulate the anisotropy of the soil. The types of operating equipment, soil conditions and operating path and other factors vary depending on agronomic conditions, which also causes the unpredictability of soil compaction.
Excessive field soil compaction has a greater inhibitory effect on the crop. The key crop growth indicators and root growth reflect the crop production status and productivity level, so it is important to investigate crop growth and yield prediction by comparison of its dynamics [16,17]. Response of different crops to soil compaction varies widely. Soil compaction has a greater effect on seedling emergence of maize, barley, and soybean [18]. A recent study demonstrated that the height of corn was reduced by the compaction of farm machinery tire systems in the first two years, while this effect was significant in the third year for soybeans [18]. Studies have shown that soil compaction leads to an increase in mechanical strength and a decrease in porosity of the soil, which affect the root penetration capacity most [19,20,21]. The hard soil can greatly restrict the growth of the root system, reducing the penetration ability of crop roots, root length, and root dry matter weight [22]. Soil compaction caused by the agricultural machinery can reduce the root density of wheat by up to 17% in the 0–60 cm depth soil layer [23]. Bouwman showed that the compaction load of 14.5 Mg severely inhibited root growth below 20 cm under loamy soil conditions with 5% organic matter [24]. Botta G et al. showed that top soil compaction is much more harmful to crop root growth than deep soil compaction [25]. The additional stresses generated by the agricultural machinery traffic are transmitted within the soil leading to the destruction of the soil structure, which in turn has a negative impact on crop growth. This is a compaction formation process with a cause-and-effect relationship, and the process should be analyzed systematically. Most of the current studies separately investigate the relationship between agricultural parameters and soil stress transfer, soil physical properties, and crop growth, while there are fewer systematic studies that integrate these variables to reveal the formation of soil compaction and its effect on crop growth.
In China, a large number of experiments were carried out to elucidate the effects of tillage method on soil structure and crop yield, but the research is lacking on how the traffic-induced compaction affects soil bulk density, soil stress distribution, and crop growth [26,27,28]. The main objective of this paper is to investigate the trends of different tractor loads and tractor passes on soil bulk density, the spatial distribution of additional stresses, and key growth indicators of maize. The results of the study can provide a way to better understand soil compaction formation and its negative effects.
2. Materials and Methods
2.1. The Soil Conditions
The experiment was conducted in the Science park of China Agricultural University, Dongchengfang Town, Zhuozhou City, Hebei Province, China (115°44′ E, 39°21′ N), at an altitude of 20 m–70 m, with a flat topography and a ground slope drop of 0.2–0.52%. The climate of the test area is typical temperate continental monsoon climate. In 2016–2017, the annual average temperatures were 11.2 °C and 12.1 °C, and the annual rainfall was 480 mm and 490 mm, respectively. The soil type of the experimental area is light loam with an average pH value of 7.7. The specific soil properties from 0 cm to 80 cm are shown in Table 1, the average field water holding rate is 11.3%, the water content at the withering point is 1.2%, the thermal conductivity coefficient is 0.52 W·m−1k−1, and the average yield of maize in the last 5 years is 10,015.5 kg ha−1.

Table 1.
Soil characteristics of the test site.
The cropping system was a winter wheat–summer maize biannual crop with a no-till before the trial. The mechanized production process is maize combine harvesting–straw shredding–wheat no-till fertilization and sowing–wheat field weeding–wheat combine harvesting–maize no-till fertilization and sowing–weed spraying–maize combine harvesting. Therefore, besides the natural settlement factor, the issues regarding soil compaction in the experimental area are also caused by the farm equipment. During the experiment, the maize variety was Zhengdan 958, the plant spacing was 20 cm, and the fertilizer application for each treatment was 284 kg ha−1 of N, 102 kg ha−1 of P2O5, and 95 kg ha−1 of K2O. There was no watering for the whole maize growing season in the experimental area.
2.2. Experimental Treatments and Layout
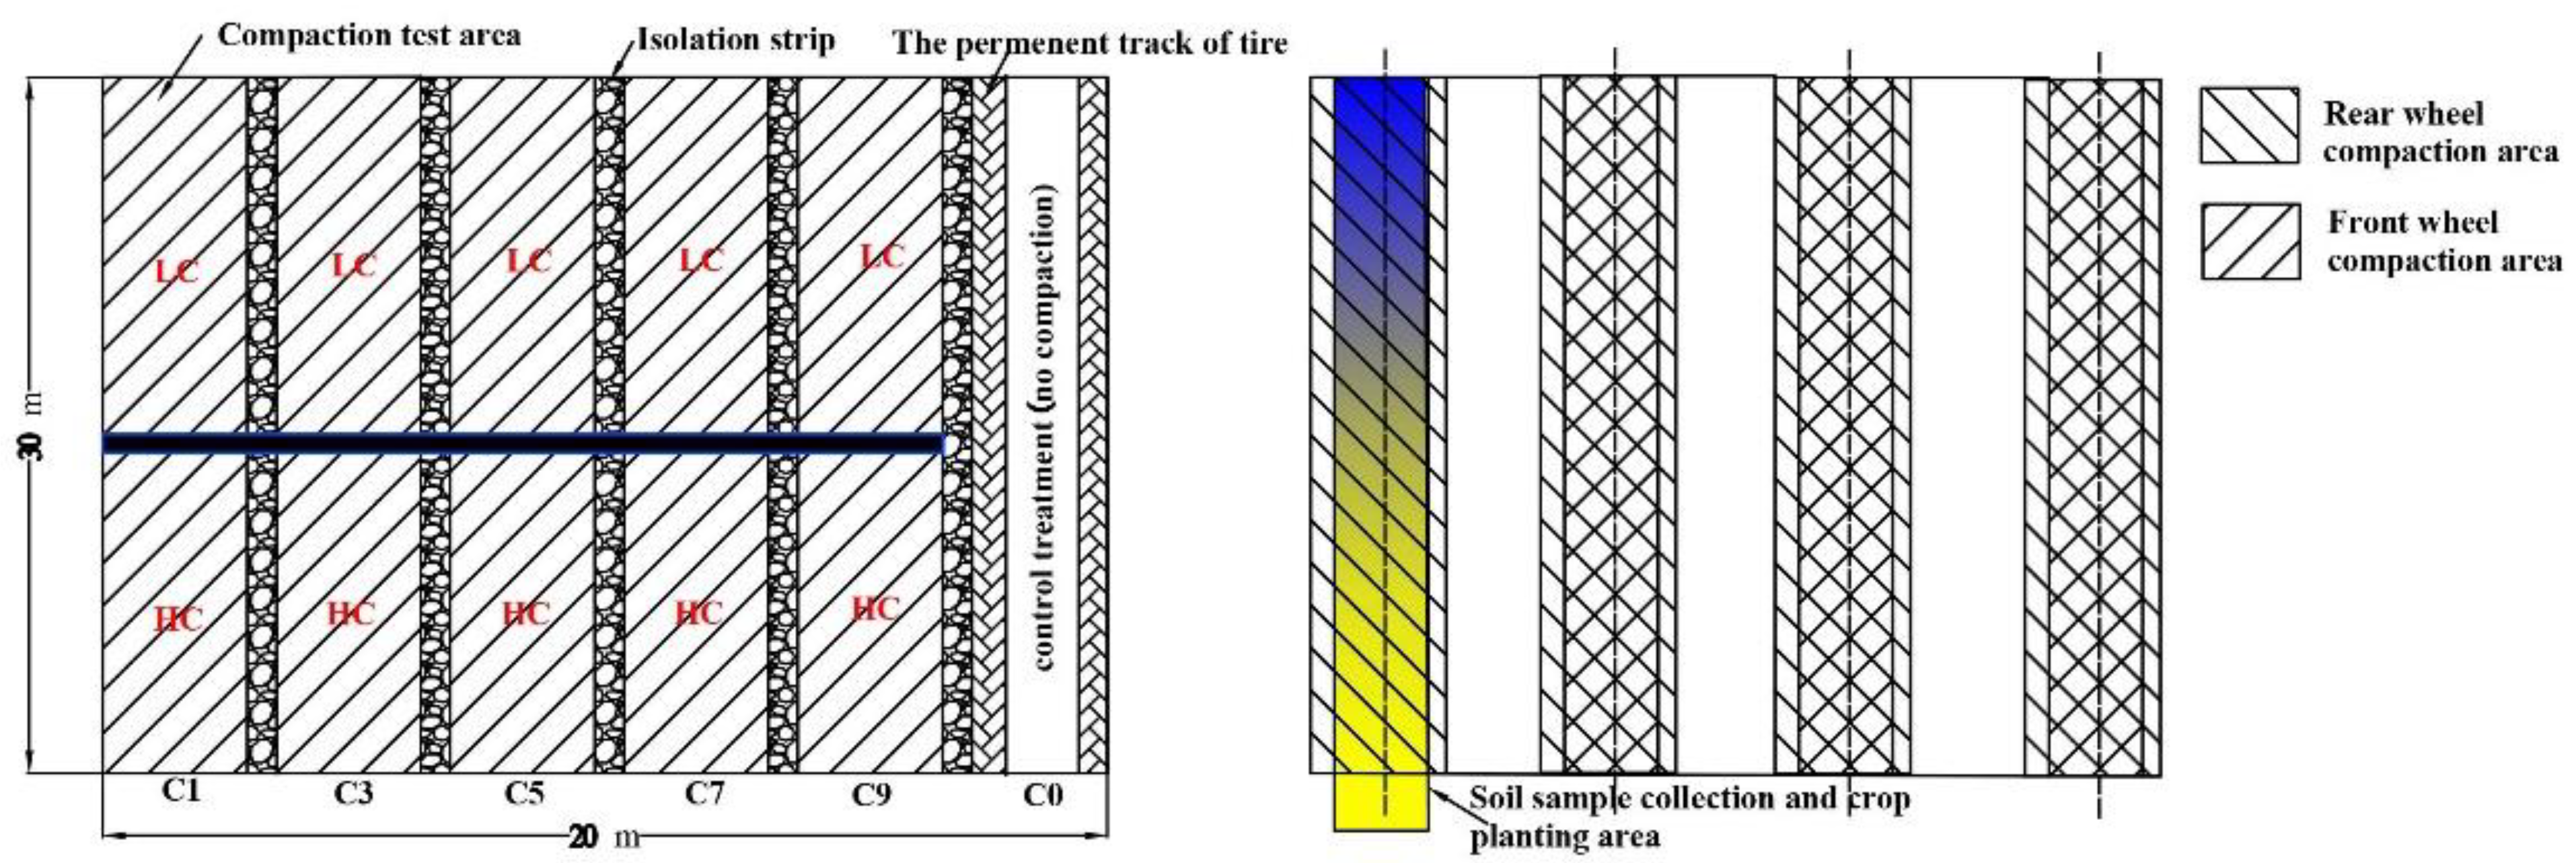
To investigate the effect of different loads on compaction, two tractors with different masses were selected as compaction devices, and the specific parameters of the tractor are shown in Table 2. The tire–soil contact area and contact stress were obtained according to the empirical equation (Wang 2018) [29], and the speed was 5.5 km.h−1 during the test. The different numbers of passes were set for each tractor as 0 (C0), 1 (C1), 3 (C3), 5 (C5), 7 (C7), 9 (C9), three replications were set, and each test to adopt the principle of complete randomization. The test area was 30 × 20 m (600 m2), the no-compaction (C0) was the control group, and the crop growth zone was permanently separated from the machine compaction zone to create an environment with no agricultural machine compaction. To prevent the different treatments from interfering with each other, a 2 m-wide isolation strip was set up between each compaction treatment (Figure 1). To homogenize the test area and minimize the test error, the test soil plot underwent deep sub-soiling with a 35 cm depth before starting the experiment.
Table 2.
Test tractor tire parameters.
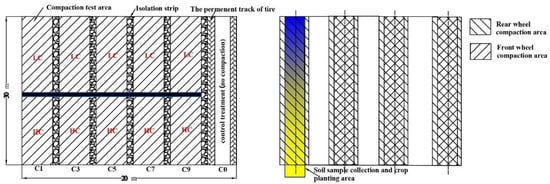
Figure 1.
Field-experiment-specific operation method. LC—tractor with low mass, John Deer 280; HC—tractor with high mass, LOVOLM904; C1, C3, C5, C7, and C9 represent the number of tractor passes, respectively, C0 was the no-compaction treatment.
To obtain the consistency of sampling, the center of the wheel rutting area in the front and rear wheels of the tractor (Figure 1) was taken as the sampling area, which is the most serious compaction area after being compacted by the tractor in a straight line. Meanwhile, this area is also the data acquisition area for measuring the maize growth index in this work.
2.3. Field Measurements and Soil Sampling
2.3.1. Soil Bulk Density
To better show the soil compaction condition, soil bulk density was selected as the test index. The soil samples were collected from the tractor wheel compaction area (Figure 1), at three sampling points per experimental plot. For each treatment, 12 soil samples were collected at 0~20, 20~40, 40~60, and 60~80 cm depths, providing 264 samples in total (2 samples × 3 samples point × 4 depths × 11 arrangement), with a steel cylinder (diameter 50.46 mm, height 50 mm). The soil bulk density was measured with the drying method. The soil samples were put into an aluminum weighing box and weighed on an electronic balance. Then, the aluminum box was put into an oven and baked at a constant temperature of 108 °C until it reached a constant weight, the dried soil was weighed and the soil capacity value was calculated [30].
2.3.2. Soil Stress Measurement
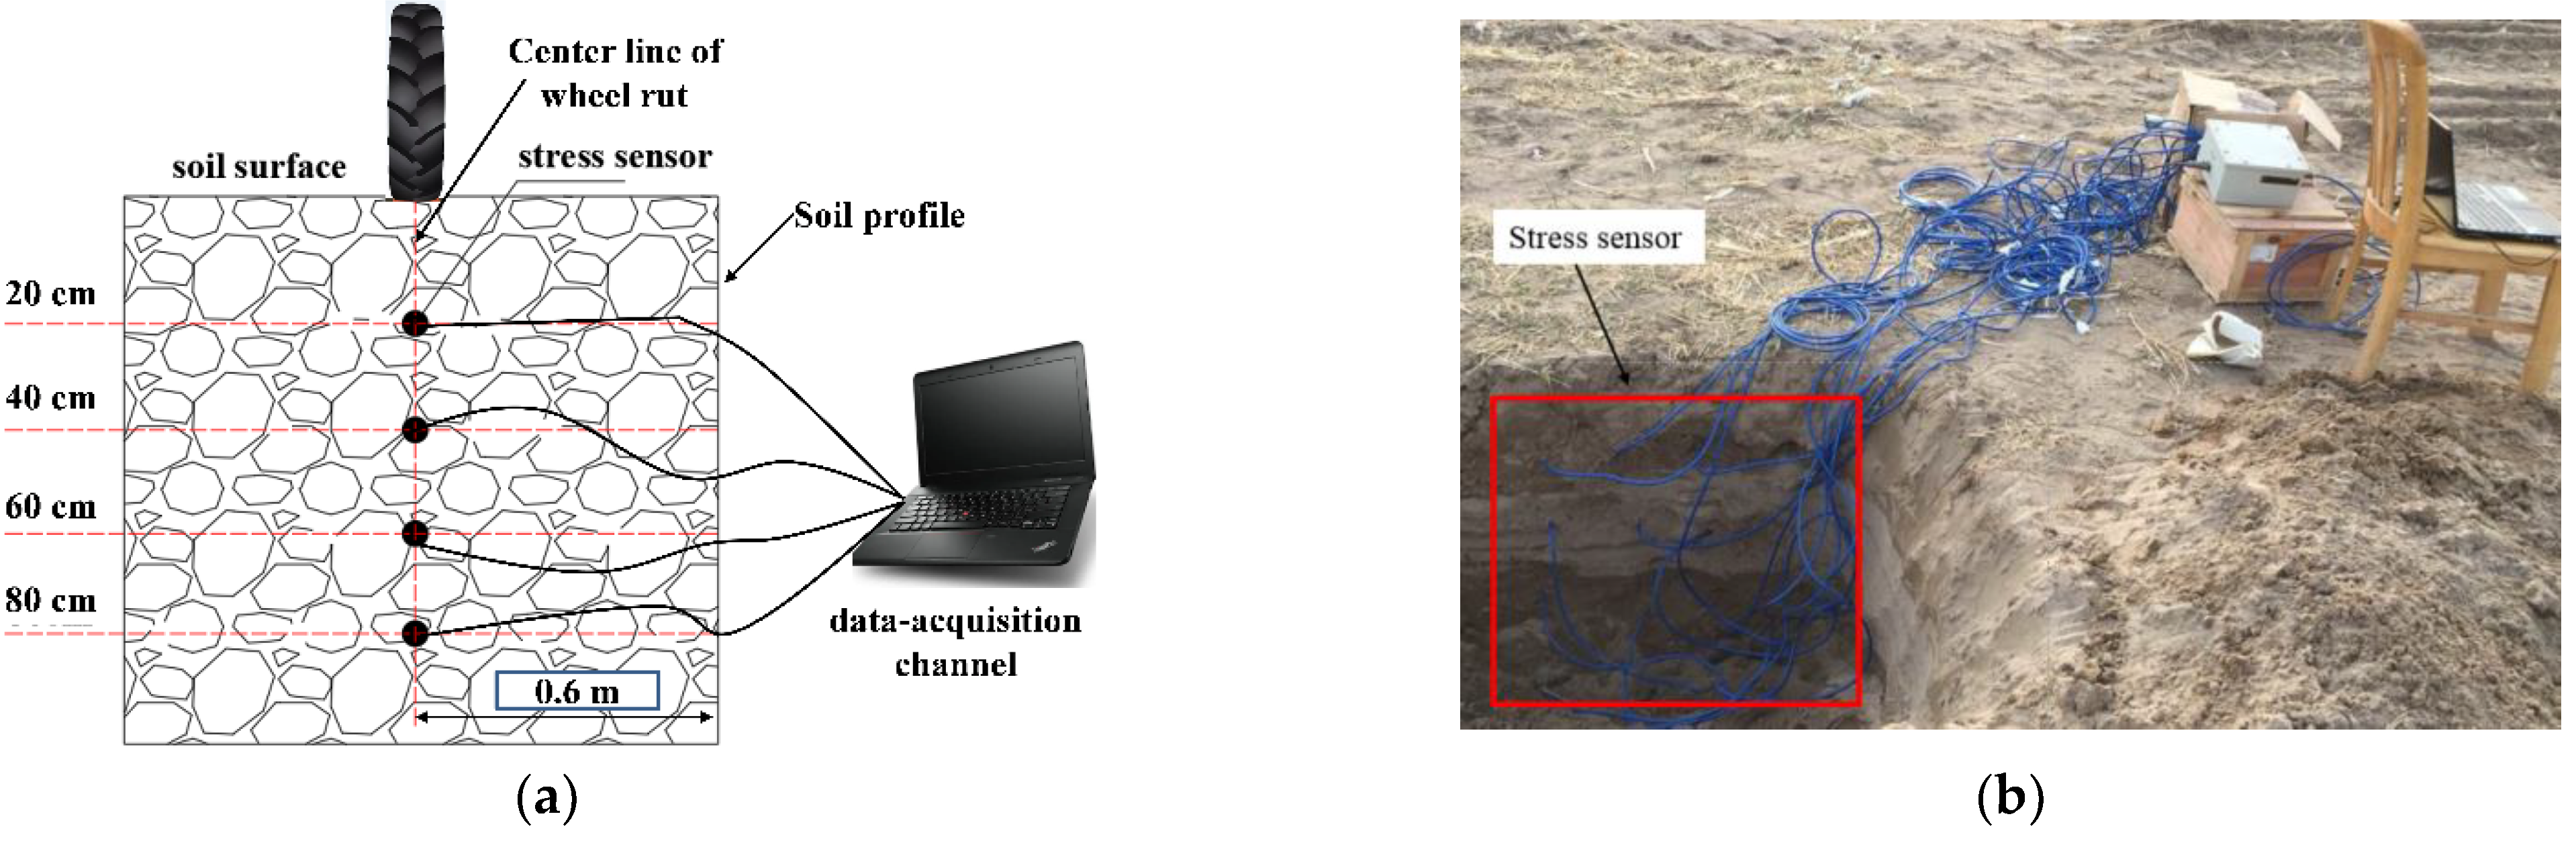
The vertical soil stress propagation during the tractor passes was measured with the vibrating wire transducer (Shandong University of Science and Technology Losair Sensing Technology Co., Taian, China) [29]. This sensor technique is based on the theory of the relationship between the natural frequency of the sensitive element and the tension force. During the stress measurements, the stress transducers were installed at four depths (20, 40, 60, and 80 cm) beneath the center line of the wheel rut. To install stress sensors in the soil, metal tubes were inserted in the soil and horizontal channels were excavated. The sensors were located at least 0.6 m from the soil profile [31]. To improve the accuracy of sensor measurements, it is necessary to ensure that the surface of each sensor is in full contact with the surrounding soil. Therefore, the end of the sensor mounting channel was shaped with a soil auger and stamped with a special tool to allow accurate printing in the soil. After sensor installation was complete, the sensor mounting channel soil was backfilled and gently compressed to simulate undisturbed soil conditions [11,31,32]. In order to reduce the measurement error, in each depth of the soil layer along the tractor travel direction three stress sensors were laid, adjacent to the sensor interval of 40 cm (Figure 2).
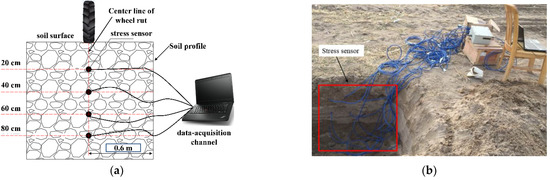
Figure 2.
Soil stress measurement. (a) Sensor installation diagram; (b) stress data acquisition process.
The vertical soil stress propagation during the tractor passes was measured with the vibrating wire transducer (Shandong University of Science and Technology Losair Sensing Technology Co., Taian, China) [29]. This sensor technique is based on the theory of the relationship between the natural frequency of the sensitive element and the tension force. During the stress measurements, the stress transducers were installed at four depths (20, 40, 60, and 80 cm) beneath the center line of the wheel rut. To install stress sensors in the soil, metal tubes were inserted in the soil and horizontal channels were excavated. The sensors were located at least 0.6 m from the soil profile [31]. To improve the accuracy of sensor measurements, it is necessary to ensure that the surface of each sensor is in full contact with the surrounding soil. Therefore, the end of the sensor mounting channel was shaped with a soil auger and stamped with a special tool to allow accurate printing in the soil. After sensor installation was complete, the sensor mounting channel soil was backfilled and gently compressed to simulate undisturbed soil conditions [11,31,32]. In order to reduce the measurement error, in each depth of the soil layer along the tractor travel direction three stress sensors were laid, adjacent to the sensor interval of 40 cm (Figure 2).
The accuracy of vibrating wire transducer is 0.5% of full scale, the resolution is 0.01% of full scale, the sensor exterior is cylindrical, and the size is 90 mm Φ × 20 mm. The collected data frequency of the sensor is 25 HZ, and the sensor connects with the DQ-8 data receiving station through the special data transmission line. By using the WM-201E data conversion device (Shandong University of Science and Technology Losair Sensing Technology Co., Taian, China), the data was imported into the data collection device.
2.3.3. Measurement of Maize Growth Indexes [33,34]
Maize growth indexes and yield data were averaged over 2 years of the trial cycle.
- The height and diameter of the maize stems
The height and diameter of the maize stems were measured at the seedling stage, the elongation stage, the pustulation period, and the mature period. Three normal-growing maize plants were selected in the experimental area for the measurement. Before the pustulation period, all the stalk parts above the ground were straightened, the vertical distance from the leaf tip to the ground was the height of the plant. The vertical distance from the top of the ears to the ground was the height of the plant after the pustulation period. The stem diameter was measured with vernier calipers at the first stalk node of the maize plant.
- 2.
- Dry matter weight
The above-ground parts of the whole maize plants were obtained at the seedling stage, the elongation stage, the pustulation period, and the mature period for measurement of physiological indicators. These samples were put into an oven at 105 °C for 1 h, then dried at 85 °C to a constant weight and weighed with an electronic balance scale with an accuracy of 0.01 g. The dry plant mass of each plot was taken as the average of the above-ground dry matter mass of three maize plants. After removing the above-ground part, the underground main root system of the maize plants was dug up using a shovel, and the soil on the surface of the root system was cleaned, then the root was put in the oven, dried, and weighed in the same way.
- 3.
- Leaf area index
The SunScan plant canopy analyzer (DELTA-T, Cambridge, UK) was used to measure the leaf area index. Before testing, local latitude and longitude coordinates (115°44′ E, 39°21′ N) were entered, the leaf angle distribution parameter (ELADP) was set to 1.0, the leaf extinction coefficient k was 0.85, and the leaf area index data acquisition time was consistent with the height and diameter of maize stems.
- 4.
- Maize root distribution measurements
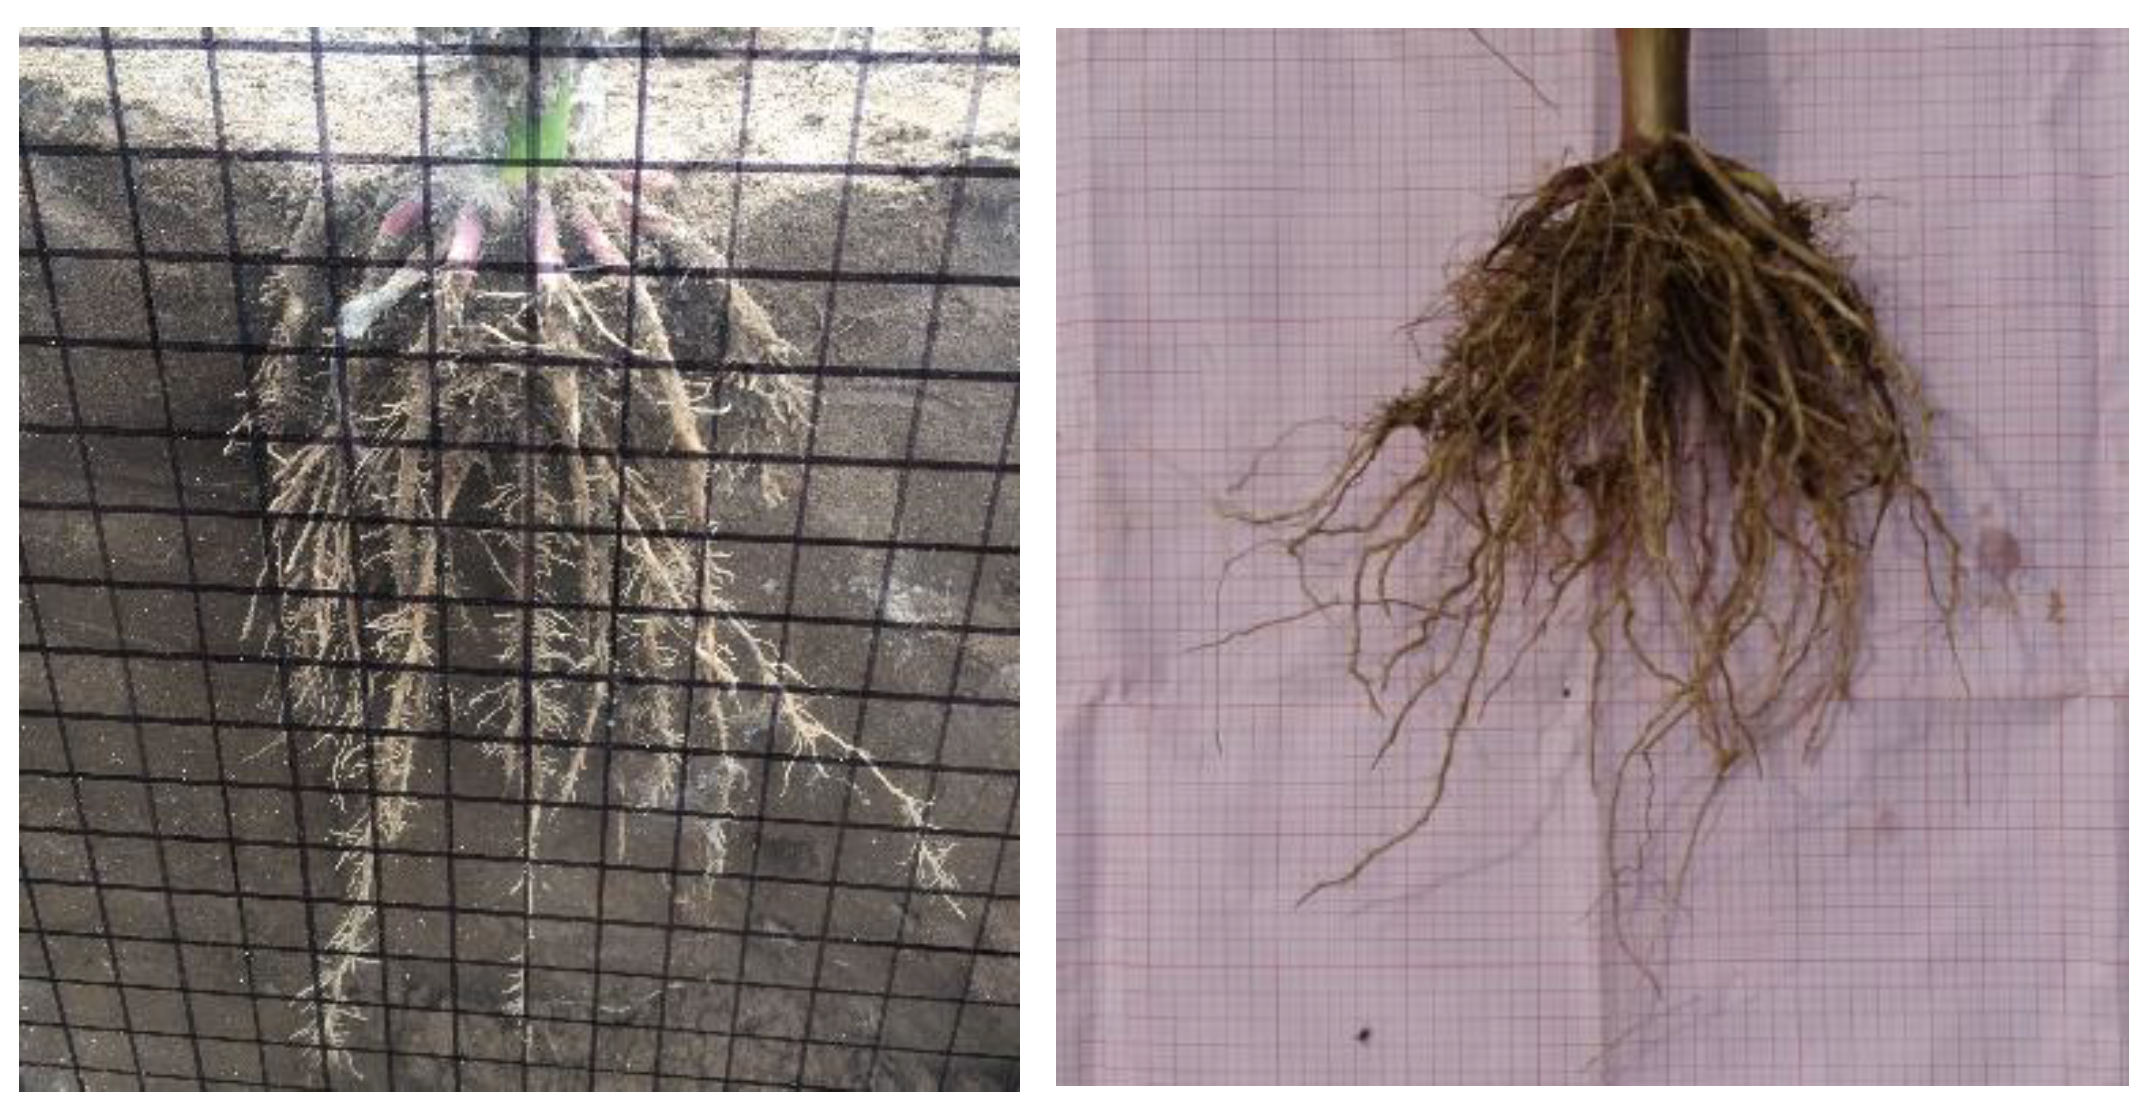
The profile method was used to analyze the distribution of maize roots. At the time of maize maturity, a soil profile (1.5 m wide and 1 m deep) was dug in the maize growth zone. Transparent plastic plates (1 m long and 1 m wide) with a square scale (2 × 2 cm) were placed on the soil profile to obtain the size range of the root system for precise root removal from the soil (Figure 3).

Figure 3.
The transparent plastic plate with a square scale.
The complete root of maize was dug out of the soil and the soil was carefully washed off the root system. The cleaned complete root system was dried at 85 °C to a constant weight and weighed with an electronic balance scale with an accuracy of 0.01 g. The root system was placed on a flat surface with a scale, and the root system at different depths was cut with scissors and weighed to calculate the content of the root system at different depths.
- 5.
- The yield of maize
The theoretical yield of maize was calculated by randomly selecting a 1 × 1 m2 area in the test area. All the ears in the area were collected, and the number of ears and kernels per maize plant was recorded. After being air-dried and the kernels threshed, the hundred-grain weight was recorded. Then, the theoretical calculation equation of maize yield is as follows:
where Y is the yield of maize, kg/hm2; H is the density of maize planting, plant/hm2; M is the number of grains on the ear; and W is the hundred-grain weight, g.
Y = (H × M × W)/100,000
2.4. The Data Analysis
The significance of differences between soil compaction intensity and plant growth indexes was measured using a one-way ANOVA. The least significance difference test (LSD) was used to check the significance of treatment effects at p < 0.05. The statistical analysis was conducted using Microsoft Excel 2003 (Microsoft, Redmond, DC, USA) and IBM SPSS Statistics 20 (IBM, Armonk, NY, USA). The figures and tables were compiled using Excel 2003 and Origin 9.1 (OriginLab, Northampton, MA, USA).
3. Results
3.1. Effect of Tractor Load and Number of Passes on Spatial Distribution of Soil Stress
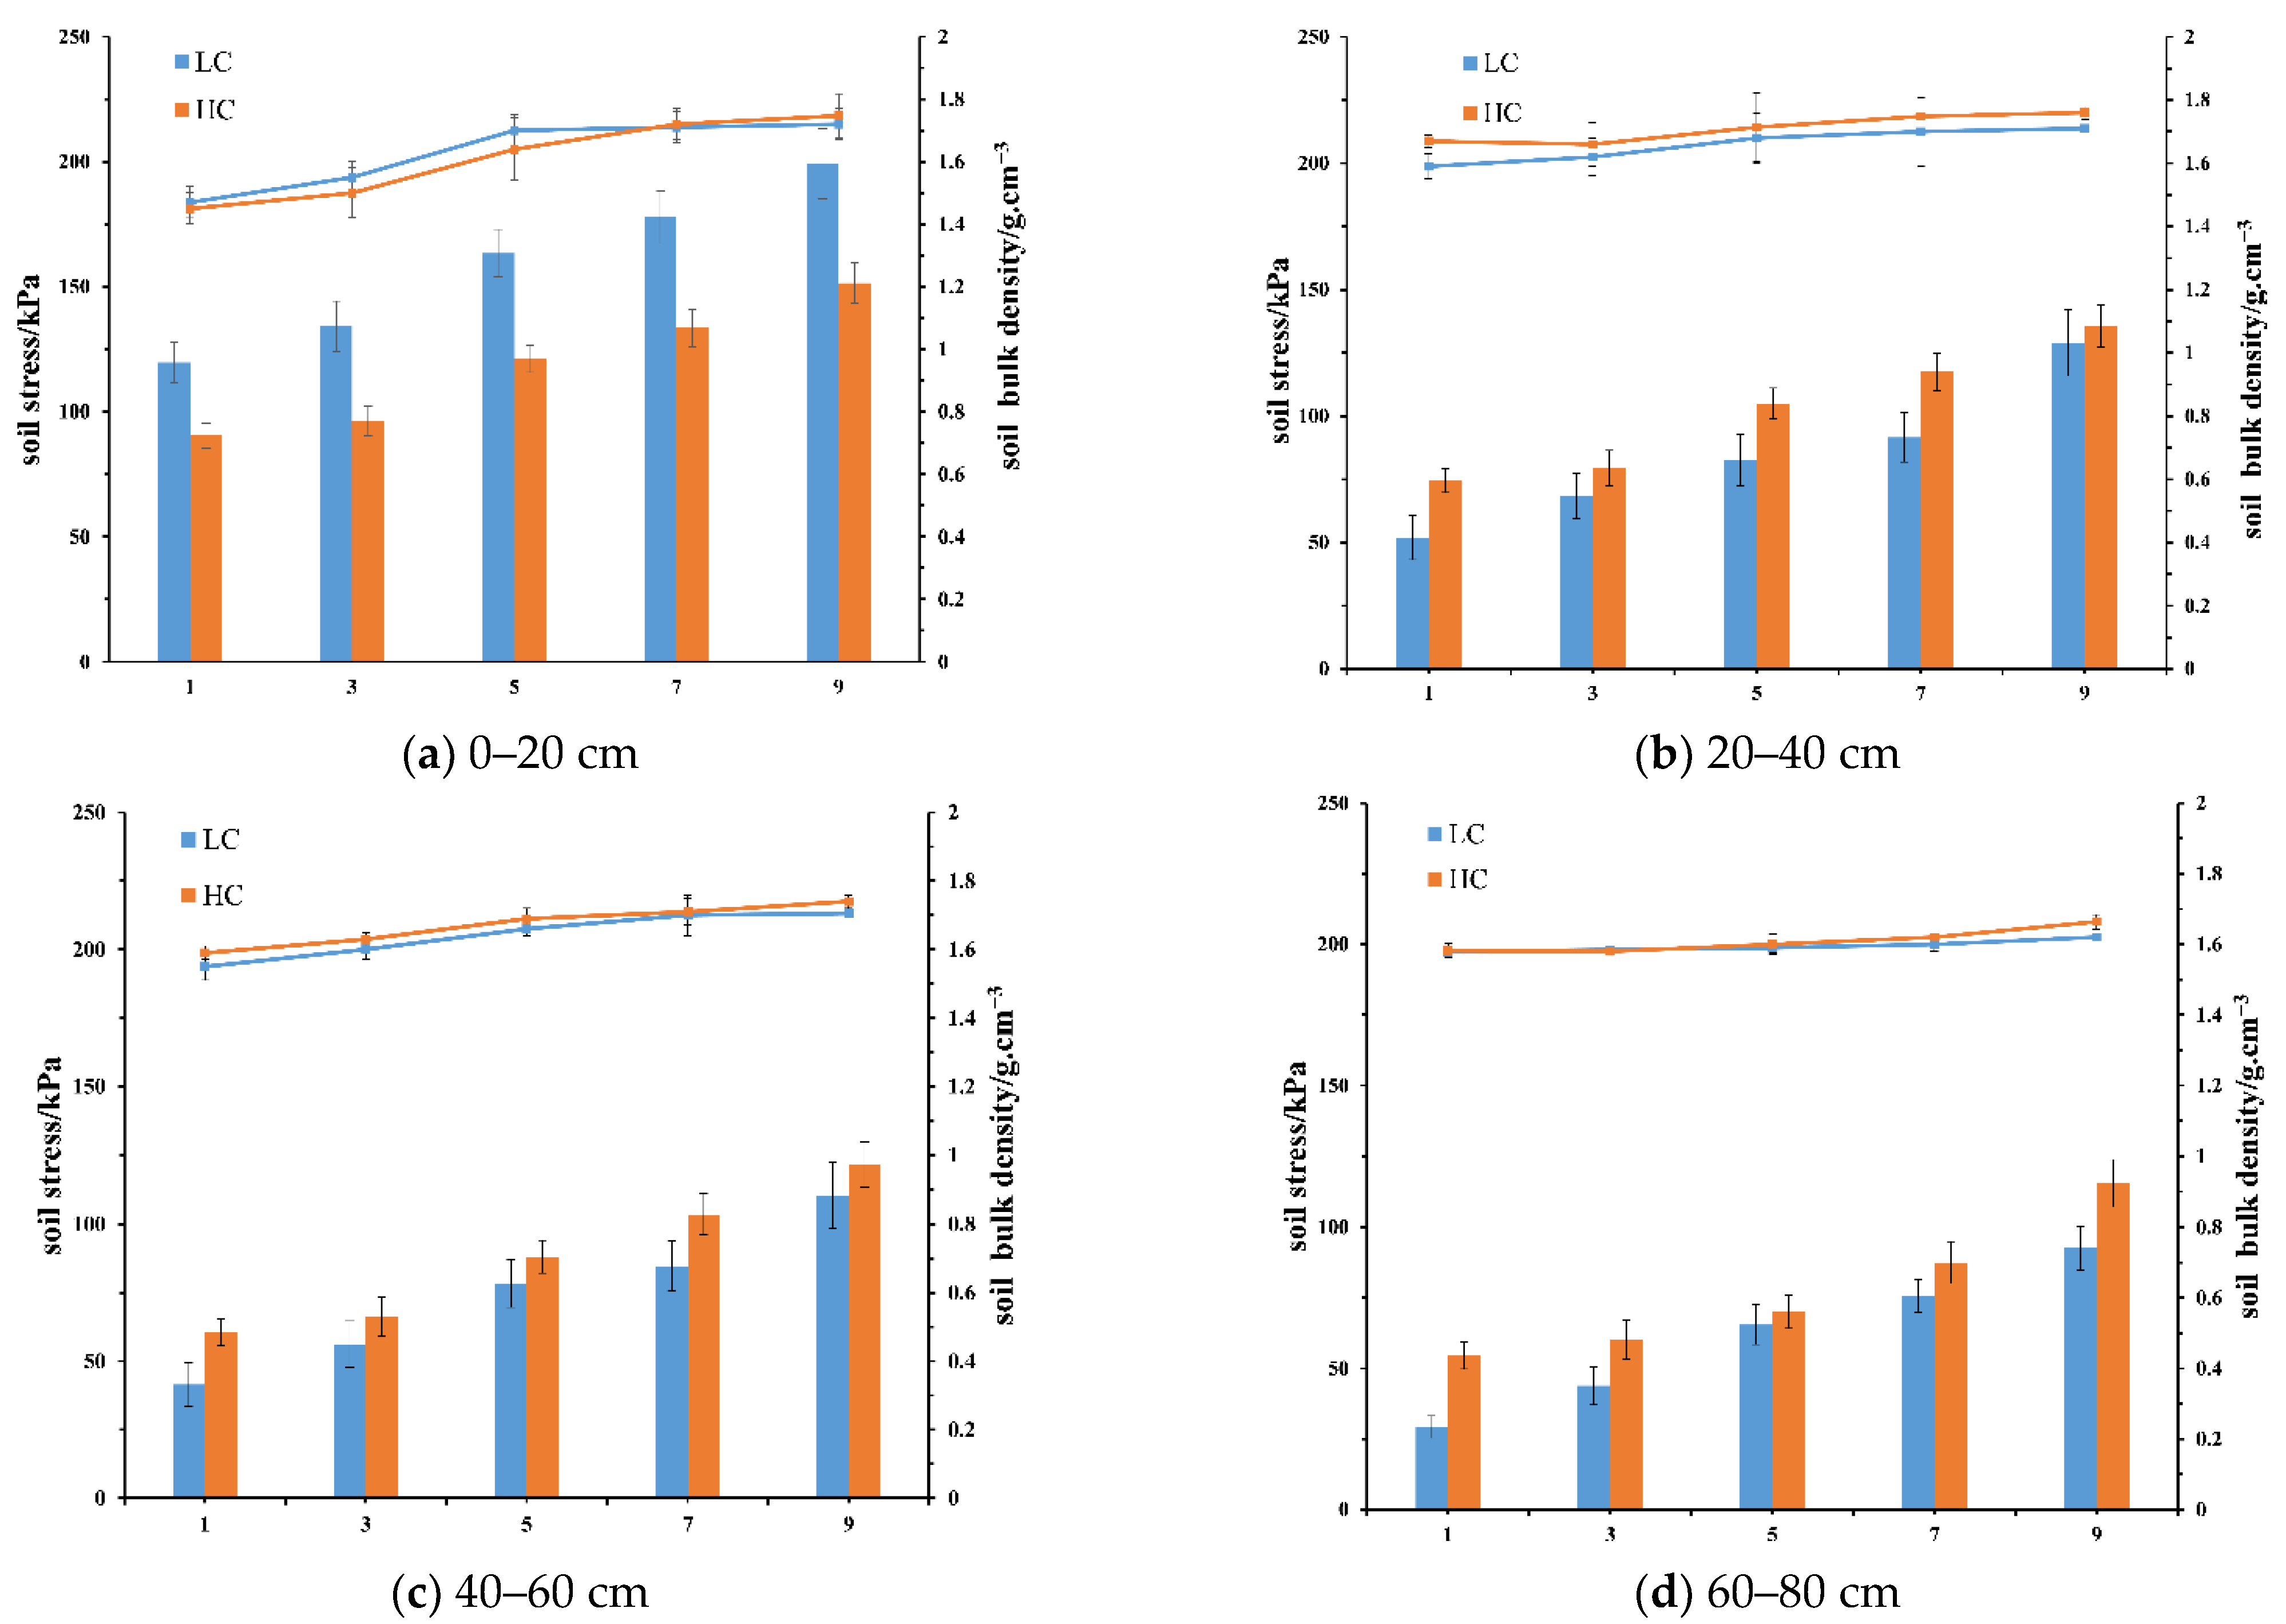
During the movement of a tractor, the additional stresses in the soil at different depths increase with the number of continuous tractor passes. As can be seen from Figure 4, the results show that the compaction effect of tractors with different masses has an opposite effect on the values of additional stresses in the surface and deep soil. In soils from 0 to 20 cm depth, the additional stress generated by small tractors was, respectively, 32.3%, 39.3%, 34.9%, 33.3%, and 31.4% higher than that of large tractors under 1, 3, 5, 7, and 9 passes, while the average stress of the large tractor was, respectively, 54.3%, 22.3%, 16.2%, 22.5%, and 12.2% higher than that of the small tractor in soils from 20 to 80 cm depth.
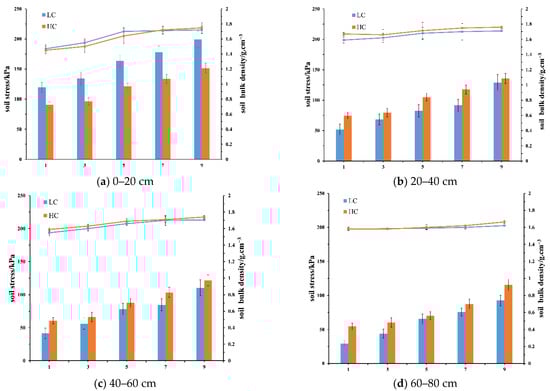
Figure 4.
Effect of load and number of passes of the tractor on the spatial distribution of soil stress and soil bulk density. (a) represents the depth of the 0–20 cm soil layer, (b) represents the depth of the 20–40 cm soil layer; (c) represents the depth of the 40–60 cm soil layer, (d) represents the depth of the 60–80 cm soil layer; LC—tractor with low mass, John Deer 280 (John Deere, New York, NY, USA); HC—tractor with high mass, LOVOLM904 (Weizhai Leiwo Heavy Industry Co. Ltd., Weifang, China).
3.2. Effect of Tractor Load and Number of Passes on Soil Bulk Density
The continuous passes of tractors have a great effect on soil bulk density in different depths, both of which increase with the number of passes under the action of the two kinds of tractors. The results showed that when the small axle-load tractors (John Deere, New York, NY, USA) had 1, 3, 5, 7, and 9 passes, the soil bulk density in the 0–20 cm soil layer increased by 5%, 10.7%, 21.4%, 22.1%, and 22.9%, respectively; in the 20–40 cm soil layer it increased by 3.9%, 5.9%, 9.8%, 11.1%, and 11.8%, respectively; and in the 40~60 cm soil layer it increased by 2.0%, 5.3%, 9.2%, 11.8%, and 12.2%, respectively. Moreover, when compacted with the same number of passes of a large axle-load tractor, the soil bulk density in the 0–20cm soil layer increased by 3.6%, 7.1%, 17.1%, 22.9%, and 24.8%, respectively; in the 20–40cm soil layer it increased by 9.2%, 8.5%, 12%, 14.2%, and 15%, respectively; and in the 40~60 cm soil layer it increased by 4.6%, 7.2%, 11.2%, 12.5%, and 14.5%, respectively. The effect of compaction intensity of the above two different tractors on the soil bulk density of 60–80 cm is less significant.
In the 0–20 cm soil layer, when the number of continuous passes is less than 7, the compaction of a small axle-load tractor leads to larger soil bulk density, and when the number of continuous passes is more than 7, the compaction of large axle-load tractor leads to larger soil bulk density. At depths of 20–80 cm, compaction by the large axle-load tractors results in larger soil bulk density.
3.3. Effect of Tractor Mass and Number of Passes on Maize Growth
3.3.1. Effect of Soil Compaction on Height and Diameter of Maize Stems
The height and diameter of maize stems is one of the important indicators to measure the growth and development of maize. It is not only affected by factors such as crop genetic characteristics and irrigation, but also limited by external factors such as soil physical characteristics [33,34,35,36]. Soil compaction can directly cause the change in soil physical properties, and the spatial change in soil characteristics can lead to the exchange of matter and energy between the surface and the lower soil. This change in physical and chemical properties of soil can affect the absorption of water and nutrients in the maize root system, and ultimately affect the yield [37,38].
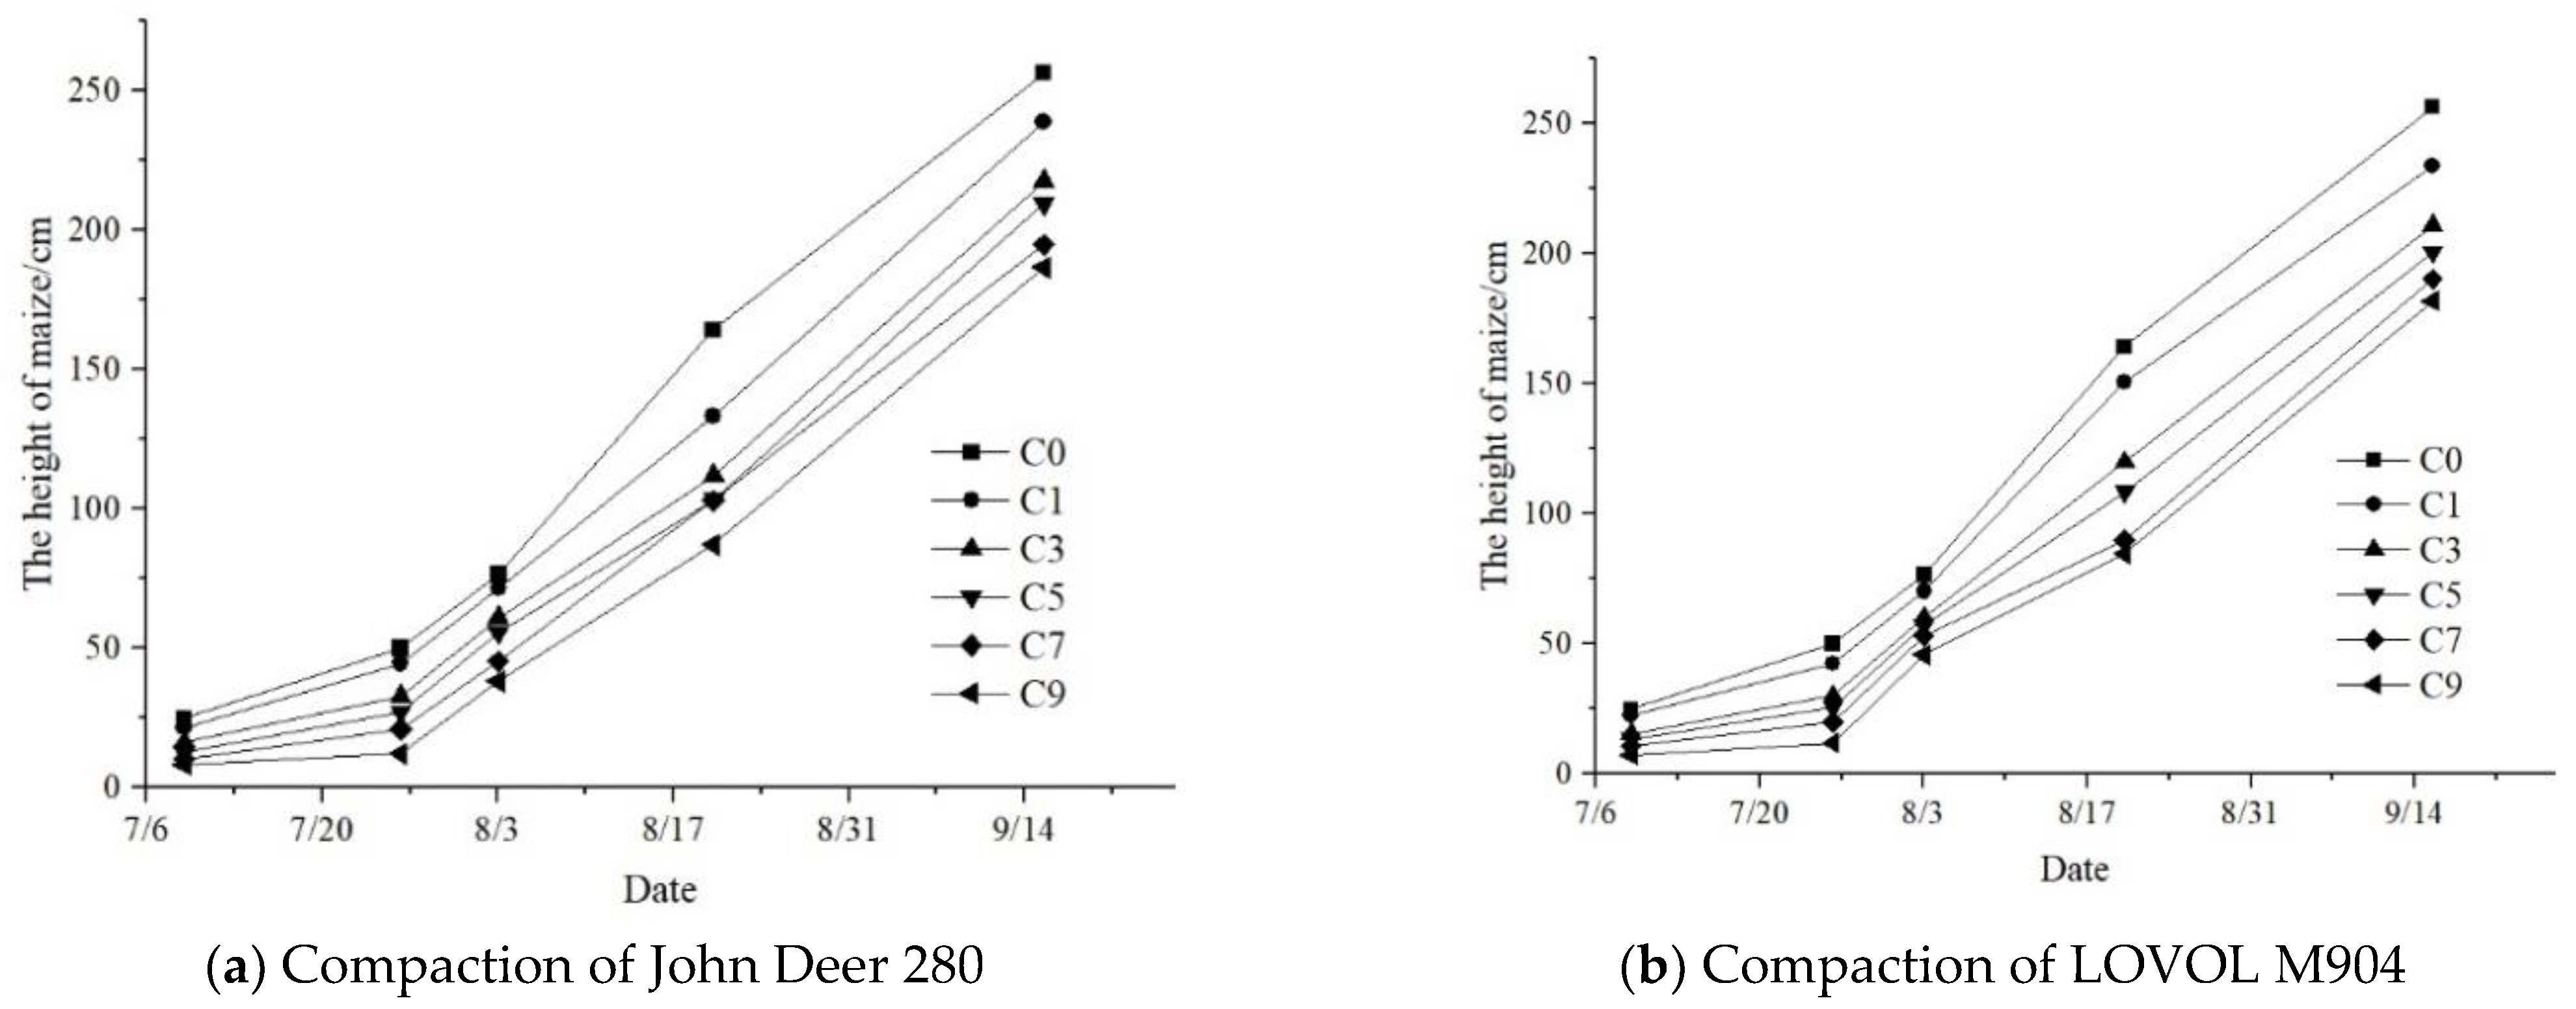
Figure 5 shows the dynamic change rule of maize plant height in each treatment during the whole growth cycle. As can be seen from Figure 5, using either the tractor with a large axle-load (LOVOL M904, Weizhai Leiwo Heavy Industry Co. Ltd., Weifang, China) or a small axle-load (John Deer 280, New York, NY, USA), the height of maize will always decrease with the increase in tractor passes during the growth period.

Figure 5.
Effect of soil compaction on the height of maize.
Soil compaction caused by tractors will significantly reduce the height of maize. During the whole maize growth measurement period, 1, 3, 5, 7, and 9 passes by the John Deer 280 tractor reduced maize height at maturity by 6.9%, 15.2%, 18.2%, 24.0%, and 27.2%, respectively, while 1, 3, 5, 7, and 9 passes by the LOVOL M904 tractor reduced maize height at maturity by 8.8%, 17.7%, 21.7%, 25.8%, and 29.0%, respectively, compared to uncompacted soil.
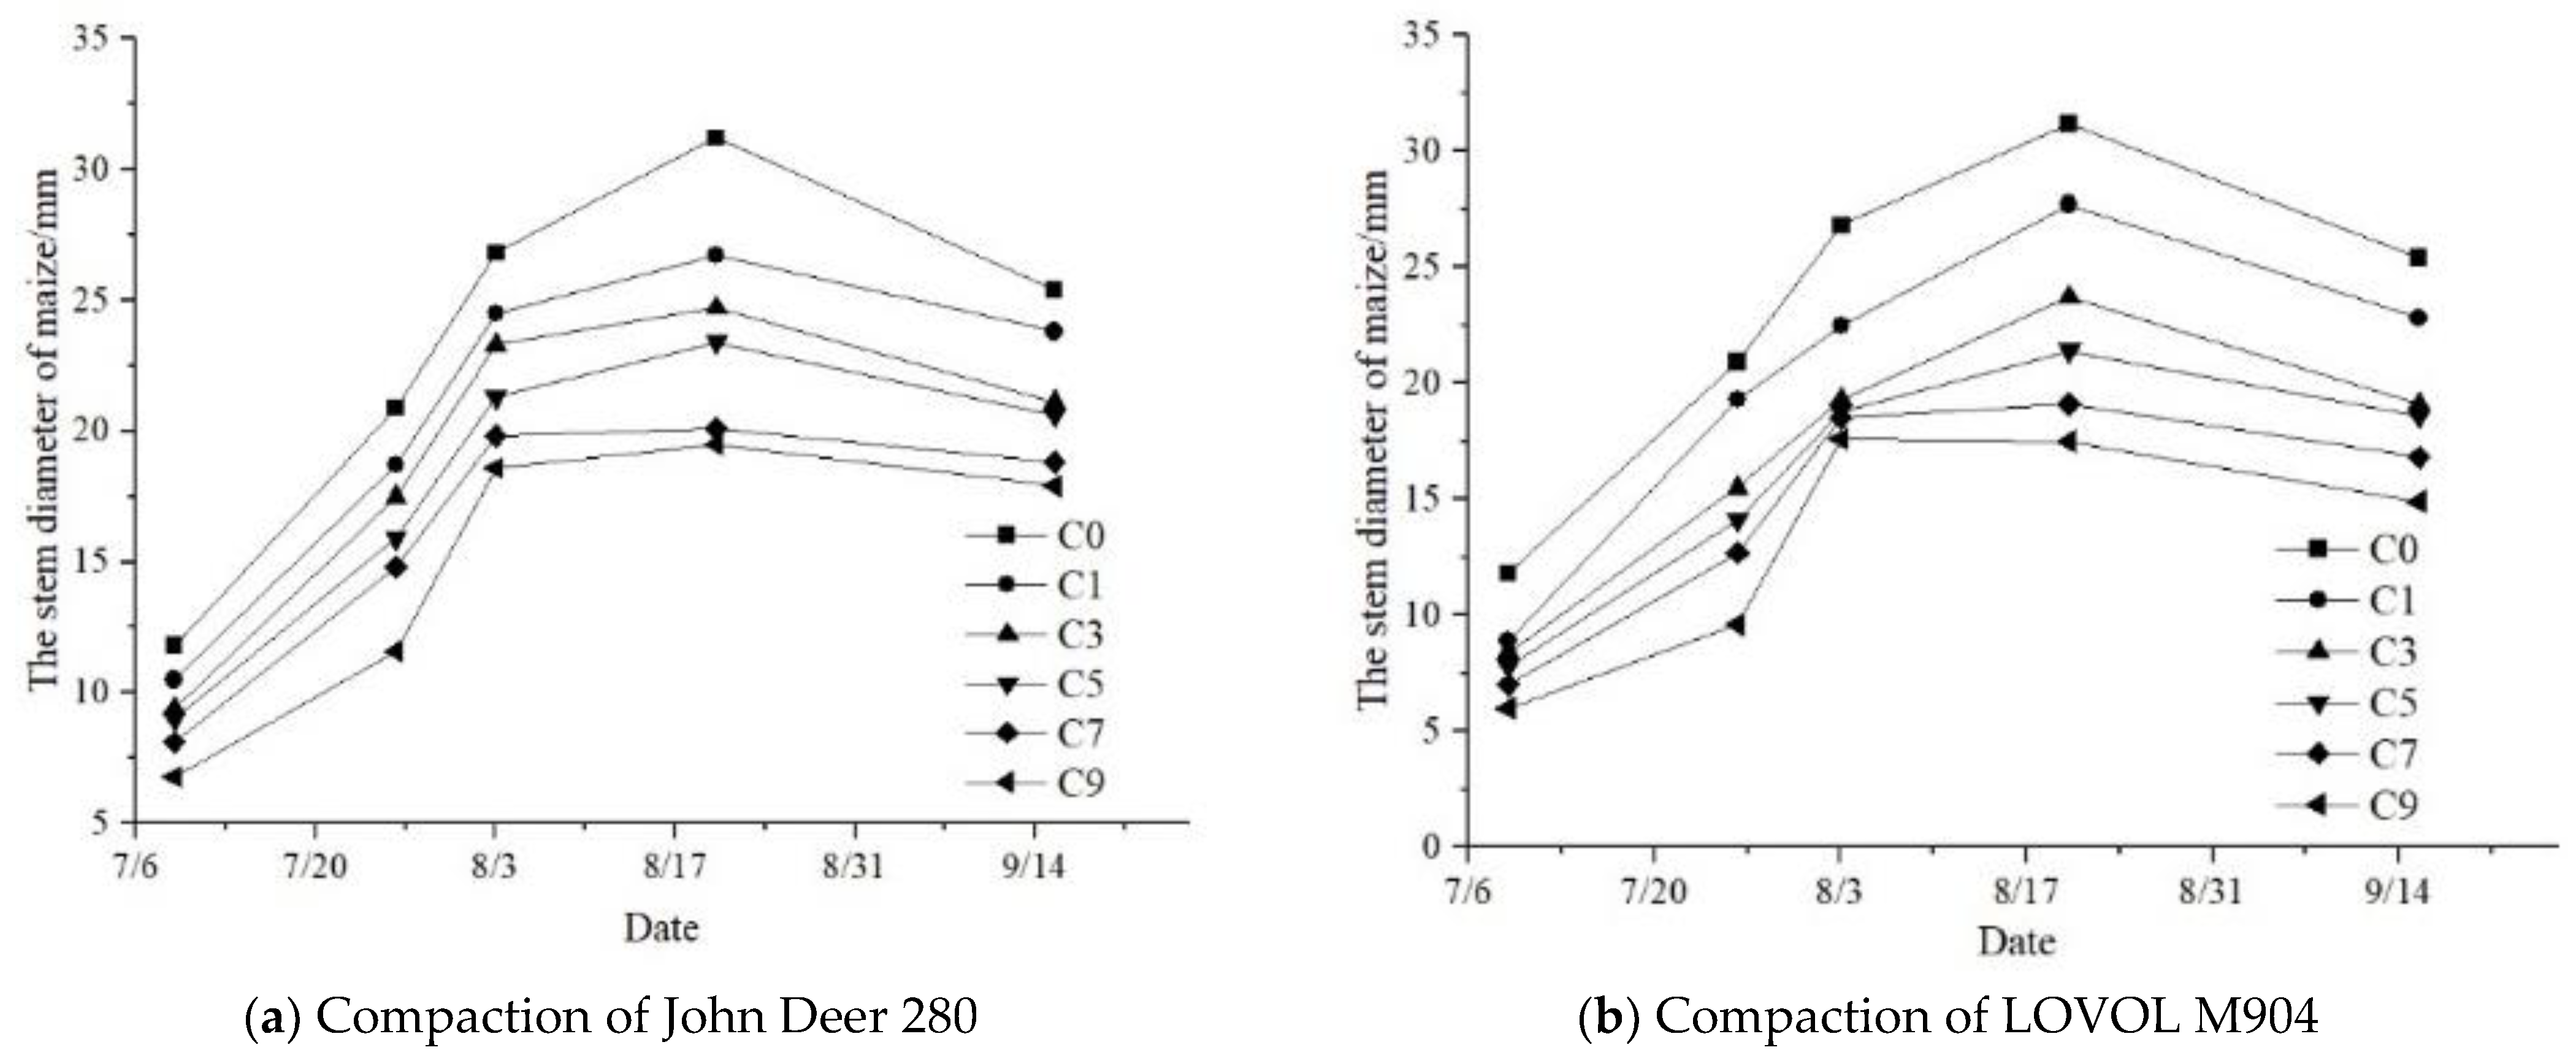
Figure 6 shows the dynamic change rule of maize stem diameter with time in each treatment during the whole growth cycle. It can be seen from Figure 6 that the diameter of maize stem changes with the growth time increasing first and then decreasing. The reason may be that the soil nutrients absorbed by maize in the early stage are mainly used for plant growth, and then the nutrients are mainly used for fruit growth after the growth stage of maize [34]. However, the diameter of maize stem decreased with increase in the number of passes in the growing period of maize regardless of the use of the large axle-load (LOVOL M904) or small axle-load (John Deer 280) tractor.
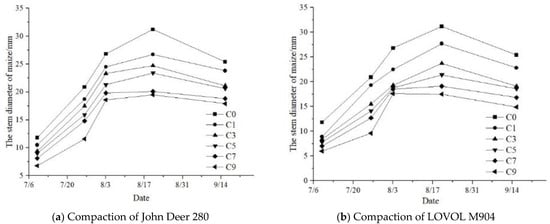
Figure 6.
Change in maize stem diameter with time under different treatment conditions.
Soil compaction caused by tractors will significantly reduce the diameter of maize stems. During the whole maize growth measurement period, 1, 3, 5, 7, and 9 passes by the John Deer 280 tractor (John Deere, NY, USA) reduced maize stem diameter at maturity by 6.3%, 16.9%, 18.9%, 25.9%, and 29.5%, respectively, while compacted 1, 3, 5, 7, and 9 passes by the LOVOL M904 tractor reduced maize stem diameter at maturity by 10.2%, 24.8%, 26.8%, 33.9%, and 41.3%, respectively, compared to uncompacted soil. Compared with the John Deer 280 tractor, soil compaction caused by LOVOL M904 (Weizhai Leiwo Heavy Industry Co. Ltd., Weifang, China) has a more significant reduction effect on the diameter of maize stem, but there is no significant difference in the effect of soil compaction caused by two tractors with different weights on maize height.
3.3.2. Effects of Soil Compaction on Leaf Area Index of Maize
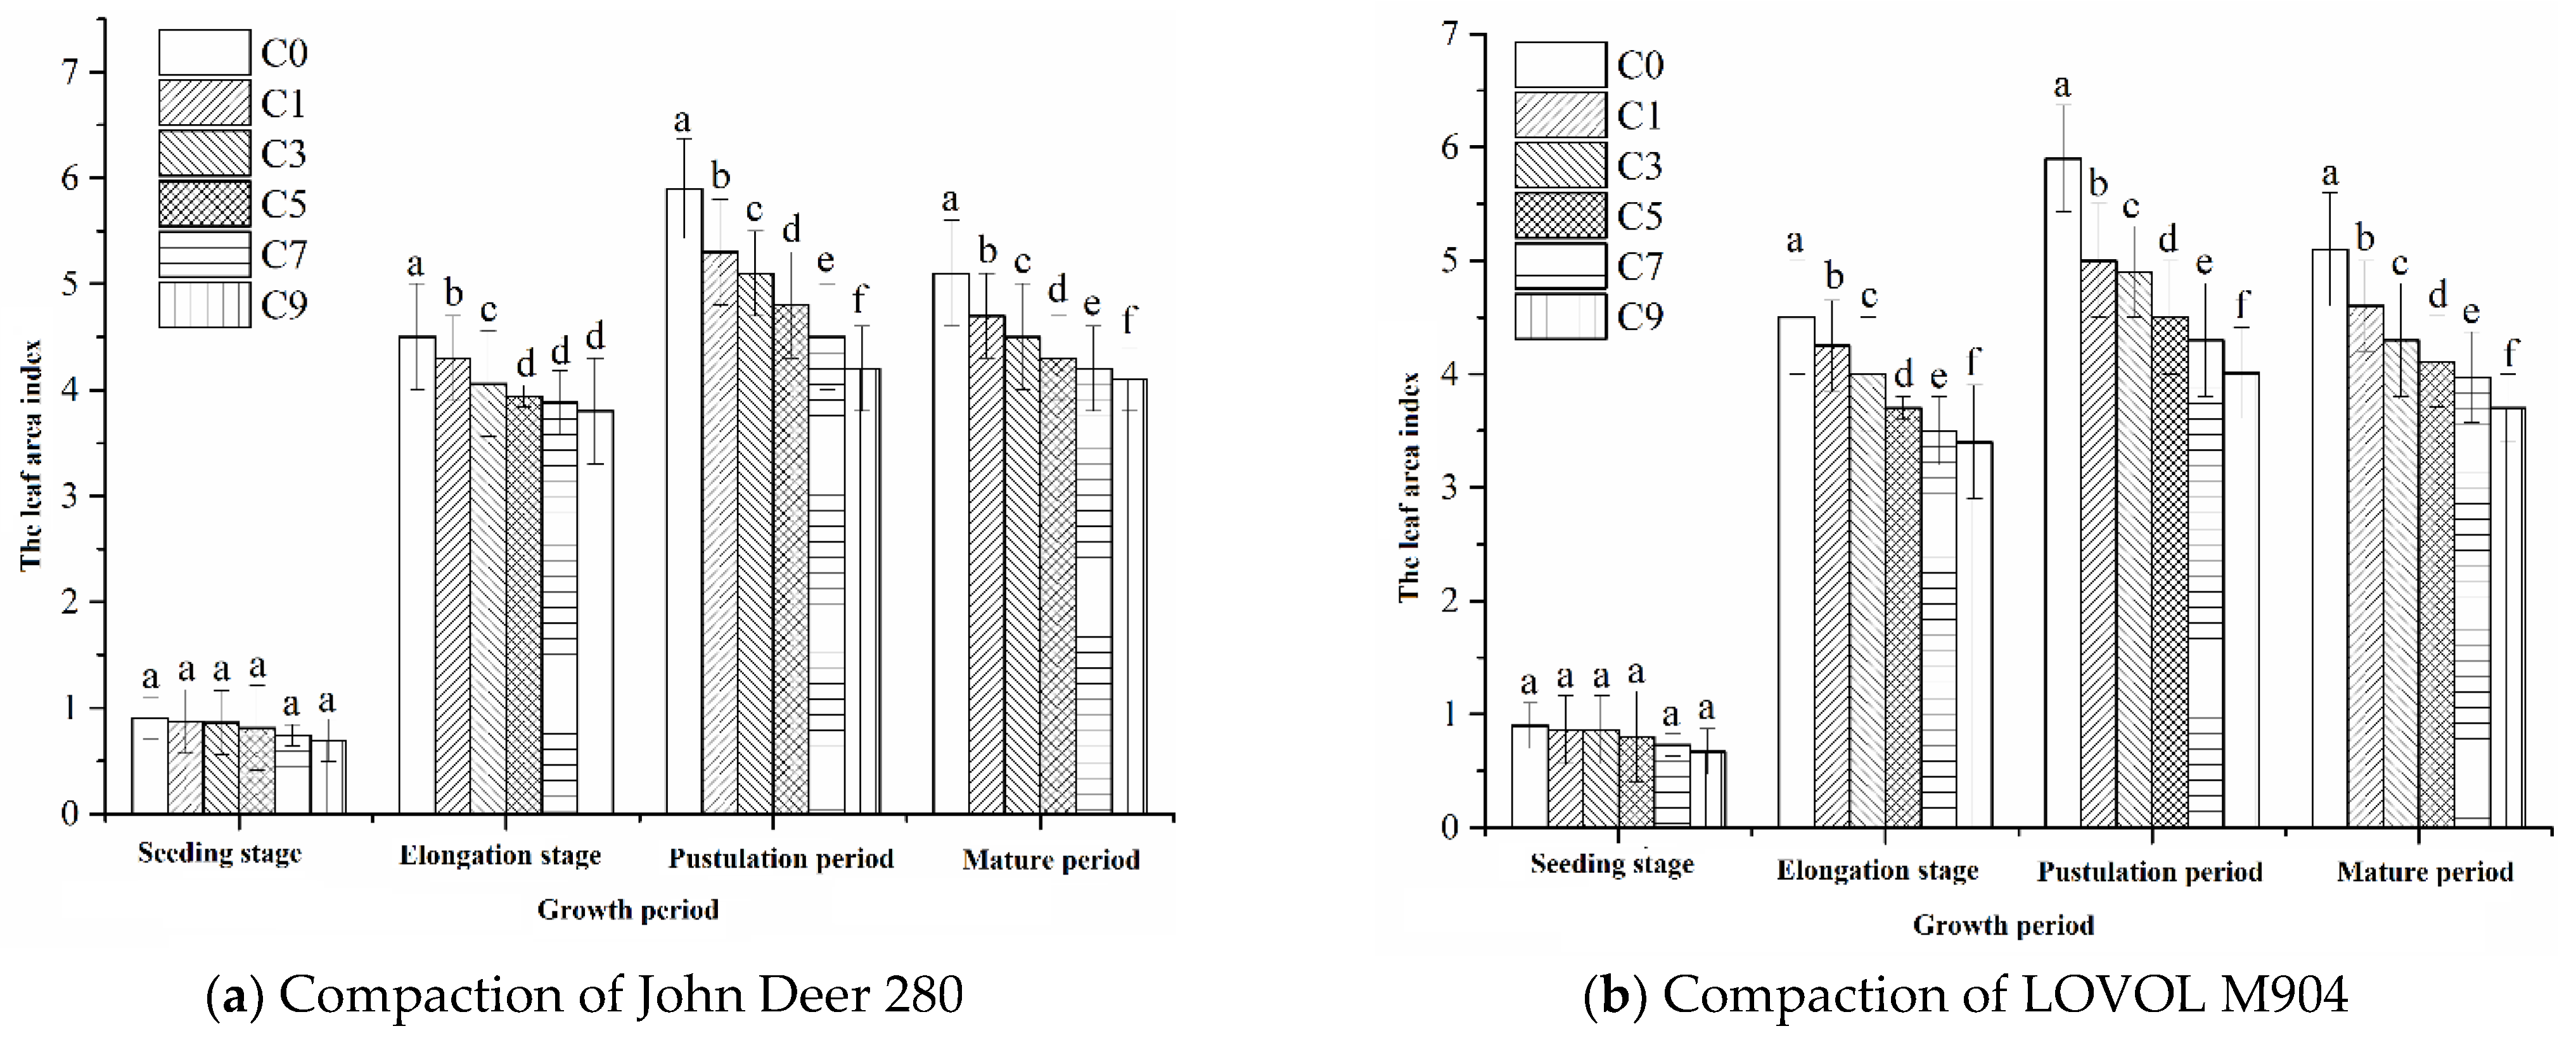
Figure 7 shows the leaf area index of maize during the critical growth period under compaction by two tractors. The results showed that the leaf area index tended to increase and then decrease throughout the growth cycle of maize from seedling to maturity. The main reason for these conditions is probably that when maize plants are at the seedling stage and elongation stage, they grow quickly, have strong photosynthesis, and their leaf area index growth is rapid. When maize entered the reproductive growth stage at the filling stage, the leaf area index reached the peak value at this time, and then the leaf area index began to decline in the mature stage [33,34]. Under the two axial tractor compaction conditions, the maize leaf area index decreased with the increase in the number of passes. Compared with the non-compaction treatment (C0), the average leaf area index of maize under the John Deer 280 tractor with 1, 3, 5, 7, and 9 passes decreased 7.5%, 11.5%, 15.5%, 18.8%, and 22.0%, respectively. The average leaf area index of maize under the LOVOL M904 tractor compaction treatment with 1, 3, 5, 7, and 9 passes decreased by 10.3%, 14.3%, 20.1%, 23.8%, and 28.2%, respectively. Compared with the John Deer 280 tractor, the average leaf area index of maize under the LOVOL M904 tractor with 1, 3, 5, 7, and 9 passed decreased by 3.01%, 3.16%, 5.34%, 6.16%, and 7.90%, respectively. With the increase in the number of tractor passes, the LAI decreased more seriously, and the decreasing effect of tractor loads on LAI became more and more obvious.
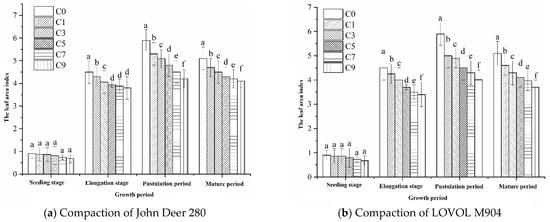
Figure 7.
Effects of soil compaction on leaf area index (LAI) of maize during the critical growth period. Different lowercase letters indicate significant differences among treatments (p < 0.05).
3.3.3. Effects of Soil Compaction on Root Growth of Maize
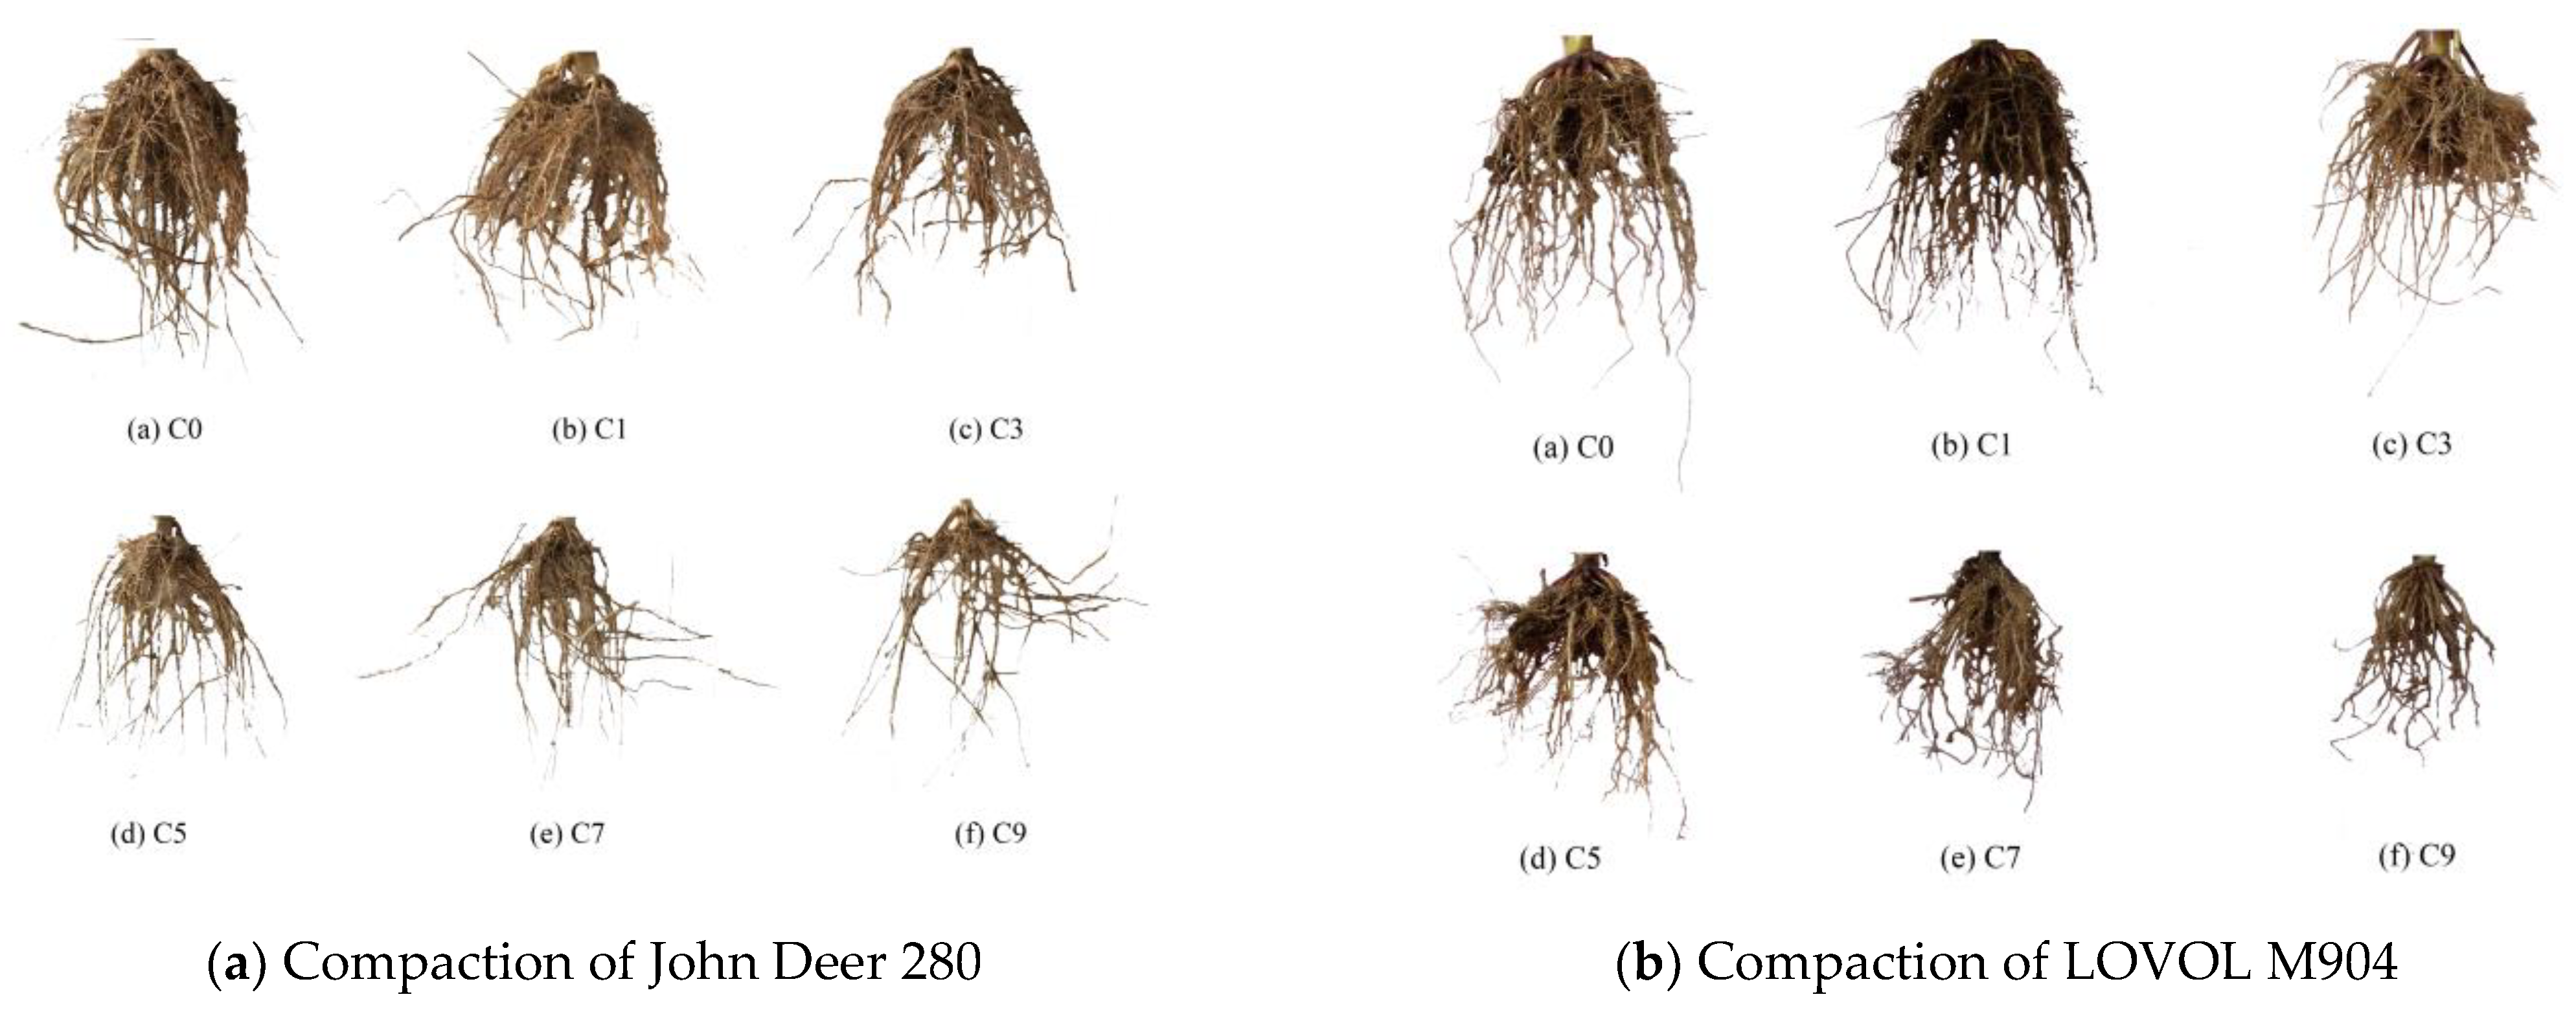
Figure 8 shows the effect of different numbers of passes on maize root growth under tractors with different mass, which can directly represent the growth and distribution conditions of the main root of maize. With the increase in the number of tractor passes, maize root content was less in the longitudinal direction, and mainly extended in the transverse direction.
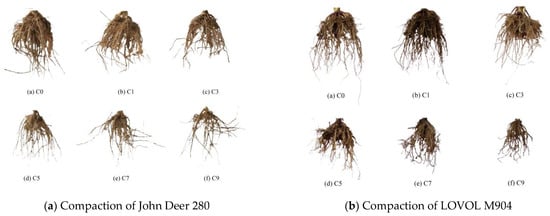
Figure 8.
The shape of maize roots under different loads and times of compaction.
As shown in Figure 9a,b, soil compaction can significantly increase maize root content in the top soil layer (0–10 cm) and decrease it in the deep soil layer (10–40 cm). In the 0–10 cm soil layer, root content of C0 treatment was 1.93%, 3.66%, 23.32%, 38.80%, and 40.01% less than that of John Deer 280 tractor compaction treatments 1, 3, 5, 7, and 9, respectively. The root content of 10–40 cm under C0 treatment was 5.59%, 9.82%, 27.42%, 57.71%, and 62.91% higher than that under John Deer 280 tractor compaction treatments 1, 3, 5, 7, and 9, respectively. The root content in the 0–10 cm soil layer under the uncompacted treatment was 18.38%, 26.57%, 41.09%, 49.57%, and 54.16% lower than that under compacted 1, 3, 5, 7, and 9 treatments of Lovol M904, respectively. The root content in 10–40 cm of the uncompacted treatment was 11.65%, 21.00%, 40.58%, 58.58%, and 72.01% higher than that in the 1, 3, 5, 7, and 9 passes of LOVOL M904, respectively.
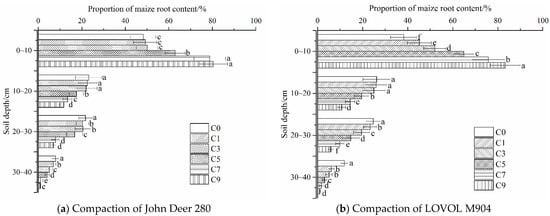
Figure 9.
Spatial distribution of maize roots under different loads and tractor passes. Different lowercase letters indicate significant differences among treatments (p < 0.05).
3.3.4. Effects of Soil Compaction on Maize Yield
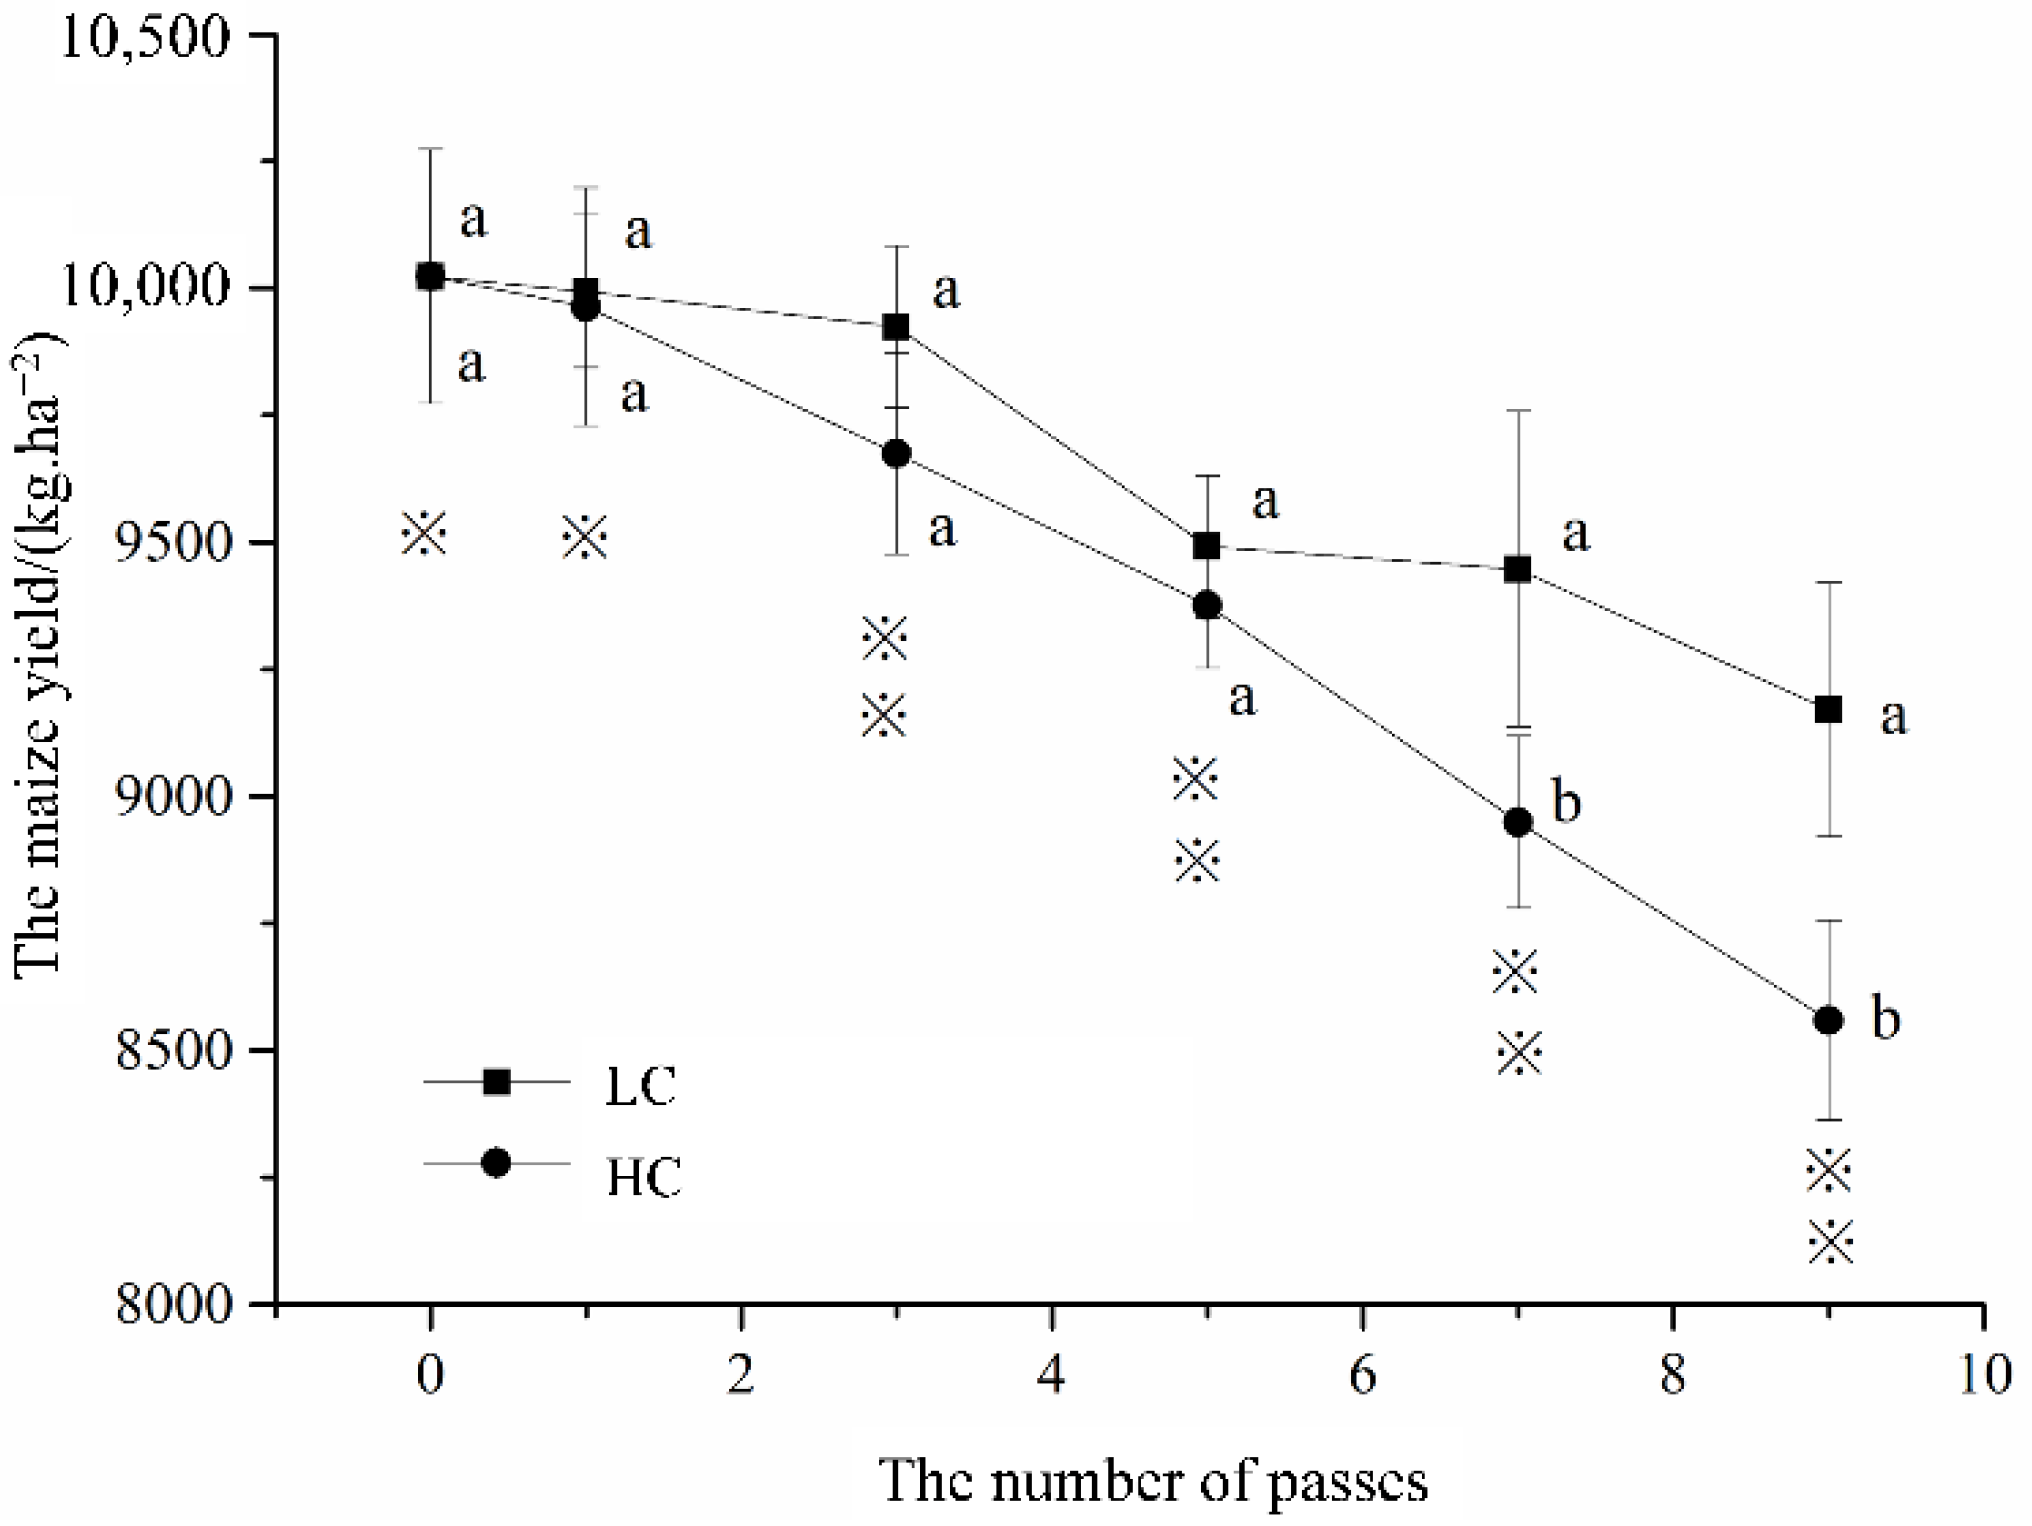
Figure 10 shows the effect of tractor compaction on maize yield by tractors with two different masses. It can be seen from the figure that both kinds of tractor compaction will reduce maize yield, and when the number of passes is greater than or equal to 3, it will significantly reduce maize yield.

Figure 10.
Effect of soil compaction on maize yield. Note: The same letters in the figure indicate that there is no significant difference in maize yield under two load compaction conditions, while the different letters indicate that there is a significant difference in maize yield caused by two treatments. In the figure, ※ indicates that there is no difference in yield between soil compaction treatment and non-compaction treatment, and two ※ indicates that maize yield is significantly reduced.
Compared with uncompacted soil, when the soil was compacted 1, 3, 5, 7, and 9 times by the LOVOL M904 tractor with a load of 4155 kg, maize yield decreased by 0.60%, 3.47%, 6.45%, 10.71%, and 14.60%, respectively, while when the soil was compacted the same number of times by the John Deer 280 tractor with a load of 1225 kg, maize yield decreased by 0.3%, 1.0%, 5.6%, 6.1%, and 9.3%, respectively.
Compared with the John Deer 280 tractor, the LOVOL M904 tractor reduces maize yield more significantly, but there was no large difference from 1 to 5 passes while the difference began to appear in the 7 and 9 passes of the tractor, and the 4155 kg tractor reduced maize yield by 5.27% and 6.66%, respectively.
4. Discussion
4.1. Effect of Tire Compaction on Soil Stress Distribution
This study found that the magnitude of additional stress in 0–20 cm surface soil is mainly related to the tire–soil contact surface stress distribution, and the additional stress in the 20–80 cm soil layer is mainly determined by the tractor axle-load. This observation may support the hypothesis that the soil stress is transmitted in the form of an irregular force chain during the transfer process [39]. The compressive strength of the surface soil is weak, so the tire–soil contact stress becomes the main influencing factor that determines the compaction of the surface soil [40]. In the test, the small tractor tire–soil contact surface stress is greater than that of the large tractor, with the increase in the depth, the compressive strength of the soil increases, and the force chain generated by the tractor with a large load will converge, and the overlapping effect makes the tractor load become the main influencing factor. The results of Loraine et al. showed that tire pressure, tire type, and soil parameters affect the surface stress of tire–soil contact and thus determine the surface soil stress distribution, and these results further support the present study [41]. Therefore, the tire type selection and design of agricultural machinery can effectively alleviate the problem of surface soil compaction and reduce the tire–soil contact surface stress as much as possible under the condition of ensuring the driving force of agricultural machinery [10,41]. The transfer of soil stress is not only related to the magnitude of the additional stress, but also to the strength of the soil itself. When the additional stress is less than the compaction strength of the soil, less stress continues to be transferred to the deep soil layer. Therefore, it can be assumed that the main factor determining the magnitude of the deep soil layer stress is the tractor load, not just tire–soil contact stress.
4.2. Effect of Tire Compaction on Soil Bulk Density
The continuous passes of the tractor have a great influence on the bulk density of the surface soil. When the number of passes is less than 7, the small axle-loaded tractor has large contact stress, resulting in a large bulk density of the surface soil. When the number of passes is more than 7, the large axle-loaded tractors cause a larger soil bulk density. In the 20–80 cm deep soil layer, compaction by the large axle-load tractor results in greater soil bulk density. According to these data, we can infer that the small tractor has a smaller tire–soil contact area, which leads to greater tire–soil contact stress, resulting in more serious soil compaction problems. With the tire subsidence increasing, the soil plastic deformation is larger, the self-recovery ability is weaker, and the influence of soil bulk density is more prominent [4,5]. Repeated passes of heavy agricultural machinery can lead to severe and destructive compaction of the surface and deep soil, affecting a depth of up to 30–45 cm [42,43]. As the number of passes increases, the difference in the amount of subsidence becomes smaller. At this time, the tractor with a larger load is the main factor because of its higher soil stress in the deep layer [9,11,12]. Botta G.F. [44] et al. found that large axle-load high air pressure crop harvesting machinery during agricultural production is an important cause of soil compaction and conducted field trials by setting three treatments of high axle-load low air pressure, low axle-load high air pressure, and medium axle-load rated air pressure. They obtained the result that the low axial-load high air pressure treatment at a 0–20 cm soil depth can cause a higher soil compaction phenomenon, while the high axial-load low air pressure treatment at the 20–60 cm soil layer causes a more serious soil compaction phenomenon. The results of their study are consistent with those of this paper. The main reason for this phenomenon is the stress distribution on the tire–soil contact surface caused by the tire pressure: lower tire pressure leads to higher contact surface stresses, which have a greater impact on surface soil compaction, but tire pressure leads to soil compressive stress transfer mainly in the surface soil range, and it is mainly the axle-load that determines the deep soil compaction phenomenon [10,11,45]. Therefore, the soil compaction phenomenon in the process of agricultural machinery operation should comprehensively consider the load and the contact stress of the traveling device–soil.
4.3. The Effect of Tire Compaction on Crop Growth
Soil compaction caused by tires affects not only the plough layer but also the plow bottom formation and the subsoil layer. Arvidsson [46] and other studies found that soil compaction can continuously affect crop growth, and mainly restrict crop growth and development by affecting soil mechanical properties. In a study conducted by Ewa A et al., it was shown that repeated compaction of soil by agricultural machinery of a load of 2000 kg can significantly limit the growth of crop roots and ultimately lead to reduced yields [47]. It was found that the most suitable soil capacity value for crop growth is 1.43 g cm−3, and when the soil capacity is greater than this threshold value, crop growth will be affected [6]. A study by Li D [48] found that the width of the tires for large- or medium-sized tractors to be compacted once accounted for 30–40% of the width of the wheelbase, and that three times of compaction in the ground could compact the entire surface. The maize plant height, root length, and the number of secondary roots in the soil compaction area were reduced by 35.3%, 53.3%, and 32.4%, respectively, compared with the uncompacted area. Once tire compaction resulted in a 27% reduction in the emergence rate, and twice compaction reduced the emergence rate by 50.3%. Mari, G R et al. [49] found that soil compaction has a significant effect on almost all aspects of the entire growth cycle of maize and wheat, and this effect is mainly caused by the effect of tire rolling on soil properties. These viewpoints are basically consistent with the viewpoints in this paper. This paper showed that the influence of soil compaction on crop growth is mainly due to the change in soil bulk density caused by tire compaction. Changes in bulk density at different depths of the soil profile cause soil hydrothermal properties and material circulation between the top and bottom soils to be blocked, these factors together affect crop growth and ultimately lead to crop yield reduction.
5. Conclusions
In this investigation, different axial load tractors and different compaction times were set up through field experiments to analyze the influence of the factors above on soil bulk density soil stress transfer and crop growth, aiming to reveal the internal influence mechanism of soil compaction and crop growth. The main conclusions drawn are as follows:
(1) These experiments confirmed that the magnitude of the additional surface soil stresses generated during tractor travel is mainly related to the tire–soil contact stresses, with the additional deep soil stresses being more influenced by the tractor load.
(2) When the number of successive compactions is less than 7, small axle-load tractors cause greater soil bulk density in the 0–20 cm depth soil layer, and when the number of compactions is greater than 7, large axle-load tractors cause greater soil bulk density in the 20–80 cm depth soil layer.
(3) Soil compaction can inhibit crop growth. Compaction by tractors and other large machines can affect maize height, stem diameter, leaf area index, root growth, and yield, and its severity will increase with the increase in axial load and compaction times. However, the degree of impact on the crop must be analyzed further depending on the soil type, cultivation method, and crop type in the test area.
Author Contributions
Data curation, X.W.; formal analysis, J.H.; funding acquisition, J.H.; methodology, X.W.; visualization, M.B., L.L., K.C. and H.Z.; writing—original draft, X.W., M.B. and S.G. All authors have read and agreed to the published version of the manuscript.
Funding
This research was supported by the Strategic Priority Research Program of the Chinese Academy of Sciences (Grant No. XDA28010402), the National Natural Science Foundation of China (Grant No. 32101631), and the Open Project of Sichuan Modern Agricultural Equipment Engineering Technology Research Center (Grant No. XDNY2021-001).
Institutional Review Board Statement
Not applicable.
Informed Consent Statement
Not applicable.
Data Availability Statement
Not applicable.
Acknowledgments
The authors would like to acknowledge the technical support from their teacher and supervisor. We also appreciate the assistance provided by team members during the experiments. Additionally, we sincerely appreciate the work of the editor and the anonymous reviewers for the present paper.
Conflicts of Interest
The authors declare no conflict of interest.
References
- He, C.; Wang, Y.-Q.; Yu, W.-B.; Kou, Y.-H.; N’dri Yves, B.; Zhao, X.; Zhang, H.-L. Comprehensive analysis of resource utilization efficiency under different tillage systems in North China Plain. J. Clean. Prod. 2022, 347, 131289. [Google Scholar] [CrossRef]
- Shaheb, R.; Ramarao, V.; Scott, A.S. A Review on the Effect of Soil Compaction and its Management for Sustainable Crop Production. J. Biosyst. Eng. 2021, 46, 417–439. [Google Scholar] [CrossRef]
- Richard, W.; Birl, L. Soil Compaction: Causes, Concerns, and Cures. 2008. Available online: https://soilsextension.qa.webhosting.cals.wisc.edu/wp-content/uploads/sites/68/2014/02/A3367.pdf (accessed on 15 August 2018).
- Kumar, V.; Jain, M.; Rani, V.; Kumar, A.; Kumar, S.; Naresh, J. A Review of Soil Compaction—Concerns, Causes and Alleviation. Int. J. Plant Soil Sci. 2008, 22, 1–9. [Google Scholar] [CrossRef]
- Nawaz, M.F.; Bourrié, G.; Trolard, F. Soil Compaction Impact and Modelling. A Review. Agron. Sustain. Dev. 2013, 33, 291–309. [Google Scholar] [CrossRef]
- Peter, B.O.; Ugarte, C.M. A meta-analysis of the impact of traffic-induced compaction on soil physical properties and grain yield. Soil Tillage Res. 2021, 211, 105019. [Google Scholar] [CrossRef]
- Gao, A.; Han, Z.; Wu, J. Experimental research on alfalfa soil compaction by mowing machine. Trans. CSAE 2007, 23, 101–105. [Google Scholar] [CrossRef]
- Li, R.; Lin, C.; Gao, H. Analysis of variances caused by agricultural machines for soil compaction. Agric. Mech. Res. 2001, 3, 84–87. [Google Scholar] [CrossRef]
- Gysi, M.; Fluhler, O.A. Influence of Single Passes with High Wheel Load on a Structured, Unploughed Sandy Loam Soil. Soil Tillage Res. 1999, 52, 141–151. [Google Scholar] [CrossRef]
- Schjønning, P.; Lamandé, M.; Tøgersen, F.A.; Arvidsson, J.; Keller, T. Modelling Effects of Tyre Inflation Pressure on the Stress Distribution Near the Soil–Tyre Interface. Biosyst. Eng. 2008, 99, 119–133. [Google Scholar] [CrossRef]
- Lamandé, M.; Schjønning, P. Transmission of Vertical Stress in a Real Soil Profile. Part Ii: Effect of Tyre Size, Inflation Pressure and Wheel Load. Soil Tillage Res. 2011, 114, 71–77. [Google Scholar] [CrossRef]
- Abebe, T.A.; Tanaka, T.; Yamaza, M. Soil Compaction by Multiple Passes of a Rigid Wheel Relevant for Optimization of Traffic. J. Terramechanics 1989, 26, 139–148. [Google Scholar] [CrossRef]
- Arvidsson, J.; Trautner, A.; Akker, J.J.; Schjønning, P. Subsoil Compaction Caused by Heavy Sugarbeet Harvesters in Southern Sweden. I. Soil Physical Properties and Crop Yield in Six Field Experiments. Soil Tillage Res. 2001, 60, 67–78. [Google Scholar] [CrossRef]
- Zhang, J.; Fu, W.; Ma, H. The Soil Compactive Characteristics and Their Application in Agricultural Production. Trans. CSAE 1995, 2, 17–20. [Google Scholar]
- Castioni, G.A.F.; de Lima, R.P.; Cherubin, M.R.; Bordonal, R.O.; Rolim, M.M.; Carnvalho, J.L.N. Machinery traffic in sugarcane straw removal operation: Stress transmitted and soil compaction. Soil Tillage Res. 2021, 213, 105122. [Google Scholar] [CrossRef]
- Liu, K.; Zhou, Q.; Wu, W. Comparison between multispectral and hyperspectral remote sensing for LAI estimation. Trans. Chin. Soc. Agric. Eng. 2016, 3, 155–162. [Google Scholar]
- Hamza, M.A.; Anderson, W.K. Soil Compaction in Cropping Systems a Review of the Nature, Causes and Possible Solutions. Soil Tillage Res. 2005, 82, 121–145. [Google Scholar] [CrossRef]
- Shaheb, M.R. A study on the Effect of Tyre Inflation Pressure on Soil Properties, Growth and Yield of Maize and Soybean in Central Illinois. Ph.D. Thesis, Harper Adams University, New Port, UK, 2020. [Google Scholar]
- Kirby, J.M.; Bengough, A.G. Influence of Soil Strength on Root Growth: Experiments and Analysis Using a Critical-State Model. Eur. J. Soil Sci. 2002, 53, 119–127. [Google Scholar] [CrossRef]
- Kristoffersen, A.O.; Riley, H. Effects of Soil Compaction and Moisture Regime on the Root and Shoot Growth and Phosphorus Uptake of Barley Plants Growing on Soils with Varying Phosphorus Status. Nutr. Cycl. Agroecosys. 2005, 72, 135–146. [Google Scholar] [CrossRef]
- Gerard, C.J.; Sexton, P.; Shaw, G. Physical Factors Influencing Soil Strength and Root Growth. Agron. J. 1982, 74, 875–879. [Google Scholar] [CrossRef]
- Guillermo, P.; Carina, R.A.; Miguel, Á.T. Soil compaction alleviation by deep non-inversion tillage and crop yield responses in no tilled soils of the Pampas region of Argentina. A meta-analysis. Soil Tillage Res. 2021, 211, 105022. [Google Scholar]
- Cid, P.; Carmona, I.; Murillo, J.M.; Gomez-Macpherson, H. No-Tillage Permanent Bed Planting and Controlled Traffic in a Maize-Cotton Irrigated System Under Mediterranean Conditions: Effects on Soil Compaction, Crop Performance and Carbon Sequestration. Eur. J. Agron. 2014, 61, 24–34. [Google Scholar] [CrossRef]
- Bouwman, L.; Arts, W.B.M. Effects of Soil Compaction on the Relationships Between Nematodes, Grass Production and Soil Physical Properties. Appl. Soil Ecol. 2000, 14, 213–222. [Google Scholar] [CrossRef]
- Botta, G.; Jorajurida, D.; Rosatto, H.; Ferrero, C. Light Tractor Traffic Frequency on Soil Compaction in the Rolling Pampa Region of Argentina. Soil Tillage Res. 2006, 86, 9–14. [Google Scholar] [CrossRef]
- Liu, X.; Liu, H.; Ren, D.; Liu, C.; Zhang, Y.; Wang, S.; Li, Z.; Zhang, M. Interlinkages between soil properties and keystone taxa under different tillage practices on the North China Plain. Appl. Soil Ecol. 2022, 178, 104551. [Google Scholar] [CrossRef]
- Hu, R.; Liu, Y.; Chen, T. Responses of soil aggregates, organic carbon, and crop yield to short-term intermittent deep tillage in Southern China. J. Clean. Prod. 2021, 298, 126767. [Google Scholar] [CrossRef]
- Zhang, H.; Shi, Y.; Dong, Y.; Lapen, D.R.; Liu, J.; Chen, W. Subsoiling and conversion to conservation tillage enriched nitrogen cycling bacterial communities in sandy soils under long-term maize monoculture. Soil Tillage Res. 2022, 215, 105197. [Google Scholar] [CrossRef]
- Wang, X. Study on the Evaluation of Soil Compaction by Agricultural Tire and Combination Shovel Loose Soil Technology. Master’s Thesis, China Agricultural University, Beijing, China, 2018. [Google Scholar]
- Yang, W.; Lan, H.; Li, M.; Meng, C. Prediction of Top Soil Layer Bulk Density Based on Image Processing and Gradient Boosting Regression Tree Model. Trans. Chin. Soc. Agric. Mach. 2020, 51, 193–200. [Google Scholar] [CrossRef]
- Lamande, M.; Schjønning, P.; Frede, A. Mechanical behaviour of an undisturbed soil subjected to loadings: Effects of load and contact area. Soil Tillage Res. 2007, 97, 91–106. [Google Scholar] [CrossRef]
- Keller, T.; Berli, M.; Ruiz, S. Transmission of vertical soil stress under agricultural tyres: Comparing measurements with simulations. Soil Tillage Res. 2014, 140, 106–117. [Google Scholar] [CrossRef]
- Cui, Z. Experimental Study on the Effects of Water-Saving Irrigation on Soil Water Salt and Nitrogen Dynamics and Maize Growth Yield. Master’s Thesis, China Agricultural University, Beijing, China, 2017. [Google Scholar]
- Cai, M. Effects of Water Deficit and Mulching on the Growth and Yield of Drip Maize in Chifeng Area. Master’s Thesis, China Agricultural University, Beijing, China, 2017. [Google Scholar]
- Lian, J. Distribution of Roots of Maize and Their Effects on Soil Physical Properties. Master’s Thesis, Northwest A&F University, Xiangyang, China, 2013. [Google Scholar]
- Hu, H. Design and Research of Targeted Hole-pricking and Deep-application Fertilizer Applicator between Maize Rows. Master’s Thesis, China Agricultural University, Beijing, China, 2017. [Google Scholar]
- Reichert, J.M.; Suzuki, L.E.A.S.; Reinert, D.J. Reference Bulk Density and Critical Degree-of-Compactness for No-Till Crop Production in Subtropical Highly Weathered Soils. Soil Tillage Res. 2009, 102, 242–254. [Google Scholar] [CrossRef]
- Arvidsson, J.; Håkansson, I. Response of Different Crops to Soil Compaction—Short-Term Effects in Swedish Field Experiments. Soil Tillage Res. 2014, 138, 56–63. [Google Scholar] [CrossRef]
- Jan, D.; Puea, M.L.; Wim, C. DEM simulation of stress transmission under agricultural traffic Part 2: Shear stress at the tyre-soil interface. Soil Tillage Res. 2020, 203, 104660. [Google Scholar] [CrossRef]
- Holthusena, D.; Anibal, A.; Reichert, M.; Horn, R. Soil porosity, permeability and static and dynamic strength parameters under native forest/grassland compared to no-tillage cropping. Soil Tillage Res. 2018, 177, 113–124. [Google Scholar] [CrossRef]
- Damme, L.; Stettler, M.; Pinet, M.; Vervaet, P.; Keller, T.; Munkholm, L.J.; Lamande, M. The contribution of tire evolution to the reduction of soil compaction risks. Soil Tillage Res. 2019, 194, 104283. [Google Scholar] [CrossRef]
- Taghavifar, H.; Mardani, A. Effect of Velocity, Wheel Load and Multipass on Soil Compaction. J. Saudi Soc. Agric. Sci. 2014, 13, 57–66. [Google Scholar] [CrossRef]
- Patel, S.K.; Mani, I. Effect of Multiple Passes of Tractor with Varying Normal Load on Subsoil Compaction. J. Terramech. 2011, 48, 277–284. [Google Scholar] [CrossRef]
- Botta, G.F.; Tolón-Becerra, A.; Rivero, D.; Laureda, D.; Ramirez-Roman, M.; Lastra-Bravo, X.; Agnes, D.; Flores-Parra, I.M.; Pelizzari, F.; Martiren, V. Compaction Produced by Combine Harvest Traffic: Effect on Soil and Soybean (Glycine max L.) Yields Under Direct Sowing in Argentinean Pampas. Eur. J. Agron. 2016, 74, 155–163. [Google Scholar] [CrossRef]
- Rücknagel, J.; Hofmann, B.; Deumelandt, P.; Reinicke, F.; Bauhardt, J.; Hulsbergen, K.-J. Indicator Based Assessment of the Soil Compaction Risk at Arable Sites Using the Model Repro. Ecol. Indic. 2015, 52, 341–352. [Google Scholar] [CrossRef]
- Arvidsson, J.; Hakansson, I. Do Effects of Soil Compaction Persist After Ploughing? Results from 21 Long-Term Field Experiments in Sweden. Soil Tillage Res. 1996, 39, 175–197. [Google Scholar] [CrossRef]
- Czyż, E.A. Effects of Traffic on Soil Aeration, Bulk Density and Growth of Spring Barley. Soil Tillage Res. 2004, 79, 153–166. [Google Scholar] [CrossRef]
- Li, D.; Gao, X.; Wang, D. Study on the effects of compaction on soil physical properties and crop emergence. Soils Fertil. Sci. China 1981, 5–6. [Google Scholar]
- Mari, G.R.; Ji, Y.; Zhou, J. Effect of different types of tractor traffic on soil physical properties and yield of winter wheat. Trans. CSAE 2007, 23, 132–140. [Google Scholar] [CrossRef]

Publisher’s Note: MDPI stays neutral with regard to jurisdictional claims in published maps and institutional affiliations. |
© 2022 by the authors. Licensee MDPI, Basel, Switzerland. This article is an open access article distributed under the terms and conditions of the Creative Commons Attribution (CC BY) license (https://creativecommons.org/licenses/by/4.0/).