Article

Different Diets Change Milk Extracellular Vesicle-Protein Profile in Lactating Cows

1
State Key Laboratory of Animal Nutrition, Institute of Animal Sciences, Chinese Academy of Agricultural Sciences, Beijing 100193, China
2
Tianjin Key Laboratory of Agricultural Animal Breeding and Healthy Husbandry, College of Animal Science and Veterinary Medicine, Tianjin Agricultural University, Tianjin 300384, China
*
Author to whom correspondence should be addressed.
These authors contributed equally to this work.
Agriculture 2022, 12(8), 1234; https://doi.org/10.3390/agriculture12081234
Submission received: 2 July 2022 / Revised: 5 August 2022 / Accepted: 8 August 2022 / Published: 16 August 2022
(This article belongs to the Section Farm Animal Production)

Abstract

:
We previously demonstrated that the partial replacement of forage with non-forage fiber sources (NFFS) in dairy cow diets could decrease the ruminal ratio of acetate to propionate, leading to changes in circulatory and milk extracellular vesicle (EV)-miRNAs expression. This study further explored the effects of the NFFS diets on milk EV proteins, which were proposed as food bio-active ingredients in recent research. We replaced 8.97% alfalfa hay and 2.51% corn silage with 5.72% whole cotton seed and 4.73% soybean hull in the cow diet, reducing the forage neutral detergent fiber from 20.92% to 15.67%. In total 488 proteins were identified by proteome, and 65 proteins were differentially expressed in response to the NFFS diets, the functions of which were mainly enriched in immune-related pathways, including complement and coagulation cascades, phagosome, Staphylococcus aureus infection, and chemokine signaling pathway. Moreover, 57 milk EV-proteins, mainly attributed to enzymes, cytoskeletal proteins, and transport proteins, were in the top 100 most identified EV-proteins in different species and body fluids, which might be related to the biogenesis, structure, and traffic of all vesicles. The results showed that NFFS diets could influence cow milk EV-protein composition, implying that we could take effective nutritional strategies to promote the synthesis of milk functional ingredients. Combined with all our studies, NFFS diets were recommended to improve the rumen fermentation model and enrich the milk EV proteins of dairy cows.

1. Introduction

As a buffet of lipids, sugars, proteins, vitamins, and minerals, milk provides more than nutritional macromolecules but bioactive components for the rapidly-growing newborns. The fluid teems with immune cells and thousands of bioactive molecules; some are fat-like, others are indigestible oligosaccharides, and other proteins in nature, jump-starting a newborn’s life by feeding helpful microbes and providing immunity [1,2,3]. Additionally, cow milk is a supply of significant human food sources, especially as the most important raw material for infant diets [4]. As an essential component of milk, the cow milk protein concentration is about 32 g/L, including abundant essential amino acids and bioactive ingredients [5]. Milk proteins may come from several sources: secreted by the mammary epithelium, produced by cells carried within the milk, and drawn from maternal serum [6]. Therefore, the synthesis of milk protein is dynamic and varies within species, breed, age, stage of lactation, maternal diet, energy balance, and the health status of the udder [4,7].
Divided into whey and casein fractions, milk proteins comprised a remarkable array of specific complexes, such as casein, α-lactalbumin, β-lactoglobulin, lactoferrin, secretory IgA, lysozyme, serum albumin, and other bioactive components [8]. Among all the milk whey proteins were extracellular vesicle (EV)-proteins, wrapped by uniquely stable bio-membranes, including many soluble proteins, such as hormones, growth factors, cytokines, and enzymes [9]. Composed of apoptotic bodies, microvesicles, and exosomes, EVs are small membrane vesicles heterogeneous in size (20 nm to 2 μm), biosynthesized by many types of cells, and secreted to various biofluids and extracellular spaces [10]. The biogenesis of EVs underwent cargo recognition, sorting, and abscission events involved in the endosomal complex required for transport (ESCRT) or ESCRT-independent processes [11]. The loading cargos of EVs was not a random process but involved some sorting mechanisms that favor some proteins over others [11]. So far, the effects of different diets on the sorting of EV proteins in cow milk have not been reported.
The new proteomic techniques have made it possible to explore the composition of milk EV protein comprehensively and helped find low abundance proteins that were underrepresented before [12]. Adding the high-fiber byproducts of the crops, namely forage with non-forage fiber sources (NFFS), into ruminant diets was widely used in animal production, which could provide sufficient energy for cattle and maintain rumen health with significantly reduced feed costs [13]. We previously demonstrated that the partial replacement of forage with NFFS in dairy cow diets could decrease the ratio of ruminal acetate to propionate, which might change the whole metabolism through energy supply, including milk synthesis [14]. Furthermore, we found that the NFFS diets influenced the expression of circulatory and milk EV-miRNA, with increased particle concentration of milk EVs [15,16]. Hence, this study hypothesizes that the replacement of forage with NFFS could change the cow milk EV-protein composition. Accordingly, we apply advanced isobaric tags for relative and absolute quantification (iTRAQ) technology to explore the effects of NFFS diets on cow milk EV proteins.

2. Materials and Methods

2.1. Animal Treatment and Sample Collection

All of the operations were strictly according to the Directions for Caring of Experimental Animals from the Ministry of Science and Technology, China ([2006] no. 398). The study was approved by the Chinese Academy of Agricultural Sciences Animal Care and Use Committee (Beijing, China), and the identification code was IAS2021-14.
Eight lactating Holstein cows, with a 101 ± 10 day’s lactation period, divided into two groups, were housed in the environmentally-controlled chambers in this experiment and exposed to a constant 20 °C and 40% humidity. We pre-fed the cows for two weeks prior to the test period, and the experiment lasted 30 days. The cows were fed three times a day (08:00, 14:00, and 20:00 h), ensuring ad libitum intake. We partly replace the alfalfa hay with whole cotton seed and soybean hull in the treated cow diets. The total mixed rations (TMR) diets of the two groups were designed to exceed the predicted requirements (NRC, 2001) [17] and are shown in Table 1. We replaced 8.97% alfalfa hay and 2.51% corn silage with 5.72% whole cotton seed and 4.73% soybean hull in the diets, reducing the forage neutral detergent fiber from 20.92% to 15.67%. According to our previous study, the treated diet did not significantly affect the main growth and production parameters of cows, including dry matter intake, rumen pH, and milk yield [15]. The milk samples from each cow were collected at 07:00, 13:00, and 21:00 h on the last day of the experimental period.

2.2. Isolation of Milk Whey and EVs

Milk samples were taken out from the −80 °C refrigerator and thawed in 37 °C water until it was completely liquid. Then, 2 mL of the raw milk was centrifuged at 2000× g for 10 min to remove the cells, debris, and fat globules. Then, 1 mL of the middle layer supernatant was centrifuged at 10,000× g for 30 min and 10 min, respectively, to remove cell debris in the lower layer, and milk whey was obtained. Total Exosome Isolation (from other body fluids) (Invitrogen, Catalog Number: 4484453, Waltham, MA, USA) was used to isolate exosomes from milk. Then, 600 μL of the milk whey was diluted with 600 μL 1X PBS and added 600 μL reagent. The mixture was pipetted up and down until the solution was homogenous. After incubation for 30 min at room temperature, the mixture was centrifuged at 10,000× g for 10 min. The supernatant was removed by pipette. Then, 300 μL 1X PBS was added to resuspend the EVs. The resuspended EVs were centrifuged at 10,000× g for 5 min and existed in the supernatant.

2.3. High Abundance Proteins Removal and BCA Assay

High abundance proteins such as albumin, transferrin, IgG, IgA, and IgM were depleted from the milk EVs by PierceTM Top 12 Abundant Protein Depletion Spin Columns (Thermo Scientific, Catalog Number: 85165, Waltham, MA, USA). The removal of these high abundance proteins could enhance the detection of low abundance proteins. A PierceTM BCA Protein Assay Kit (Thermo Scientific, Catalog Number: 23225, Waltham, MA, USA) was used to determine the protein concentration, strictly according to the manufacturer’s instructions. There was a good linear relationship between the maximum absorbance at 562 nm of BCA working reagent binding proteins and their concentration so that the protein concentration could be calculated according to the absorbance value.

2.4. SDS-PAGE

Seven micrograms of EV samples were separated on a 12% sodium dodecyl sulfate polyacrylamide gel electrophoresis (SDS-PAGE). After separation, the gel was stained with Coomassie brilliant blue: fixed for 2 h, stained for 12 h, and washed until the background cleared. The gel image was scanned by ImageScanner (GE Healthcare, Chicago, IL, USA) at 300 dpi using the full-color mode.

2.5. FASP Digestion and iTRAQ Labeling

The milk EV protein digestion was performed according to the document with minor modifications [18]. One hundred micrograms of extracted EVs were added into 120 μL of reducing buffer (10 mM DTT, 8 M Urea, 100 mM TEAB, pH 8.0) on a 10 K ultrafiltration tube and incubated at 60 °C for 1 h. IAA was added to the solution with the final concentration being 50 mM and reacted in the dark for 40 min at room temperature. The solution was centrifuged at 12,000× g for 20 min at 4 °C, and the flow-through was discarded. One hundred microliters of 300 mM TEAB were added to the tube and centrifuged at 12,000× g for 20 min and repeated this step. The filter tubes were transferred into new collecting tubes and added 100 μL 100 mM TEAB, followed by 3 μL sequencing-grade trypsin (1 μg/μL) in each tube. Then the solution was incubated at 37 °C for 12 h. The digested peptides were collected at 12,000× g for 20 min centrifugation, and 50 μL 100 mM TEAB was used to collect the rest peptides. The peptides were lyophilized.
The collected peptides were labeled by iTRAQ Reagent-8plex Multiplex Kit (ABSciex, Washington D.C, USA) according to the instructions. The lyophilized samples were resuspended in 100 μL of 50 mM TEAB, and 40 μL were used for labeling. Two hundred microliters of isopropanol was added to the iTRAQ reagent. Then100 μL iTRAQ reagents were added to each sample and incubated for 2 h at room temperature. Finally, 200 μL of HPLC water was added and incubated for 30 min to terminate the reaction. These samples were ready for LC-MS/MS analysis.

2.6. LC-MS/MS Analysis

Reversion phase chromatography separation was performed with an 1100 HPLC System (Agilent, Santa Clara, CA, USA) using an Agilent Zorbax Extend C column (5 μm, 150 mm × 2.1 mm). Mobile phases A (2% acetonitrile in HPLC water) and mobile phase B (90% acetonitrile in HPLC water) were used for the reversion phase gradient. The eluting gradients were set as follows: 0~8 min, 98% A; 8.00~8.01 min, 98~95% A; 8.01~48 min, 95~75% A; 48~60 min, 75~60% A; 60~60.01 min, 60~10% A; 60.01~70 min, 10% A; 70~70.01 min, 10~98% A; 70.01~75 min, 98% A. Tryptic peptides were separated at 300 μL/min and monitored at 210 and 280 nm. The samples were harvested from 8 to 60 min, and the eluents were collected at one-minute intervals and numbered from 1 to 15 pipelines until the end of elution. The samples were transported to the C18 pre-column at 300 nL/min (PepMap C18, 100 A, 100 μm × 2 cm, 5 μm) and then eluted with an analytical column (PepMap C18, 100 A, 75 μm × 50 cm, 2 μm). Mobile phases A (0.1% formic acid in HPLC water) and mobile phase B (80% acetonitrile and 0.1% formic acid in HPLC water) were used for the reversion phase gradient. The eluting gradients were set as follows: 0~40 min, 5–30% B; 40~54 min, 30–50% B; 54~55 min, 50–100% B; 55~60 min, 100% B.
MS/MS analyses were performed using a Q-Exactive mass spectrometer (Thermo Scientific, Waltham, MA, USA) equipped with a Nanospray Flex source (Thermo Scientific, Waltham, MA, USA). Peptides were separated by C18 columns (15 cm × 75 μm) on EASY-nLCTM 1200 system (Thermo Scientific, Waltham, MA, USA). The flowrate of the samples was 300 nL/min, and linear gradients were 90 min (0~55 min, 8% B; 55~79 min, 30% B; 79~80 min, 50% B; 80~90 min, 100% B; mobile phase A = 0.1% formic acid in water and B = 80% acetonitrile/0.1% formic acid in water). The mass resolution of primary MS was set to 35,000, with the automatic gain control target 1 × 10⁶ and the maximum injection time of 50 ms. MS scans were performed in the mass range of 300~1600 m/z, and the ten most intense peaks in MS were carried out. The ten most intense peaks in MS were fragmented, with higher-energy collisional dissociation to normalize collision energy being 32. MS/MS spectra were obtained at a 17,500 mass resolution, with the automatic gain control target being 2 × 10⁵ and the max injection time being 80 ms. The Q Exactive dynamic exclusion was set at 15 s and run under the positive mode.

2.7. Data Processing

Proteome DiscovererTM Software version 2.2 (Thermo Scientific, Waltham, MA, USA) was used to extract the Q Exactive raw data against the UniProt Bos taurus fasta and quantitated the EV peptides and proteins. We selected using iTRAQ 8 plex (Peptide Labeled) as the protein quantification method. The iodoacetamide derivative of cysteine and applied Biosystems iTRAQ(TM) multiplexed quantitation chemistry of lysine and the n-terminus were specified as fixed modifications. The false discovery rate (FDR) was controlled under 0.01, and the protein groups considered for quantification required at least 2 peptides. The independent sample T-test was used to analyze the differentially quantified milk EV proteins, and a p-value ≤ 0.05 was determined to indicate a significant difference.

2.8. Principal Component Analysis (PCA) and Bioinformatics Analysis

The milk EV-protein expression profile responding to different diets was analyzed using the PCA program in SIMCA-P version 12.01 (Umetrics, Umea, Sweden). The protein analysis through evolutionary relationships (PANTHER) classification system (www.pantherdb.org accessed on 1 November 2021) was used for gene ontology (GO) analysis to categorize the differentially expressed proteins according to biological processes, cellular components, and molecular functions for annotation [19]. The Kyoto Encyclopedia of Genes and Genomes (KEGG) pathway analysis (https://www.kegg.jp accessed on 14 November 2021) was conducted, and the significance was calculated using the hypergeometric distribution test. The protein–protein interactions (PPI) were predicted using OmicsBean (www.omicsbean.cn accessed on 25 November 2021) to find enriched pathways. The hierarchical clustering heat map of the protein expression pattern was generated using the R programming language for data visualization. The top 100 EV-protein list was downloaded from Vesiclepedia (http://www.microvesicles.org accessed on 1 December 2021), a manually curated compendium of different classes of EV molecular data.

3. Results

3.1. Overview of the Milk Derived EV-Proteins

A total of 488 qualitative proteins and 469 quantitative proteins were identified by iTRAQ, with a false discovery rate of <1%. Of the 469 identified proteins, 467 were from unique genes. Supplement Figure S1 shows the validity of the iTRAQ data using Western blotting confirmation. Table 2 summarizes the distributions of all of the unique proteins over biological functions. Cellular process (44.30%), localization (19.10%), and metabolic process (18.00%) were the top three dominant groups of all of the identified proteins. Ten percent of the proteins were involved in a response to a stimulus. In addition, the proteins related to immune system processes accounted for about 5%.
The list of the top 100 proteins that were often identified in EVs, independent of species and body fluids, was downloaded from Vesiclepedia and compared with our study. The classification of bovine milk EV proteins included in the top 100 list was conducted by PANTHER GO-slim, as shown in Table 3. Of the 469 quantitative proteins found in this study, 57 proteins were in the top 100 list, with 30 of the 57 belonging to 13 function categories. All types of enzymes and enzyme modulators totally accounted for about 60% of the 57 proteins. In addition, cytoskeletal proteins and traffic-related proteins also accounted for about 10 percent of the EV proteins, respectively. Notably, F1N647 belonged to hydrolase, oxidoreductase, transferase, and defense/immunity protein at the same time. P63103 belonged to enzyme modulator, chaperone, hydrolase, and nucleic acid binding at the same time. Similarly, Q2UVX4, Q3SYU2, and Q7SIH1 not only appeared in enzyme modulators but also in hydrolase, nucleic acid binding, transferase and defense/immunity protein. Both P11017 and P62871 belonged to the enzyme modulator and hydrolase classifications.

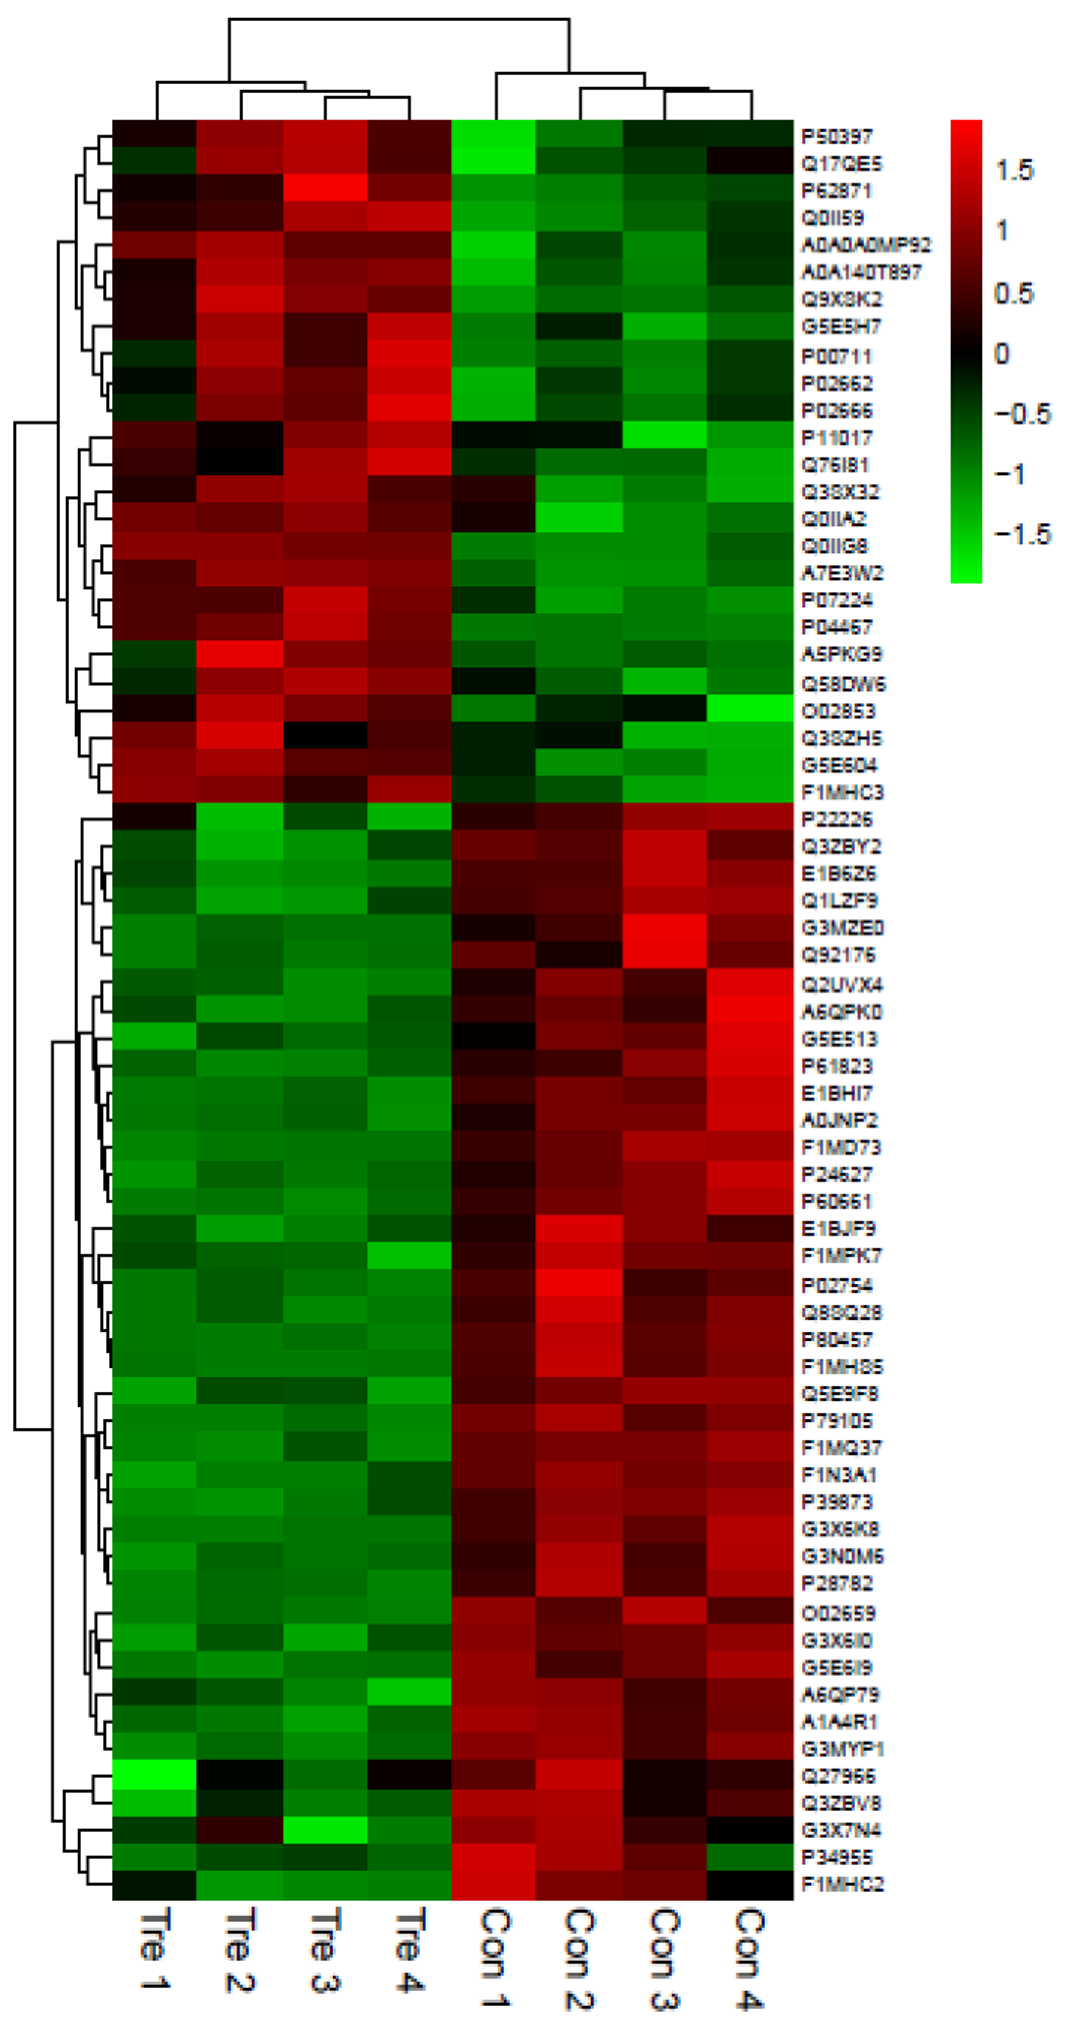
3.2. Statistical Analysis of the Differentially Expressed Proteins

PCA analysis based on the quantitative iTRAQ-expressed proteins is shown in Supplement Figure S2. Each point on the score plot represented the protein profiling of each individual quantified by the iTRAQ proteomic method. The second principal component (t2) accounted for 15.8% of the variation, separating some samples from one another in the same regions. Notably, the first principal component (t1) explained 37.3% of the variation, clearly dividing the samples into two clusters. Overall, the variables of the identified cow milk EV proteins were separated and recognized on the PCA-X axis. The 423 confident proteins from all of the identified proteins were screened based on the following criteria: Score Sequest HT > 0, unique peptide ≥ 1, with the blank values removed. Proteins with a fold change of >1.2 or a fold change of <5/6 and a p-value of <0.05 were regarded as significantly different proteins. There were 65 differently expressed proteins between the two groups, with 25 up-regulated and 40 down-regulated. Figure 1 shows the hierarchical clustering of the 65 quantified differentially expressed proteins responding to the NFFS diets. The cows in the same group showed similar protein expression patterns. The 65 differential proteins could clearly divide all of the samples into two categories.

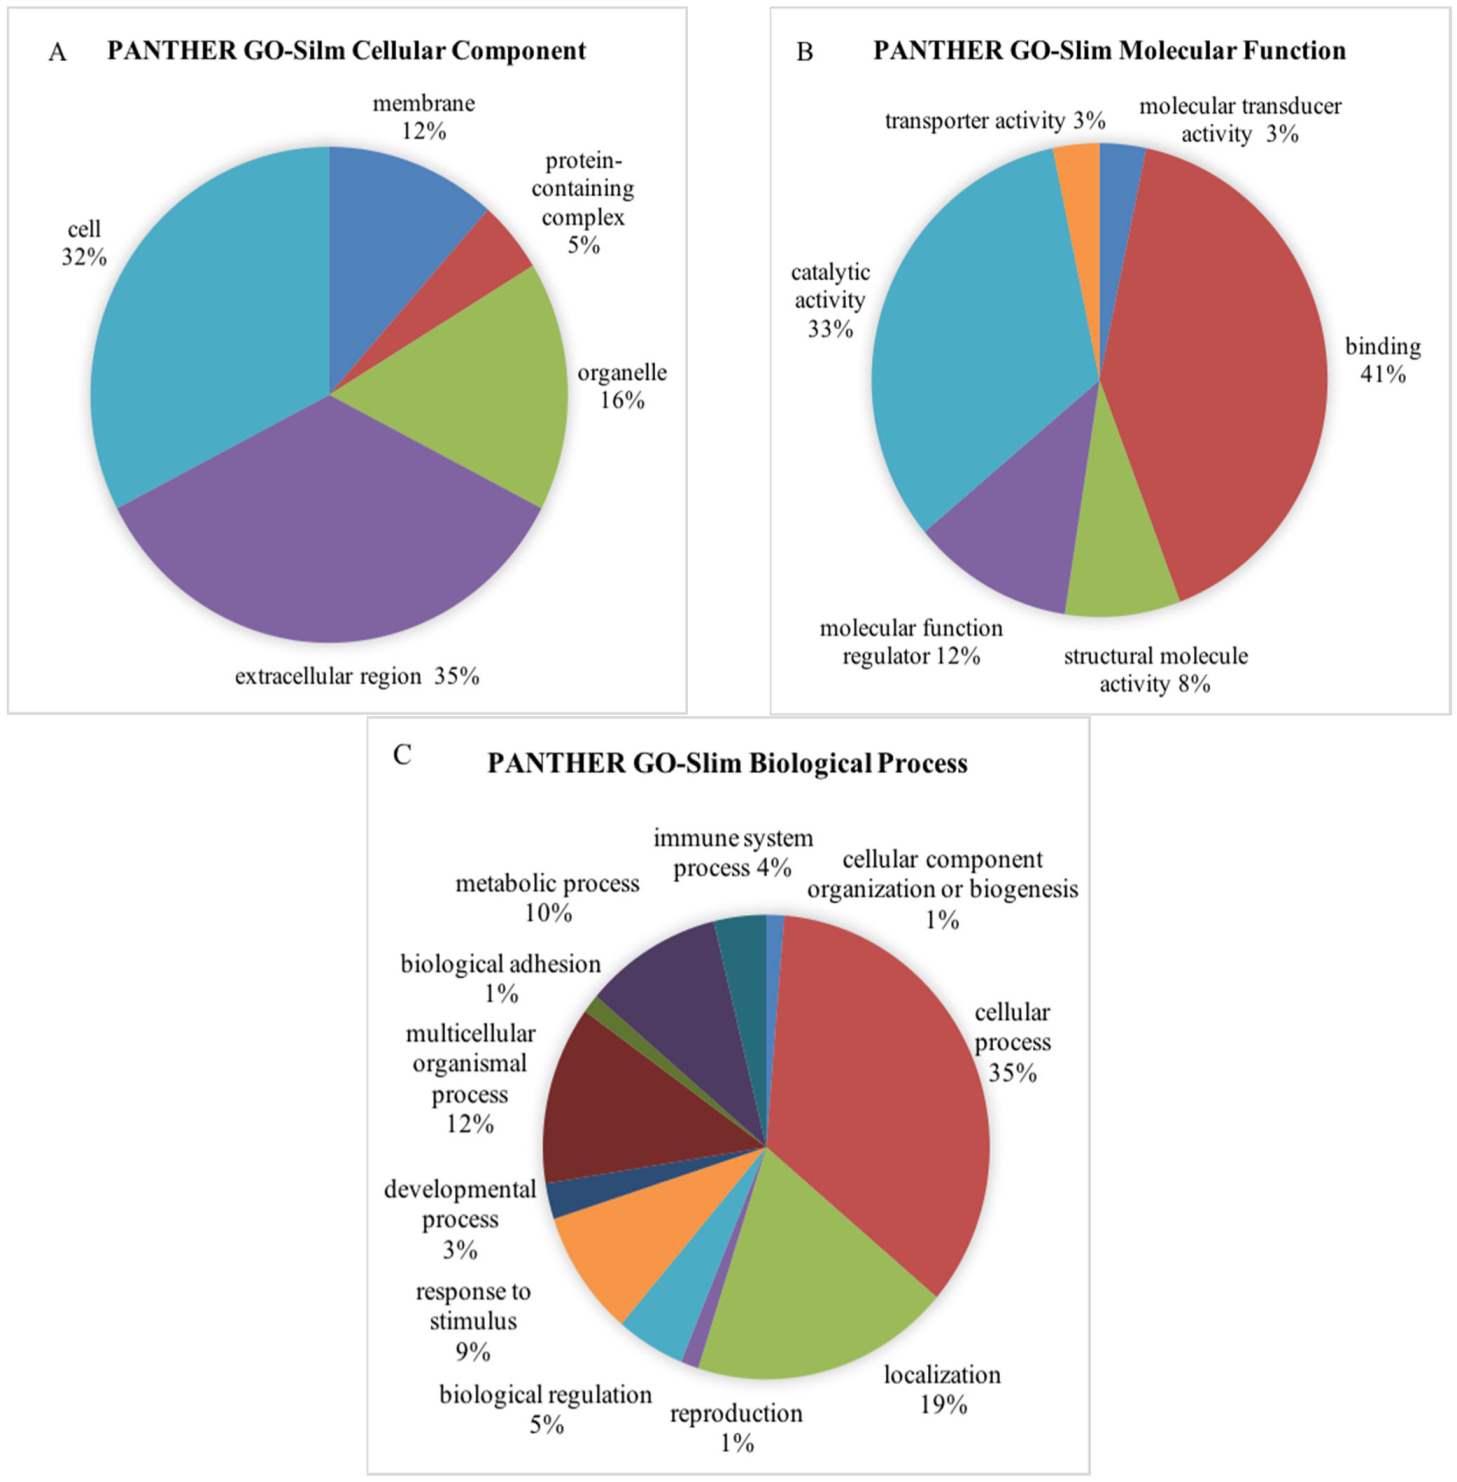
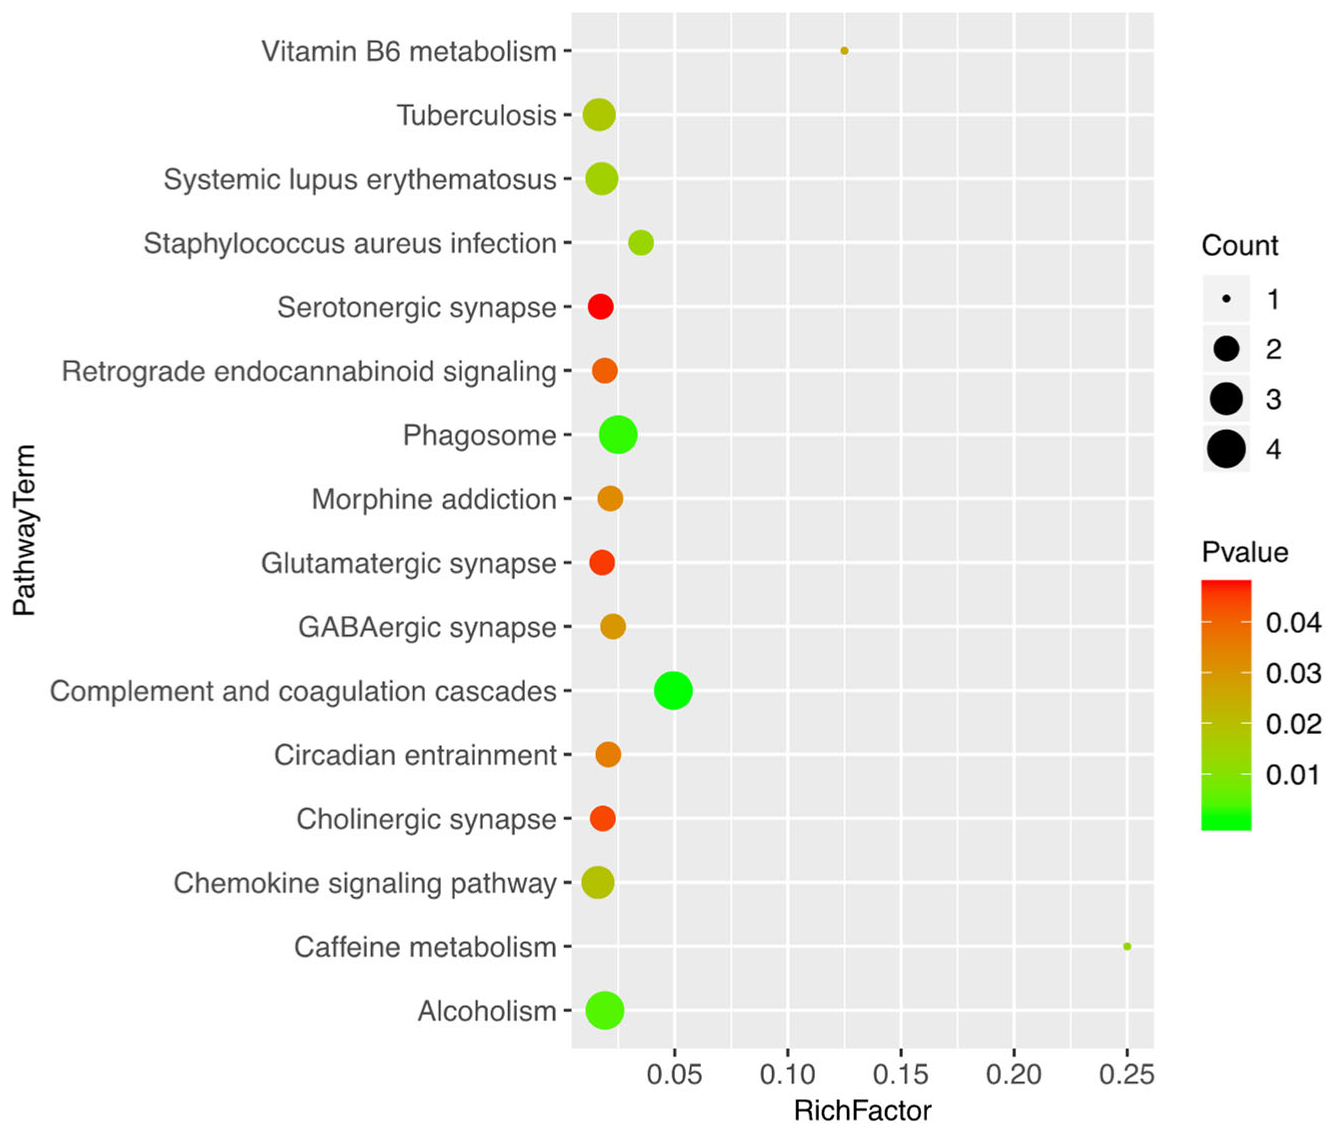
3.3. Bioinformatics Analysis of the Differentially Expressed Proteins

Figure 2 summarizes the GO annotation of the differentially expressed proteins over cellular components, molecular functions, and biological processes. Figure 2A reveals that the extracellular region, organelle, and membrane component accounted for 35%, 16%, and 12% of the cellular component, respectively, which were closely related to the location and biogenesis of EVs. Figure 2B shows that the most prevalent molecular function was binding (41%), with catalytic activity ranking second (33%). Furthermore, the molecular function regulator took up 12%. Figure 2C shows that the biological processes were mostly distributed in cellular processes (35%), localization (19%), multicellular organismal processes (12%), metabolic processes (10%), and response to stimulus (9%). Figure 3 shows the KEGG pathway analysis of the differentially expressed proteins. Note that many differentially expressed proteins enriched in complement and coagulation cascades, phagosome, Staphylococcus aureus infection, and chemokine signaling pathway, meaning that NFFS diets intervened in the milk immune components. Moreover, the differentially expressed proteins involved in GABAergic synapse, cholinergic synapse, glutamatergic synapse, serotonergic synapse, and dopaminergic synapse. In addition, the differentially expressed proteins also enriched caffeine metabolism, vitamin B6 metabolism, the renin–angiotensin system, and vascular smooth muscle contraction.

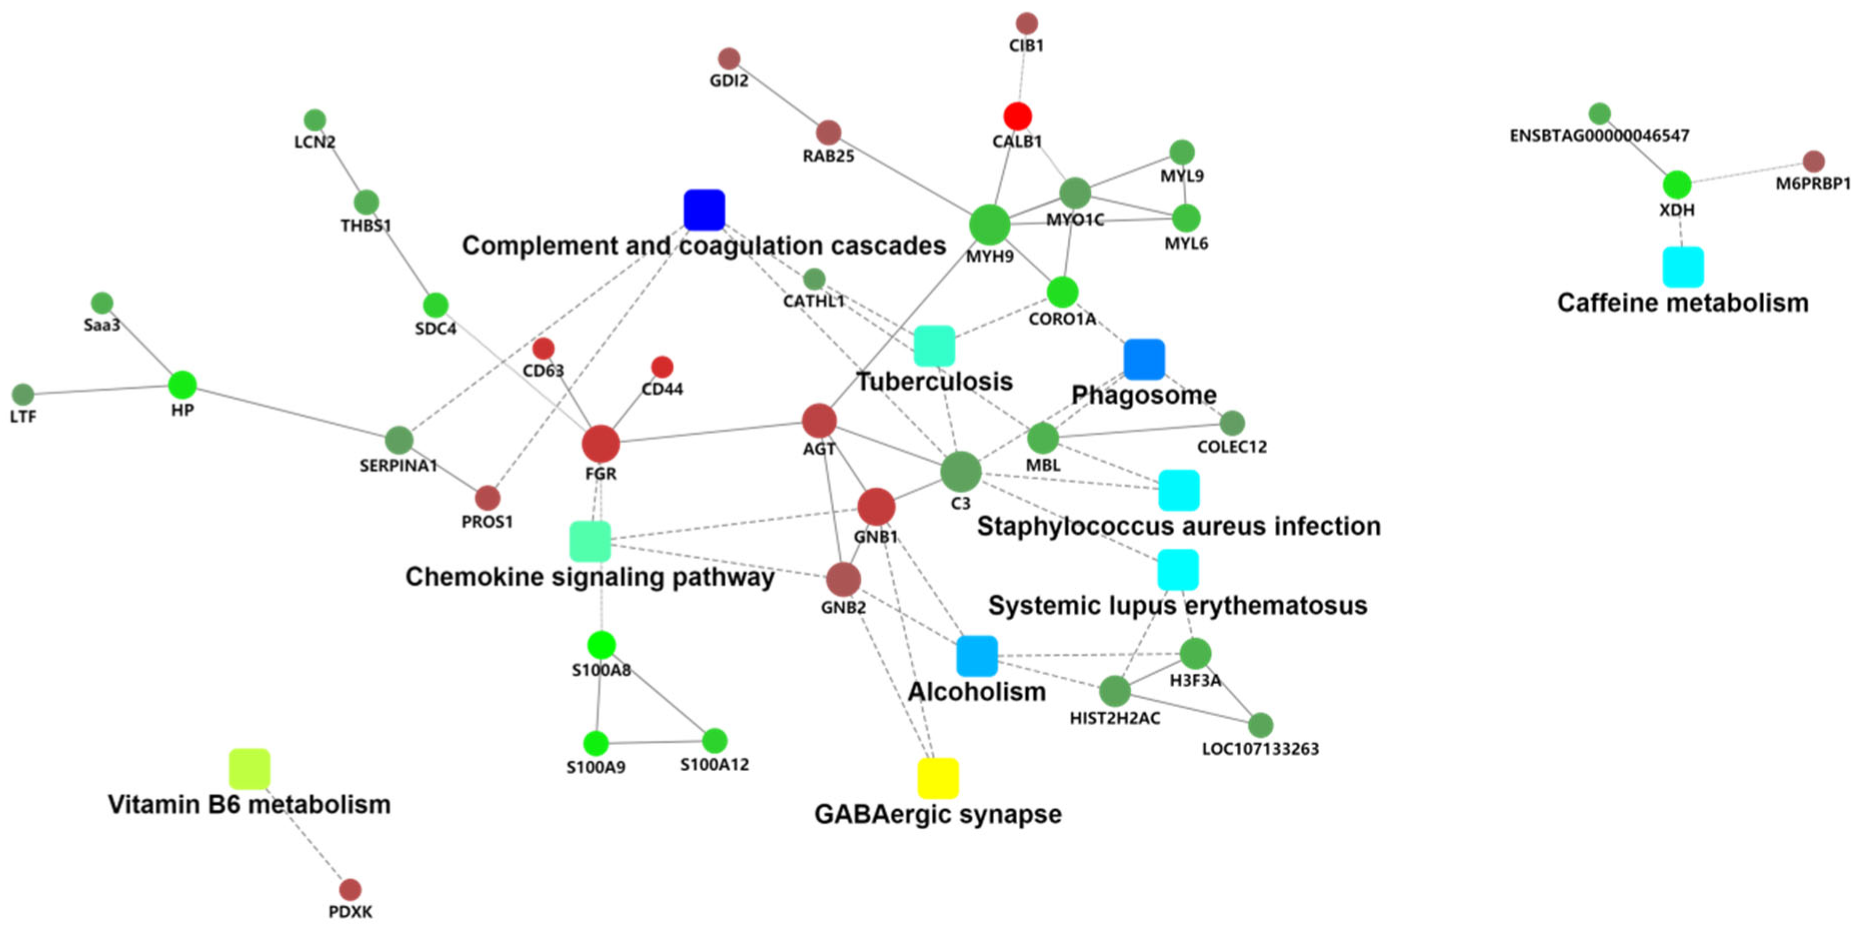
3.4. PPI Analysis of the Differentially Expressed Proteins

Figure 4 shows the PPI analysis of the identified differentially expressed proteins by Omics Bean. The PPI analysis combined the fold change of the proteins, protein–protein interactions, and KEGG enrichments to comprehensively present the protein information [20]. In total, we identified 81 proteins that were involved in the complement and coagulation cascade pathways. Out of which, C3 (complement C3), MBL (mannose-binding protein C precursor), and SERPINA1 (alpha-1-antiproteinase precursor) were down-regulated, whereas PROS1 (vitamin K-dependent protein S precursor) was up-regulated. Notably, differentially-expressed C3 participated in multiple identified biological processes, such as complement and coagulation cascades, phagosome, Tuberculosis, and Staphylococcus aureus infection in this study. In addition, GNB1 (guanine nucleotide-binding protein G(I)/G(S)/G(T) Subunit Beta-1) is also associated with several enriched biological processes, such as the chemokine signaling pathway, retrograde endocannabinoid signaling, GABAergic synapse, cholinergic synapse, glutamatergic synapse, and serotonergic synapse. The up-regulated angiotensinogen (AGT) could interact with C3, GNB1, GNB2, tyrosine–protein kinase (FGR), and myosin-9 (MYH9), regulating GABAergic synapse, complement and coagulation cascades, phagosome, Staphylococcus aureus infection, and the chemokine signaling pathway.

4. Discussion

The high-fiber byproducts of the crops, such as soybean hull, wheat bran, rice husk, and other particular fractions of plants, were normally disposable and thought to be of little value. The increase in land use, tighter food supplies, and the higher prices of cereal grain resulted in the higher costs of cattle feeding. Therefore, it is wise and common practice to incorporate feedstuffs, namely NFFS, into the diets of cattle [21]. Dann et al. showed that NFFS diets did not affect the DMI, energy balance, milk yield, body weight, body condition score, and serum content of the non-esterified fatty acids of dairy cows, indicating that proportionate NFFS utilization would not compromise the metabolism or performance of cattle [22]. Moreover, Ertl et al. proved that feedstuffs could enhance the feed conversion ratio of energy and protein in dairy cow diets [23]. In this study, we partly replaced alfalfa hay and corn silage with whole cotton seed and soybean hull, and the NFFS diets did not compromise the productivity of cattle in a month. The dry matter intake, rumen pH, milk yield, and milk composition (fat, protein, lactose, total solids, and solids-not fat) of dairy cows showed no significant difference in response to the diets. However, NFFS diets could increase the milk EV particle concentration and change the miRNA expression [15]. This study found that milk EV proteins were also affected by NFFS diets. We previously demonstrated that NFFS diets could shift the rumen hydrogen metabolism from methanogenesis to propionate production by intervening in the bacterial community [14]. Therefore, we speculate the changes in the milk EV proteins might probably be due to the shift in the rumen fermentation model; however, the underlying mechanisms need more studies. Milk bioactive proteins could protect the newborns against infection, ward off inflammation, spur immune system and organ development, and shape the neonatal microbiome [2]. Wrapped by natural lipid bilayers, cargos in EVs were protected against enzymatic degradation [24]. It was reported breast milk showed higher total EV-RNA concentration than plasma, saliva, seminal fluid, tears, and urine, implying a higher abundance of milk EVs than other body fluids [25]. Thus, milk EVs have been proposed as relatively stable food bioactive compounds in recent years [26], and EV proteins were indispensable components of the cargo.
It was reported that milk EV-protein biogenesis was dynamic and varied within species, stage of lactation, and health status of the udder [27,28,29]. A total of 2971 proteins were identified in cow milk whey, fat globule membranes, and exosomes from healthy and Staphylococcus aureus-infected cows using iTRAQ [29]. Another previous study quantified 920 milk exosome-proteins from humans and cows across different lactation phases (colostrum and mature milk), with 575 differentially expressed proteins by iTRAQ [27]. This study explored the effects of maternal diets on the biogenesis of cow milk EV-proteins. We identified about 500 proteins of milk EV in eight mid-lactating Holstein cows fed different diets by proteome. Zhang et al. identified 229 proteins in cow milk over a complete lactation by proteome [30]. A total of 293 unique gene products were reported by using the ion-exchange-based protein fractionation proteome method in cow milk whey [31]. Previous studies and our results show that EVs contain a large variety of bioactive proteins, independent of general milk proteins, even though they account for only a small fraction of milk [32]. Moreover, Chen et al. identified 639 proteins from porcine milk exosomes and found that about 3% of porcine milk exosome-proteins participated in immunity and disease-related pathways [33]. We found that about 5% of cow milk EV proteins participated in immune system processes. In addition, previous studies also found that immune-related EV proteins existed in both humans and cows [27,34]. In conclusion, immune components might be vital parts of the small membrane vesicles, though with variable proportions in different species [28,35]. Cellular process, localization, and metabolic process were the top three dominant groups of biological functions in milk EV proteins in our study. In contrast, Zhang et al. found that enzymes, immune-related proteins, and transport proteins were the three dominant groups in cow milk proteome [30]. The widely divergent results indicated EV-protein compositions were independent of casein-based milk proteins, implying their potential special functions.
It was conceivable, naturally, that the characteristic functions of milk EV were attributed to their specific sorted proteins. Generally, EVs were highly abundant in cytoskeletal-, cytosolic-, heat shock- and plasma membrane proteins, as well as vesicle trafficking-related proteins, whereas intracellular organelle proteins were less abundant [36]. We compared the milk EV-proteins in our study with the top 100 EV-proteins previously identified in different species and body fluids. More than 10 percent of the milk EV proteins, such as enzymes, cytoskeletons, chaperones, and traffic proteins, were listed in the top 100 proteins, indicating that these proteins might be related to the biogenesis, structure, and trafficking of EVs, independent of species and cell sources [36]. Furthermore, the remaining 90 percent of the proteins were distinguished from the cow milk EVs with other species and cell sources.
Sixty-five milk EV-proteins, taking up 14% of the total, were differentially expressed in response to different diets in our study. GO analysis revealed that the extracellular region, organelle, and membrane component altogether accounted for more than 60% of the cellular component, which was related to the biogenesis of EVs. The most prevalent molecular function was binding in response to NEES diets. Similarly, Yang et al. showed that binding was the most significant differentially expressed molecular function in cow and human milk in different lactation stages [27]. Thus, binding could react to species, lactation stages, and diets, implying its higher activity responding to physiological change and stimulus. Moreover, the biological process of the changed proteins was mostly distributed in cellular processes, localization, and multicellular organismal processes in our study. Compared with the normal cow milk exosome proteome study [37], in which cellular processes, metabolic processes, and biological regulation held about 65% proteins, we suspected that milk EV-protein sorting changed in response to different dietary conditions. Above all, although much research has proved that different diets had no effect on ruminant milk protein yield [13,21], our study, which demonstrates the effects of dietary factors on milk protein composition, cannot be ignored.
We identified more than 80 proteins involved in the complement and coagulation cascade pathways in our study. Of the 65 differentially expressed proteins were C3, MBL, SERPINA1, GNB1, and PROS1, which participated in various immune-related processes, including complement and coagulation cascades, the chemokine signaling pathway, phagosome, and bacterial infections. C3 was a functional hub in innate immunity and played a particularly versatile role in the defense system by maintaining the cascade alert, converging lots of activation pathways, fueling the amplification of complement response, exerting direct effector functions, and coordinating downstream immune responses [38]. Belonging to the collectin family, MBL was a protein of the innate immune system and was able to recognize and bind a variety of pathogens (fungi, bacteria, viruses, and parasites), providing protection for the host against microbial invasion [39]. MBL could activate complement cascades via the antibody-independent pathway by the interaction of its high-ordered oligomeric structure and MBL-associated serine proteases [40]. PS could bond with C4BP, an important regulator of the explosive complement system, and function in the innate immune system by the C4BP-protein S complex [41]. The differentially expressed complement cascade-related proteins in this study indicated the changes in the milk EV proteins in the immune function in response to switching diets. Moreover, it has been confirmed that the intestinal transport of cow milk EVs in humans was mediated by endocytosis [42], and the protected cargos in EVs could avoid degradation and be directed to functioning target organs [11,43]. Therefore, altered milk EV proteins might affect the health of humans and calves, especially the immune system.

5. Conclusions

The milk EV protein proteome in this study provides new information on milk protein composition and reveals the potential physiological significance of EV proteins for humans and calves, especially in immunity. At present, there are few studies on the milk proteome responding to different diets, and we find NFFS diets can influence cow milk protein profile in EVs.

Supplementary Materials

The following supporting information can be downloaded at: https://www.mdpi.com/article/10.3390/agriculture12081234/s1, Figure S1: The protein expression levels of GNB1 and H3 by western blotting vs iTRAQ data in control and treated group; Figure S2: The principal component analysis based on quantitative iTRAQ expressed proteins.

Author Contributions

Conceptualization, S.Q. and C.D.; Data curation, S.Q.; Formal analysis, S.Q. and C.D.; Funding acquisition, B.X.; Methodology, S.Q., X.N. and K.W.; Project administration, X.N. and B.X.; Software, S.Q.; Supervision, X.N.; Visualization, B.X.; Writing–original draft, S.Q. and C.D.; Writing–review & editing, B.X. All authors have read and agreed to the published version of the manuscript.

Funding

This work was funded by National Key R&D Program of China, grant number 2017YFD0701604; Beijing Dairy Industry Innovation Team, grant number bjcystx-ny-1; the Science and Technology Innovation Project of Institute of Animal Sciences, grant number cxgc-ias-09-1; Open Fund of Tianjin Key Laboratory of Agricultural Animal Breeding and Healthy Husbandry, grant number 2021zdkf04.

Institutional Review Board Statement

The study was conducted in accordance with the Directions for Caring of Experimental Animals from the Ministry of Science and Technology, China ([2006] no. 398), and approved by the Chinese Academy of Agricultural Sciences Animal Care and Use Committee (Beijing, China), and the protocol code was IAS2021-14.

Informed Consent Statement

Not applicable.

Data Availability Statement

Data are available from the authors upon reasonable request.

Acknowledgments

The studies were supported by State Key Laboratory of Animal Nutrition, Institute of Animal Science, Chinese Academy of Agriculture Sciences.

Conflicts of Interest

All the authors declare no conflict of interest.

Abbreviations

NFFSNon-forage fiber sources
EVExtracellular vesicle
ESCRTEndosomal complex required for transport
iTRAQIsobaric tags for relative and absolute quantification
TMRTotal mixed rations
SDS-PAGEsodium dodecyl sulfate polyacrylamide gel electrophoresis
PCAPrincipal component analysis
KEGGKyoto encyclopedia of genes and genomes
GOGene ontology
MBLMannose-binding protein C precursor
SERPINA1Alpha-1-antiproteinase precursor
PROS1Vitamin K-dependent protein S precursor
FGRTyrosine-protein kinase
MYH9myosin-9

References

  1. Pereira, P.C. Milk nutritional composition and its role in human health. Nutrition 2014, 30, 619–627. [Google Scholar] [CrossRef] [PubMed]
  2. Trisha, G. Nature’s first functional food. Science 2014, 345, 747–749. [Google Scholar]
  3. Korhonen, H.; Marnila, P.; Gill, H.S. Bovine milk antibodies for health. Br. J. Nutr. 2000, 84, 135–146. [Google Scholar] [CrossRef]
  4. Haug, A.; Høstmark, A.T.; Harstad, O.M. Bovine milk in human nutrition—A review. Lipids Health Dis. 2007, 6, 25. [Google Scholar] [CrossRef] [PubMed]
  5. Lönnerdal, B. Human milk proteins: Key components for the biological activity of human milk. Single Mol. Single Cell Seq. 2004, 554, 11–25. [Google Scholar]
  6. Goldman, A.S.; Chheda, S.; Garofalo, R.; Schmalstieg, F.C. Cytokines in human milk: Properties and potential effects upon the mammary gland and the neonate. J. Mammary Gland Biol. Neoplasia 1996, 1, 251–258. [Google Scholar] [CrossRef]
  7. Ballard, O.; Morrow, A.L. Human Milk Composition: Nutrients and Bioactive Factors. Pediatr. Clin. N. Am. 2013, 60, 49–74. [Google Scholar] [CrossRef]
  8. Jelen, P.; Jelen, P. Handbook of Milk Composition. Food Sci. Technol. Int. 1995, 6, 1223–1224. [Google Scholar] [CrossRef]
  9. Van Herwijnen, M.J.; Zonneveld, M.I.; Goerdayal, S.; Hoen, E.N.N.; Garssen, J.; Stahl, B.; Altelaar, A.M.; Redegeld, F.A.; Wauben, M.H. Comprehensive Proteomic Analysis of Human Milk-derived Extracellular Vesicles Unveils a Novel Functional Proteome Distinct from Other Milk Components. Mol. Cell. Proteom. 2016, 15, 3412–3423. [Google Scholar] [CrossRef]
  10. Samanta, S.; Rajasingh, S.; Drosos, N.; Zhou, Z.; Dawn, B.; Rajasingh, J. Exosomes: New molecular targets of diseases. Acta Pharmacol. Sin. 2017, 39, 501–513. [Google Scholar] [CrossRef]
  11. Zempleni, J.; Aguilar-Lozano, A.; Sadri, M.; Sukreet, S.; Manca, S.; Wu, D.; Zhou, F.; Mutai, E. Biological Activities of Extracellular Vesicles and Their Cargos from Bovine and Human Milk in Humans and Implications for Infants. J. Nutr. 2016, 147, 3–10. [Google Scholar] [CrossRef] [PubMed]
  12. Raimondo, F.; Morosi, L.; Chinello, C.; Magni, F.; Pitto, M. Advances in membranous vesicle and exosome proteomics improving biological understanding and biomarker discovery. Proteomics 2011, 11, 709–720. [Google Scholar] [CrossRef] [PubMed]
  13. Bradford, B.; Mullins, C. Invited review: Strategies for promoting productivity and health of dairy cattle by feeding nonforage fiber sources. J. Dairy Sci. 2012, 95, 4735–4746. [Google Scholar] [CrossRef] [PubMed]
  14. Wang, K.; Nan, X.; Chu, K.; Tong, J.; Yang, L.; Zheng, S.; Zhao, G.; Jiang, L.; Xiong, B. Shifts of Hydrogen Metabolism from Methanogenesis to Propionate Production in Response to Replacement of Forage Fiber with Non-forage Fiber Sources in Diets in vitro. Front. Microbiol. 2018, 9, 2764. [Google Scholar] [CrossRef]
  15. Quan, S.-Y.; Nan, X.-M.; Wang, K.; Zhao, Y.-G.; Jiang, L.-S.; Yao, J.-H.; Xiong, B.-H. Replacement of forage fiber with non-forage fiber sources in dairy cow diets changes milk extracellular vesicle-miRNA expression. Food Funct. 2020, 11, 2154–2162. [Google Scholar] [CrossRef] [PubMed]
  16. Quan, S.; Nan, X.; Wang, K.; Jiang, L.; Yao, J.; Xiong, B. Different Diets Change the Expression of Bovine Serum Extracellular Vesicle-miRNAs. Animals 2019, 9, 1137. [Google Scholar] [CrossRef]
  17. Committee of Animal Nutrition. Nutrient Requirements of Dairy Cattle; National Academy of Sciences: Washington, DC, USA, 2001. [Google Scholar]
  18. Wiśniewski, J.R.; Zougman, A.; Nagaraj, N.; Mann, M. Universal sample preparation method for proteome analysis. Nat. Methods 2009, 6, 359–362. [Google Scholar] [CrossRef]
  19. Mi, H.; Muruganujan, A.; Ebert, D.; Huang, X.; Thomas, P.D. PANTHER version 14: More genomes, a new PANTHER GO-slim and improvements in enrichment analysis tools. Nucleic Acids Res. 2018, 47, D419–D426. [Google Scholar] [CrossRef]
  20. Sun, N.; Sun, W.; Li, S.; Yang, J.; Yang, L.; Quan, G.; Gao, X.; Wang, Z.; Cheng, X.; Li, Z.; et al. Proteomics Analysis of Cellular Proteins Co-Immunoprecipitated with Nucleoprotein of Influenza A Virus (H7N9). Int. J. Mol. Sci. 2015, 16, 25982–25998. [Google Scholar] [CrossRef]
  21. Ipharraguerre, I.; Clark, J. Soyhulls as an Alternative Feed for Lactating Dairy Cows: A Review. J. Dairy Sci. 2003, 86, 1052–1073. [Google Scholar] [CrossRef]
  22. Dann, H.; Carter, M.; Cotanch, K.; Ballard, C.; Takano, T.; Grant, R. Effect of Partial Replacement of Forage Neutral Detergent Fiber with By-Product Neutral Detergent Fiber in Close-Up Diets on Periparturient Performance of Dairy Cows. J. Dairy Sci. 2007, 90, 1789–1801. [Google Scholar] [CrossRef] [PubMed]
  23. Ertl, P.; Zebeli, Q.; Zollitsch, W.; Knaus, W. Feeding of by-products completely replaced cereals and pulses in dairy cows and enhanced edible feed conversion ratio. J. Dairy Sci. 2015, 98, 1225–1233. [Google Scholar] [CrossRef] [PubMed]
  24. Théry, C.; Zitvogel, L.; Amigorena, S. Exosomes: Composition, biogenesis and function. Nat. Rev. Immunol. 2002, 2, 569–579. [Google Scholar] [CrossRef] [PubMed]
  25. Weber, J.A.; Baxter, D.H.; Zhang, S.; Huang, D.Y.; Huang, K.H.; Lee, M.J.; Galas, D.J.; Wang, K. The MicroRNA Spectrum in 12 Body Fluids. Clin. Chem. 2010, 56, 1733–1741. [Google Scholar] [CrossRef] [PubMed]
  26. Zempleni, J.; Sukreet, S.; Zhou, F.; Wu, D.; Mutai, E. Milk-Derived Exosomes and Metabolic Regulation. Annu. Rev. Anim. Biosci. 2019, 7, 245–262. [Google Scholar] [CrossRef]
  27. Yang, M.; Song, D.; Cao, X.; Wu, R.; Liu, B.; Ye, W.; Wu, J.; Yue, X. Comparative proteomic analysis of milk-derived exosomes in human and bovine colostrum and mature milk samples by iTRAQ-coupled LC-MS/MS. Food Res. Int. 2017, 92, 17–25. [Google Scholar] [CrossRef]
  28. Samuel, M.; Chisanga, D.; Liem, M.; Keerthikumar, S.; Anand, S.; Ang, C.-S.; Adda, C.; Versteegen, E.; Jois, M.; Mathivanan, S. Bovine milk-derived exosomes from colostrum are enriched with proteins implicated in immune response and growth. Sci. Rep. 2017, 7, 5933. [Google Scholar] [CrossRef]
  29. Reinhardt, T.A.; Sacco, R.E.; Nonnecke, B.J.; Lippolis, J.D. Bovine milk proteome: Quantitative changes in normal milk exosomes, milk fat globule membranes and whey proteomes resulting from Staphylococcus aureus mastitis. J. Proteom. 2013, 82, 141–154. [Google Scholar] [CrossRef]
  30. Zhang, L.; Boeren, S.; Hageman, J.A.; Van Hooijdonk, T.; Vervoort, J.; Hettinga, K. Perspective on calf and mammary gland development through changes in the bovine milk proteome over a complete lactation. J. Dairy Sci. 2015, 98, 5362–5373. [Google Scholar] [CrossRef]
  31. Le, A.; Barton, L.D.; Sanders, J.T.; Zhang, Q. Exploration of Bovine Milk Proteome in Colostral and Mature Whey Using an Ion-Exchange Approach. J. Proteome Res. 2010, 10, 692–704. [Google Scholar] [CrossRef]
  32. De la Torre Gomez, C.; Goreham, R.V.; Bech-Serra, J.J.; Nann, T.; Kussmann, M. “Exosomics”—A Review of Biophysics, Biology and Biochemistry of Exosomes with a Focus on Human Breast Milk. Front. Genet. 2018, 9, 92. [Google Scholar] [CrossRef] [PubMed]
  33. Chen, T.; Xi, Q.-Y.; Sun, J.-J.; Ye, R.-S.; Cheng, X.; Sun, R.-P.; Wang, S.-B.; Shu, G.; Wang, L.-N.; Zhu, X.-T.; et al. Revelation of mRNAs and proteins in porcine milk exosomes by transcriptomic and proteomic analysis. BMC Veter-Res. 2017, 13, 101. [Google Scholar] [CrossRef] [PubMed]
  34. Zhang, L.; Van Dijk, A.D.J.; Hettinga, K. An interactomics overview of the human and bovine milk proteome over lactation. Proteome Sci. 2016, 15, 1–14. [Google Scholar] [CrossRef] [PubMed]
  35. Benmoussa, A.; Ly, S.; Shan, S.T.; Laugier, J.; Boilard, E.; Gilbert, C.; Provost, P. A subset of extracellular vesicles carries the bulk of microRNAs in commercial dairy cow’s milk. J. Extracell. Vesicles 2017, 6, 1401897. [Google Scholar] [CrossRef]
  36. Yáñez-Mó, M.; Siljander, P.R.-M.; Andreu, Z.; Bedina Zavec, A.; Borràs, F.E.; Buzas, E.I.; Buzas, K.; Casal, E.; Cappello, F.; Carvalho, J.; et al. Biological properties of extracellular vesicles and their physiological functions. J. Extracell. Vesicles 2015, 4, 27066. [Google Scholar] [CrossRef]
  37. Mol, P.; Kannegundla, U.; Dey, G.; Gopalakrishnan, L.; Dammalli, M.; Kumar, M.; Patil, A.H.; Basavaraju, M.; Rao, A.; Ramesha, K.P.; et al. Bovine Milk Comparative Proteome Analysis from Early, Mid, and Late Lactation in the Cattle Breed, Malnad Gidda (Bos indicus). OMICS 2018, 22, 223–235. [Google Scholar] [CrossRef]
  38. Ricklin, D.; Reis, E.S.; Mastellos, D.C.; Gros, P.; Lambris, J.D. Complement component C3—The “Swiss Army Knife” of innate immunity and host defense. Immunol. Rev. 2016, 274, 33–58. [Google Scholar] [CrossRef]
  39. Kilpatrick, D. Mannan-binding lectin: Clinical significance and applications. Biochim. Et Biophys. Acta (BBA) Gen. Subj. 2002, 1572, 401–413. [Google Scholar] [CrossRef]
  40. De Pascale, G.; Cutuli, S.L.; Pennisi, M.A.; Antonelli, M. The Role of Mannose-Binding Lectin in Severe Sepsis and Septic Shock. Mediat. Inflamm. 2013, 2013, 625803. [Google Scholar] [CrossRef]
  41. Webb, J.H. Studies on the interaction between vitamin K-dependent protein S and complement regulator C4b-binding protein: Localization of binding sites and identification of a possible function of the complex. Scand. J. Clin. Lab. Investig. 2002, 62, 19–28. [Google Scholar] [CrossRef]
  42. Wolf, T.; Baier, S.R.; Zempleni, J. The Intestinal Transport of Bovine Milk Exosomes Is Mediated by Endocytosis in Human Colon Carcinoma Caco-2 Cells and Rat Small Intestinal IEC-6 Cells. J. Nutr. 2015, 145, 2201–2206. [Google Scholar] [CrossRef] [PubMed]
  43. Izumi, H.; Tsuda, M.; Sato, Y.; Kosaka, N.; Ochiya, T.; Iwamoto, H.; Namba, K.; Takeda, Y. Bovine milk exosomes contain microRNA and mRNA and are taken up by human macrophages. J. Dairy Sci. 2015, 98, 2920–2933. [Google Scholar] [CrossRef] [PubMed]
Figure 1. Hierarchical clustering of differentially expressed proteins responding to different diets. Each grid represented a protein, and protein abundance intensities were represented in red and green for high abundant and low abundant, respectively.
Agriculture 12 01234 g001
Figure 2. PANTHER GO-Slim annotation of the differentially expressed proteins. (A) The PANTHER GO-Slim Cellular Component. (B) The PANTHER GO-Slim Molecular Function. (C) The PANTHER GO-Slim Biological Process.
Agriculture 12 01234 g002
Figure 3. KEGG pathway analysis of the differentially expressed proteins.
Agriculture 12 01234 g003
Figure 4. The protein–protein interaction of differentially expressed proteins by Omics Bean. Dots represented proteins: red for up-regulated proteins and green for down-regulated proteins. Rounded rectangles represented molecular functions, cellular components, biological processes, and signaling pathways, with blue meaning higher significance and yellow meaning lower significance. Rectangle referred to KEGG pathway or biological process, which were colored with gradient color from yellow (smaller p-value) to blue (bigger p-value).
Agriculture 12 01234 g004
Table 1. The TMR diets of control group and treat group.
ItemsExperiment Diet
Control GroupTreat Group
Ingredient, % of DM
Alfalfa hay18.679.70
Corn silage27.3924.88
Steam-flaked corn23.2024.25
Soybean meal8.228.21
Cottonseed meal9.549.54
Beet pulp5.685.68
DDGS3.783.77
Whole cotton seed5.72
Soybean hull4.73
Bergafat T3001.041.04
Premix1.861.84
Chemical composition, % of DM
CP16.0216.34
EE4.205.18
RDP(%CP)58.6156.64
NDF31.0131.84
ADF21.7822.23
Starch25.3525.49
NEL, Mcal/kg1.611.62
TMR: total mixed ration, DDGS: distillers dried grains with solubles, Bergafat T300: asaturated free fatty acid supplement (Berg + Schmidt, Hamburg, Germany), DM: Dry matter, CP: crude protein, EE: ether extract, RDP: rumen degradable protein, NDF: neutral detergent fiber, ADF: acid detergent fiber, NEL: net energy for lactation.
Table 2. Milk extracellular vesicle-proteins related biological functions.
Biological ProcessProcess HitPercentage
Cellular component organization or biogenesis50.84%
Cellular process20734.62%
Localization8914.88%
Reproduction71.17%
Biological regulation6110.20%
Response to stimulus477.86%
Developmental process162.68%
Multicellular organismal process447.36%
Biological adhesion152.51%
Metabolic process8414.05%
Immune system process233.85%
Table 3. Classes of milk extracellular vesicle-proteins included in the top 100 list.
Protein ClassPercentageProtein IDGene NameGene Symbol
Enzyme modulator29.50%P50397Rab GDP dissociation inhibitor betaGDI2
Q3ZCK2RAS-like proto-oncogene ARALA
Q3SYU2Elongation factor 2EEF2
P04896Guanine nucleotide-binding protein G(s) subunit alpha isoforms shortGNAS
P11017Guanine nucleotide-binding protein G(I)/G(S)/G(T) subunit beta-2GNB2
P61585Transforming protein RhoARHOA
P61223Ras-related protein Rap-1bRAP1B
P62998Ras-related C3 botulinum toxin substrate 1RAC1
P68103Elongation factor 1-alpha 1EEF1A1
Q7SIH1Alpha-2-macroglobulinA2M
Q2KJ93Cell division control protein 42 homologsCDC42
Q2UVX4Complement C3C3
P62871Guanine nucleotide-binding protein G(I)/G(S)/G(T) subunit beta-1GNB1
Membrane traffic protein4.50%Q3SZA6Syndecan binding proteinSDCBP
P49951Clathrin heavy chain 1CLTC
Chaperone6.80%P6310314-3-3 protein zeta/deltaYWHAZ
Q3MHL7T-complex protein 1 subunit zetaCCT6A
Q76LV2Heat shock protein HSP 90-alphaHSP90AA1
Hydrolase11.40%Q3SYU2Elongation factor 2EEF2
P11017Guanine nucleotide-binding protein G(I)/G(S)/G(T) subunit beta-2GNB2
P68103Elongation factor 1-alpha 1EEF1A1
P62871Guanine nucleotide-binding protein G(I)/G(S)/G(T) subunit beta-1GNB1
F1N647Fatty acid synthaseFASN
Oxidoreductase9.10%Q5E9B1L-lactate dehydrogenase B chainLDHB
Q5E947Peroxiredoxin-1PRDX1
Q9BGI3Peroxiredoxin-2PRDX2
F1N647Fatty acid synthaseFASN
Lyase2.30%Q9XSJ4Alpha-enolaseENO1
Transfer/carrier protein2.30%A0A140T897Serum albuminALB
Transferase4.50%P50397Rab GDP dissociation inhibitor betaGDI2
F1N647Fatty acid synthaseFASN
Nucleic acid binding6.80%Q3SYU2Elongation factor 2EEF2
G5E6I9Histone H2BLOC107133263
P68103Elongation factor 1-alpha 1EEF1A1
Ligase4.50%A3KN51TSG101 proteinTSG101
F1N647Fatty acid synthaseFASN
Defense/immunity protein4.50%Q7SIH1Alpha-2-macroglobulinA2M
Q2UVX4Complement C3C3
Cytoskeletal protein9.10%P31976EzrinEZR
Q2HJ49MoesinMSN
P60712Actin, cytoplasmic 1ACTB
Q3SYV4Adenylyl cyclase-associated protein 1CAP1
Signaling molecule4.50%Q7SIH1Alpha-2-macroglobulinA2M
Q2UVX4Complement C3C3
Publisher’s Note: MDPI stays neutral with regard to jurisdictional claims in published maps and institutional affiliations.

