1. Introduction
Tomato (
Solanum lycopersicum L.), grown in open fields or greenhouses in various geographical regions, is one of the most consumed vegetables [
1]. Increasing demand for tomatoes has pushed producers towards higher productivity, which significantly contributes to the agricultural economy. The yield productivity mostly depends on morphological developments in plants and the vegetative and generative growing stages [
2]. New methods are needed to identify anomalies and timely intervention to prevent pest infestation and maximize crop yields since manual observation methods are time-consuming and costly in a challenging environment. The difficulties in finding the required workforce for manual measurements of morphological information may suffer from several shortcomings, including low Precision, high labor-intensive tasks, and time-efficiency [
3]. Hence, more sensitive technologies are needed to avoid phenotypical measurement errors.
Artificial intelligence (AI) based autonomous greenhouses make it possible to achieve higher harvest in a short time at a lower cost. Computer vision and related artificial intelligence technology identify and distinguish various parts of the plant from each other and perform autonomous evaluations and many functional analyses such as plant growth, flower formation, and increased flower numbers in terms of phenotypic data acquisition and analysis. [
4,
5]. This innovative technology also enables detecting and eliminating the adverse effects or stress development in plants at an earlier stage to achieve higher yield production and optimizes the number of fertilizers and even agricultural chemicals. Computer vision techniques play an essential role in identifying and classifying plants and evaluating their growth and development [
6,
7,
8]. In addition, AI-aided fast and non-destructive yield detection and counting processes for flower ripped and unripped tomato fruits are crucial for yield prediction. Numerous approaches have been conducted in the literature to achieve higher accuracy in detecting and counting flowers and fruits using images. However, those approaches usually utilize standard computer vision algorithms based on color classification and thresholds to identify vegetables’ color, size, and shape [
9,
10]. Standard computer vision algorithms may not cope with the level of environmental variability commonly found in greenhouses due to objects in different reflectance in non-visible regions [
11]. The counting process can also be performed by Deep Convolutional Neural Networks (CNN), which are increasingly used for image segmentation and classification due to their ability to learn robust discriminants and deal with significant variations [
12]. They require pre-labeled datasets for preprocessing, such as model training and dimension variation, and these are used for image-level classification, disease detection, or floral identification in some studies [
13,
14,
15,
16], as seen in most of the studies.
The advancement in computer vision and AI technology has tremendously minimized object detection processing time. Prior algorithms were used to utilize the classifier and localizers individually to perform detection. In other words, the detection model was utilized at multiple spots and scales on the image, and those areas are considered detection points based on the highest probability score. Even though these algorithms seem efficient, they are not entirely applicable in real time. In contrast, a new technique called the You Only Look Once (YOLO) algorithm [
17] changed this approach significantly due to applying a single neural network to the whole image. This single neuron divides the full image into different sections and predicts each section’s bounding boxes and related probabilities. Since whole processes are made in a single neural network, it is called YOLO. This approach has evolved over the years, and many efficient versions have emerged. In this article, one of the state-of-the-art YOLO algorithms, YOLO V5, is used to detect and count tomato fruits and flowers.
Drone technology has been increasingly used for many studies and applications in the last decade. Drones are indispensable when recording high-resolution images without any restrictions and capturing the desired field of view, even in challenging areas like greenhouses. The sensor fusion technology, including an Inertial Measurement Unit (IMU), GPS, a mechanical gimbal, a distance sensor, and a high-resolution camera, helps the drone locate its position and orientation, which is called geo-referencing. Thus, they can smoothly elevate, balance, and maneuver in the air. The drones are also equipped with high-tech wireless communication technologies that help us to capture videos in real-time using Real-Time Messaging Protocol (RTMP) [
18]. Through RTMP, drones can connect to the local network and be used as a webcam for a trained deep learning model input source. The combination of drones and artificial intelligence has many implementations in agriculture, such as distinguishing the desired plant and its different parts [
19,
20,
21,
22].
In this research, we aimed to detect and count different tomato fruits using deep learning and a deep sort algorithm. Fruit and flower counting has many advantages regarding quantity estimation of yields and taking required measures to achieve higher productivity. For instance, if there is an inconsistency between flower and fruit numbers, indicating a pollination problem, the producer can take the required action accordingly. Moreover, the red tomato counting will help the producer accurately estimate the costs, such as packaging and transportation, before harvesting. In short, the proposed detection and counting system has many improvements in terms of employing an advanced YOLO V5, capturing videos by drone, and usage of a distance filtering algorithm. We have also minimized the cost of high labor-intensive tasks and processing time and avoided low precision errors. Thus, this detection and counting system can be utilized for better crop growth management in greenhouses. The rest of the paper is organized as follows: Materials and methods, results and analysis, discussion, and conclusion.
2. Materials and Methods
Rapid developments in deep learning and high-performance computing have greatly expanded the scope of systems, including video-based object identification and its derivatives [
23,
24,
25,
26]. The state of art video-based object detection and tracking algorithms are utilized in this project, and it aims to accurately track and count different tomato classes. Combinations of multiple object detection models fused with different tracking systems will be applied to achieve the most effective tomato counting system. The difficulties associated with low light settings have been eliminated with different image variations in the resulting model that calculates tomato information and numbers efficiently through computationally rich training and feedback loops. This endeavor intends to achieve high accuracy in flower and fruit counting for greenhouses, gardens, and fields through deep learning algorithms, including YOLOv5 and Deep-SORT.
2.1. Tomato Fruit Growing Conditions
Tomato Seedlings were purchased from the open market and planted 25 cm in rows and 125 cm between rows. The seedlings were irrigated every two days based on soil moisture and the different growth and development stages. In addition, fertilization and hoeing were applied when necessary. The training data set are collected when the greenhouse has three different forms of tomato fruits as red, green, and flower.
2.2. You Only Look Once Version 5 (YOLO V5)
YOLO V5 is one of the states of art object detection algorithms that belongs to the YOLO family. The higher processing speed and accuracy make this machine learning algorithm applicable in real-time applications [
27]. The YOLO V5 architecture comprises the backbone (CSPDarknet), the neck (PANet), and the head (YOLO Layer), as seen in
Figure 1.
The backbone deals with feature extrication for different levels at Cross Stage Partial (CSP) network. Next, the bottleneck formulates and sends the image features to both Neck (PA-Net) and Special Pyramid Pooling (SPP). The Neck contains a series of concatenated BottleNeckCSP and convolution networks. In the last step, the head aggregates the image features using series convolutional networks to process the prediction box and corresponding classes. The localization of prediction boxes is based on an object tracking algorithm that iteratively corrects the position of the bounding boxes [
28]. These processes significantly increase YOLO V5 algorithm efficiency and make it applicable in real-time. YOLO V5 contains 30 different training hyperparameters to train, validate and test the custom data sets. The parameters affecting the accuracy of the model are learning rate, batch size, image size, number of epochs, and Intersection over the Union (IOU) threshold. The learning rate can be considered as a step size to move to the minimum cost for every iteration. The learning rate should be picked carefully to avoid overfitting. The batch size determines the number of images that will be fed to the network as a batch. Therefore, setting a higher batch size will then lead to higher training speeds. It should also be noted that larger batch sizes can end in poor generalization. Image size represents the size of the input network (in our case: 416 pixels), so every image before being fed to the network is resized to 416 × 416. The epoch represents how many times you want to train the full dataset. Lastly, the IOU threshold helps us to determine how close is the estimation is to the ground truth based on lower and upper limits (in our case: 0.1–0.7). The other important factor is the feature visualization through Convolutional Neural Network (CNN). By their nature, CNNs are used to extract features that will play major roles in image recognition. Visualizing the features reveals the shortcomings of the model, which need to be improved.
2.3. Object Tracking
The IOU tracker assumes that each object is tracked per frame with little or no gap between detections. Similarly, the IOU assumes a larger overlap value for intersection over joints when detecting an object in successive frames [
29]. In Equation (1), the calculation of the IOU metric, which forms the basis of this approach, is given.
If the IOU tracker does not meet a certain threshold, it tracks objects by assigning the highest IOU value in Equation (1). Since we aim to track objects in this study, IOU performance can be improved by canceling tracks that do not meet a certain threshold time length and where no detected vehicle exceeds the required IOU threshold. It is important to note that the IOU tracker is highly dependent on how accurately object detection models recognize objects, so the particular focus should be placed on effectively training object detection models. The IOU’s ability to handle frame rates of more than 50,000 fps combined with its low computational cost makes it an incredibly powerful object tracker. The Kalman filter’s predictive ability allows users to skip frames while continuing to follow the object. Skipping frames allows the detector to speed up the process and fewer frames to reduce computational costs. IOU tracking algorithm is represented in Algorithm 1.
2.4. Deep-Sort
Deep-Sort, a deep learning extension of the simple online real-time tracker algorithm, integrates view information with tracking components, making it possible to track multiple objects [
30]. Deep sort uses a combination of Kalman Filter and Hungarian algorithm for tracking. While Kalman filtering is performed in the image area, the Hungarian technique facilitates frame-by-frame data connections using an association measure that calculates bounding box overlap. Once motion and appearance information is obtained, a trained convolutional neural network (CNN) is applied.
| Algorithm 1: IOU Tracking Algorithm |
| 1: function Tracker (detections, , , , ) |
| ⇐detection (dict(class, score, box)) |
| 2: let ← low detection threshold |
| 3: let ← high detection threshold |
| 4: let ← IOU threshold |
| 5: let ← minimum track size in frames |
| ⇐active tracks |
| 6: let ←[] |
| 7: let ←[] |
| ⇐finished tracks |
| 8: for frame, dets in detections do |
| 9: dets ← filter for dets with score ≥ |
| ⇐updated tracks |
| 10: let ←[] |
| 11: for in do |
| 12: if not empty(dets) then |
| 13: , ← find max iou box(tail box(), dets) |
| 14: if ≥
then |
| 15: append new detection(,
) |
| 16: set max score (, box score ()) |
| 17: set class(, box score ()) |
| 18: ← append (,) |
| ⇐remove box from dets |
| 19: remove(dets,) |
| 20: if empty() or is not last() then |
| 21: if get max score () ≥ or size() ≥ then |
| 22: ← append (,) |
| 23: ← new tracks from dets |
| 24: ← + |
| 25: return |
By integrating CNN, the tracker gains greater robustness against object skips and occlusions while retaining the tracker’s ability to execute online quickly and in real-time scenarios. The CNN architecture of the system is shown in
Figure 2. A large residual network with two convolutional layers followed by six Wide Residual Blocks (WRB) is applied. In dense layer 10, a global feature map of dimensionality 128 is computed. Finally, the aggregate and ℓ
2 normalization properties on the unit hypersphere access compatibility with the cosine arrival metric are obtained. The obtained features are used to calculate the minimum cosine separation between tracks and detections. In addition, the Mahalanobis distance is also utilized to detect dissimilarities through cascade matching. Overall, Deep SORT is a highly versatile tracker and can match its performance characteristics with other cutting-edge tracking algorithms.
2.5. Implementation of Proposed Method
The real-time counting model for tomato generative organs is critical in the agricultural production sector since it is directly related to harvest estimation. Manual counting is a highly erroneous and time-consuming procedure. In this research, we have integrated deep learning and a Deep-Sort aided tomato generative organ counting algorithm onto a drone to increase efficiency and minimize production costs. The YOLO V5 deep learning model is trained through an augmented and labeled tomato data set and PyTorch library. The obtained model detects the tomatoes and related classes, which are sent to the deep sort algorithm supported by the Kalman filter. Next, the counting will be performed for every trajectory of a detected tomato, as indicated in
Figure 3. In addition, the drone field of view possesses an entry zone that accepts the tomatoes from north to south which differentiates and counts each tomato based on detected classes as red, green, and flower. The drone also uses size filtering to avoid faulty counting from other aisles. Algorithm 2 presents how inspection and counting work. The object detectors and tracking algorithms used in this study are explained in more detail in the following sections.
| Algorithm 2: Inspection and Counting Algorithm using distance filtering |
| 1: Define Deep Sort Configurations as cfg |
| 2: Initialize Deep-Sort(Deep-Sort model, cfg) |
| 3: Initialize Device(GPU) |
| 4: YOLO V5 Model = Detect Multi Backend (V5 model, device = GPU, dnn = opt.dnn) |
| 5: Select Device Source(Drone Camera) |
| 6: Img = imread(Drone Camera) |
| 7: Pred = model(img, augment = opt.augment, visualize = visualize) |
| 8: Process detection |
| 9: for i, det in enumerate(Pred): # detections per image |
| 10: find(detections) |
| 11: confs, clss, xywhs = detections |
| 12: Pass detection to Deep-Sort |
| 13: outputs = Deep-Sort Update (xywhs.cpu(), confs.cpu(), clss.cpu(), img) |
| 14: Draw boxes for visualization |
| 15: Drone distance = 25 (cm) # Drone distance to tomato isle. |
| 16: Size Filter = Max height, Max width. |
| 17: if len(outputs) > 0: |
| 18: for j, (output, conf) in enumerate(zip(outputs, confs)): |
| 19: c = int(cls) # integer class |
| 20: find yd, xd |
| 21: if yd × xd > Size Filter: |
| 22: if c == 0:#class 0 is flower |
| 23: if c == 1:#class 1 is green tomato |
| 24: if c == 2:#class 2 is red tomato |
| 25: Stream results |
| 26: Save results (image with detections) |
2.6. Setting Target Metric2.6 Performans and Evaluation
In building a deep learning model, assessing object detection and tracking accuracy is essential to determine the best model. The YOLO V5 model performance depends on various parameters such as Precision, Recall, F1 score, and mAP. The precision is computed by dividing the true positive prediction by whole predictions, whether true or false, while the recall values evaluate the model performance in detecting only positive samples. F1 score provides insight for determining the optimized confidence level (0–1), which will evenly distribute the weights on the precision and recall for the given model. Another performance metric, the PR curve (precision and recall), indicates the trade-off between precision and recall for different thresholds. The mAP, Mean Average Precision, provides the summary of the model. Precision, recall, F1 score, and mAP can be calculated through Equations (2)–(5).
where: AP is
n and i are the number of classes and thresholds, respectively.
These metrics aim to achieve the desired accuracy rate in tomato detection and counting using the YOLO V5 algorithm. Since accuracy is essential for counting fruits, we will also calculate the Mean Absolute Percentage Error (MAPE) between Manuel Counting and AI-Drone counting, as indicated in Equation (6).
2.7. Equipment Setup
Counting tomatoes through deep learning will be carried out in a greenhouse having straight corridors in a specific order, as shown in
Figure 4. The gaps in the corridors are set to 80 cm to provide enough space for maintaining the maneuverability of the DJI Spark Drone. The drone is configured for transmitting the video frames to the HP omen laptop with a Gforce-1050Ti GPU (Santa Clara, CA, USA) that allows us to run multiple neural networks in parallel since applications require higher computation work, such as image classification object detection, segmentation, and speech processing.
2.8. Greenhouse Data Collection
RGB video frames were acquired through the DJI Spark drone having a 12 MP camera in the tomato greenhouse under daylight. The counting path of the tomato is predefined, as indicated in
Figure 4. The scanning and video capturing process is performed by directing the camera to the tomatoes in the greenhouse of Şırnak University. The details about the video specifications are given in
Table 1 and
Figure 5.
RGB video frames are converted into image frames using the OpenCV library with a half-second delay between each image. Since the frame rate of the video used in this study is 30 FPS, one image frame was taken every 15 frames. In the next step, the non-tomato fruit images were extracted from the dataset, resulting in 2329 with 1920 × 1080 resolution. Then, the augmentation method was used to increase the dataset.
2.9. Labeling and Data Augmentation
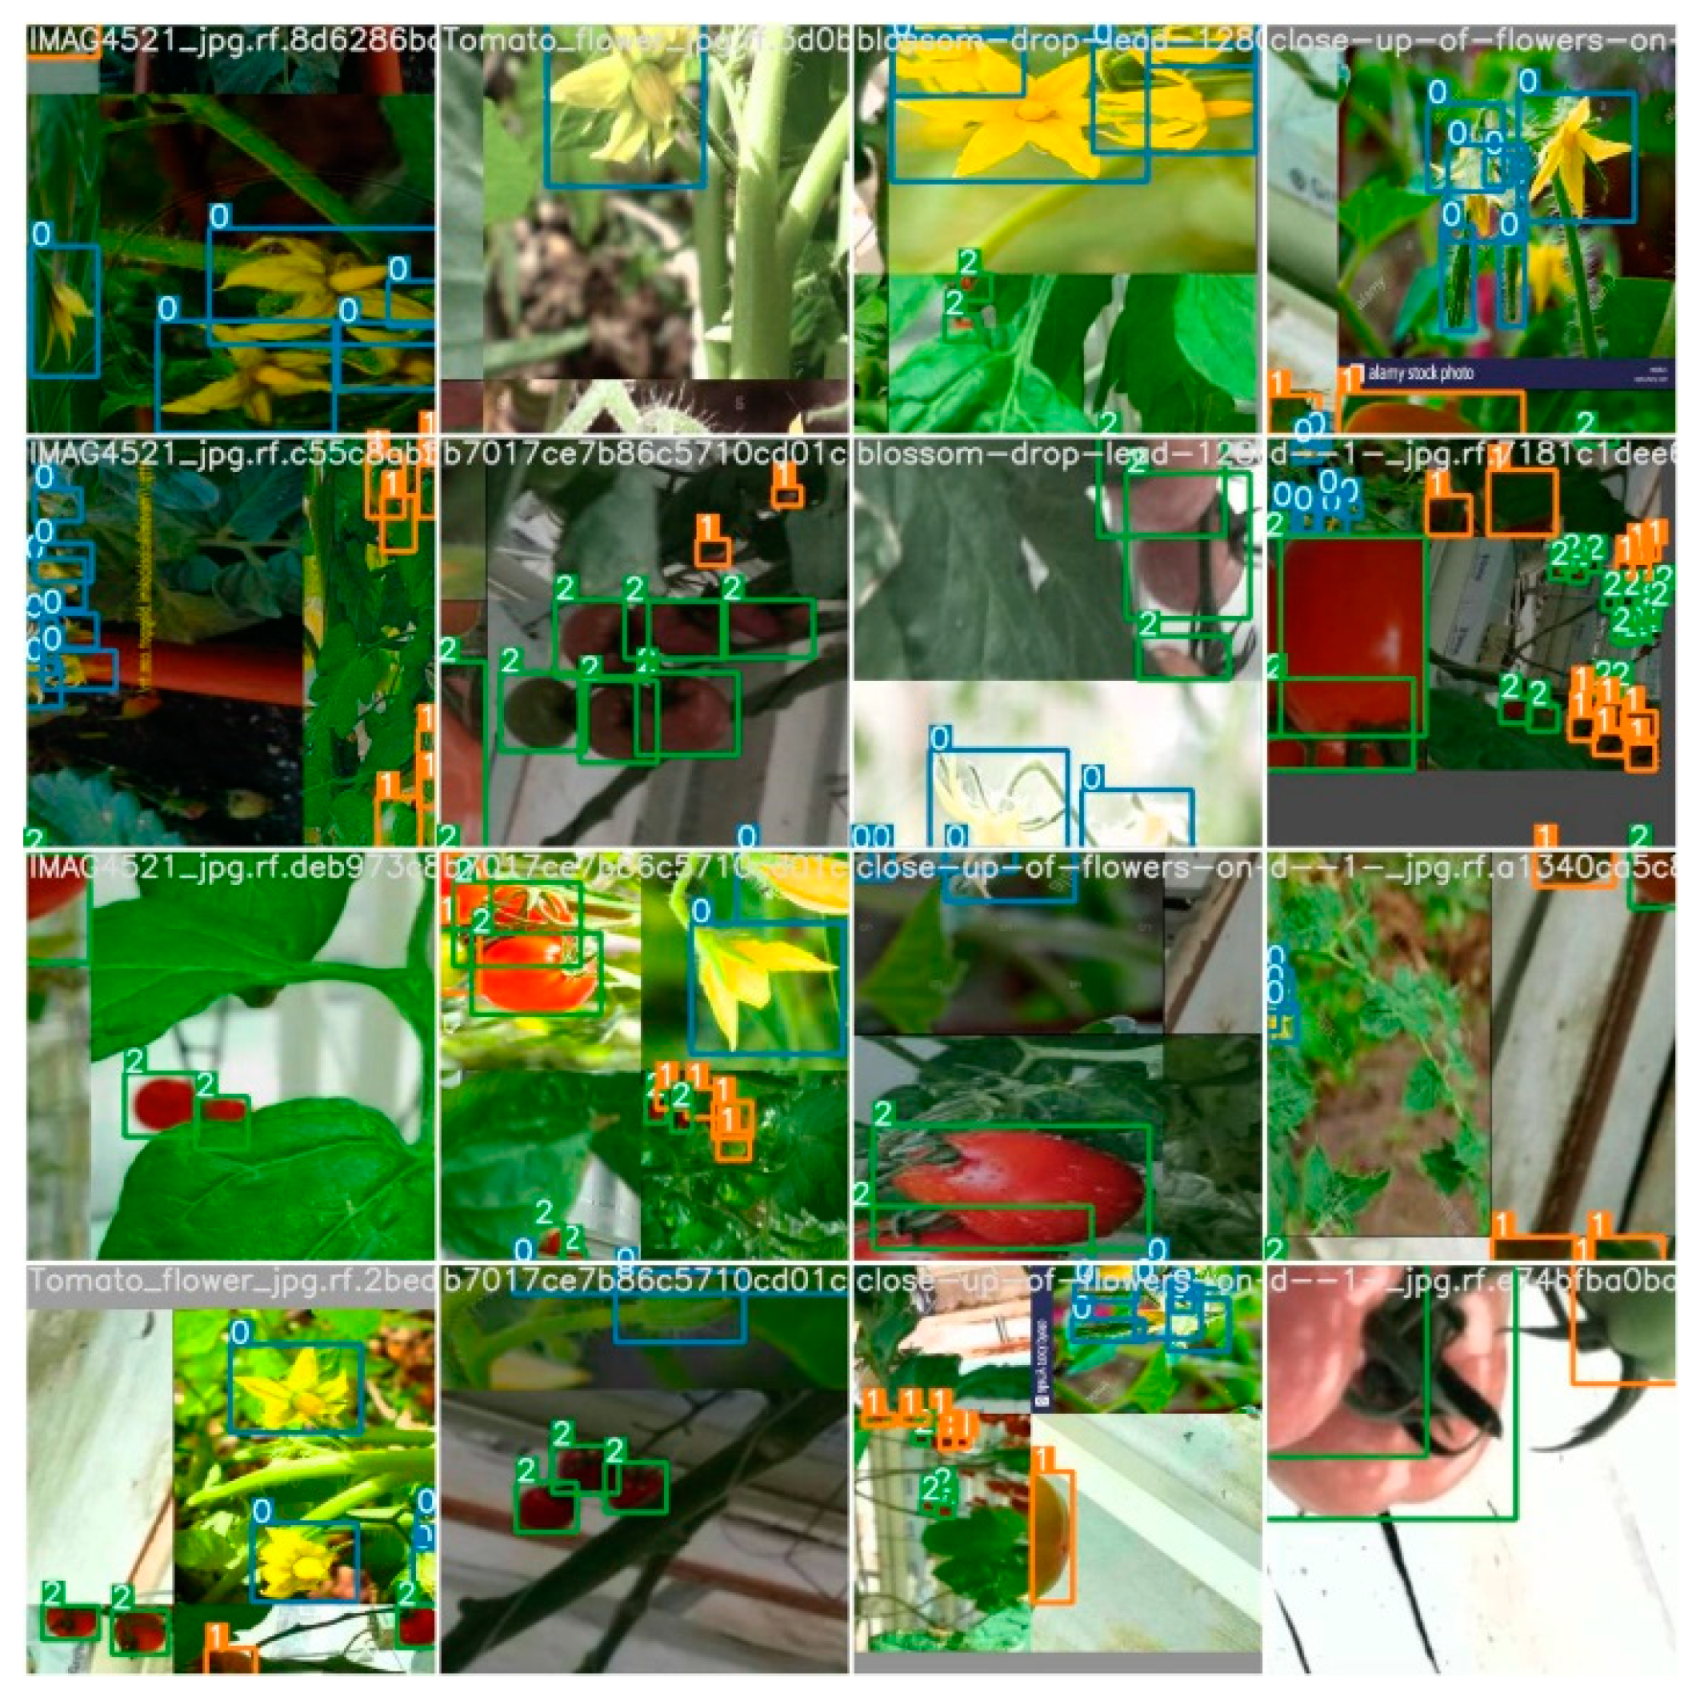
It is essential to make the object detection process more reliable in terms of data variability. Therefore, this project applies data augmentation to the tomato fruit data set to increase the variability. Spatial level and pixel-level techniques are the main methods of image data augmentation. Spatial-level transform techniques change both the bounding box and the image, while pixel-level transformation changes the images and leaves the bounding boxes unchanged. The pixel-level augmentation is used when the bounding boxes are preserved without distortion of the object’s shape, exposure, brightness, blur, and noise levels can be changed. Both types of augmentation methods were used in this research. Subsequently, the images were resized to 608 × 608, 512 × 512, and 416 × 416 by preserving the image aspect ratios and adding black padding to avoid distortion of the tomato fruits aspect ratio. The dataset in the study was expanded from 1097 images to 2329 images and 6957 annotations through augmentation. The ground truth of both training and augmented training data is shown in
Figure 6. The numerical presentation of “0”, “1”, and “2” indicates flower, green tomato, and red tomato, respectively.
2.10. Data Splitting and Health Check
Data splitting and health checks are one of the most critical concepts in deep learning to avoid overfitting [
31,
32,
33,
34]. In this research, the data with 2329 augmented images and 6957 annotations was split into training, validation, and test sets as 70%, 20%, and 10%, respectively. Every data set contains two folders as images and labels. While the images folder contains .png, .jpeg, and .jpg extensions, the labels folders contain .txt files that contain all coordinates of ground truth bounding boxes. The validation and test sets’ primary purposes are to find data discrepancies between images and determine the prediction accuracy, respectively. The correlogram of images given in
Figure 7 clearly shows the label distribution and correlation of the corresponding classes. It shows the position (x, y), width, and height of the bounding boxes of the flowers, green tomatoes, and red tomatoes in the dataset.
3. Analysis and Results
This article uses computer vision, drones, and deep learning technologies to autonomously evaluate and count tomato fruits under greenhouse conditions at Şırnak University Greenhouse Field. The training and counting processes are performed through python AI libraries (TensorFlow, Keras, Pandas, and OpenCV), PyTorch, Roboflow online data augmentation services, and Google Colab Cloud Service. In addition, HP-Omen Laptop with a Gforce-1050Ti GPU and DJI Spark is used to collect the data from Şırnak University Tomato Greenhouse area and evaluate the real-time performance evaluation. The 1097 raw RGB images are taken manually through the DJI drone. The data is augmented with 90° rotation Clockwise and Counter-Clockwise. As a result, 2329 augmented images and 6957 annotations are obtained. Next, the data is divided into three parts: Training, Validation, and Test set. The training parameters, which are class name, the epoch number, batch size, GPU, and learning rate, are initialized as “Tomato”, 200, 16, GPU enabled, and 0.001. These parameters are run on Google Colab Cloud Service using PyTorch, AI libraries, and OpenCV. The results show that the best weights are obtained at epoch 192 with 0.63 of mAP 0.5. The training results are represented in
Figure 8 and
Table 2.
According to
Table 2, the predictions obtained from the red tomato class have higher accuracies due to the high number of training samples and its distinct color feature. On the other hand, the green tomato class has lower prediction accuracies because the greenhouse complex environment contains green color leaves in almost all survey areas. Lastly, the flower class has the lowest prediction accuracies due to the low number of samples and similarity between tomato and flower sepals. Moreover, the best Precision, Recall, and F1 score versus confidence level plots and PR curve are obtained to see how well the model is performed, as seen in
Figure 8.
According to
Figure 9, the Precision has an almost linear increase as the confidence level approach 1. The maximum Precision is obtained at a confidence level of 0.923 which means that the portion of true positive values with all classes is at a significant level. The recall values also give us an insight into the prediction performance. It is seen that the recall values gradually go down as the confidence level is increasing. This is because false negative tomato detection has a higher impact on prediction accuracy. Moreover, when checking the PR curve, it can be seen that different thresholds affect the classes differently. Since the flower class has a lower number of annotations, it shows unstable behaviors. Finally, individual F1 scores for red tomato, green tomato, and flower are computed as 0.74, 0.56, and 0.61 at a confidence level of 0.423, respectively. In addition, at the same confidence level, the average F1 score for all models rapidly increases and achieves a peak of 0.63. However, as the confidence level accedes to 0.8, the F1 score starts to decrease gradually. In other words, the best predictions occur between a confidence level of 0.5 and 0.8. Since the number of annotations is higher for the tomato class, its F1 score increases rapidly. With the optimum tomato detection model, the following prediction is made and tested on different images and represented in
Figure 10 and
Figure 11 as batch images form.
After analyzing the whole model, the best training weights (coefficients) are saved and converted to the Tensor Flow model. Later, the Deep-Sort algorithm was applied to the trained model to follow the detected tomatoes with respect to their locations. To count the tomatoes, two lines were placed at the bottom of the image frames. The algorithms count anytime a tomato passes these two yellow lines, as indicated in
Figure 12.
The detection and counting results in
Table 3 show that the proposed algorithm has detected 18 flowers, 240 green tomatoes, and 36 red tomatoes for one aisle. After comparing the manual counting results, it was obtained that the flower, green tomato, and red tomato had accuracy rates of 50%, 99%, and 85%, respectively. The related captured video sample link can be found in the
Supplementary Section.
4. Discussion
The introduction of aerial image and object detection systems into the field of agriculture has led to a rapid increase in applications such as the detection of different tree species in forests, tree counting, diseased plant detection, etc. The increase in computer processor speeds and the emergence of fast deep learning algorithms have allowed studies on fruit detection and yield estimation to take place in the last few years.
In their research, Vanbrabant et al. used pixel-based classification of pear fruit flowers using RGB images taken from drones. Orthomosaics and the dense point cloud that are processed from drone images are converted into a binary classified image and point cloud using stochastic gradient boosting algorithms, and the flower counting is determined by taking the sum of the pixel values. They achieve R2 of 0.61 and RRMSE of 18% by using 2D pixel-based estimation [
35]. Hosseiny and his research group sought a reliable fruit counting system based on image processing and deep learning methods for plant detection in agricultural lands from high-resolution images provided by drones. In this study, in which RGB images are also used, plant detection and counting were made on the cornfield by using the R-CNN method. As a result, a prediction accuracy of 89% was obtained on plant counting [
36]. Heylen studied the counting of strawberry flowers using drone imagery and sequential convolutional neural networks. In their study, they used annotation and data augmentation methods and achieved an average error rate of 10% compared to manual counting from the images [
37]. Vandermaeseri and her research group worked on flower counting from four pear orchards for three consecutive years with drones. They aimed to predict the fruit yield in the gardens by using the flower numbers and vegetation indices on the random forest model. Their results achieved an R2 of between 0.41 to 0.51, although some of the trees were affected by severe frost damage [
38]. Liu et al. worked on only a tomato fruit detection system using the YOLO V3 algorithm and compared the detection prediction accuracy with YOLO V2 and R-CNN methods. They achieved tomato fruit detection accuracy of 94.6% using YOLO V3 [
39,
40]. Syazwani et al. conducted a study on pineapple fruit detection and counting using many machine learning and deep learning models from top-view drone imagery. The best results are obtained by ANN-GDX with a prediction accuracy of above 90% [
41].
Our research aimed to quickly and accurately count the tomato fruits and flowers to reduce the workload and expenses of the farmers in agriculture and thus support cheap fruit production. In our study, by counting red tomatoes, green tomatoes, and flowers at the same time, we obtain data on how many flowers turn into tomato fruits. When the low rate of this ratio has been determined beforehand, the low yield problem can be solved in a shorter time by adding fertilizer and improving pollination parameters. Real-time greenhouse video recording and fruit counting processes were carried out with the communication of the drone and the computer, and the accuracy rate was increased by supporting the specially developed counting algorithm. This algorithm prevented distant tomatoes and flowers from being counted, and the drone did not count again while passing through the next aisle, providing an increased prediction rate. The data augmentation method we use has increased the training data set. Therefore, it has also increased the prediction accuracy by facilitating fruit and flower detection. In addition, the robustness of the counting process is increased by using the YOLO V5 algorithm in the system. According to the MAPE score, we achieved an accuracy rate of 99% for green tomatoes, 85% for red tomatoes, and 50% for flower counting. The reason for the low accuracy in flower counting is the inadequate number of ground truth flowers in the environment.
5. Conclusions
This study introduces a real-time automated fruit recognition and counting mechanism using advanced image processing to achieve higher productivity and lower cost in agricultural sectors. Once YOLO V5 and drone are combined, it is possible to reduce the counting of the process into minutes rather than hours or days. In addition, a size filter is added to the counting algorithm to avoid faulty counts belonging to other rows in the greenhouse. The provided AI-aided drones also have side benefits such as increasing pollination for tomato fruits. The system, which processes the greenhouse videos taken with the DJI Spark drone with the help of YOLO V5, Deep-SORT, and Tensor-Flow algorithms on the Python platform, first separates the fruits and flowers and then performs their counting processes. The data set containing 2329 images with 6957 annotations were divided into training, validation, and test sets in the ratio of 70:20:10, respectively, and the accuracy rates in red tomato, green tomato, and flower counts were predicted. The average F1 score for all classes is obtained as 0.63, while the F1 scores of red tomato, green tomato, and flower classes are determined as 0.74, 0,56, and 0.61, respectively. According to the MAPE score, we achieved an accuracy rate of 99% for green tomatoes and 85% for red tomatoes. However, we achieved a 50% error rate in counting tomato flowers since the number of flowers to be used in the learning process is inadequate. Future work will focus on reducing the flower prediction error rate by expanding the data size and using more data augmentation techniques to improve overall fruit and flower prediction accuracy.


