Article

A Decreased Nitrogen Rate with Increased Planting Density Facilitated Better Palatability of Conventional japonica Rice at High Yield Levels

1
Jiangsu Key Laboratory of Crop Cultivation and Physiology, Jiangsu Co-Innovation Center for Modern Production Technology of Grain Crops, Research Institute of Rice Industrial Engineering Technology, Yangzhou University, Yangzhou 225009, China
2
Institutes of Agricultural Science and Technology Development, Joint International Research Laboratory of Agriculture and Agri-Product Safety, The Ministry of Education of China, Yangzhou University, Yangzhou 225009, China
*
Author to whom correspondence should be addressed.
Agriculture 2022, 12(9), 1292; https://doi.org/10.3390/agriculture12091292
Submission received: 12 July 2022 / Revised: 15 August 2022 / Accepted: 20 August 2022 / Published: 23 August 2022
(This article belongs to the Section Crop Production)

Abstract

:
A decreased nitrogen (N) rate with increased planting density (DNID) is recommended as a feasible method to maintain rice grain yield and N-utilization efficiency. However, it is still unclear whether DNID could improve grain quality, particularly the edible quality of rice. Three high-yield rice with superior palatability (HYSP) and three high-yield rice with inferior palatability (HYIP) were grown under DNID and local cultivation practices (LCP) in the same paddy fields during the 2018 and 2019 rice planting seasons. HYSP exhibited similar grain yields to HYIP under both cultivation treatments. HYSP had more spikelets per m2 through panicles per m2, while having lower spikelets per panicle and 1000-kernel weight than HYIP. DNID increased panicles per m2 and 1000-kernel weight and decreased spikelets per panicle of HYSP and HYIP compared with LCP. HYSP exhibited more biomass accumulation during heading to maturity under NDID and LCP (p < 0.05), which is supported by a higher leaf area index (LAI) and SPAD values after heading. DNID reduced shoot biomass weight and non-structural carbohydrate, while increasing harvest index and NSC remobilization reserve, especially for HYSP (p < 0.05). HYSP had a higher amylopectin content, total starch content, gel consistency, stickiness, and overall palatability (p < 0.05), while it had a lower hardness (p < 0.05) than HYIP. Compared with LCP, DNID increased the amylose content, amylopectin content, total starch content, gel consistency, stickiness, and overall palatability, while it decreased grain protein content and hardness of HYSP and HYIP. HYSP showed consistently higher peak viscosity, breakdown, and gelatinization temperatures (p < 0.05), while it showed lower setback (p < 0.05) than HYIP. For HYSP and HYIP, DNID increased the peak viscosity, breakdown, and gelatinization temperatures (p < 0.05), while it decreased the setback compared with LCP. Generally, the results indicated that coordinated yield components, more post-heading biomass accumulation, lower amylose content, higher peak viscosity and breakdown with lower setback, and higher gelatinization temperatures facilitated high-level grain yield and excellent cooked rice palatability of HYSP. DNID is a feasible method to maintain rice grain yield and enhance the quality of cooked rice for edible properties.

1. Introduction

Rice (Oryza sativa L.) is one of the most important cereal crops worldwide [1]. Historically, it is the priority to breed high-yielding rice to meet the rising demands driven by the growing population [2,3]. As living standards are improving, consumers desire high-quality rice [4]. The dramatic shift in consumption trends is encouraging the development of rice with high yield and superior grain quality in rice breeding and cultivation management [5,6].
Rice grain quality is of great interest to producers, consumers, and researchers, especially for its cooking and eating quality [7,8]. The main constituents of rice grain are starch (80–90% grain weight) and protein (4–18% grain weight), which are two key determinants of grain quality [9]. Starch is a high-molecular-weight glucose polymer, consisting primarily of amylose and amylopectin. Amylose content and the chain structure of amylopectin were tightly correlated with starch crystalline structure, pasting properties, and digestibility characteristics of cooked rice grains [10,11]. Grain protein content and its composition were also suggested to be involved in the grain quality formation of rice [12,13]. Conventional japonica rice is extended and planted in east and northeast China primarily [14,15]. Generally, conventional japonica rice in east China achieved higher grain yields, while having poor rice quality, especially cooking and edible quality, than rice in northeast China [6,16]. Such a phenomenon might be closely correlated to rice cultivars, meteorological conditions, and nitrogen (N) application rates. For example, rice with excellent grain quality, represented by Daohuaxiang 2 and Jijing 515, has always been popular in production in northeast China, which can create great economic gains for farmers [17,18]. Comparatively, rice cultivars with good grain-quality, especially edible quality, that are adapted to ecological and climatic conditions are still lacking in east China.
In the past few years, conventional japonica rice with a lower amylose content ranging from 10% to 14%, such as Nanjing 9108, Nanjing 2728, and Wuyunjing 30, were bred successfully in east China, which were characterized with better grain yields and edibility quality indices after cooking [19,20]. Given the excellent properties above, these high-yield rice with superior palatability (HYSP) were planted on a large-scale in agricultural production [6]. For example, Nanjing 9108 has been planted on a cumulative area of 1.8 Mha during the past few years (https://www.ricedata.cn/ (accessed on 27 October 2021)). Additionally, some studies examined the relationship between grain yield and rice quality of HYSP to cultivation modes and environmental stresses [19,21,22,23]. For instance, Wei et al. [22] summarized that a higher N rate under shading stress improved the milling quality, whereas it deteriorated the cooking and eating quality because of the increased chalky area and chalkiness of HYSP. However, few studies focus on the agronomic and physicochemical traits underlying the mechanism of synchronized grain yield and edible quality in HYSP.
Rice cultivation patterns achieved super high-yielding levels and over-application of N fertilizer in east China, which not only resulted in yield loss but also lowered grain quality in terms of grain protein content, as well as the starch structure and physicochemical properties [14,20,24]. Recently, some N-efficient methods, like decreased N rate with increased planting density (DNID), were recommended for rice production [25,26]. Most existing literature reported that DNID could sustain high levels of rice yields and N-use efficiency [14,27], and whether DNID could benefit rice grain yield still remains unclear. In wheat, Zheng et al. [28] reported that DNID benefited the processing quality through modifying the spatial distribution of protein bodies and gluten proteins. There is little information about the feasibility of DNID improving grain yield, N-use efficiency, and, more importantly, the grain quality of rice.
To determine the grain yield and rice quality of HYSP and high-yield rice with inferior palatability (HYIP), field experiments under DNID and local cultivation practices (LCP) were operated over two years. The main objectives were to (1) determine the main traits for better grain yield and edible quality of HYSP, and (2) investigate whether DNID could maintain rice grain yield or quality characteristics.

2. Materials and Methods

2.1. Plant Materials and Growth Conditions

The research was carried out on experimental plots at Yangzhou University, Jiangsu, east China, during the rice planting seasons of 2018 and 2019. Generally, rice experienced higher mean temperatures (24.9 °C vs. 24.4 °C), sunshine hours (206 h vs. 175 h), and rainfall (120 mm vs. 69 mm) per month within the growing stage in 2018 than in 2019. Sandy loam soil covered the 0-20 cm field, and the mass content of organic carbon, total N, Olsen phosphorus (P) and available potassium (K) was 19.8 g kg1, 1.5 g kg−1, 38.1 mg kg−1, and 90.4 mg kg−1, respectively.
The experiment contained a 2 (two cultivation treatments) × 6 (six rice cultivars) factorial design with three replications in a randomized complete block design. Each experimental plot covered 30 m2 (6 m × 5 m). Cultivation treatments included LCP and DNID. In LCP, the total N rate was 300 kg N ha−1 with a ratio of 3:3:2:2 at 1 day before transplanting, 7 days after transplanting, early panicle initiation stage, and penultimate-leaf differentiation stages, respectively; planting density was 27.8 hills per m2 (30 cm × 12 cm). In DNID, 90 kg N ha−1 was applied 1 day before transplanting; after that, N application methods followed site-specific N management through evaluating leaf N status by the soil–plant analysis development (SPAD) meter [29]. In the first week after transplanting, the nitrogen application rate was 90 kg ha−1 according to the SPAD ≤ 40, the nitrogen application rate decreased by 30% when SPAD was between 40 and 42, and the nitrogen application rate was reduced to 30 kg ha−1 when SPAD was above 42. The nitrogen application rate in panicle initiation ranged from 90 to 30 according to the relationship between SPAD values and 38 to 40. The nitrogen application rate ranged from 75 to 45 and the corresponding SPAD was similar to 1 week after transplanting. The planting density was 33.3 hills per m2 (25 cm × 12 cm) in DNID. The information about the N application rate and planting density under DNID and LCP are listed in Table 1.
Six conventional japonica rice cultivars were selected and planted in the experimental plot and categorized into two types, i.e., HYSP and HYIP, referring to the results of previous cultivar screening trials in 2016 and 2017 (unpublished data). The HYSP were Nanjing 9108, Nanjing 2728, and Wuyunjing 30, while HYIP were Zhendao 18, Wuyujing 33, and Yangjing 282. Seeds of the rice cultivars were sown on 23 May and seedlings were transplanted on 13 June for both years. The P and K fertilizers application, irrigation requirement, and other field management measures were done according to local agricultural recommendations.

2.2. Sampling and Measurements

2.2.1. Leaf Area Index, Shoot Biomass, N Concentration, NSC, and SPAD Values

Six individual rice plants were sampled each time during the jointing, heading, and maturity stages for measuring leaf area index (LAI), shoot biomass, and N concentration. LAI was measured by LI-3100C Leaf Area Meter (Lincoln, NE, USA). The sampled plants were placed well and weighted after drying thoroughly. After that, samples were ground using a Wiley mill (Thomas Scientific, Swedesboro, NJ, USA) for measuring non-structural carbohydrate (NSC) and N concentration, referring to the method of Takai et al. [30] and Nkonge and Ballance [31], respectively. For each treatment, SPAD values across the top 3 leaves were determined at heading, 10, 20, 30, 40, and 50 days after heading (DAH). SPAD values were measured around 10:00 h to 12:00 h during daytime.

2.2.2. Grain Yield and Grain Quality

At maturity, 150 representative hills per plot were harvested for determining the grain yield at the average moisture of 14%. An additional 50 representative hills were sampled to measure the grain yield components, i.e., panicles per m2, spikelets per panicle, filled-grain percentage, and 1000-kernel weight.
The grains were harvested, dried to a moisture of 14%, and stored at room temperature for at least 90 days before determining rice quality. A total of 150 g of rice grains were dehulled and polished by a SY88-TH dehusker (Sangyong, Korea). Then, 30 g of milled grains were sampled to determine the appearance quality through a SC-E scanner (Wanshen, Hangzhou, China).
Milled rice grains were blended, sampled, and dried to a constant weight at 60 °C, and rice flour was collected after grinding and sieving to evaluate rice quality. The amylose content was detected by using a SAN++ segmented flow analyzer (Skalar, Breda, the Netherlands). A total of 100 mg of rice flour was mixed with 200 uL of 0.025% thymol blue ethanol solution and 2.0 mL of 0.2 M KOH solution. The mixture was gelatinized, cooled, and kept horizontally. The cold gel of the mixture represented the gel consistency. Overall, palatability was scored by a STA1A taste analyzer (Satake, Corp., Hiroshima, Japan). The grain protein content was calculated according to a previous method [32].

2.2.3. Starch Granule Size Distribution, RVA Viscosity Parameters, and Thermal Properties

Starch granule size distribution was tested by using a laser light-scattering particle size analyzer (Malvern Instruments Ltd., Malvern, UK). The granule size distribution was output in terms of volume distribution.
The starch pasting profiles were determined by the Rapid Visco-Analyzer (Newport Scientific, Sydney, Australia). The pasting characteristics included primary components (peak viscosity, hot viscosity, and cool viscosity) and secondary components (breakdown and setback). The viscosity values were recorded in centipose (cP).
The Differential Scanning Calorimeter (DSC214, Netzsch, Selb, Germany) was used for evaluating the thermal properties of starch. The thermal properties included onset temperature (To), peak of gelatinization temperature (Tp), conclusion temperature (Tc), gelatinization enthalpy (ΔHgel), and retrogradation enthalpy (ΔHret). The retrogradation percentage (%R) was calculated as the ratio of the gelatinization enthalpy to retrogradation enthalpy.

2.3. Calculation Methods and Statistical Analysis

N utilization efficiency for grain yield (NUEg, kg kg−1) = (Rice grain yield)/(Total N accumulation at maturity).
Partial factor productivity of N (PFPN, kg kg−1) = (Rice grain yield)/(Total N application rate).
NSC remobilization reserve = ((NSC content in the stem at heading − NSC content in the stem at maturity) × 100)/(NSC content in the stem at heading).
Data analyses were conducted with SPSS 17.0 Software (SPSS Inc., Chicago, IL, USA). ANOVA showed that there was no significant difference in yield- and quality-related traits (data not shown) among three cultivars within the same cultivar type (Table 2); data in the same cultivar type were presented as the means in the following analysis.

3. Results

3.1. Grain Yield and N-Use Efficiency

For both HYSP and HYIP, DNID did not result in a significant reduction in grain yield relative to LCP. HYSP exhibited similar grain yields to HYIP under DNID and LCP. DNID reduced the total N accumulation by 14.3% and 10.3% of HYSP and HYIP, respectively, across two years (p < 0.05) relative to LCP. DNID increased the NUEg and PFPN of HYSP and HYIP (p < 0.05). HYSP had a higher total N accumulation, while having a lower NUEg than HYIP under two cultivation treatments in both years, which only reached a significant level under LCP (p < 0.05) (Table 3).
DNID increased panicles per m2 (p < 0.05) and reduced spikelets per panicle of HYSP and HYIP relative to LCP. There were no significant differences in spikelets per m2 for both HYSP and HYIP. Generally, HYSP had higher panicles per m2 and spikelets per m2 than HYIP under LCP and DNID (p < 0.05), although it had lower spikelets per panicle. Compared with LCP, DNID increased the filled-grain rate and 1000-kernel weight, especially for HYSP (p < 0.05). The 1000-kernel weight (g) of HYSP averaged 25.4 under LCP and 26.1 under DNID across two years, which were both lower than the corresponding values of HYIP (Table 4).

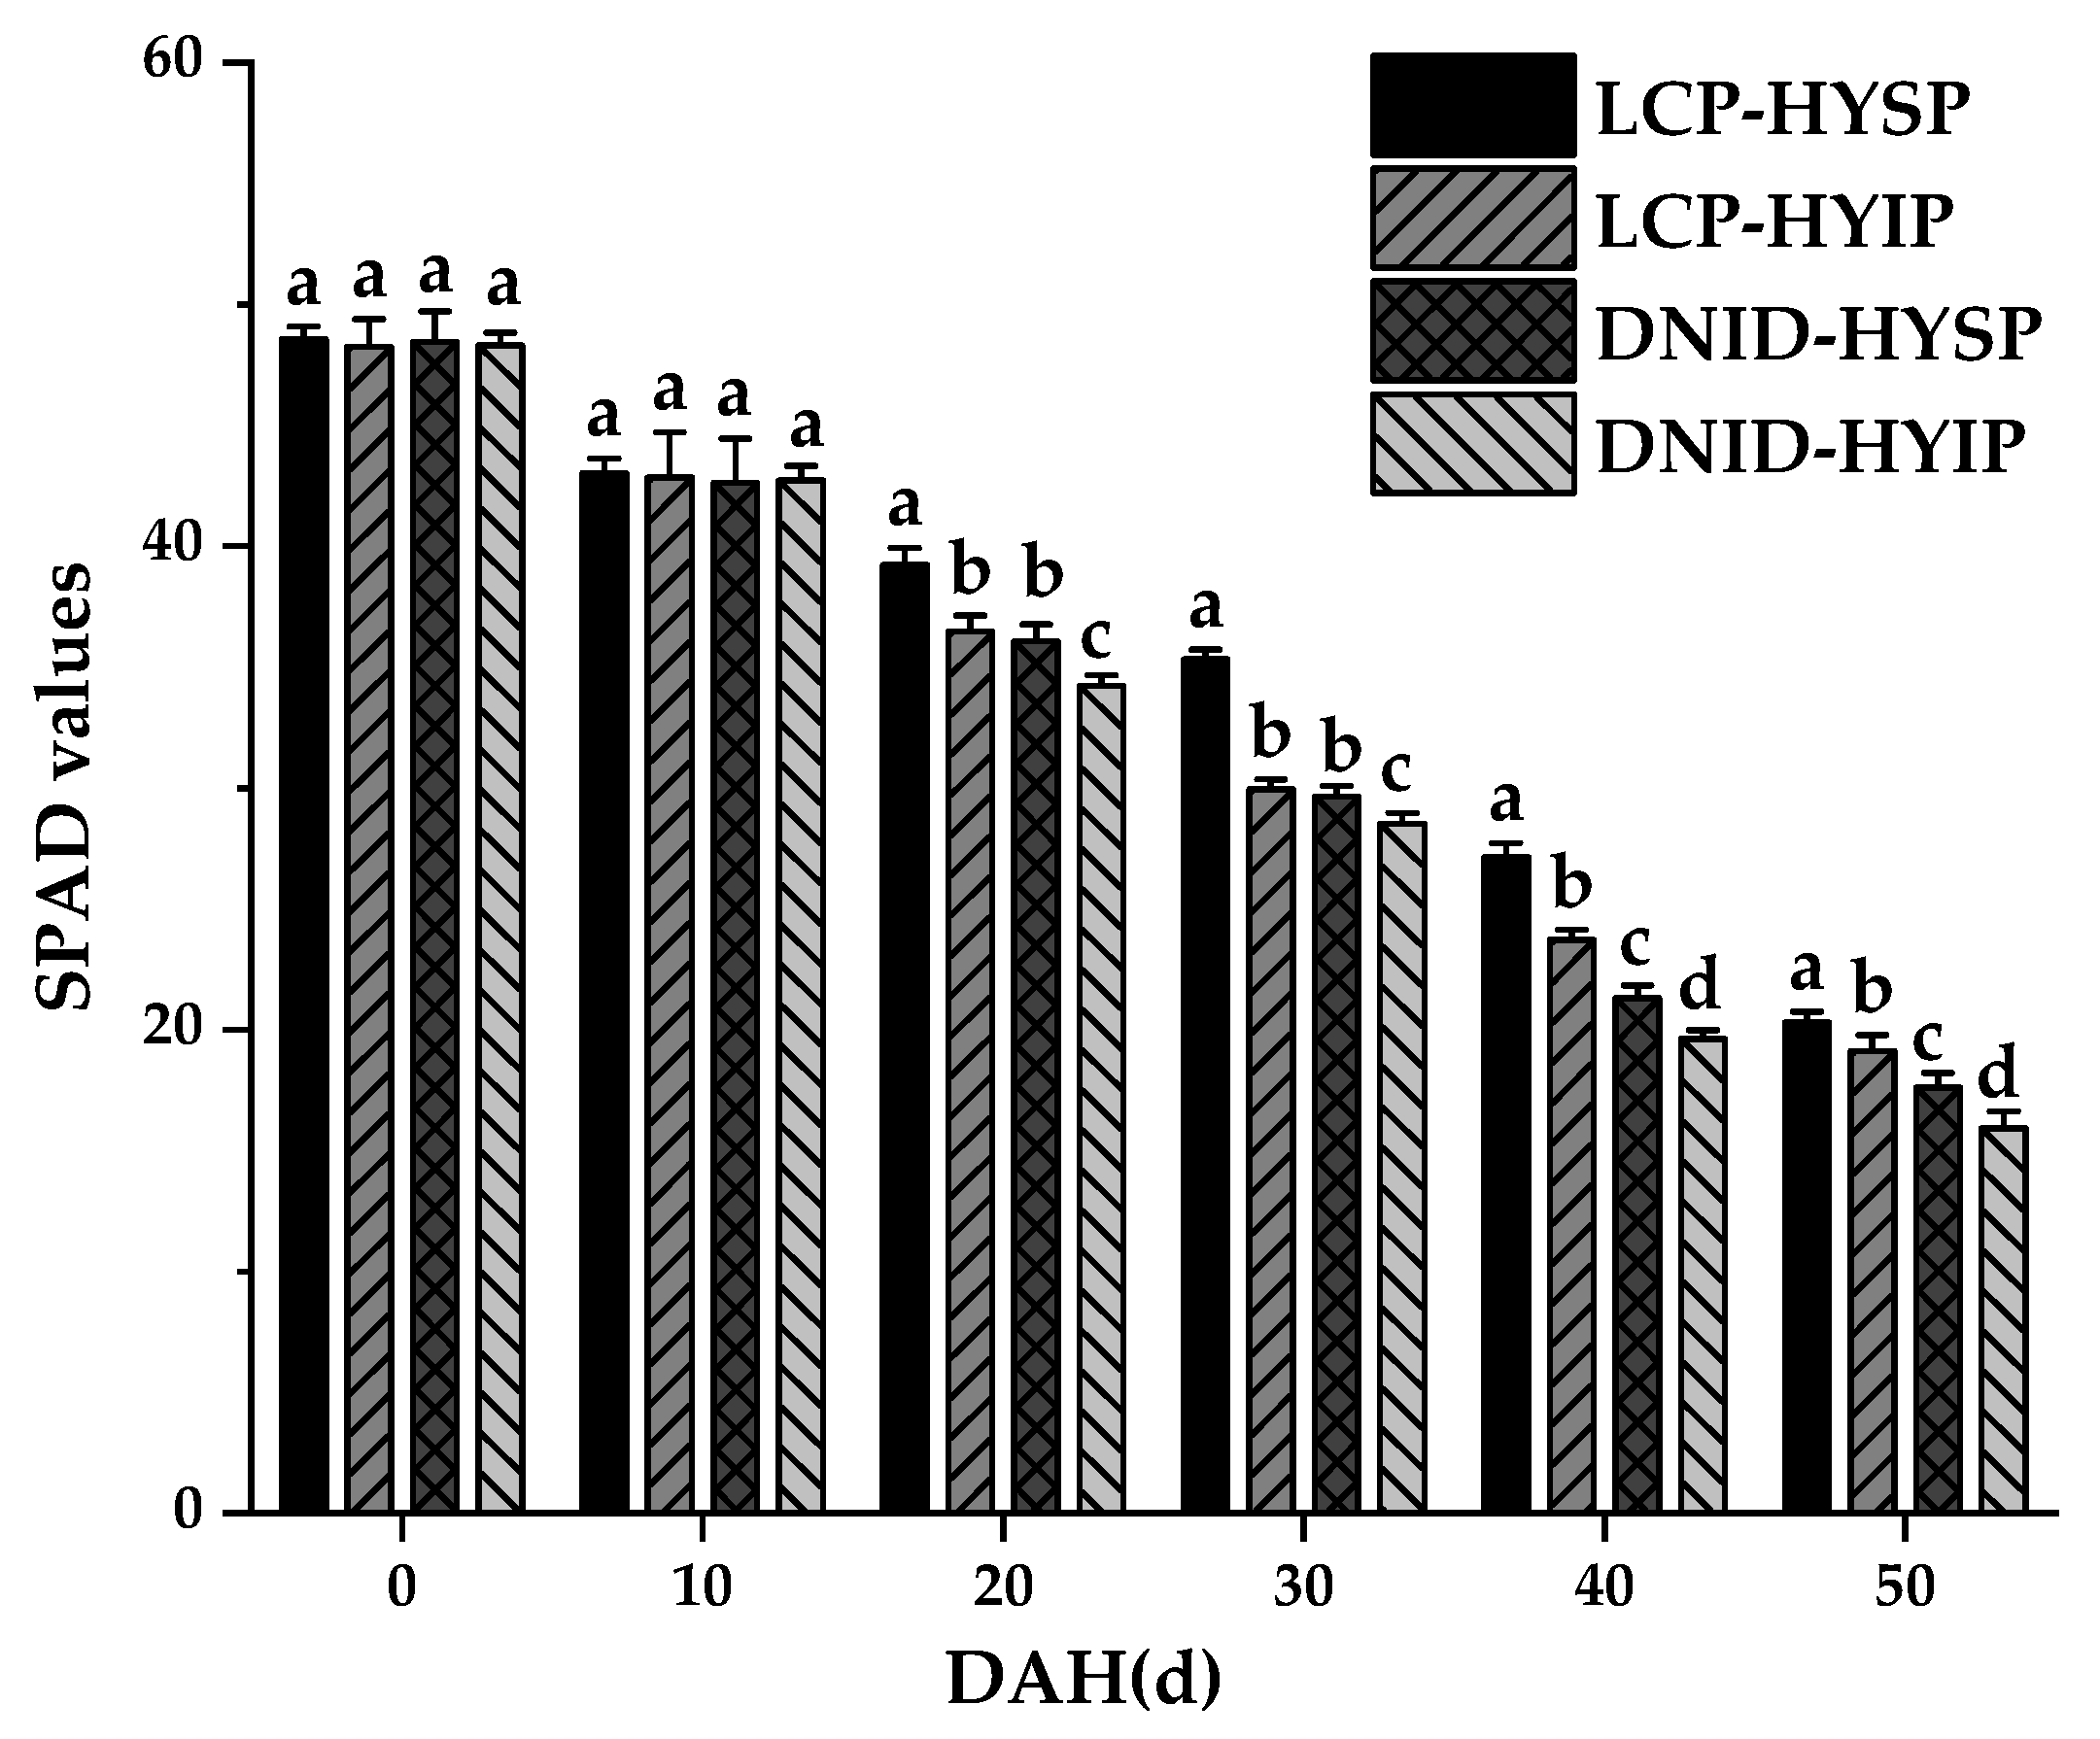
3.2. Shoot Biomass, Harvest Index, NSC, LAI, and SPAD Values

For HYSP and HYIP, shoot biomass weight and shoot biomass of DNID were all lower relative to LCP during all the growing stages. HYSP showed a lower shoot biomass weight at joining, while it was higher at maturity compared to HYIP under DNID and LCP. HYSP had a consistently higher shoot biomass accumulation between heading and maturity than HYIP under DNID and LCP (p < 0.05). The harvest index was increased under DNID, especially for HYSP (p < 0.05). HYSP had a lower harvest index under LCP, while the opposite trend was detected under DNID (Table 5).
DNID reduced the NSC content in the stem at heading by 5.5% and 13.2% of HYSP and HYIP, respectively, across two years compared with LCP; similar trends were observed for the NSC content at maturity. Compared with LCP, the NSC remobilization reserve of HYSP and HYIP under DNID were both increased (p < 0.05). HYSP had a higher NSC content at heading and maturity than HYIP under DNID and LCP. HYSP showed a lower NSC remobilization reserve under LCP than HYIP, while it was higher under DNID (Table 6).
Compared with LCP, DNID reduced LAI at heading by 2.7% and 4.8% across two years of HYSP and HYIP, respectively. Similarly, DNID reduced LAI at maturity, especially for HYIP (p < 0.05). No consistent trends were detected in LAI at heading between HYSP and HYIP under DNID and LCP. HYSP showed a higher LAI at maturity than HYIP under both cultivation treatments (p < 0.05) (Table 7).
No obvious trends and significant differences in SPAD values were observed at heading and 10 DAH among cultivation treatments and cultivar types across the two years. Compared with LCP, DNID reduced SPAD values after 20 DAH, particularly for HYIP (p < 0.05). HYSP had consistently higher SPAD values than HYIP after 20 DAH (p < 0.05) (Figure 1).

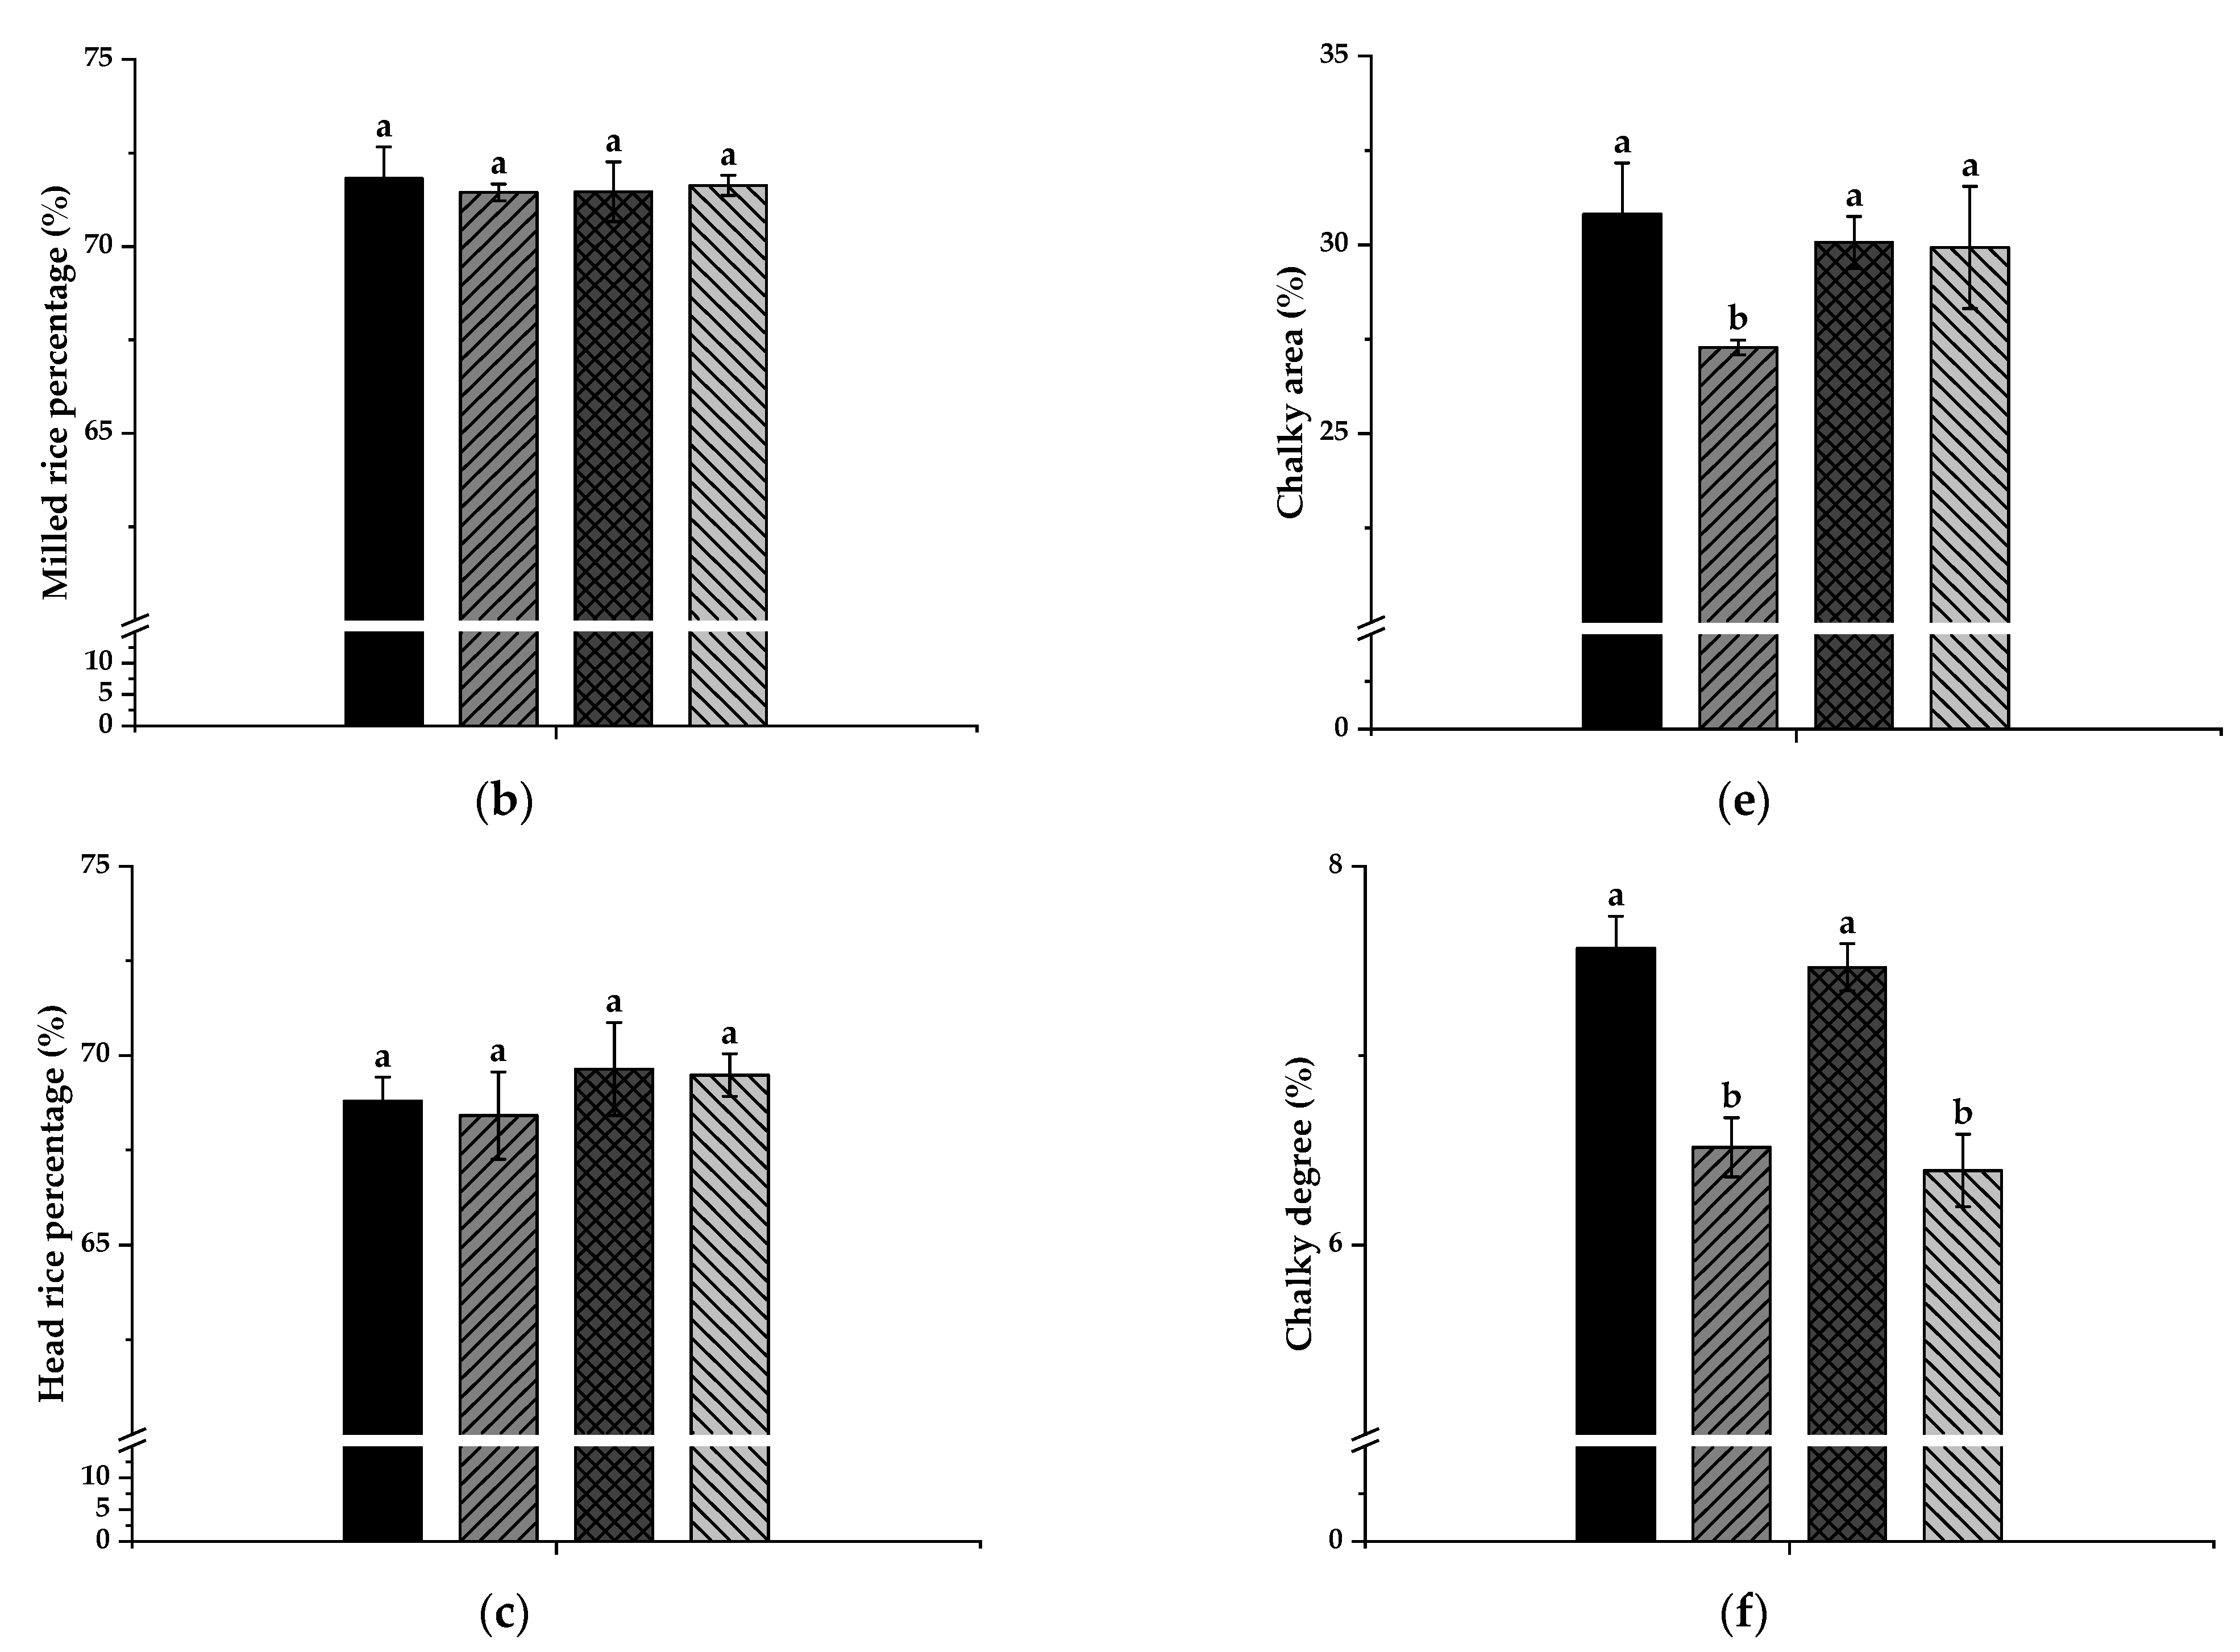
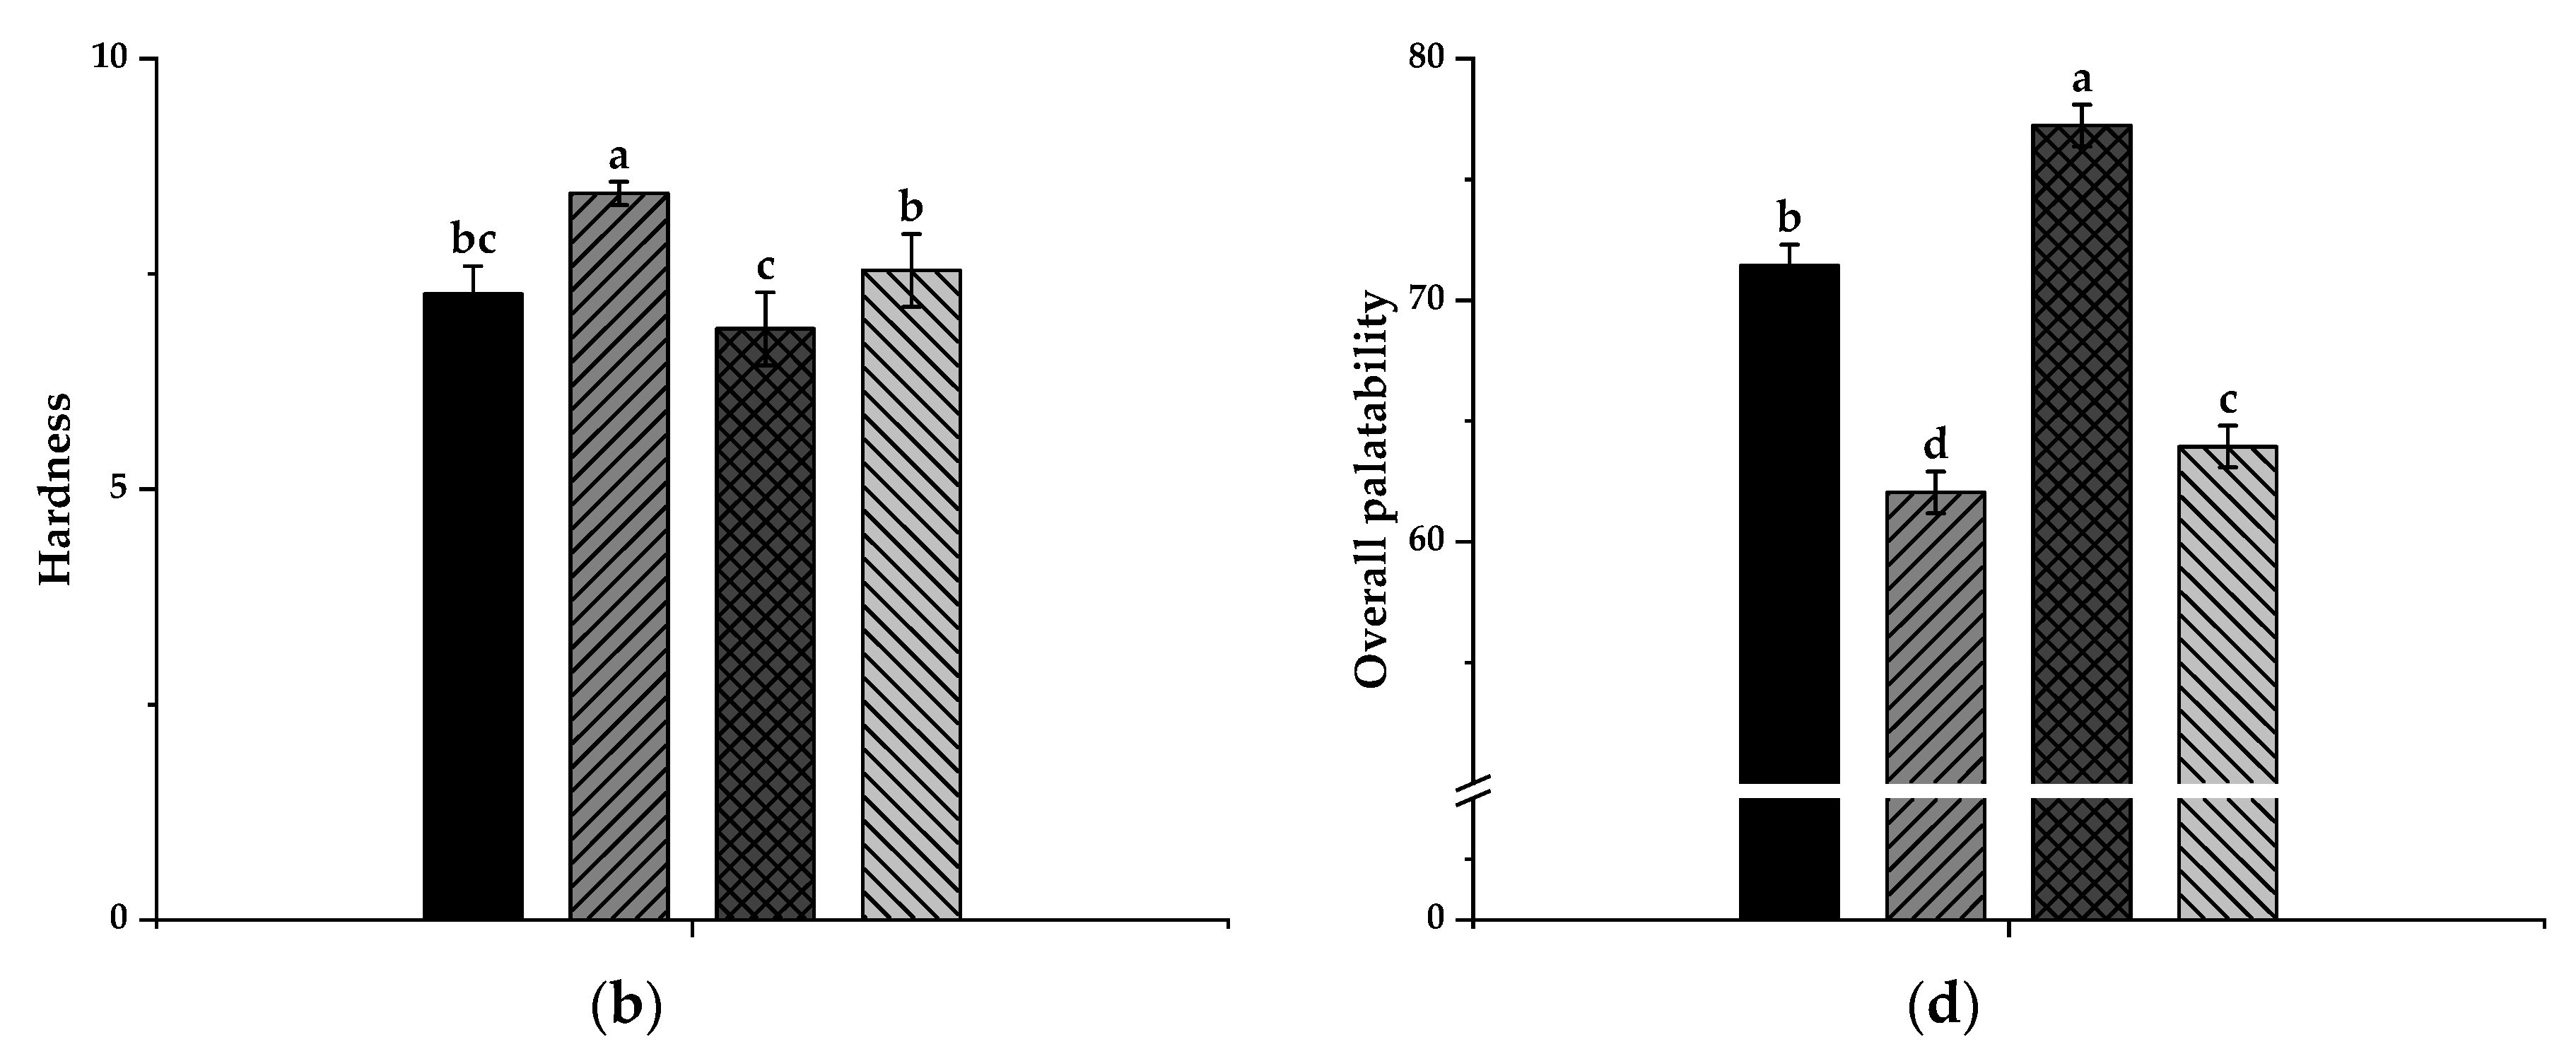
3.3. Milling, Appearance, Cooking and Eating, and Nutritional Qualities

No consistent trends in brown rice percentage, milled rice percentage, and head rice percentage were detected among cultivation treatments and cultivar types across the two study years. Compared with LCP, DNID did not result in significant reductions in the chalky rice percentages of HYSP and HYIP. HYSP showed a higher chalky rice percentage, chalky area, and chalky degree than HYIP under DNID and LCP (p < 0.05) (Figure 2).
For HYSP and HYIP, DNID increased the amylose content, amylopectin content, and total starch content. DNID reduced the protein content of HYSP and HYIP (p < 0.05) compared with LCP. Although it had a lower amylose content (p < 0.05), HYSP had a higher amylopectin content and total starch content than HYIP (p < 0.05). The grain protein content (%) of HYSP averaged 10.5 under LCP and 9.9 under DNID across two years, which were consistently lower than the corresponding values for HYIP (Figure 3).
Compared with LCP, DNID increased the gel consistency and stickiness while decreasing the hardness of HYSP and HYIP. For example, the gel consistency (mm) of HYSP under DNID averaged 75.9 across two years and was 6.0% higher than that of HYSP under LCP. Compared with LCP, DNID increased the overall palatability by 8.0% and 3.9% of HYSP and HYIP across two years, respectively. HYSP exhibited a higher gel consistency and stickiness and lower hardness than HYIP under DNID and LCP (p < 0.05). HYSP had a 15.2% and 19.8% higher overall palatability than HYIP under LCP and DNID, respectively (p < 0.05) (Figure 4).

3.4. Starch Granule Size Distribution and Pasting and Thermal Properties

Compared with LCP, RNID increased the small starch granule ratio by 5.5% and 5.4% of HYSP and HYIP across the two years, respectively. The medium and large starch granule ratio differed in cultivation treatments (p < 0.01). For HYSP and HYIP, DNID increased the medium starch granule ratio (p < 0.05) and decreased the large starch granule ratio (p < 0.05) relative to LCP. No significant differences in the small, medium, and large starch granule ratio were detected between HYSP and HYIP under two cultivation treatments for the two years (Table 8).
For HYSP and HYIP, DNID increased the peak viscosity by 9.0% and 12.3% of HYSP and HYIP across two years (p < 0.05), respectively; similar trends were detected for hot viscosity and cool viscosity. Compared with LCP, DNID increased breakdown while it also reduced the setback of HYSP and HYIP (p < 0.05). HYSP showed a consistently higher peak viscosity and breakdown (p < 0.05) while it also showed a lower setback (p < 0.05) than HYIP under DNID and LCP for the two years (Table 9).
For HYSP and HYIP, DNID reduced the To, Tp, Tc, ΔHgel, and ΔHret relative to LCP. HYSP had a higher To, Tp, Tc, and ΔHgel, while it also had a lower ΔHret and %R than HYIP under both cultivation treatments (Table 10).

3.5. Correlation Analysis

The shoot biomass weight at maturity was positively correlated to grain yield and overall palatability under DNID and LCP (p < 0.01, p < 0.05), while there were similar trends for NSC at heading, LAI at maturity, and SPAD at 40 and 50 DAH (p < 0.01, p < 0.05). There existed positive correlations between panicles per m2, NSC at maturity, amylopectin content, gel consistency, stickiness, peak viscosity, breakdown, and overall palatability under DNID and LCP (p < 0.01, p < 0.05). Conversely, amylose content, protein content, hardness, setback, ΔHret, and %R were all negatively correlated with overall palatability under DNID and LCP (p < 0.01, p < 0.05) (Table 11).

4. Discussion

Previously, rice with a higher grain yield would always produce poor grain quality of cooked grains [33,34]. As living standards improve, the focus on rice quality has increased dramatically, especially the edible quality of rice—apart from grain yield—since 2000 in east China [6]. Amylose content is considered one of the key factors affecting the cooking and eating quality of rice [35]. Generally, rice with a lower amylose content gave soft and sticky cooked grains, while rice with a higher amylose content produced hard and fluffy cooked grains with poor viscosity [36,37]. Therefore, the breeding strategy for improving the edible quality was achieved mainly through lowering the amylose content in rice [6,38]. Overall, such a strategy proved to be feasible, and rice with superior grain yield and edible quality was developed—like the HYSP of our study. In production, these HYSP exhibited superior grain yield exceeding 10.0 t ha−1 and overall palatability of more than 70 [19,20,22].
As reported previously, DNID would maintain rice grain yield and N-utilization efficiency [14,25,26]. However, information on DNID on rice grain quality, especially cooking and eating quality, is still lacking. Our results showed that DNID had similar grain yields compared to LCP for HYSP and HYIP (Table 4); more importantly, DNID increased the overall palatability by 8.0% and 3.9% for HYSP and HYIP, respectively (Figure 4). These results confirmed the feasibility of synchronization between rice yield and quality, particularly for edible quality through effective cultivation practices—like DNID in this study. Moreover, our results also indicated a greater possibility of DNID improving the edible quality of rice with superior palatability compared with inferior ones.
A coordinated yield component is crucial to increasing grain yield and rice quality [34,39,40]. Our results demonstrated that a larger spikelets per m2 through panicle per m2 was the main trait of HYSP compared with HYIP (Table 4 and Table 11). In addition, HYSP had a lower 1000-kernel weight than HYIP under both cultivation treatments (Table 4). As stated above, it is a feasible method to breed rice with a good edible quality by lowering the amylose content [6]. It was reported that such a breeding method for lowering amylose content would decrease the 1000-kernel weight of rice [41,42,43]. Compared with HYIP, HYSP exhibited more shoot biomass weight during heading to the maturity stage (p < 0.05) (Table 5). This result indicated a greater capacity for assimilating production after heading, which is crucial for superior rice grain yield and edible quality (Table 10). HYSP had a consistently higher LAI at maturity and SPAD values after 20 DAH (p < 0.05) compared with HYIP (Table 7, Figure 1). This result suggested a better stay-green after heading of HYSP, which was beneficial for maintaining a steady grain-filling process, thereby adequately filling the grains, particularly for inferior grains, and benefitting the grain yield and quality of rice [22,33].
The results demonstrated that DNID reduced the shoot biomass weight while increasing the harvest index, especially for HYSP, which maintained the rice grain yield (Table 5). The increased harvest index under DNID was related to the NSC remobilization reserve [14]. It was reported that the increased pre-stored carbon remobilization would facilitate the grain-filling efficiency and harvest index [44,45]. In addition, the stay-green after heading of HYSP also indicated better responses to DNID with lower N inputs, which guaranteed NSC accumulation, and its remobilization, and sink-filling efficiency (Table 3 and Table 6, Figure 1). Therefore, the better NSC remobilization under DNID facilitated rice grain yield and grain quality (Table 11).
Grain chalkiness is an undesirable trait because it downgrades appearance quality [46]. Compared with indica hybrid rice, conventional japonica rice was characterized with poor appearance because of its high chalky degree in China [47,48]. Hence, great attention was paid to decreasing grain chalkiness during the genetic improvements, and progress was made in such a breeding target [16,49]. For instance, Meng et al. [49] concluded that grain chalky degree of conventional japonica rice in east China has been greatly reduced since the 1980s. Our results demonstrated that HYSP had a higher chalky degree than HYIP (p < 0.05) (Figure 2). The relatively large chalky area of HYSP was associated with the lower amylose content, which led to a powdery and opaque phenotype of endosperm [19,50]. This result implied that grain chalkiness was still worth more attention for the grain yield and edible quality of conventional japonica rice in breeding programs.
In China, large amounts of N fertilizers were always applied to pursue high yields, which would easily increase grain protein content and result in poor grain quality, especially the cooking and eating quality [22,50]. Herein, DNID adopted site-specific N management that reduced the grain protein content of rice relative to LCP (Figure 3). The lower grain protein content under DNID facilitated the better palatability of HYSP and HYIP (Table 11). Compared with LCP, DNID modified pasting properties; the peak viscosity and breakdown were increased while setback was decreased under DNID for both HYSP and HYIP, which was another reason for the superior overall palatability under DNID (Table 9 and Table 11).
Pasting and thermal properties of starch are highly correlated to cooked rice quality [24,51]. Generally, peak viscosity and breakdown are positively correlated with gel consistency and hardness, while they are negatively correlated with the stickiness of cooked grains [52,53]. In our study, HYSP showed a higher peak viscosity and breakdown (p < 0.05), while it had a lower setback (p < 0.05) compared with HYIP under the two cultivation treatments (Table 9). This result was consistent with prior studies that rice with good edible quality was always characterized by a higher peak viscosity and breakdown and lower setback [52,54]. Moreover, HYSP had consistently higher gelatinization temperatures (To, Tp, and Tc) than HYIP (Table 10), which might be associated with a higher grain chalky degree. Previous studies reported that the degree of grain chalkiness was closely correlated with gelatinization temperatures [19,33]. The chalky parts always had a more inflexible interior structure of starch than the corresponding translucent parts in rice grains, which in turn indicated more energy required during the starch gelatinization process and higher gelatinization temperatures [55,56]. As such, the above information might explain the higher gelatinization temperatures of HYSP with a higher chalky degree.

5. Conclusions

HYSP exhibited a superior grain yield and edible quality over HYIP under two cultivation treatments. A coordinated yield component, more post-heading biomass accumulation because of better leaf stay-green, lower amylose content, higher peak viscosity and breakdown with lower setback, and higher gelatinization temperatures were important traits for the grain yield and edible quality of HYSP. DNID increased the panicles per m2, grain weight, and NSC remobilization reserve; reduced the protein content; and increased the small and medium starch granules ratio and breakdown value. These agronomy and physicochemical characteristics synergistically improved the grain yield and palatability, especially for rice with a better edible quality.

Author Contributions

J.G. and H.W. designed the experiment and wrote the draft manuscript. J.G. and X.Z. carried out the field experiment and involved in plant sampling. H.W. and Q.D. acquired funding. All authors have read and agreed to the published version of the manuscript.

Funding

This work was supported by the National Natural Science Foundation of China (31901448, 32001466), Key Research and Development Program of Jiangsu Province (BE2019343), Joints Funds of the National Natural Science Foundation of China (U20A2022), Postdoctoral Research Foundation of China (2020M671628, 2020M671629), Natural Science Foundation of the Jiangsu Higher Education Institutions, China (19KJB210004), and the Priority Academic Program Development of Jiangsu Higher Education Institutions (PAPD).

Institutional Review Board Statement

Not applicable.

Informed Consent Statement

Not applicable.

Data Availability Statement

Not applicable.

Conflicts of Interest

The authors declare no conflict of interest.

References

  1. Ito, V.C.; Lacerda, L.G. Black rice (Oryza sativa L.): A review of its historical aspects, chemical composition, nutritional and functional properties, and applications and processing technologies. Food Chem. 2019, 301, 125304. [Google Scholar] [CrossRef] [PubMed]
  2. Miura, K.; Ashikari, M.; Matsuoka, M. The role of QTLs in the breeding of high-yielding rice. Trends Plant Sci. 2011, 16, 319–326. [Google Scholar] [CrossRef] [PubMed]
  3. Wang, F.; Peng, S.B. Yield potential and nitrogen use efficiency of China’s super rice. J. Integr. Agr. 2017, 16, 1000–1008. [Google Scholar] [CrossRef]
  4. Zeng, D.L.; Tian, Z.X.; Rao, Y.C.; Dong, G.J.; Yang, Y.L.; Huang, L.C.; Leng, Y.J.; Xu, J.; Sun, C.; Zhang, G.H.; et al. Rational design of high-yield and superior-quality rice. Nat. Plants 2017, 3, 17031. [Google Scholar] [CrossRef] [PubMed]
  5. Buenafe, R.J.; Rathnam, A.; Añonuevoa, J.J.; Sundar, S.; Sreenivasulu, N. Application of classification models in screening superior rice grain quality in male sterile and pollen parents. J. Food Compos. Anal. 2021, 104, 104137. [Google Scholar] [CrossRef]
  6. Wang, C.L.; Zhang, Y.D.; Zhu, Z.; Chen, T.; Zhao, Q.Y.; Zhong, W.G.; Yang, J.; Yao, S.; Zhou, L.H.; Zhao, L.; et al. Research progress on the breeding of japonica super rice varieties in Jiangsu Province, China. J. Integr. Agric. 2017, 16, 992–999. [Google Scholar] [CrossRef]
  7. Jukanti, A.K.; Pautong, P.A.; Liu, Q.Q.; Sreenivasulu, N. Low glycemic index rice—A desired trait in starchy staples. Trends Food Sci. Technol. 2020, 106, 132–149. [Google Scholar] [CrossRef]
  8. Prom-u-thai, C.; Rerkasem, B. Rice quality improvement. A review. Agron. Sustain. Dev. 2020, 40, 28. [Google Scholar] [CrossRef]
  9. Okuda, M.; Aramaki, I.; Koseki, T.; Satoh, H.; Hashizume, K. Structural characteristics, properties, and in vitro digestibility of rice. Cereal Chem. 2005, 82, 361–368. [Google Scholar] [CrossRef]
  10. Chung, H.J.; Liu, Q.; Lee, L.; Wei, D.Z. Relationship between the structure, physicochemical properties and in vitro digestibility of rice starches with different amylose contents. Food Hydrocolloid. 2011, 25, 968–975. [Google Scholar] [CrossRef]
  11. Li, H.Y.; Prakash, S.; Nicholson, T.M.; Fitzgerald, M.A.; Gilbert, R.G. The importance of amylose and amylopectin fine structure for textural properties of cooked rice grains. Food Chem. 2016, 196, 702–711. [Google Scholar] [CrossRef]
  12. Balindong, J.L.; Ward, R.M.; Liu, L.; Rose, T.J.; Pallas, L.A.; Ovenden, B.W.; Snell, P.J.; Waters, D.L.E. Rice grain protein composition influences instrumental measures of rice cooking and eating quality. J. Cereal Sci. 2018, 79, 35–42. [Google Scholar] [CrossRef]
  13. Wood, R.M.; Dunn, B.W.; Balindong, J.L.; Waters, D.L.E.; Blanchard, C.L.; Mawson, A.J.; Oli, P. Effect of agronomic management on rice grain quality Part II: Nitrogen rate and timing. Cereal Chem. 2021, 98, 234–248. [Google Scholar] [CrossRef]
  14. Wei, H.H.; Meng, T.Y.; Ge, J.L.; Zhang, X.B.; Shi, T.Y.; Ding, E.H.; Lu, Y.; Li, X.Y.; Tao, Y.; Chen, Y.L.; et al. Reduced nitrogen application rate with dense planting improves rice grain yield and nitrogen use efficiency: A case study in east China. Crop J. 2021, 9, 954–961. [Google Scholar] [CrossRef]
  15. Xu, Q.; Chen, H.; Wang, C.H.; Yu, H.Y.; Yuan, X.P.; Wang, Y.P.; Feng, Y.; Tang, S.X.; Wei, X.H. Genetic diversity and structure of new inbred rice cultivars in China. J. Integr. Agric. 2012, 11, 1567–1573. [Google Scholar] [CrossRef]
  16. Mao, T.; Li, X.; Jiang, S.K.; Tang, L.; Wang, J.Y.; Xu, H.; Xu, Z.J. Discussion on strategy of grain quality improvement for super high yielding japonica rice in Northeast China. J. Integr. Agric. 2017, 16, 1075–1083. [Google Scholar] [CrossRef]
  17. Shan, Q.W.; Zhang, Y.; Chen, K.L.; Zhang, K.; Gao, C.X. Creation of fragrant rice by targeted knockout of the OsBADH2 gene using TALEN technology. Plant Biotechnol. J. 2015, 13, 791–800. [Google Scholar] [CrossRef]
  18. Zhao, Q.Y.; Yousaf, L.; Xue, Y.; Shen, Q. Changes in flavor of fragrant rice during storage under different conditions. J. Sci. Food Agric. 2020, 100, 3435–3444. [Google Scholar] [CrossRef]
  19. Bian, J.L.; Xu, F.F.; Han, C.; Qiu, S.; Ge, J.L.; Xu, J.; Zhang, H.C.; Wei, H.Y. Effects of planting methods on yield and quality of different types of japonica rice in northern Jiangsu plain, China. J. Integr. Agric. 2018, 17, 2624–2635. [Google Scholar] [CrossRef]
  20. Zhu, D.W.; Zhang, H.C.; Guo, B.W.; Xu, K.; Dai, Q.G.; Wei, C.X.; Zhou, G.S.; Huo, Z.Y. Effects of nitrogen level on structure and physicochemical properties of rice starch. Food Hydrocolloid. 2017, 63, 525–532. [Google Scholar] [CrossRef]
  21. Hu, Q.; Jiang, W.Q.; Qiu, S.; Xing, Z.P.; Hu, Y.J.; Guo, B.W.; Liu, G.D.; Gao, H.; Zhang, H.C.; Wei, H.Y. Effect of wide-narrow row arrangement in mechanical pot-seedling transplanting and plant density on yield formation and grain quality of japonica rice. J. Integr. Agric. 2020, 19, 1197–1214. [Google Scholar] [CrossRef]
  22. Wei, H.Y.; Zhu, Y.; Qiu, S.; Han, C.; Hu, L.; Xu, D.; Zhou, N.B.; Xing, Z.P.; Hu, Y.J.; Cui, P.Y.; et al. Combined effect of shading time and nitrogen level on grain filling and grain quality in japonica super rice. J. Integr. Agric. 2018, 17, 2405–2417. [Google Scholar] [CrossRef]
  23. Zhu, D.W.; Wei, H.Y.; Guo, B.W.; Dai, Q.G.; Wei, C.X.; Gao, H.; Hu, Y.J.; Cui, P.Y.; Li, M.; Huo, Z.Y.; et al. The effects of chilling stress after anthesis on the physicochemical properties of rice (Oryza sativa L) starch. Food Chem. 2017, 237, 936–941. [Google Scholar] [CrossRef] [PubMed]
  24. Zhou, T.Y.; Zhou, Q.; Li, E.P.; Yuan, L.M.; Wang, W.L.; Zhang, H.; Liu, L.J.; Wang, Z.Q.; Yang, J.C.; Gu, J.F. Effects of nitrogen fertilizer on structure and physicochemical properties of ‘super’ rice starch. Carbohyd. Polym. 2020, 239, 116237. [Google Scholar] [CrossRef]
  25. Chen, J.; Zhu, X.C.; Xie, J.; Deng, G.Q.; Tu, T.H.; Guan, X.J.; Yang, Z.; Huang, S.; Chen, X.M.; Qiu, C.F.; et al. Reducing nitrogen application with dense planting increases nitrogen use efficiency by maintaining root growth in a double-rice cropping system. Crop J. 2021, 9, 805–815. [Google Scholar] [CrossRef]
  26. Huang, M.; Chen, J.N.; Cao, F.B.; Zou, Y.B. Increased hill density can compensate for yield loss from reduced nitrogen input in machine-transplanted double-cropped rice. Field Crop. Res. 2018, 221, 333–338. [Google Scholar] [CrossRef]
  27. Hou, W.F.; Khan, M.R.; Zhang, J.L.; Lu, J.W.; Ren, T.; Cong, R.H.; Li, X.K. Nitrogen rate and plant density interaction enhances radiation interception, yield and nitrogen use efficiency of mechanically transplanted rice. Agric. Ecosyst. Environ. 2019, 269, 183–192. [Google Scholar] [CrossRef]
  28. Zheng, B.Q.; Fang, Q.; Zhang, C.X.; Mahmood, H.; Zhou, Q.; Li, W.Y.; Li, X.N.; Cai, J.; Wang, X.; Zhong, Y.X.; et al. Reducing nitrogen rate and increasing plant density benefit processing quality by modifying the spatial distribution of protein bodies and gluten proteins in endosperm of a soft wheat cultivar. Field Crop. Res. 2020, 253, 107831. [Google Scholar] [CrossRef]
  29. Peng, S.B.; Buresh, R.J.; Huang, J.L.; Zhong, X.H.; Zou, Y.B.; Yang, J.C.; Wang, G.H.; Liu, Y.Y.; Hu, R.F.; Tang, Q.Y.; et al. Improving nitrogen fertilization in rice by sitespecific N management. A review. Agron. Sustain. Dev. 2010, 30, 649–656. [Google Scholar] [CrossRef]
  30. Takai, T.; Matsuura, S.; Nishio, T.; Ohsumi, A.; Shiraiwa, T.; Hoire, T. Rice yield potential is closely related to crop growth rate during late reproductive period. Field Crop. Res. 2006, 96, 328–335. [Google Scholar] [CrossRef]
  31. Nkonge, C.; Ballance, G.M. A sensitive colorimetric procedure for nitrogen determination in micro-Kjeldahl digests. J. Agric. Food Chem. 1982, 30, 416–420. [Google Scholar] [CrossRef]
  32. Chen, X.; Xu, Y.; Hou, D.W.; Zhu, W.; Chen, X.Y.; Chen, P.R.; Du, X.F. Effect of heterogeneous protein distribution on in situ pasting properties of black rice starch. LWT-Food Sci. Technol. 2022, 153, 112388. [Google Scholar] [CrossRef]
  33. Laenoi, S.; Rerkasem, B.; Lordkaew, S.; Prom-u-thai, C. Seasonal variation in grain yield and quality in different rice varieties. Field Crop. Res. 2018, 221, 350–357. [Google Scholar] [CrossRef]
  34. Xu, Q.; Chen, W.F.; Xu, Z.J. Relationship between grain yield and quality in rice germplasms grown across different growing areas. Breeding Sci. 2015, 65, 226–232. [Google Scholar] [CrossRef]
  35. Hori, K.; Suzuki, K.; Lijima, K.; Ebana, K. Variation in cooking and eating quality traits in Japanese rice germplasm accessions. Breeding Sci. 2016, 66, 309–318. [Google Scholar] [CrossRef]
  36. Gayin, J.; Chandi, G.K.; Manful, J.; Seetharaman, K. Classification of rice based on statistical analysis of pasting properties and apparent amylose content: The case of Oryza glaberrima accessions from Africa. Cereal Chem. 2015, 92, 22–28. [Google Scholar] [CrossRef]
  37. Zhou, L.J.; Sheng, W.T.; Wu, J.; Zhang, C.Q.; Liu, Q.Q.; Deng, Q.Y. Differential expressions among five Waxy alleles and their effects on the eating and cooking qualities in specialty rice cultivars. J. Integr. Agric. 2015, 14, 1153–1162. [Google Scholar] [CrossRef]
  38. Huang, L.; Sreenivasulu, N.; Liu, Q.Q. Waxy editing: Olds meets new. Trends Plant Sci. 2020, 25, 963–966. [Google Scholar] [CrossRef]
  39. Hu, L.; Zhu, Y.; Xu, D.; Chen, Z.F.; Hu, B.Q.; Han, C.; Qiu, S.; Wu, P.; Zhang, H.C.; Wei, H.Y. Characteristics of good taste and high yield type of single cropping late japonica rice in southern China. Sci. Agric. Sin. 2019, 52, 215–227. (In Chinese) [Google Scholar]
  40. Nagarajan, S.; Jagadish, S.V.K.; Hari Prasad, A.S.; Thomar, A.K.; Anand, A.; Pal, M.; Agarwal, P.K. Local climate affects growth, yield and grain quality of aromatic and non-aromatic rice in northwestern India. Agric. Ecosyst. Environ. 2010, 138, 274–281. [Google Scholar] [CrossRef]
  41. Cui, Y.; Zhu, M.M.; Xu, Z.J.; Chen, W.F. The breeding of japonica rice in northern China: An 11-year study (2006–2016). J. Integr. Agric. 2020, 19, 1941–1946. [Google Scholar] [CrossRef]
  42. Zhang, H.; Xu, H.; Feng, M.; Zhu, Y. Suppression of OsMADS7 in rice endosperm stabilizes amylose content under high temperature stress. Plant Biotechnol. J. 2017, 16, 18–26. [Google Scholar] [CrossRef]
  43. Zhu, Y.; Xu, D.; Hu, L.; Hua, C.; Chen, Z.F.; Zhang, Z.Z.; Zhou, N.B.; Liu, G.D.; Zhang, H.C.; Wei, H.Y. Characteristics of medium-maturity conventional japonica rice with good taste and high yield in Jianghuai area. Acta Agron. Sin. 2019, 45, 578–588. (In Chinese) [Google Scholar] [CrossRef]
  44. Meng, T.Y.; Zhang, X.B.; Ge, J.L.; Chen, X.; Yang, Y.L.; Zhu, G.L.; Chen, Y.L.; Zhou, G.S.; Wei, H.H.; Dai, Q.G. Agronomic and physiological traits facilitating better yield performance of japonica/indica hybrids in saline fields. Field Crop. Res. 2021, 271, 108255. [Google Scholar] [CrossRef]
  45. Yang, J.C.; Wang, Z.Q.; Liu, L.J.; Zhu, Q.S. Postanthesis water deficits enhance grain filling in two-line hybrid rice. Crop Sci. 2003, 43, 2099–2108. [Google Scholar] [CrossRef]
  46. Falade, K.O.; Semon, M.; Fadairo, O.S.; Oladunjoye, A.O.; Orou, K.K. Functional and physico-chemical properties of flours and starches of African rice cultivars. Food Hydrocolloid. 2014, 39, 41–50. [Google Scholar] [CrossRef]
  47. Feng, F.; Li, Y.; Qin, X.; Liao, Y.; Siddique, K.H.M. Changes in rice grain quality of indica and japonica type varieties released in China from 2000 to 2014. Front. Plant Sci. 2017, 8, 1863. [Google Scholar] [CrossRef]
  48. Zeng, Y.; Tan, X.; Zeng, Y.; Xie, X.; Pan, X.; Shi, Q.; Zhang, J. Changes in the rice grain quality of different high-quality rice varieties released in southern China from 2007 to 2017. J. Cereal Sci. 2019, 87, 111–116. [Google Scholar] [CrossRef]
  49. Meng, T.Y.; Zhang, X.B.; Chen, X.; Ge, J.L.; Zhou, G.S.; Wei, H.H.; Dai, Q.G. Trends in grain quality and responses to nitrogen application of japonica inbred rice released after the 1980s. Cereal Chem. 2022, 99, 503–519. [Google Scholar] [CrossRef]
  50. Huang, S.J.; Zhao, C.F.; Zhu, Z.; Zhou, L.H.; Zheng, Q.H.; Wang, C.L. Characterization of eating quality and starch properties of two Wx alleles japonica rice cultivars under different nitrogen treatments. J. Integr. Agric. 2020, 19, 988–998. [Google Scholar] [CrossRef]
  51. Bryant, R.J.; Anders, M.; McClung, A. Impact of production practices on physicochemical properties of rice grain quality. J. Sci. Food Agric. 2011, 92, 564–569. [Google Scholar] [CrossRef] [PubMed]
  52. Park, J.W.; Kim, S.S.; Kim, K.O. Effect of milling ratio on sensory properties of cooked rice and on physicochemical properties of milled and cooked rice. Cereal Chem. 2001, 78, 151–156. [Google Scholar] [CrossRef]
  53. Xu, Y.J.; Ying, Y.N.; Ouyang, S.H.; Duan, X.L.; Sun, H.; Jiang, S.K.; Sun, S.C.; Bao, J.S. Factors affecting sensory quality of cooked japonica rice. Rice Sci. 2018, 25, 330–339. [Google Scholar]
  54. Xiong, R.Y.; Xie, J.X.; Chen, L.M.; Yang, T.T.; Tan, X.M.; Zhou, Y.J.; Pan, X.H.; Zeng, Y.J.; Shi, Q.H.; Zhang, J.; et al. Water irrigation management affects starch structure and physicochemical properties of indica rice with different grain quality. Food Chem. 2021, 347, 129045. [Google Scholar] [CrossRef]
  55. Cheng, F.M.; Zhong, L.J.; Wang, F.; Zhang, G.P. Differences in cooking and eating properties between chalky and translucent parts in rice grains. Food Chem. 2005, 90, 39–46. [Google Scholar] [CrossRef]
  56. Zhu, L.; Wu, G.C.; Cheng, L.L.; Zhang, H.; Wang, L.; Qian, H.F.; Qi, X.G. Investigation on molecular and morphology changes of protein and starch in rice kernel during cooking. Food Chem. 2020, 316, 126262. [Google Scholar] [CrossRef] [PubMed]
Figure 1. SPAD values across top three leaves after heading of cultivar types under two cultivation treatments. DAH, days after heading. LCP, local cultivation practices; DNID, reduced nitrogen rate with increased planting density. HYSP, high yield rice with superior palatability; HYIP, high yield rice with inferior palatability. Vertical bars represent mean ± standard error (n = 6). Values followed by different letters across the two years on average indicate statistical significance at the 0.05 probability level based on the LSD test.
Agriculture 12 01292 g001
Figure 2. Milling quality (ac) and appearance quality (df) of cultivar types under two cultivation treatments across the two years. LCP, local cultivation practices; DNID, decreased nitrogen rate with increased planting density. HYSP, high yield rice with superior palatability; HYIP, high yield rice with inferior palatability. Vertical bars represent mean ± standard error (n = 6). Values followed by different letters across the two years on average indicate statistical significance at the 0.05 probability level based on the LSD test.
Agriculture 12 01292 g002aAgriculture 12 01292 g002b
Figure 3. Amylose (a), amylopectin (b), total starch (c), and protein (d) contents of cultivar types under two cultivation treatments across the two years. LCP, local cultivation practices; DNID, decreased nitrogen rate with increased planting density. HYSP, high yield rice with superior palatability; HYIP, high yield rice with inferior palatability. Vertical bars represent mean ± standard error (n = 6). Values followed by different letters across the two years on average indicate statistical significance at the 0.05 probability level based on the LSD test.
Agriculture 12 01292 g003aAgriculture 12 01292 g003b
Figure 4. Gel consistency (a), hardness (b), stickiness (c), and overall palatability (d) of rice cultivar types under two cultivation treatments across the two years. LCP, local cultivation practices; DNID, decreased nitrogen rate with increased planting density. HYSP, high yield rice with superior palatability; HYIP, high yield rice with inferior palatability. Vertical bars represent mean ± standard error (n = 6). Values followed by different letters across the two years on average indicate statistical significance at the 0.05 probability level based on the LSD test.
Agriculture 12 01292 g004aAgriculture 12 01292 g004b
Table 1. The detailed information on nitrogen rate and planting density under two cultivation treatments.
YearCultivation TreatmentNitrogen Application Rate (kg ha−1)Planting Density
Total RateOne Day before TransplantingOne Week after TransplantingPanicle InitiationPenultimate-Leaf AppearanceHill SpacingSeedling per HillSeeding per m2
2018LCP3009090606030 cm × 12 cm495
DNID2559060604525 cm × 12 cm4115
2019LCP3009090606030 cm × 12 cm495
DNID2559060604525 cm × 12 cm4115
LCP, local cultivation practices; DNID, decreased nitrogen rate with increased planting density.
Table 2. Analysis of variance (ANOVA) of grain yield and rice palatability among year, cultivation treatment, cultivar type, and the interactions.
SourcedfGrain YieldNUEg1000-Kernel WeightShoot
Biomass Weight
NSC
Content
LAIOverall
Palatability
Amylose ContentProtein ContentPeak
Viscosity
Break-DownSet-BackTp∆Hgel
Maturity Stage
Year1ns*nsnsnsnsnsnsnsnsnsnsnsns
Cultivation treatment1ns***********ns************
Cultivar type1ns***ns********ns**********
Year × Cultivation treatment3nsnsnsnsnsnsnsnsnsnsnsnsnsns
Year × Cultivar type3nsnsnsnsnsnsnsnsnsnsnsnsnsns
Cultivation treatment
× Cultivar type
3nsnsnsnsnsns*nsnsns**nsns
Year × Cultivation treatment × Cultivar type7nsnsnsnsnsnsnsnsnsnsnsnsnsns
Total23
ns, non-significance, *, and **, significant at 0.05 and 0.01 probability levels, respectively.
Table 3. Grain yield, total N accumulation, and N-use efficiency of cultivar types under two cultivation treatments.
Cultivation
Treatment
Cultivar
Type
Grain Yield
(t ha−1)
Total N Accumulation
(kg ha−1)
NUEg
(kg kg−1)
PFPN
(kg kg−1)
LCPHYSP10.3 ± 0.1 a265 ± 7 a39.0 ± 1.1 c34.3 ± 0.4 b
HYIP10.3 ± 0.2 a252 ± 12 b40.8 ± 1.3 b34.1 ± 0.5 b
DNIDHYSP10.2 ± 0.1 a232 ± 9 c44.0 ± 0.9 a40.0 ± 0.4 a
HYIP10.2 ± 0.2 a228 ± 9 c44.5 ± 1.2 a39.8 ± 0.7 a
Analysis of variance (ANOVA)
Cultivation treatmentns******
Cultivar typensns*ns
Cultivation treatment × Cultivar typensnsnsns
LCP, local cultivation practices; DNID, decreased nitrogen rate with increased planting density. HYSP, high-yielding rice with superior palatability; HYIP, high-yielding rice with inferior palatability. NUEg, N utilization efficiency for grain yield; PFPN, partial factor productivity of nitrogen. Values are mean ± standard error (n = 6). Values followed by different letters indicate statistical significance at the 0.05 probability level across the two years on average and the same column based on the LSD test. In the ANOVA, ns, not significant; * and **, significant at the 0.05 and 0.01 probability level according to the LSD test, respectively.
Table 4. Grain yield components of cultivar types under two cultivation treatments.
Cultivation
Treatment
Cultivar
Type
Panicles per m2Spikelets per
Panicle
Spikelets per m2
(×103)
Filled-Grain PERCENTAGE
(%)
1000-Kernel Weight (g)
LCPHYSP318 ± 10 b138 ±6 b43.8 ± 1.5 a89.5 ± 0.6 b25.4 ± 0.3 d
HYIP293 ± 7 c146 ± 7 a42.8 ± 1.2 a90.1 ± 0.3 ab26.6 ± 0.2 b
DNIDHYSP330 ± 9 a132 ± 5 b43.6 ± 1.4 a90.8 ± 0.4 a26.1 ± 0.3 c
HYIP309 ± 8 b139 ± 5 b42.9 ± 1.1 a90.0 ± 1.3 ab27.0 ± 0.3 a
Analysis of variance (ANOVA)
Cultivation treatment***ns**
Cultivar type*****ns**
Cultivation treatment × Cultivar typensns*nsns
LCP, local cultivation practices; DNID, decreased nitrogen rate with increased planting density. HYSP, high-yielding rice with superior palatability; HYIP, high-yielding rice with inferior palatability. Values are mean ± standard error (n = 6). Values followed by different letters indicate statistical significance at the 0.05 probability level across the two years on average and the same column based on the LSD test. In the ANOVA, ns, not significant; * and **, significant at the 0.05 and 0.01 probability level according to the LSD test, respectively.
Table 5. Shoot biomass weight and accumulation, and harvest index of cultivar types under two cultivation treatments.
Cultivation
Treatment
Cultivar
Type
Shoot Biomass Weight (t ha−1)Shoot Biomass Accumulation (t ha−1)Harvest Index
JointingHeadingMaturityJointing-
Heading
Heading-Maturity
LCPHYSP4.6 ± 0.2 b11.5 ± 0.2 a18.5 ± 0.2 a7.0 ± 0.3 a7.0 ± 0.2 a0.482 ± 0.005 b
HYIP4.9 ± 0.2 a11.5 ± 0.4 a18.1 ± 0.2 b6.6 ± 0.3 ab6.7 ± 0.3 b0.490 ± 0.004 a
DNIDHYSP4.3 ± 0.2 c11.0 ± 0.3 b17.9 ± 0.2 bc6.7 ± 0.3 ab7.0 ± 0.2 ab0.494 ± 0.007 a
HYIP4.7 ± 0.2 b11.1 ± 0.3 b17.8 ± 0.2 c6.4 ± 0.2 b6.7 ± 0.1 b0.493 ± 0.004 a
Analysis of variance (ANOVA)
Cultivation treatment******nsns**
Cultivar type**ns*****ns
Cultivation treatment × Cultivar typensnsnsnsnsns
LCP, local cultivation practices; DNID, decreased nitrogen rate with increased planting density. HYSP, high-yielding rice with superior palatability; HYIP, high-yielding rice with inferior palatability. Values are mean ± standard error (n = 6). Values followed by different letters indicate statistical significance at the 0.05 probability level across the two years on average and the same column based on the LSD test. In the ANOVA, ns, not significant; * and **, significant at the 0.05 and 0.01 probability level according to the LSD test, respectively.
Table 6. NSC content in the stem and NSC remobilization reserve of cultivar types under two cultivation treatments.
Cultivation
Treatment
Cultivar
Type
NSC Content (g m−2)NSC Remobilization Reserve (%)
HeadingMaturity
LCPHYSP334 ± 14 a180 ± 10 a46.3 ± 1.2 b
HYIP314 ± 10 b163 ± 6 b48.1 ± 1.1 c
DNIDHYSP317 ± 13 b144 ± 9 c54.5 ± 1.5 a
HYIP278 ± 10 c131 ± 9 d52.8 ± 1.3 b
Analysis of variance (ANOVA)
Cultivation treatment******
Cultivar type****ns
Cultivation treatment × Cultivar typensns*
NSC, non-structural carbohydrate. LCP, local cultivation practices; DNID, decreased nitrogen rate with increased planting density. HYSP, high-yielding rice with superior palatability; HYIP, high-yielding rice with inferior palatability. Values are mean ± standard error (n = 6). Values followed by different letters indicate statistical significance at the 0.05 probability level across the two years on average and the same column based on the LSD test. In the ANOVA, ns, not significant; * and **, significant at the 0.05 and 0.01 probability level according to the LSD test, respectively.
Table 7. LAI at the main growth stages of cultivar types under two cultivation treatments.
Cultivation
Treatment
Cultivar
Type
LAI (m2 m−2)
JointingHeadingMaturity
LCPHYSP3.7 ± 0.2 a7.7 ± 0.3 a2.8 ± 0.2 a
HYIP3.7 ± 0.3 a7.7 ± 0.2 a2.5 ± 0.2 b
DNIDHYSP3.5 ± 0.2 a7.5 ± 0.2 ab2.6 ± 0.2 b
HYIP3.7 ± 0.2 a7.4 ± 0.2 b2.2 ± 0.2 c
Analysis of variance (ANOVA)
Cultivation treatmentns****
Cultivar typensns**
Cultivation treatment × Cultivar typensnsns
LAI, leaf area index. LCP, local cultivation practices; DNID, decreased nitrogen rate with increased planting density. HYSP, high-yielding rice with superior palatability; HYIP, high-yielding rice with inferior palatability. Values are mean ± standard error (n = 3). Values followed by different letters indicate statistical significance at the 0.05 probability level across the two years on average and the same column based on the LSD test. In the ANOVA, ns, not significant; **, significant at the 0.01 probability level according to the LSD test.
Table 8. Starch granule size distribution of rice cultivar types under two cultivation treatments.
Cultivation TreatmentCultivar
Type
Small Starch Granule Ratio
(<2 µm) (%)
Medium Starch Granule Ratio
(2–10 µm) (%)
Large Starch Granule
Ratio (>10 µm) (%)
LCPHYSP13.6 ± 0.4 a79.4 ± 0.5 b7.0 ± 0.5 a
HYIP14.0 ± 0.4 a79.4 ± 0.3 b6.5 ± 0.3 a
DNIDHYSP14.4 ± 0.5 ab80.6 ± 0.4 a5.2 ± 0.5 b
HYIP14.8 ± 0.6 a80.5 ± 0.4 a4.8 ± 0.4 b
Analysis of variance (ANOVA)
Cultivation treatmentns****
Cultivar typensnsns
Cultivation treatment × Cultivar typensnsns
LCP, local cultivation practices; DNID, decreased nitrogen rate with increased planting density. HYSP, high-yielding rice with superior palatability; HYIP, high-yielding rice with inferior palatability. Values are mean ± standard error (n = 6). Values followed by different letters indicate statistical significance at the 0.05 probability level across the two years on average and the same column based on the LSD test. In the ANOVA, ns, not significant; **, significant at the 0.01 probability level according to the LSD test.
Table 9. Pasting properties of rice cultivar types under two cultivation treatments.
Cultivation TreatmentCultivar
Type
Peak Viscosity
(cP)
Hot Viscosity
(cP)
Cool Viscosity
(cP)
Breakdown
(cP)
Setback
(cP)
LCPHYSP2679 ± 64 b1973 ± 76 b2485 ± 53 a706 ± 24 b−176 ±29 c
HYIP2279 ± 18 d1868 ± 40 c2408 ± 77 b411 ± 44 d108 ± 52 a
DNIDHYSP2945 ± 24 a2030 ± 30 ab2477 ± 15 a941 ± 31 a−480 ± 44 d
HYIP2599 ± 49 c2047 ± 66 a2514 ± 58 a552 ± 43 c−52 ± 21 b
Analysis of variance (ANOVA)
Cultivation treatment*********
Cultivar type**nsns****
Cultivation treatment × Cultivar typensns***
LCP, local cultivation practices; DNID, decreased nitrogen rate with increased planting density. HYSP, high-yielding rice with superior palatability; HYIP, high-yielding rice with inferior palatability. Values are mean ± standard error (n = 6). Values followed by different letters indicate statistical significance at the 0.05 probability level across the two years on average and the same column based on the LSD test. In the ANOVA, ns, not significant; *, significant at the 0.05 probability level according to the LSD test; **, significant at the 0.01 probability level according to the LSD test.
Table 10. Thermal properties of rice cultivar types under two cultivation treatments.
Cultivation TreatmentCultivar
Type
To (°C)Tp (°C)Tc (°C)∆Hgel (J g−1)∆Hret (J g−1)%R
LCPHYSP64.1 ± 0.5 a68.5 ± 0.8 a73.9 ± 1.0 a11.4 ± 0.2 a1.4 ± 0.1 c12.1 ± 1.1 b
HYIP63.2 ± 0.9 ab66.8 ± 1.2 b72.5 ± 1.4 ab10.9 ± 0.2 b2.0 ± 0.1 a18.2 ± 1.2 a
DNIDHYSP62.3 ± 0.7 b66.6 ± 0.9 b72.0 ± 1.1 b11.0 ± 0.1 b1.2 ± 0.1 d11.2 ± 1.0 b
HYIP61.1 ± 0.9 c63.6 ± 1.6 c70.2 ± 1.5 c10.5 ± 0.2 c1.8 ± 0.1 b17.4 ± 1.3 a
Analysis of variance (ANOVA)
Cultivation treatment*******nsns
Cultivar type***********
Cultivation treatment × Cultivar typensnsnsnsns*
LCP, local cultivation practices; DNID, decreased nitrogen rate with increased planting density. HYSP, high-yielding rice with superior palatability; HYIP, high-yielding rice with inferior palatability. To, onset temperature; Tp, peak of gelatinization temperature; Tc, conclusion temperature; ΔHgel, gelatinization enthalpy; ΔHret, retrogradation enthalpy; %R, retrogradation percentage. Values are mean ± standard error (n = 6). Values followed by different letters indicate statistical significance at the 0.05 probability level across the two years on average and the same column based on the LSD test. In the ANOVA, ns, not significant; *, significant at the 0.05 probability level according to the LSD test; **, significant at the 0.01 probability level according to the LSD test.
Table 11. Correlations between the determined traits and grain yield and overall palatability under two cultivation treatments.
The Determined ParametersLCPDNID
Grain YieldOverall PalatabilityGrain YieldOverall Palatability
Panicle per m20.260.77 **0.220.73 **
Shoot biomass weight at maturity0.74 **0.81 **0.62 *0.68 *
Shoot biomass accumulation from heading to maturity0.68 *0.67 *0.68 *0.66 *
NSC at heading0.62 *0.88 **0.62 *0.96 **
NSC at maturity0.350.93 **0.63 *0.82 **
NSC remobilization reserve0.25−0.240.73 **0.75 **
LAI at heading0.540.560.070.60 *
LAI at maturity0.62 *0.89 **0.66 *0.91 **
SPAD at 40 DAH0.62 *0.94 **0.560.92 **
SPAD at 50 DAH0.65 *0.90 **0.65 *0.93 **
Amylose content−0.30−0.89 **−0.32−0.92 **
Amylopectin content0.430.83 **0.340.87 **
Total starch content0.510.530.290.60 *
Protein content0.30−0.68 *0.38−0.72 **
Gel consistency0.140.79 **0.190.91 **
Hardness−0.14−0.78 **−0.18−0.82 **
Stickiness0.320.80 **0.290.83 **
Medium starch granule ratio (2–10 µm)−0.240.55−0.050.66 *
Large starch granule ratio (>10 µm)0.16−0.50−0.03−0.62 *
Peak viscosity0.310.79 **0.200.80 **
Breakdown0.370.84 **0.240.88 **
Setback−0.24−0.82 **−0.29−0.86 **
To (°C)0.340.74 **0.460.81 **
Tp (°C)0.530.67 *0.430.71 **
Tc (°C)0.440.72 **0.510.62 *
∆Hgel−0.040.470.010.72 **
∆Hret−0.36−0.97 **−0.26−0.96 **
%R−0.32−0.96 **−0.24−0.96 **
LCP, local cultivation practices; DNID, decreased nitrogen rate with increased planting density. NSC, non-structural carbohydrate; LAI, leaf area index; DAH, days after heading; To, onset temperature; Tp, peak of gelatinization temperature; Tc, conclusion temperature; ΔHgel, gelatinization enthalpy; ΔHret, retrogradation enthalpy; %R, retrogradation percentage. *, significant at the 0.05 probability level, and **, significant at the 0.01 probability level, according to the LSD test.
Publisher’s Note: MDPI stays neutral with regard to jurisdictional claims in published maps and institutional affiliations.

