Abstract
The object detection algorithm is one of the core technologies of the intelligent rubber tapping robot, but most of the existing detection algorithms cannot effectively meet the tapping trajectory detection of natural rubber trees in the complex forest environment. This paper proposes a tapping trajectory detection method for natural rubber trees based on an improved YOLOv5 model to accomplish fast and accurate detection. Firstly, the coordinate attention (CA) mechanism is added to the Backbone network to embed the location information into the channel attention, which effectively improves the detection accuracy. Secondly, a module called convolution and GhostBottleneck (CGB) is designed, based on the Ghost module, to substitute the Cross Stage Partial Network (CSP) module in the Neck network, which ensures the detection accuracy while reducing model parameters. Finally, the EIoU loss function is introduced to enable a more accurate regression of the model. The experimental results show that the overall performance of the YOLOv5-CCE model outperforms the original YOLOv5 and other classical lightweight detection algorithms. Compared with the original YOLOv5 model, the YOLOv5-CCE model has a 2.1% improvement in mAP value, a 2.5% compression of model parameters, and a 7.0% reduction in the number of floating point operations (FLOPs). Therefore, the improved model can fully meet the requirements of real-time detection, providing a robust detection method for rubber tapping robots.
1. Introduction
Natural rubber is one of the most important industrial raw materials and strategic resources in the world, with a planting area of over 15.4 million hectares and a total output of about 13.9 million tons [1,2,3]. Natural rubber not only has excellent plasticity, resilience, insulation, abrasive resistance, and other physical properties, but also has acid resistance, alkali resistance, oil resistance, heat resistance, cold resistance, and other characteristics after treatment. Therefore, it is widely used in national defense, aerospace, transportation, people’s livelihoods, and other fields [4,5,6]. More than 98% of natural rubber comes from Hevea brasiliensis [7]. At present, the most effective way to extract raw rubber mainly relies on manual rubber tapping, and the cost accounts for about 70% of the management cost of the entire rubber plantation [8,9]. In recent years, with the reduction in the total agricultural labor force and the accelerated aging of the population, the outflow of rubber tapping workers has intensified. It has become more difficult to recruit and train new rubber workers, resulting in a serious shortage of rubber workers. At the same time, the price of raw rubber continues to decline and labor costs continue to increase, which has led to the sustained growth of natural rubber production costs. These factors, in addition to the increasingly serious phenomenon of abandoned tapping and management of rubber forests, have led to a serious shortage of raw rubber production capacity [10,11,12]. Thus, the development of intelligent tapping equipment for automated and intelligent tapping operations is an effective way to increase the output of natural rubber [13]. Accurately detecting the rubber tapping trajectory is the primary condition for realizing intelligent rubber tapping. The rubber tapping trajectory is a spiral line formed by the rubber tapping knife, which is composed of the tapping area, start point and end point. Whether the rubber tapping trajectory is appropriate or not will affect the raw rubber output and rubber tapping life. However, in the natural environment, the light conditions of rubber forests are complex and changeable, and the characteristics of objects are similar to surrounding environments, which makes it difficult for intelligent tapping equipment to accurately detect the rubber tapping trajectory.
To date, domestic and foreign researchers have carried out numerous research on object detection methods, including traditional object detection methods and object detection methods based on deep learning. Traditional object detection methods mainly rely on color and other feature information by processing images with artificial predesigned filters to achieve the effect of object detection [14,15,16,17]. V.K. et al. [18] proposed a rice disease classification method and only used color features to identify object information. H. et al. [19] used the OTSU algorithm to mask out green pixels, and used texture effects to classify diseases. K.J. et al. [20] used Haar features to identify the location of rice diseases, and used the k-nearest neighbor algorithm to identify disease types. Traditional methods have achieved some results, but also exposed the inherent drawbacks. Firstly, region selection with sliding windows results in high time complexity and window redundancy [21]. Secondly, the variety of appearance, the uncertainty of illumination changes, and the diversity of backgrounds lead to low robustness and poor generalization of traditional object detection methods. Finally, the complicated algorithm steps lead to a slow detection efficiency and low accuracy [22].
To further improve the accuracy, researchers have introduced object detection methods based on deep learning. They possess better abstract feature learning abilities to extract high-level semantic feature information, and their accuracy and performance are better than the traditional methods. The object detection method based on deep learning is mainly divided into one-stage object detection algorithms based on regression, and two-stage object detection algorithms based on candidate region.
The two-stage object detection algorithms mainly include R-CNN [23], SPP-Net [24], Fast R-CNN series [25,26], and Mask R-CNN [27], which firstly select candidate regions which may contain targets in the input image, and then conduct classification and regression on the candidate regions to obtain the detected objects. Zhou et al. [28] proposed an improved Faster-RCNN model to detect and count the number of ripe strawberries in greenhouses. The minimum outer rectangle method was used to evaluate the fullness of strawberries. The detection accuracy reached 86.0% and the average IoU was 89.2%. Jiang et al. [29] established a target object grab setting model using multiple targets and anchoring frames, which overcame environmental interference factors. The performance of model detection was improved by adding the small-scale anchor frame to capture object position detection in small areas, and the detection accuracy reached 94.3%. Ilyas et al. [30] proposed a method for strawberry fruit counting and maturity detection that combined semantic graphics and a full convolutional neural network (FCN). It recalibrated the object according to the importance of feature mapping, and enhanced the robustness of the network. The detection accuracy reached 88.6%. Although the above methods have obtained high accuracy, they have many model parameters and a large number of calculations, which cannot meet the application requirements of small mobile devices.
The one-stage object detection algorithms mainly include SDD [31] and YOLO series [32,33,34,35,36], which omit the generation stage of candidate regions and directly obtain the classification and location information of objects. Yang et al. [37] proposed an object detection method based on RetinaNet and rotatable anchor boxes (RBOX). A feature pyramid network based on the task-focused mechanism decoupled the feature optimization process for different tasks, alleviated conflicts between different learning objectives, and improved the average accuracy by 13.3%. Wang et al. [38] proposed a disease detection method based on YOLOv5, which uses the improved attention submodule (ISAM) mechanism to improve the accuracy, and uses the Ghost network to reduce the model parameters, with an accuracy rate of 92.7%. The above algorithms have a lightweight network structure, faster inference speed, smaller memory footprint, and stronger practicability. To date, the YOLOv5 network is widely used in the detection of fruit [39,40,41,42], crop [43,44,45], and plant diseases [20,38,46,47,48]. It can flexibly control the model size while improving accuracy, takes up less memory and satisfies the detection of object information in a complex rubber forest environment.
In this paper, a tapping trajectory detection method for natural rubber trees based on improved YOLOv5-CCE is proposed by combining the CA mechanism, the Ghost module, and the EIOU loss function. The improved YOLOv5-CCE model highlights the feature information of the detected object and enhances the expression ability of network learning features. The detection performance is improved, and the model parameters are reduced whilst maintaining the original YOLOv5 model detection speed. The method can achieve the rapid detection of tapping trajectory in complex environments, provide a theoretical foundation for the tapping trajectory detection of natural rubber trees, as well as the follow-up development of intelligent tapping equipment.
The structure of this article is as follows: Section 2 makes an image data set and describes the experimental procedure. Section 3 briefly introduces the original YOLOv5 model and proposes an improved YOLOv5-CCE network method. Section 4 compares and analyzes the experimental results. To finish, the conclusions of this paper and suggestions for the direction of future works are put forward in Section 5.
2. Materials and Methods
2.1. Image Acquisition
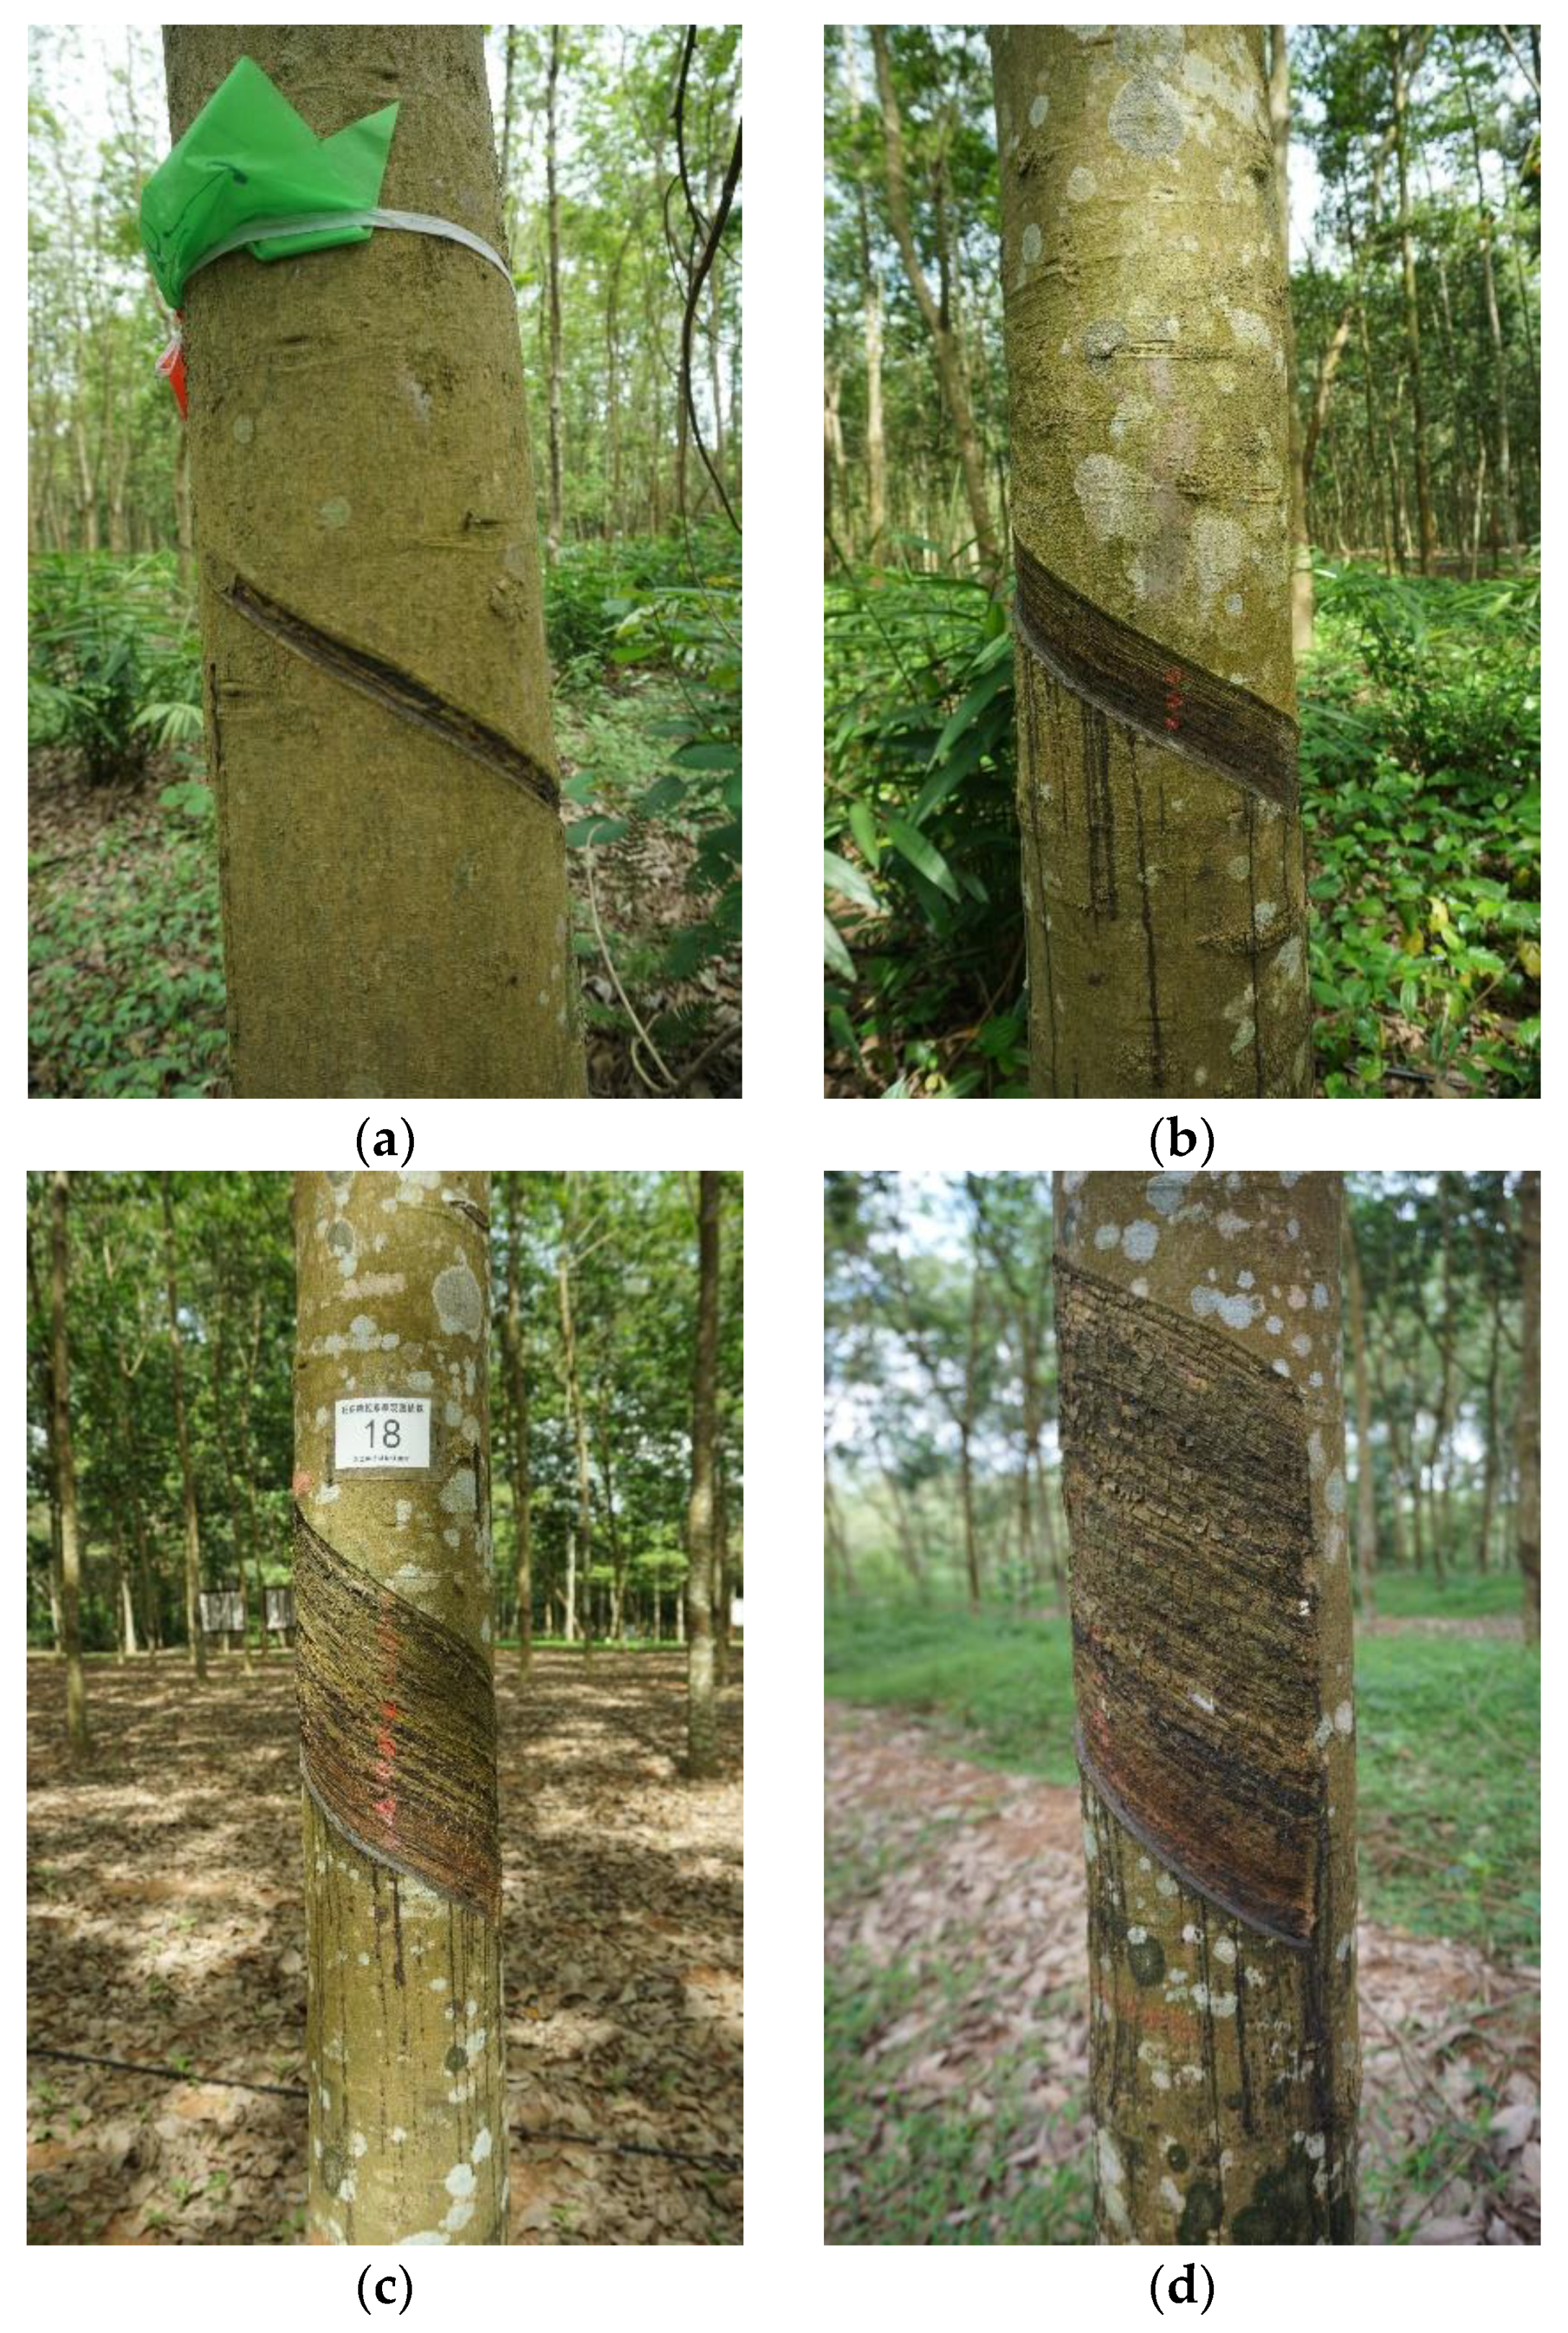
In this experiment, the research objects were adult rubber trees, as shown in Figure 1. The original images of the natural rubber tapping trajectory were collected from the national natural rubber forest, located in Danzhou City, Hainan Province, China (19°30′ N, 109°29′ E). The average annual temperature is 21 °C~29 °C, and the average annual precipitation is 1815 mm. The image acquisition device used was a Sony Alpha 6000 camera, using a CMOS sensor with an APS-C frame of 23.5 mm × 15.6 mm and an image resolution of 3000 × 4000 pixels. A total of 2000 images were collected. To ensure the representativeness of the data set, images were collected in three forests and under different natural light conditions. To avoid the overfitting phenomenon caused by insufficient sample diversity, four tapping stages were considered for sampling, including pre-tapping, one-year tapping age, three-year tapping age, and five-year tapping age.

Figure 1.
The original images of natural rubber tapping trajectory. (a) Pre-tapping, (b) One-year tapping age, (c) Three-year tapping age, (d) Five-year tapping age.
2.2. Image Enhancement
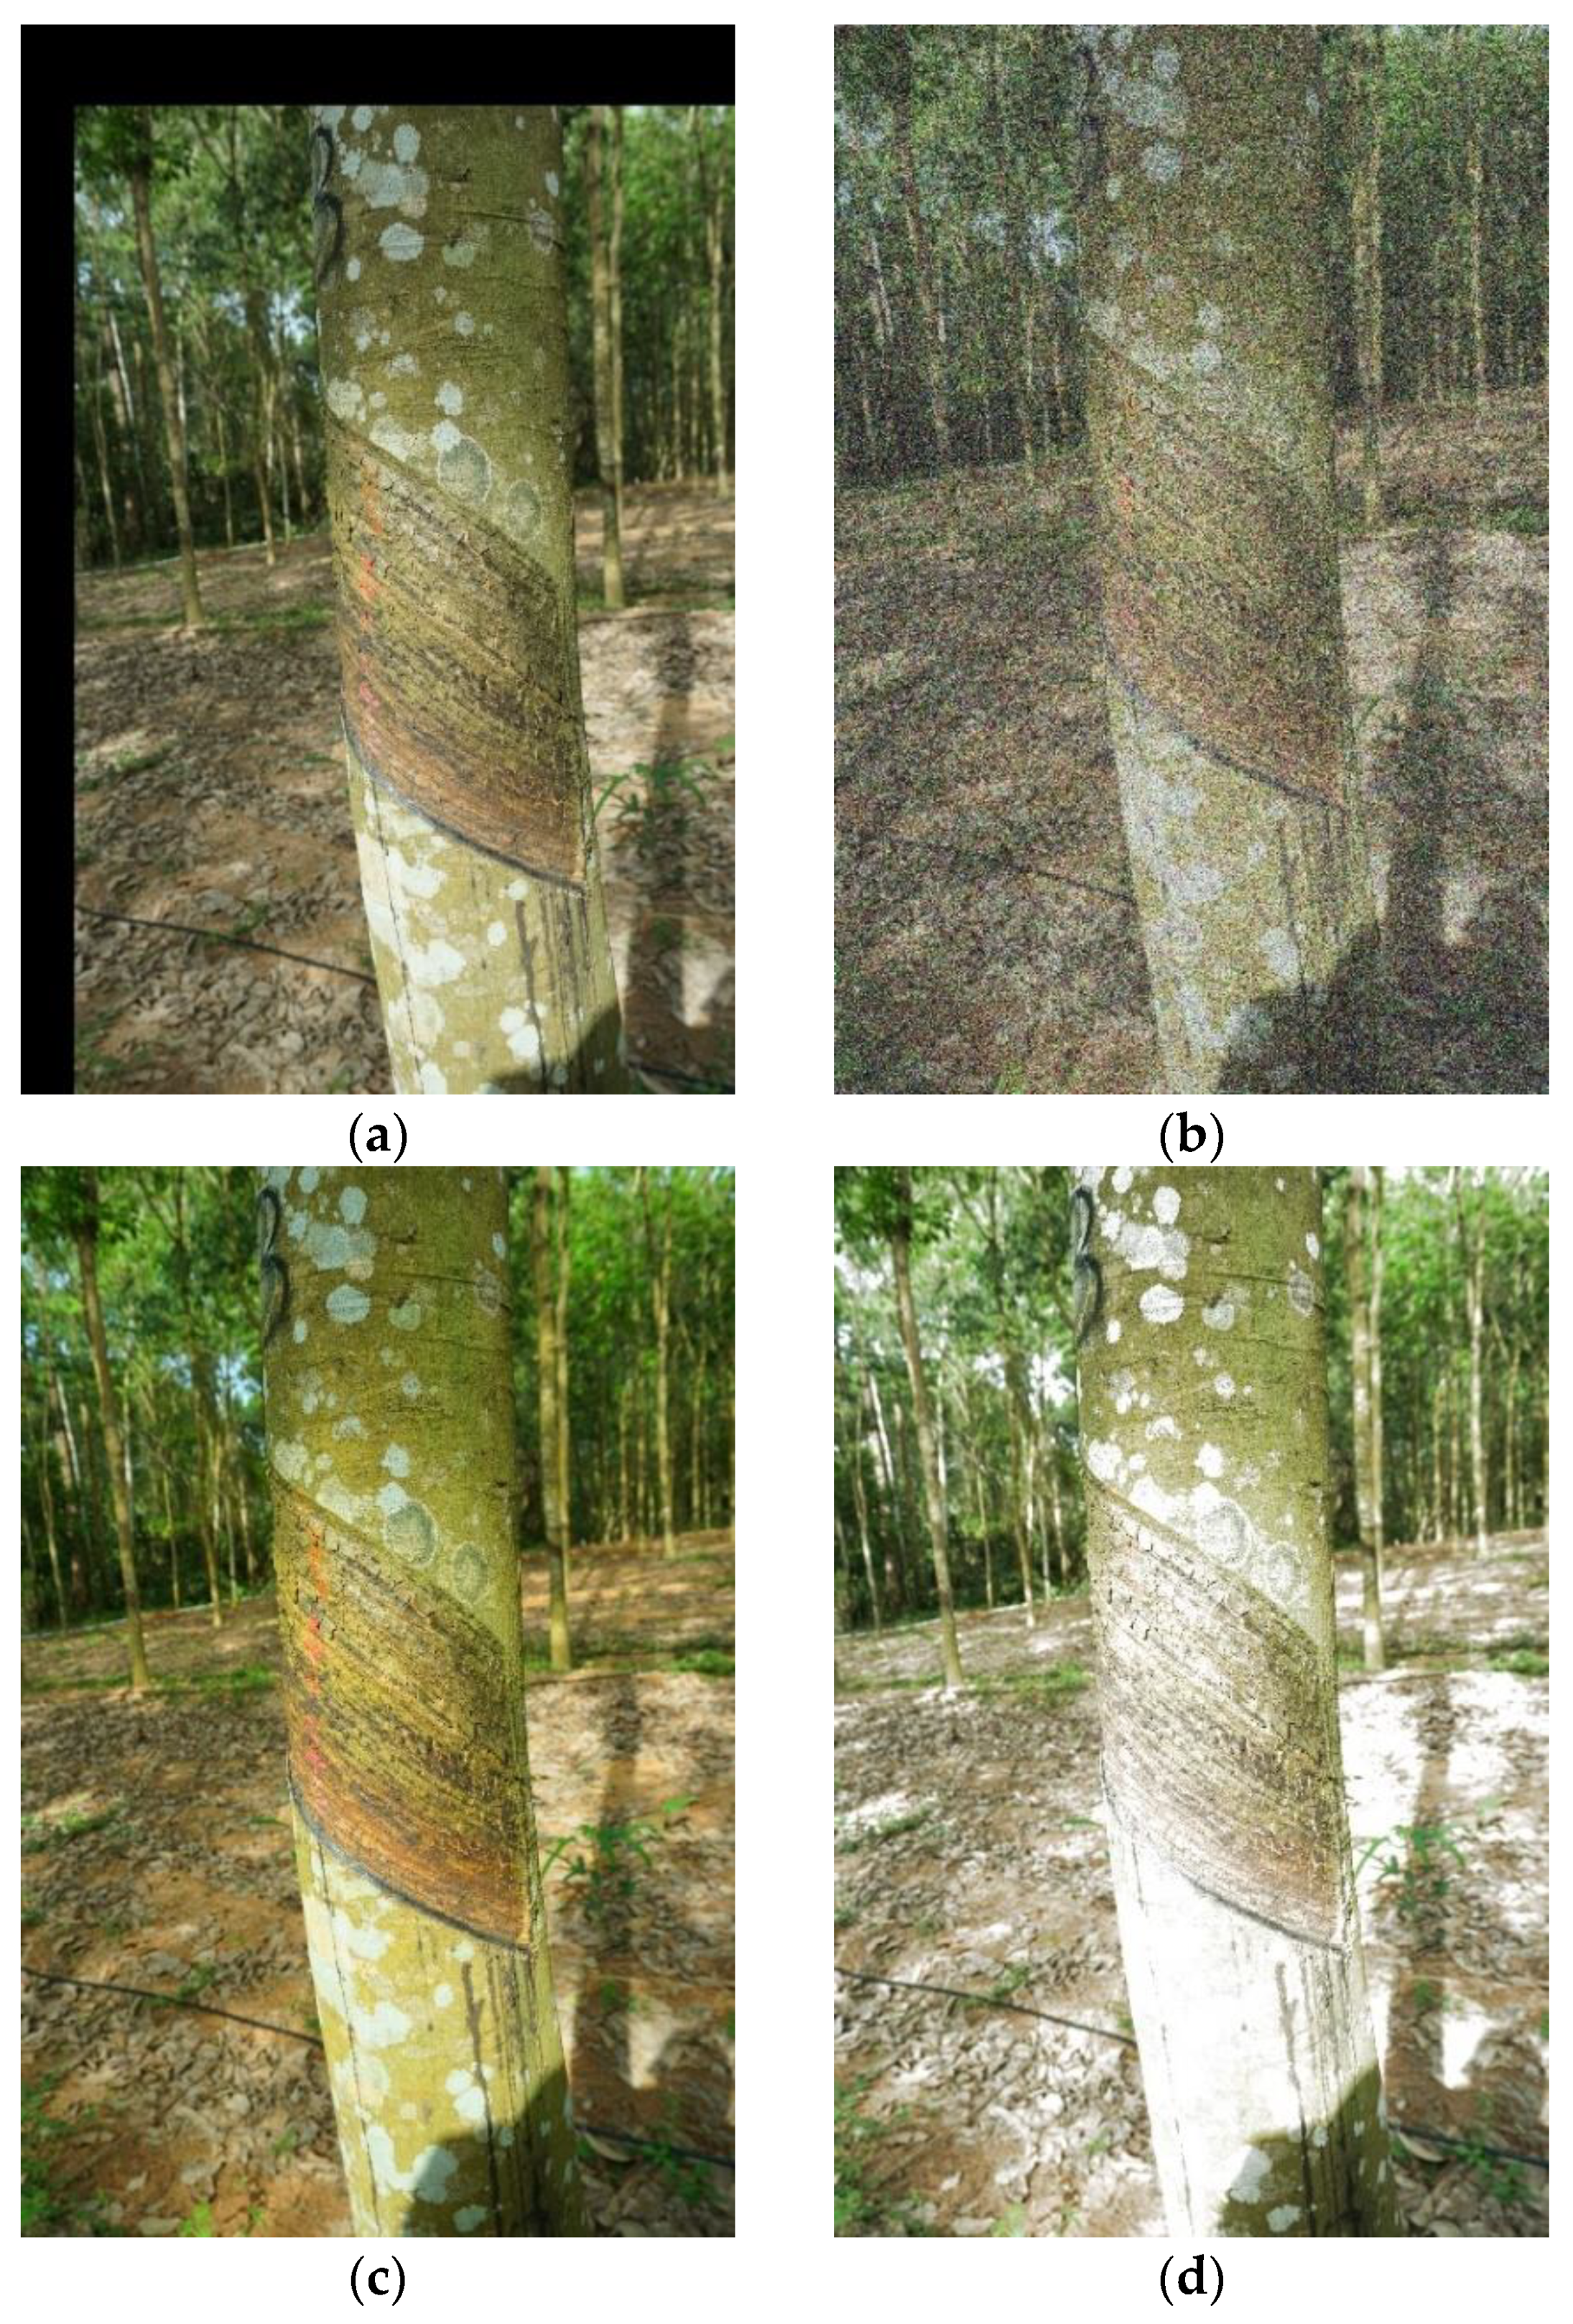
Training object detection models based on deep learning require a great deal of image data. In this paper, in order to obtain an abundant data set to better extract image feature information and enhance the generalization ability of the model, multiple enhancement operations were performed on the described original images, including rotation, random translation, adding noise, adjusting saturation, and adjusting brightness, as shown in Figure 2. Random translation and adding noise can improve the detection performance and robustness of the network. Adjusting saturation and brightness can eliminate the impact of brightness bias due to ambient lighting changes and sensor differences on network performance. A total of 5000 new samples were obtained after data enhancement. The images were then randomly divided into a training set, test set and validation set according to 8:1:1 for network training and parameter verification, to avoid overfitting of the training model. In addition, according to the shape of the rubber tapping trajectory, Labeling Image Annotation software was used to annotate the data set and generate the corresponding label files to ensure the accuracy of the parameters.

Figure 2.
Image Enhancement. (a) Random translation, (b) Adding noise, (c) Adjusting saturation, (d) Adjusting brightness.
2.3. Experimental Environment
The experimental environment used the ThinkStation P720 workstation as the processing platform, with an Intel Xeon(R) Silver 4210 CPU at a basic frequency 2.20 GHz, 32 G RAM, and an NVIDIA Quadro RTX 4000 GPU. The network model adopted the Pytorch framework, and the CUDA version is 10.2. The specific configuration is shown in Table 1.

Table 1.
Experimental environment.
The learning rate has an impact on the convergence state of the model, and batch size has an impact on the generalization performance of the model. To avoid model oscillations due to high initial learning rates, warm-up training prediction [49] was adopted for all experimental learning rates. During the warm-up training stage, the learning rate rose from 0 to 0.01. After the warm-up phase, the cosine annealing algorithm [50] was used to update the learning rate. Stochastic Gradient Descent (SGD) was selected as the optimizer for network training. The specific parameters were set as follows: epoch to 300, batch size to 16, the initial learning rate to 0.01, momentum parameter to 0.937, and the weight decay coefficient to 0.0005.
2.4. Evaluation Indicators
In this study, the mean average precision (mAP), precision rate (P), recall rate (R), parameter amount, FLOPs, and model size were used as evaluation indicators of network learning to evaluate the detection effect of the trained model. The P, R, and mAP can be calculated as follows:
where TP, FP, and FN represent the number of correctly detected samples, incorrectly detected samples, and missed samples, respectively, the unit is the number of samples. Pi is the value of precision and Ri is the value of recall. N is the number of classifications of the data samples. The mAP is the average value of the areas of each P-R curve, and their value ranges from 0 to 1.
3. Improvement of YOLOv5 Network Structure
3.1. YOLOv5 Network
YOLO Network (You Only Look Once) was first proposed by Joseph et al. [32] in 2016. As a representative of the one-stage object detection networks, it can complete two tasks of object classification and location at the same time, and has a good detection speed and accuracy. From YOLOv1 development to now, the YOLO network has produced the fifth-generation version. YOLOv5 [36] combines the advantages of the previous four versions to achieve the optimal trade-off between detection speed and detection accuracy. Using the native architecture of Pytorch, YOLOv5 has a lightweight model structure to be faster, more accurate, and consumes less memory.
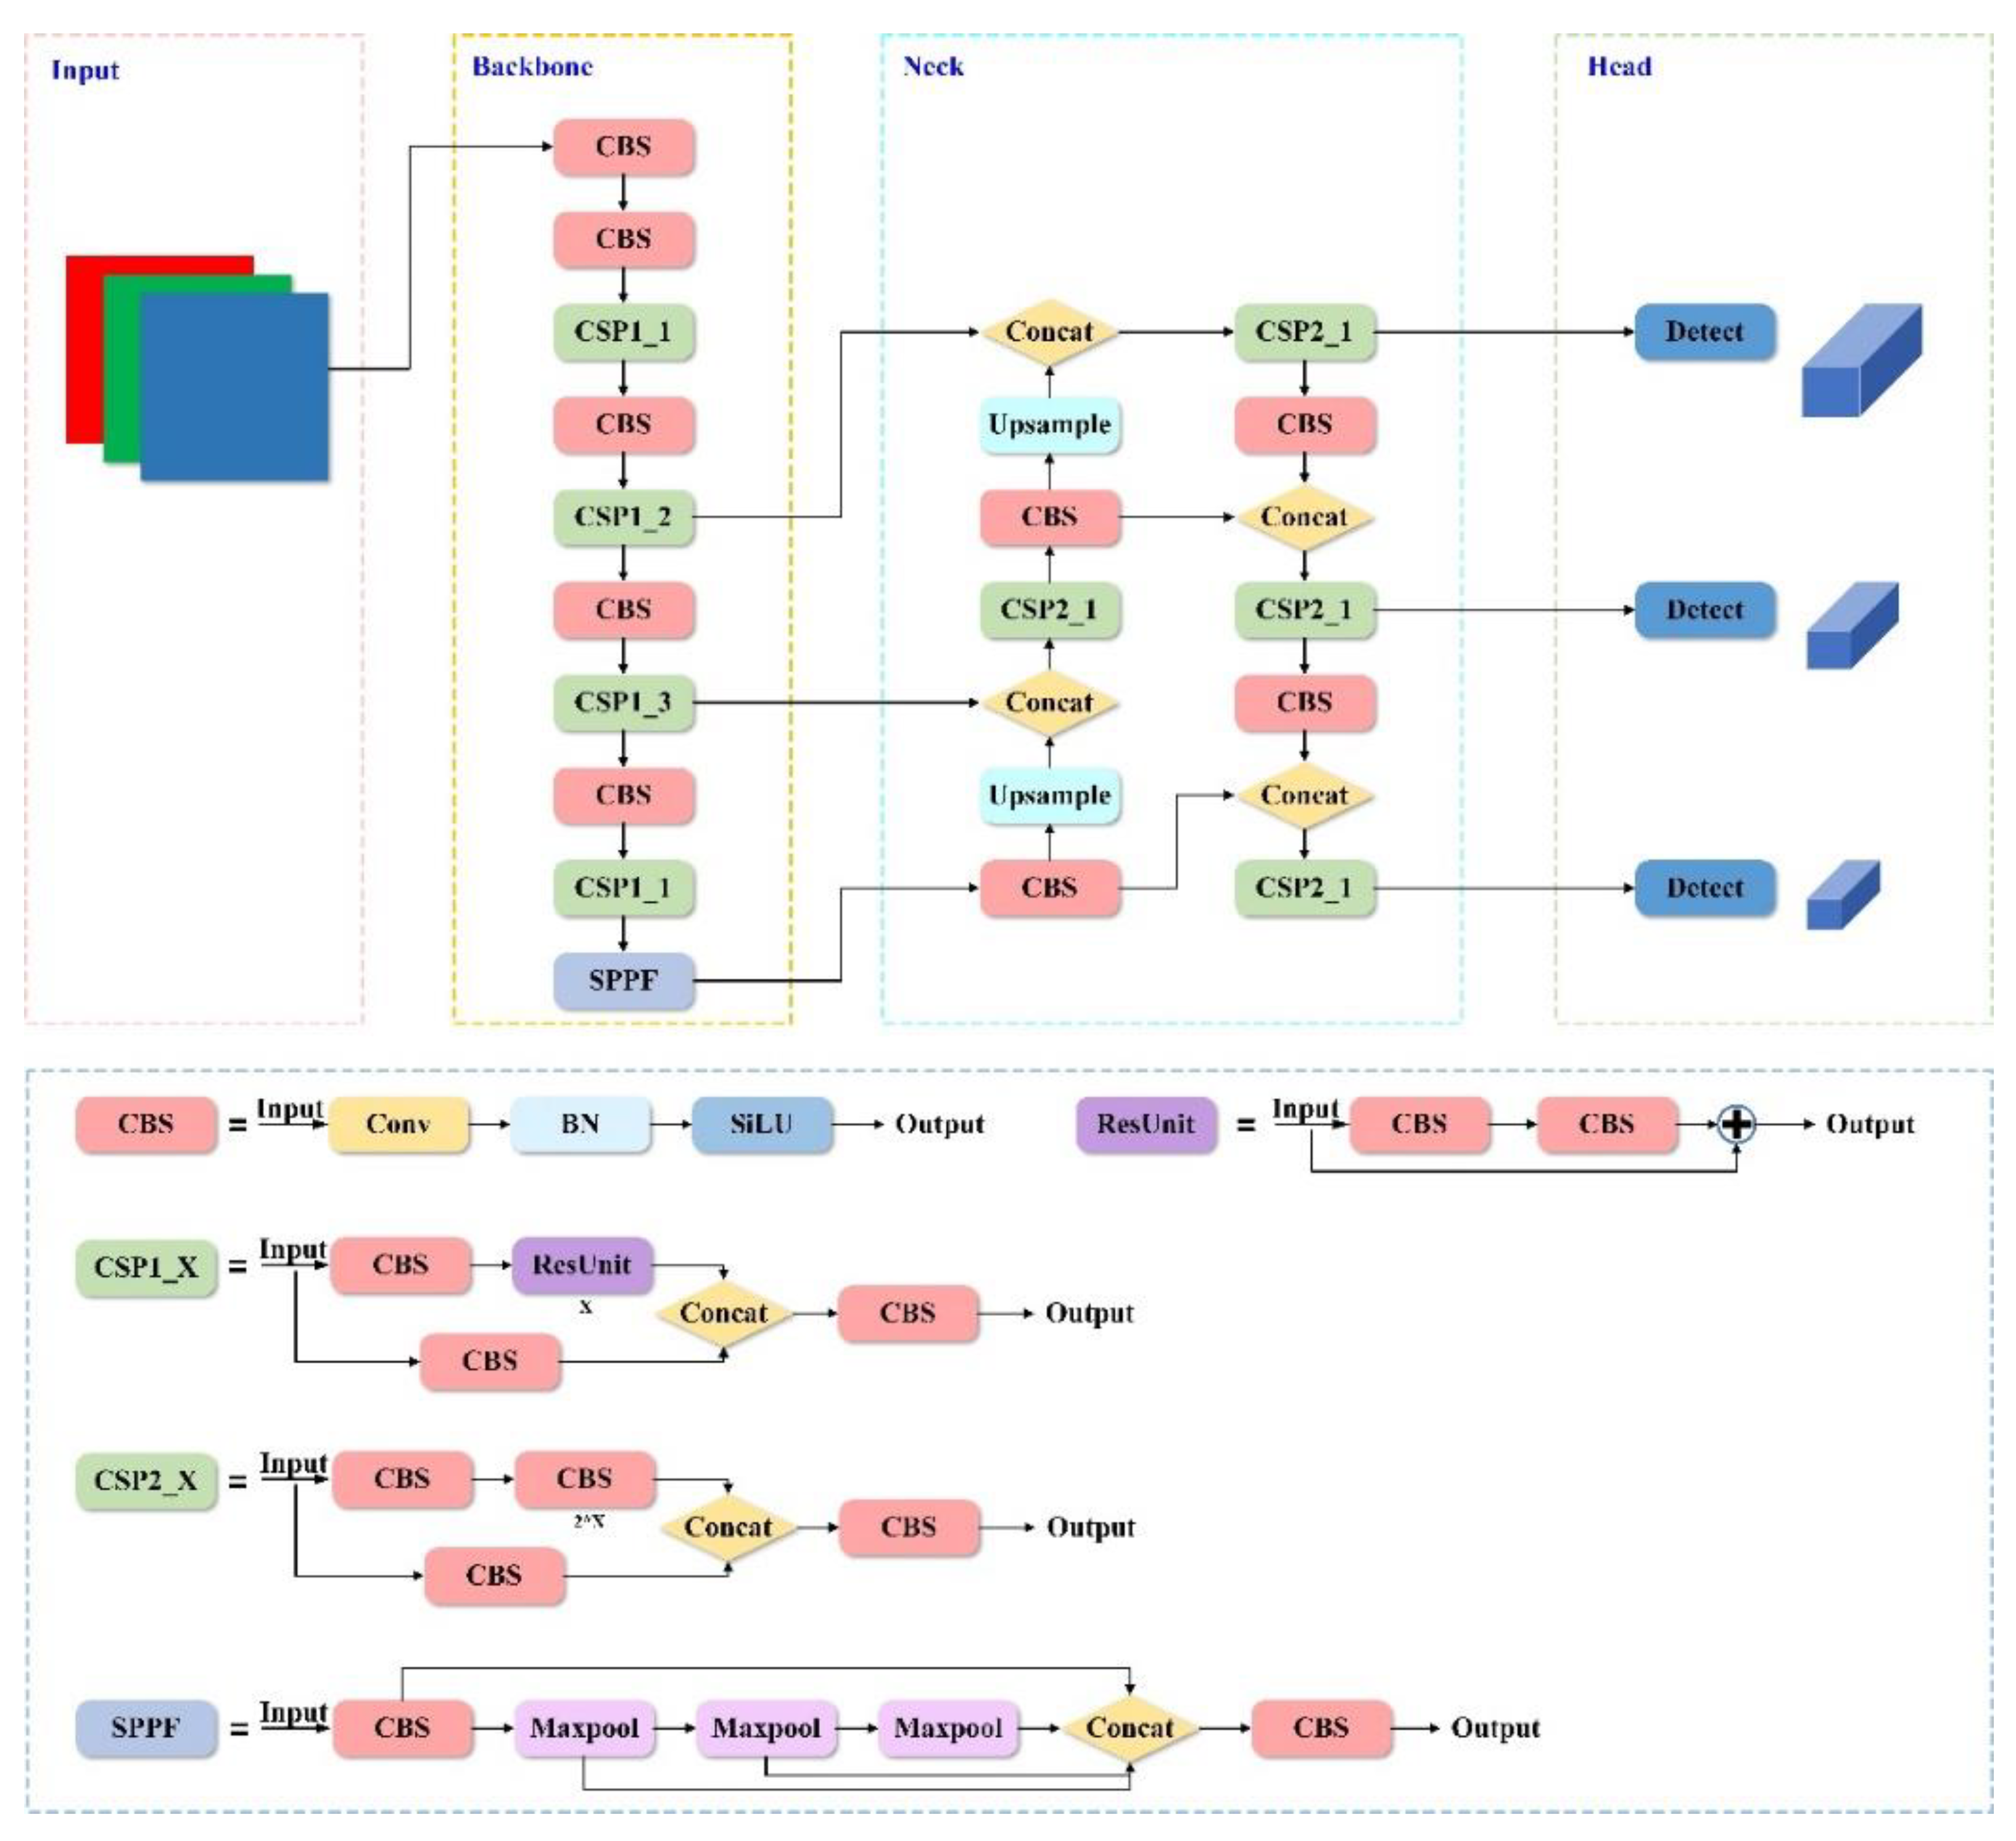
According to the depth and width of the network structure, YOLOv5 is divided into four versions, namely YOLOv5s, YOLOv5m, YOLOv5l, and YOLOv5x. The YOLOv5 network consists of four main parts, including the Input network, Backbone network, Neck network, and Head network, as shown in Figure 3 and Table 2. The Input network uses Mosaic image enhancement, adaptive bounding box calculation, and adaptive image scaling to enhance data information. The Backbone network extracts important features from input images based on different image granularities, mainly including CBS, CSP1_X, and SPPF structures. The Neck network combines FPN and PAN structures to improve the detection ability of information at different scales through bidirectional integration of low-level spatial features and high-level semantic features. The Head network predicts multi-scale features from the Neck network, generating bounding boxes and object class information. In this paper, YOLOv5s was selected as the benchmark model for improvement, which could realize the lightweight design of the model under the premise of ensuring detection accuracy.

Figure 3.
Structure of YOLOv5 network.
Table 2.
The abbreviations and corresponding full name in Figure 3.
3.2. Network Improvement
3.2.1. Improvement of Backbone Network
The visual attention mechanism is a special brain signal processing mechanism of human vision. When people observe external objects, they do not generally focus on the whole object, but tend to selectively acquire the important parts according to their needs, while ignoring the rest of the useless information [51]. Similar to the selective visual attention mechanism in humans, the core purpose of the attention mechanism in the neural network is to select the information which is more relevant to the current task. The more parameters a model has, the more expressive it is, and the more information it can store. However, this can lead to problems of information overload. By introducing the attention mechanism [52,53], the neural network learns a set of weight parameters autonomously, using a dynamic weighting method to strengthen important information, focusing on the parts that are more important to the current object, and reducing the attention to the rest of the information. In this paper, the CA mechanism [54] was added to the Backbone network, so that the model fully retained the spatial location information and improved the network detection performance.
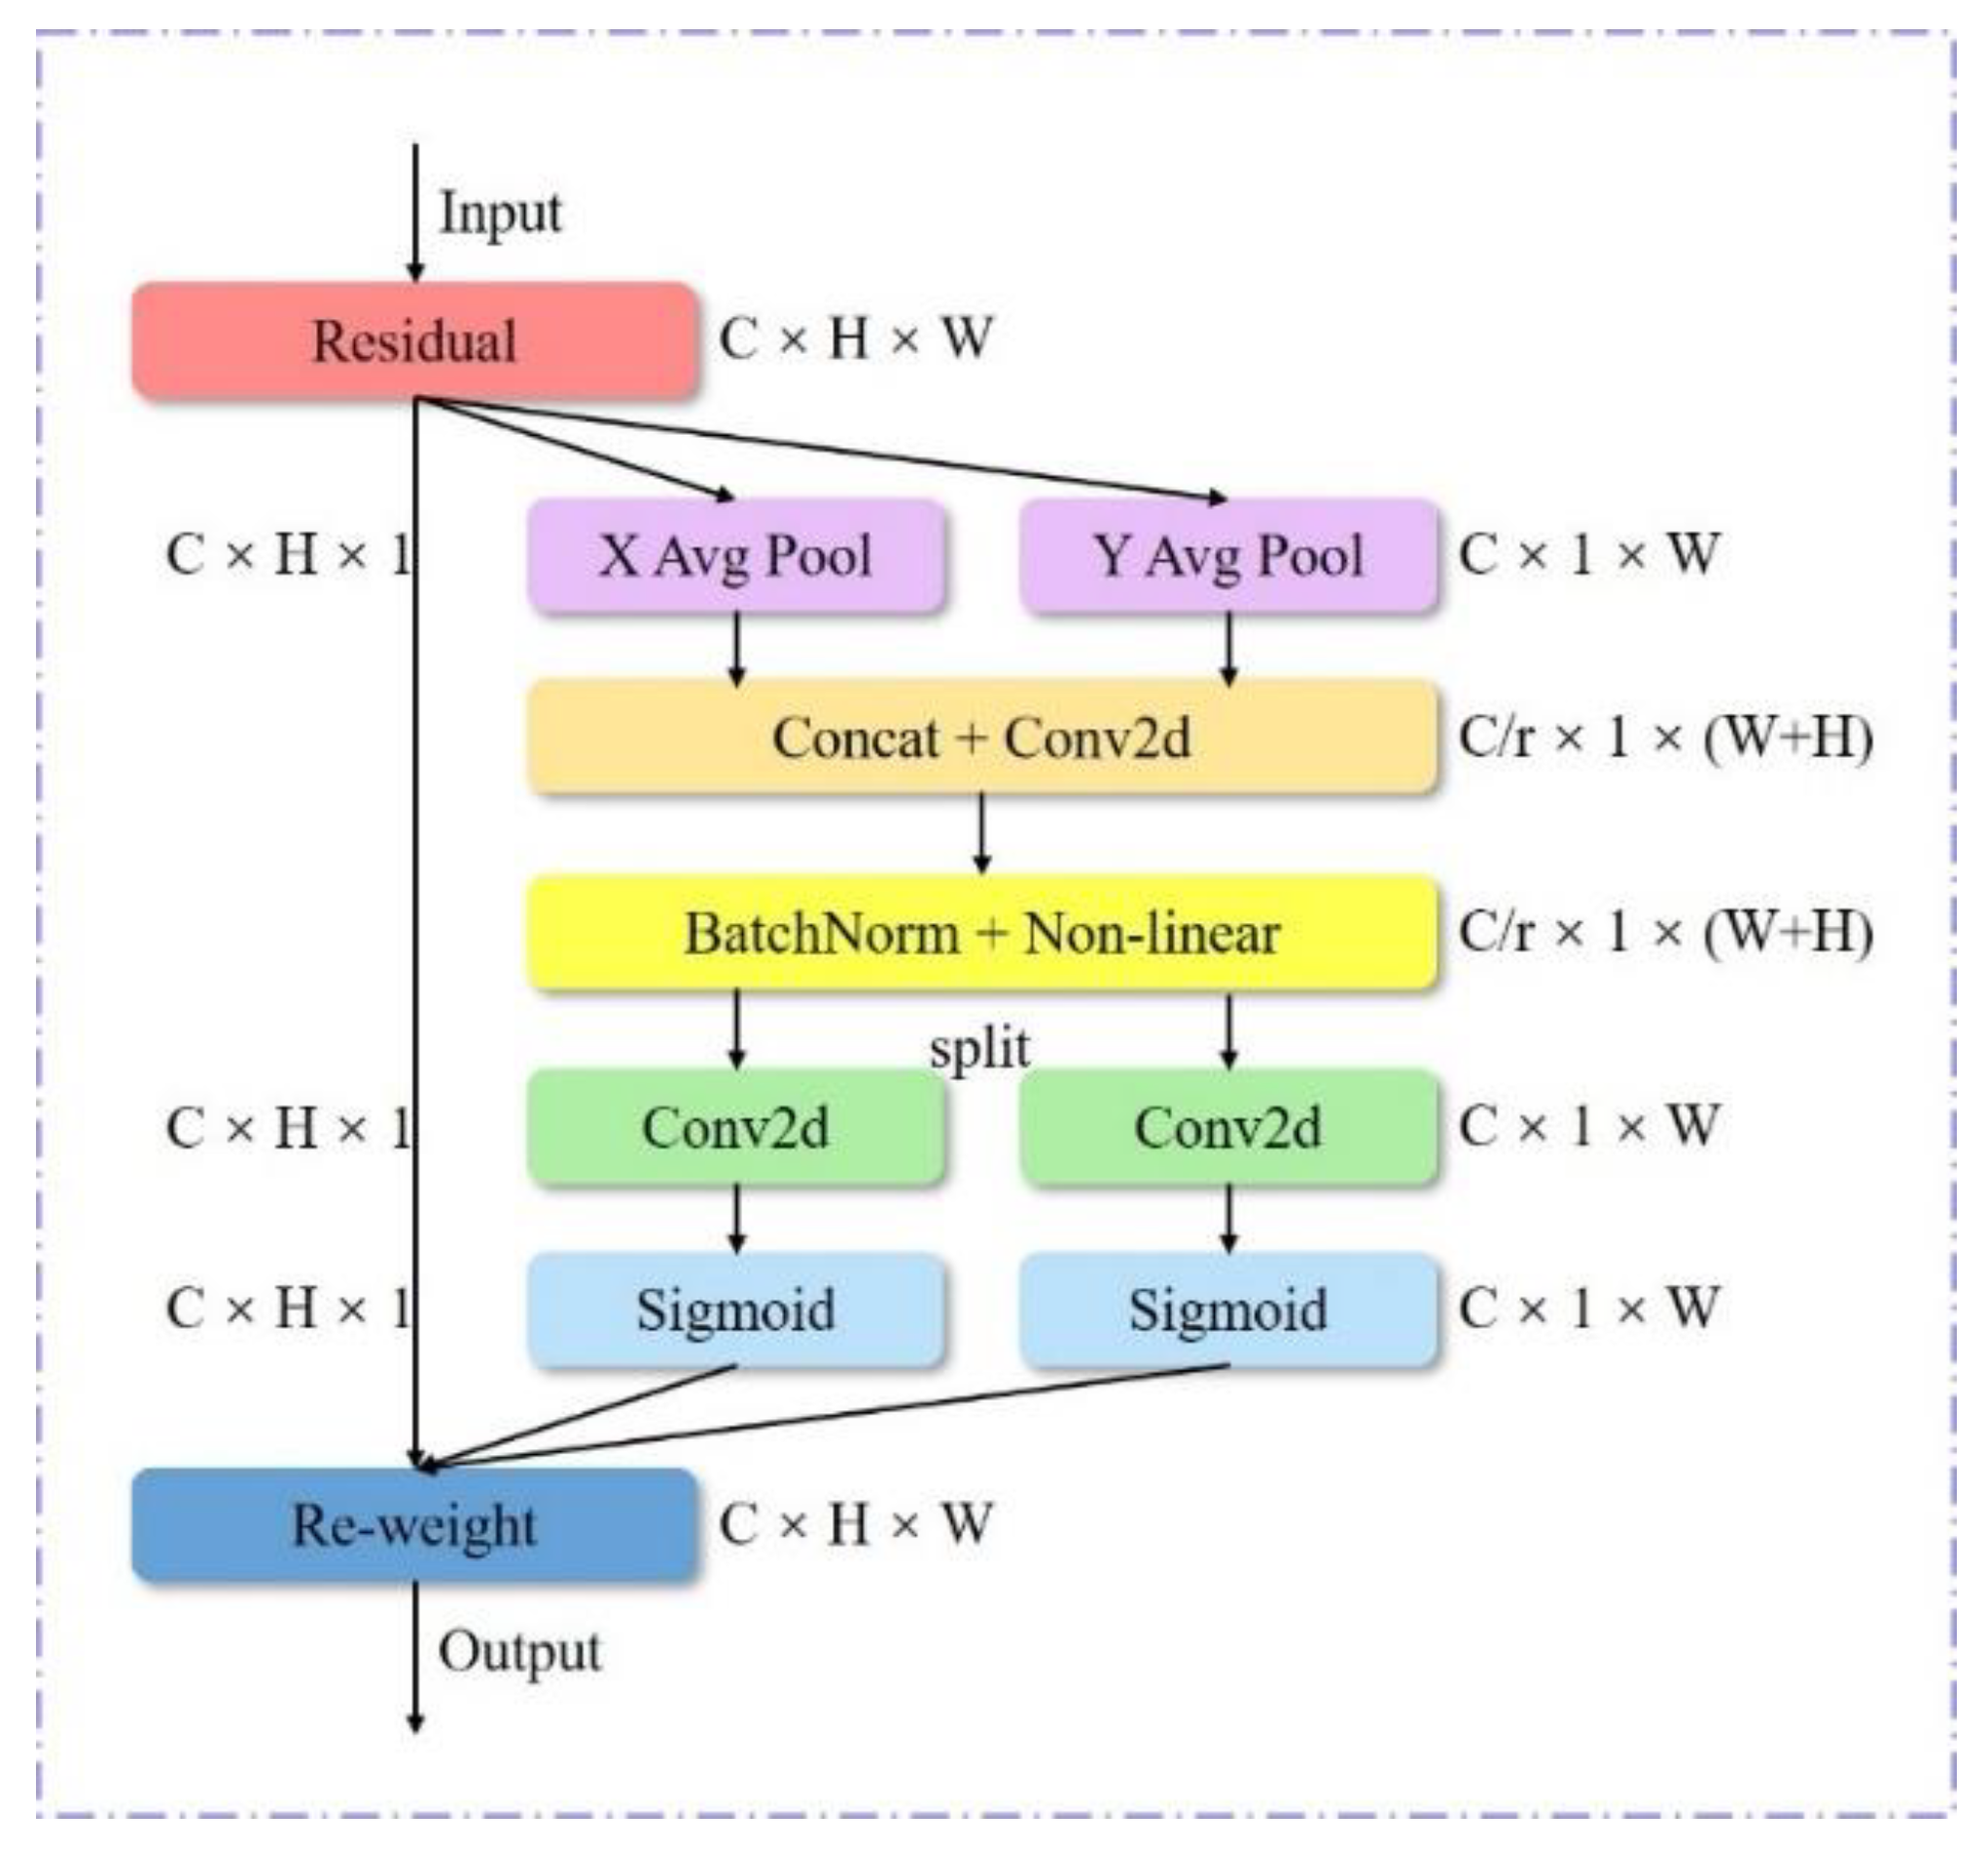
The CA mechanism is a network attention mechanism proposed by Hou et al. in 2021, which improves the expressive ability of model learning features. It transforms any intermediate feature tensor X in the network, and outputs feature tensor Y of the same size. The definition of feature tensors X and Y are as follows:
where H, W, and C present the height, width, and number of channels of the input feature map, respectively.
The CA mechanism takes into account its positional relationship on the basis of channel attention, and combines channel attention with spatial attention. Its operational process can be divided into coordinate information embedding and coordinate attention generation, as shown in Figure 4.

Figure 4.
Structure of CA mechanism.
In the channel attention mechanism, global pooling is usually used to encode spatial information globally, and the encoding process is as follows:
However, it compresses the information into a scalar, which does not easily retain important spatial information. To address this issue, the global pooling is modified to the encoding operation of two one-dimensional vectors. For input X, the pooling kernel (H, 1) or (1, W) is used to perform global average pooling for each channel along the height and width directions, respectively, to obtain its perceived feature map, as shown in Formula 4. Compared with global pooling, it helps the attention mechanism capture the long-distance relationship in one direction and retain the spatial location information in the other direction, making the object of network positioning more accurate.
where xc(h, i) and xc(j, w) represent the input of the c channel at h and w, respectively, and represent the output of the c channel at h and w, respectively.
A part of coordinate attention integrates feature maps of the two directions so that each weight contains inter-channel information, horizontal spatial information, and vertical spatial information to help the network locate objects more accurately and to enhance its recognition ability. The process of feature integration is as follows:
where h represents the height direction, w represents the width direction, F1 is the batch normalization function, δ is the nonlinear activation function, σ is the sigmoid function, fh and fw are feature maps in the height and width directions, Fh and Fw represent convolution operations in the height and width directions, respectively, gh and gw are the attention weights in the height and width directions, xc(i, j) is the input of the original feature map, and yc(i, j) is the output of the feature map with attention weights in width and height directions.
3.2.2. Improvement of Neck Network
Adding the CA mechanism causes a sudden increase in model parameters and the value of FLOPs. To achieve the lightweight design, this study introduced the Ghost module to retain the detection accuracy of the network model. Ghost is an innovation module in the GhostNet network proposed by Huawei Noah’s Ark Laboratory [55]. Its core idea is to generate plentiful feature maps with an extremely small operation cost.
The Ghost module designed a staged convolution calculation module. On the basis of slight feature maps obtained by nonlinear convolution, a linear convolution is performed to obtain more feature maps to eliminate redundancy and to obtain a lightweight model. The working principle is shown in Figure 5. Assuming the size of the input feature map is h × w × c, the size of the output feature map is h′ × w′ × c′, and the size of the convolution kernel is k × k, where h, w, and c are the height, width, and the number of channels of the input feature map, respectively, and h′, w′, and c′ are the height, width, and the number of channels of the output feature map, respectively. Then the FLOPs value of traditional convolution is c′ × h′ × w′ × c × k × k. The FLOPs value of the Ghost module is c′ ÷ s × h′ × w′ × c × k × k + (s − 1) × c′ ÷ s × h′ × w′ × d × d, where d × d is the size of the linear convolution kernel, s is the number of cheap transformation operations, and s « c. Theoretically, the ratio between them can be defined as:
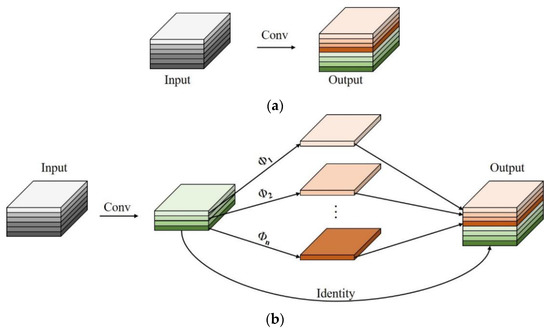
Figure 5.
The working principle of traditional convolution and Ghost module. (a) The traditional convolution, (b) The Ghost module.
It can be seen from Formula (6) that the FLOPs rate of the traditional convolution kernel is about s times that of the Ghost module, and the parameter quantity can also be deduced by analogy. Therefore, using the Ghost module can realize the lightweight design of the model. Based on the above analysis, the module called “CGB”, which is composed of convolution and GhostBottoneck, is proposed in this paper to reduce the parameters, the values of FLOPs, and the calculated cost of the model.
3.2.3. Improvement of Loss Function
The loss function of the original YOLOv5 model has classification loss, bounding box regression loss, and confidence loss. The bounding box regression loss is calculated by the CIoU loss function [56], and the classification loss and confidence loss are calculated by the binary cross-entropy loss function. The calculation process is as follows:
where
where k2 represents the grid size divided by the output feature map as k × k, n is the number of bounding boxes corresponding to each grid, means there is object information in the bounding box, means there is no object information in the bounding box, is the true confidence score, is the predicted confidence score, λnoobj is the weight coefficient of confidence loss when the prediction is wrong, is the probability of actually belonging to class c, and is the predicted probability of belonging to class c.
The CIoU loss function uses the distance and relative ratio of the bounding box as the penalty terms, and comprehensively considers the center point distance and length-width ratio. The calculation process is as follows:
where
where bp is the center point of the prediction box, bgt is the center point of the real box, ρ is the Euclidean distance between the two points, c is the diagonal distance of the smallest bounding box that can contain the real box and the prediction box, wgt is the width of the real box, hgt is the height of the real box, wp is the width of the prediction box, and hp is the height of the prediction box.
However, CIoU loss function still has some problems, such as its length-width ratio is a relative value which causes a certain ambiguity, and the balance of difficult and easy samples is not considered. Therefore, this paper uses the EIoU loss function [57] instead of the CIoU loss function as the bounding box regression loss function, and its definition is shown in Formula 11. It comprehensively considers the overlapping area, the distance between the center points, and the real difference between width and height. At the same time, Focal Loss is also introduced to solve the problems existing in the CIoU loss function, which makes the model converge faster and the regression process more stable.
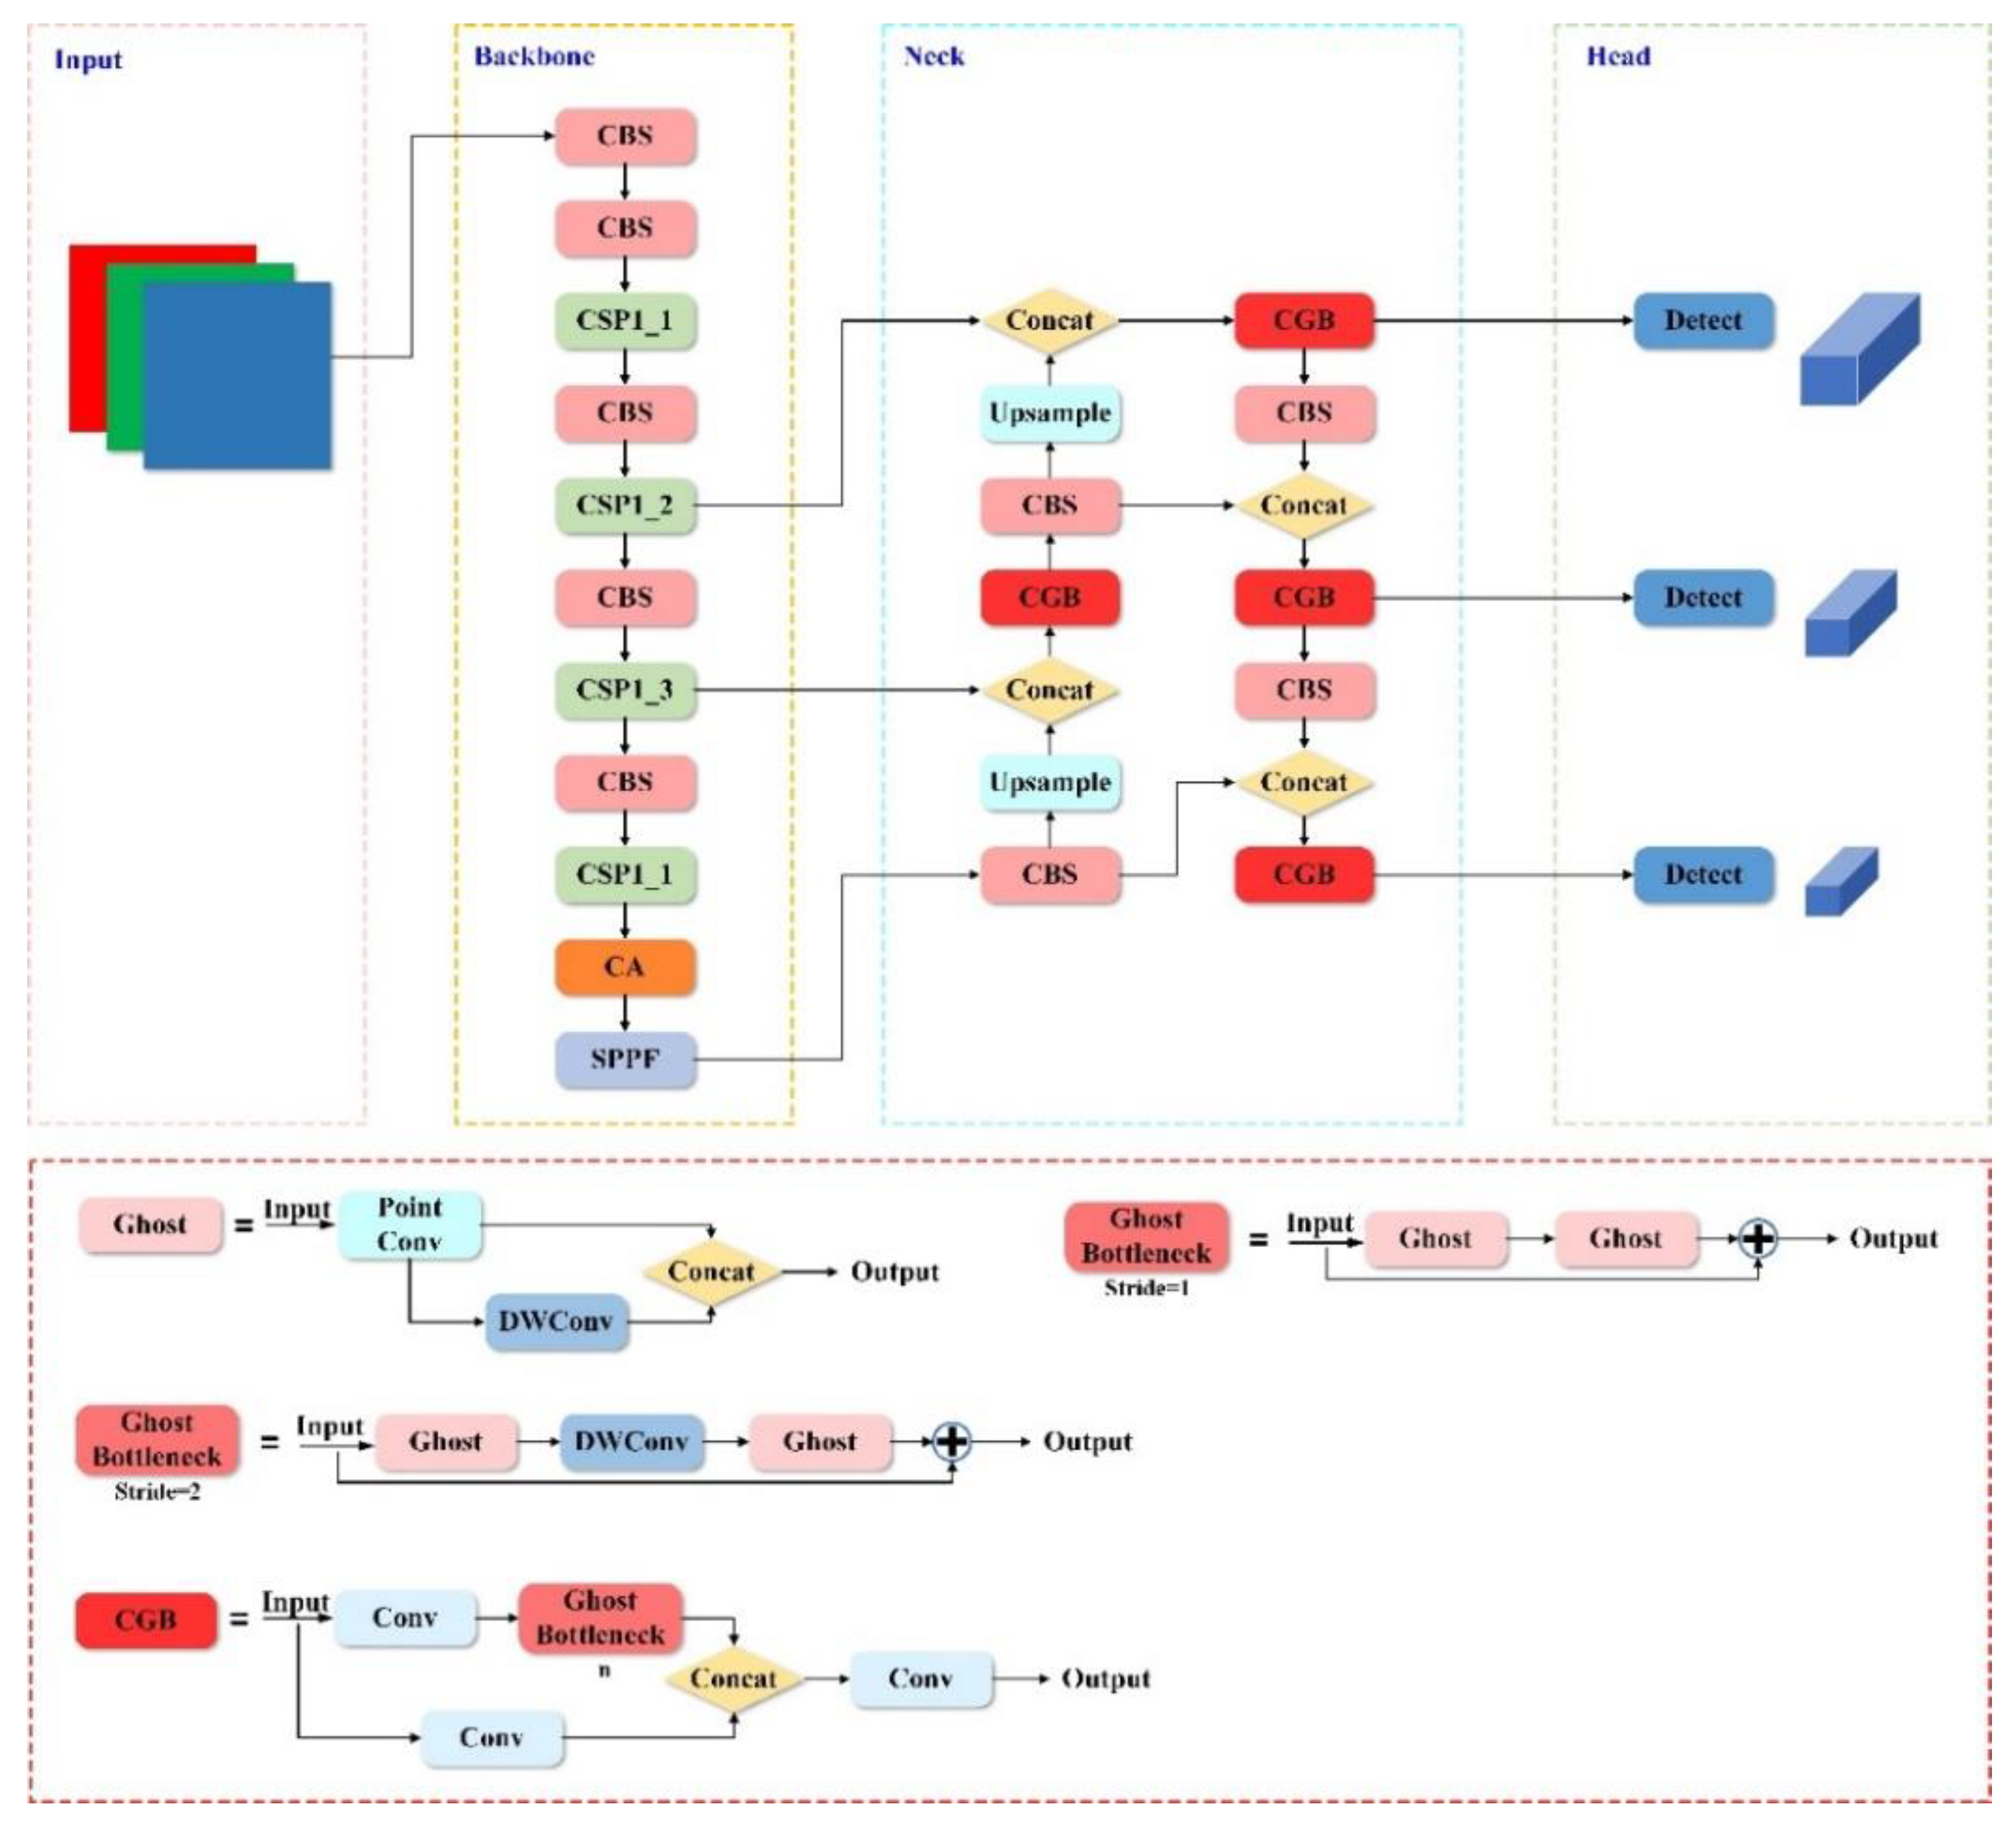
In summary, combined with the above improvements, the structure of the improved YOLOv5 model is shown in Figure 6.

Figure 6.
Structure of improved YOLOv5 network model.
4. Results and Discussion
4.1. The Training Results of Network Models
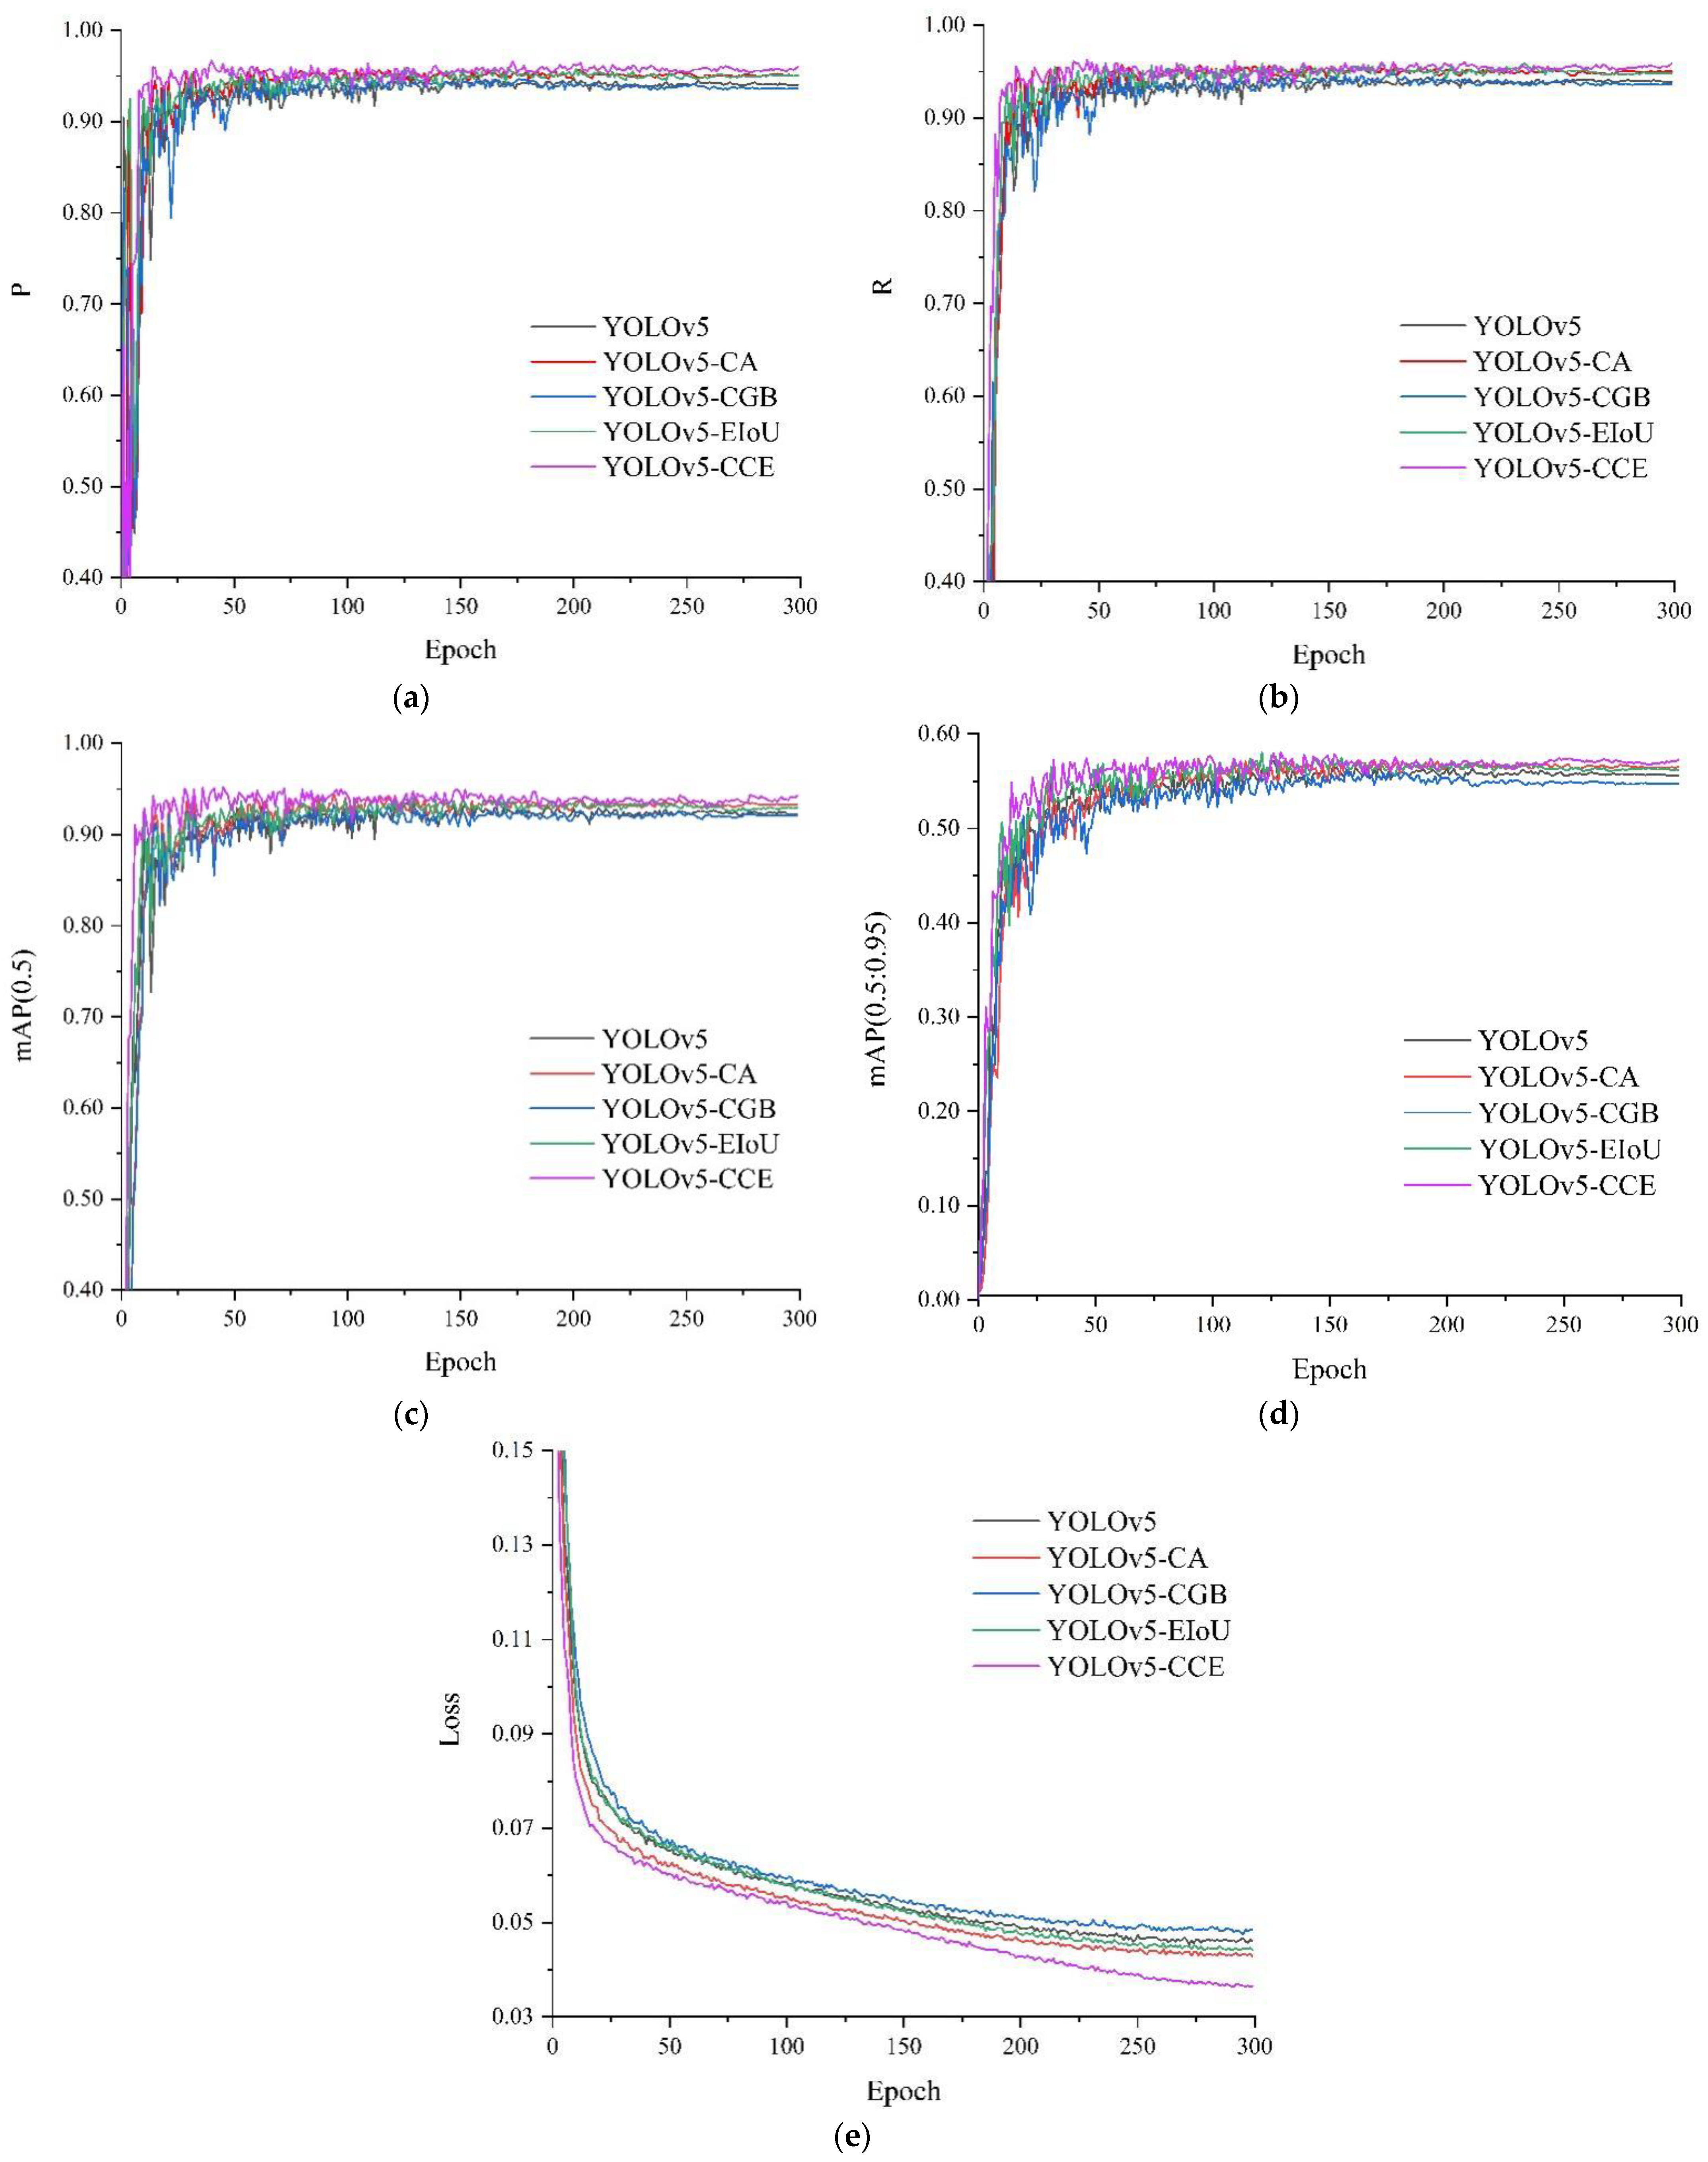
The performance changes caused by the improvement of the network structure were verified by ablation experiments. In this paper, five experiments were carried out according to the method of model improvement, named YOLOv5s, YOLOv5-CA, YOLOv5-CGB, YOLOv5-EIoU, and YOLOv5-CCE, respectively. The experimental results are shown in Figure 7 and Table 3.
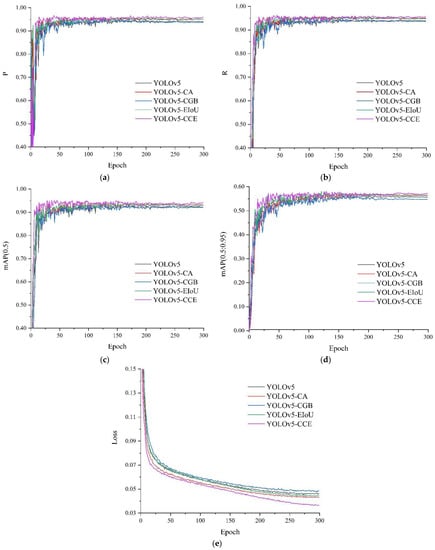
Figure 7.
Results of each experiment. (a) The change curve of precision, (b) The change curve of recall, (c) The change curve of mAP (0.5), (d) The change curve of mAP (0.5:0.95), (e) The change curve of loss.
Table 3.
Results of different experiments.
Figure 7a–e shows the change curves of P, R, mAP (0.5), mAP (0.5:0.95), and loss, respectively. Evaluation indicators were changed with the number of iterations. The loss function decreased significantly, the SGD algorithm optimized the network, and the network weight and other parameters were constantly updated. Before 50 epochs, the value of the loss dropped rapidly, while the values of P, R, and mAP increased rapidly. After 50 epochs, the decline speed of the loss function became slow, and other parameters also slowed down. After 100 epochs, the values of various parameters became stable, and there was no overfitting phenomenon.
It can be seen from Table 3 that after replacing the CBS module in the Neck network with the CGB module, the number of parameters, model size, and FLOPs of the improved model reduced by 13.7%, 13.1%, and 12.7%, respectively, compared to the original model. However, the accuracy of the model dropped by 0.4%. The reason for this is that the amount of model parameters is reduced, which leads to a decrease in the extraction performance of the network model for feature information. After adding the CA mechanism to the Backbone network of the original YOLOv5 model, the accuracy of the improved model increased by 1.5%, but the values of parameters, model size, and FLOPs increased by 11.2%, 11.0%, and 5.1%, respectively. The reason for this is that after the attention mechanism was added, the number of model layers increased, which made the calculation of the model and the FLOPs value increase.
Furthermore, using the EIoU loss function to replace the CIoU loss function of the original YOLOv5 model, the accuracy of the improved model increased by 1.2%, and other parameters did not change significantly. The reason for this is that the CIoU loss function has shortcomings. However, EIoU loss function comprehensively considers the overlapping area, the distance between the center points, and the real difference between width and height, which makes the model converge faster and the regression process more stable. On this basis, the original YOLOv5 model is optimized by combining all improved methods. Compared to the original model, the accuracy of the improved YOLOv5-CCE model improved by 1.9%. At the same time, although the number of network layers increased by 54 layers, the number of parameters and FLOPs decreased by 2.5% and 7.0%. This fully demonstrates the effectiveness of the improved method proposed in this paper.
Table 4 shows the mAP (0.5) values of each classification between the YOLOV5-CCE model and the original YOLOv5 model. In the four categories, the single-classification’s mAP values of the YOLOV5-CCE model are higher than the original YOLOv5 model. This shows that the improved YOLOv5 network model can distinguish categories well and can accurately detect object information in images. It can be seen from the training results that the improved model has a low loss value, and high values of mAP, P, and R. It has converged and achieved the ideal training results.
Table 4.
Results of mAP (0.5) of each classification.
4.2. The Detection Results of Network Models
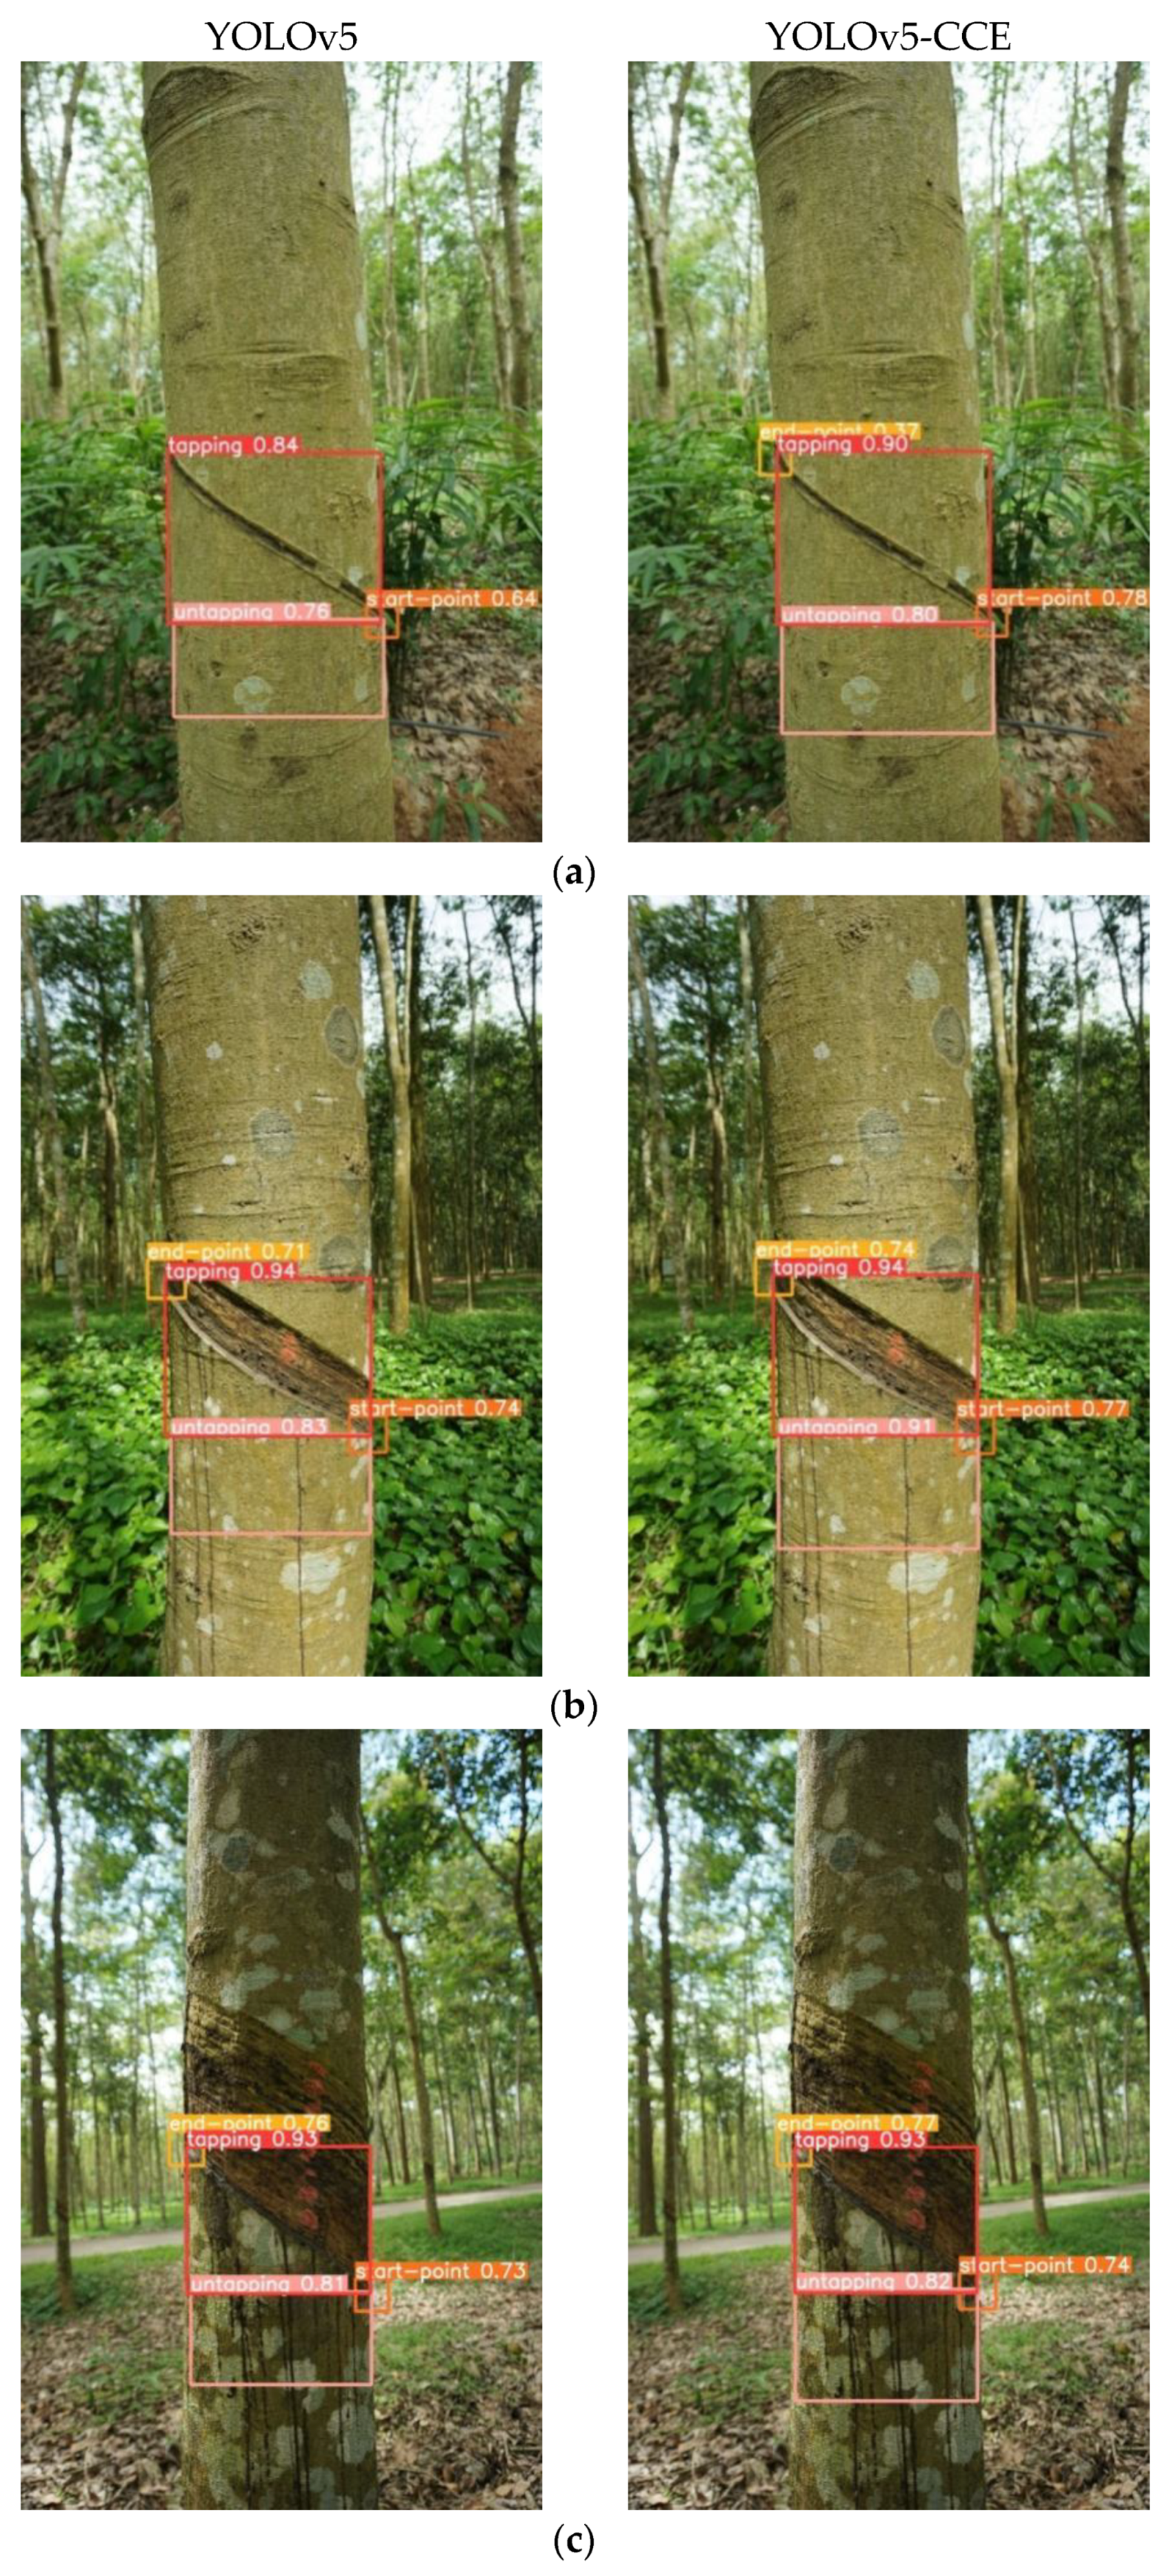
To verify the detection performance of the network model on the natural rubber tree tapping trajectory, the test set was inputted to the optimized network model, and the detection results of different rubber tapping stages were carefully analyzed. Figure 8 shows the performance comparison between the YOLOv5-CCE model and the original YOLOv5 model in different scenarios. Under different natural lighting conditions, the tapping trajectories of each tapping stage can be detected well. Overall, the detection results of the YOLOv5-CCE network model are accurate.

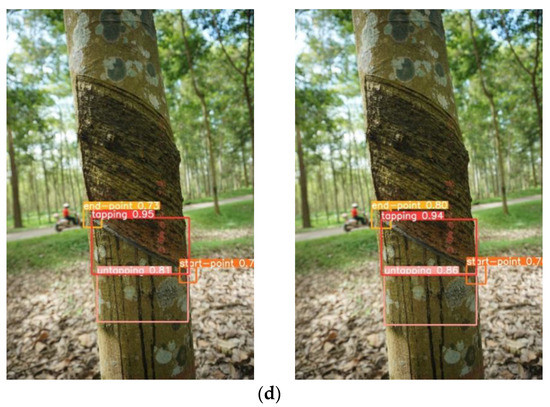
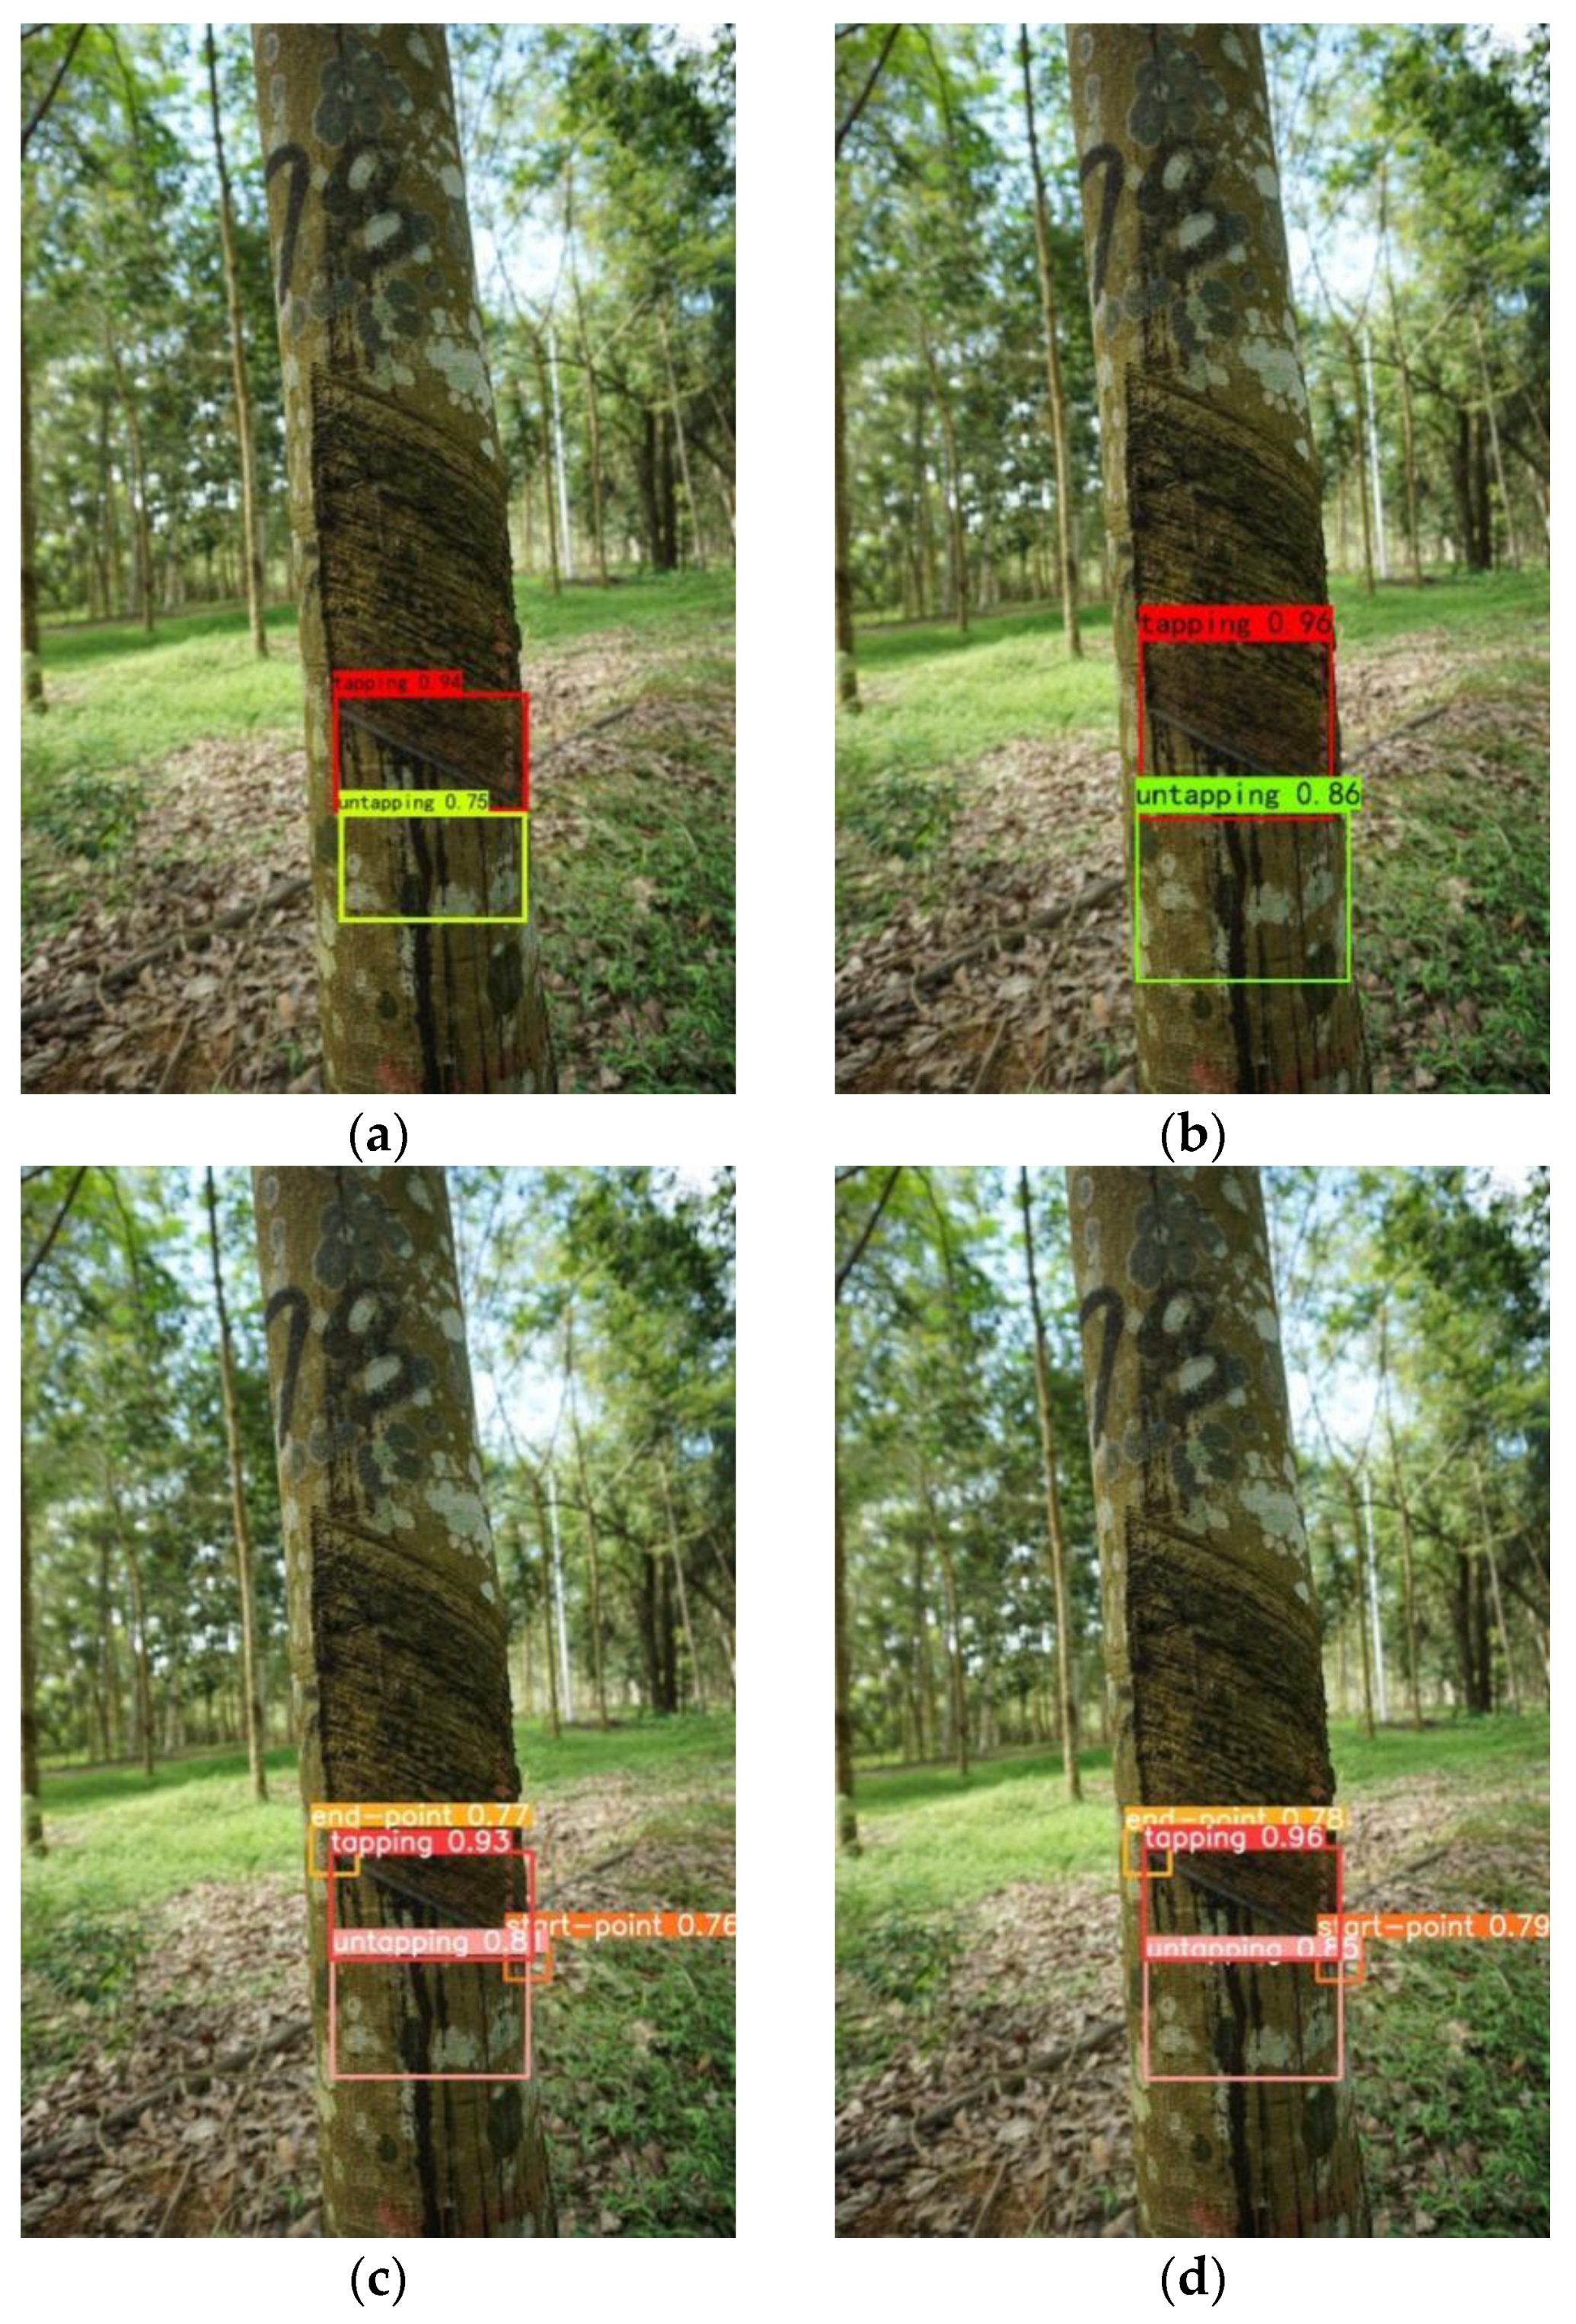
Figure 8.
Detection results of two models. (a) Pre-tapping, (b) One-year tapping age, (c) Three-year tapping age, (d) Five-year tapping age.
In Figure 8, the tapping trajectories of each tapping stage are well detected under different natural lighting conditions. Overall, the detection results of the YOLOv5-CCE network model are accurate. Moreover, it can be seen from Figure 8a that the original YOLOv5 model fails to detect the end point of rubber tapping during the pre-tapping stage. However, the YOLO-CCE model not only accurately detects the end-point of rubber tapping, but also enhances the accuracy of various objects by more than 4%. In other tapping stages, the accuracy of the improved model exceeds that of the original YOLOv5 model. The results show that the detection results of the improved YOLOv5-CCE network model proposed in this paper are accurate, and the effect is better than the original YOLOv5 model.
4.3. Comparison of Different Network Models
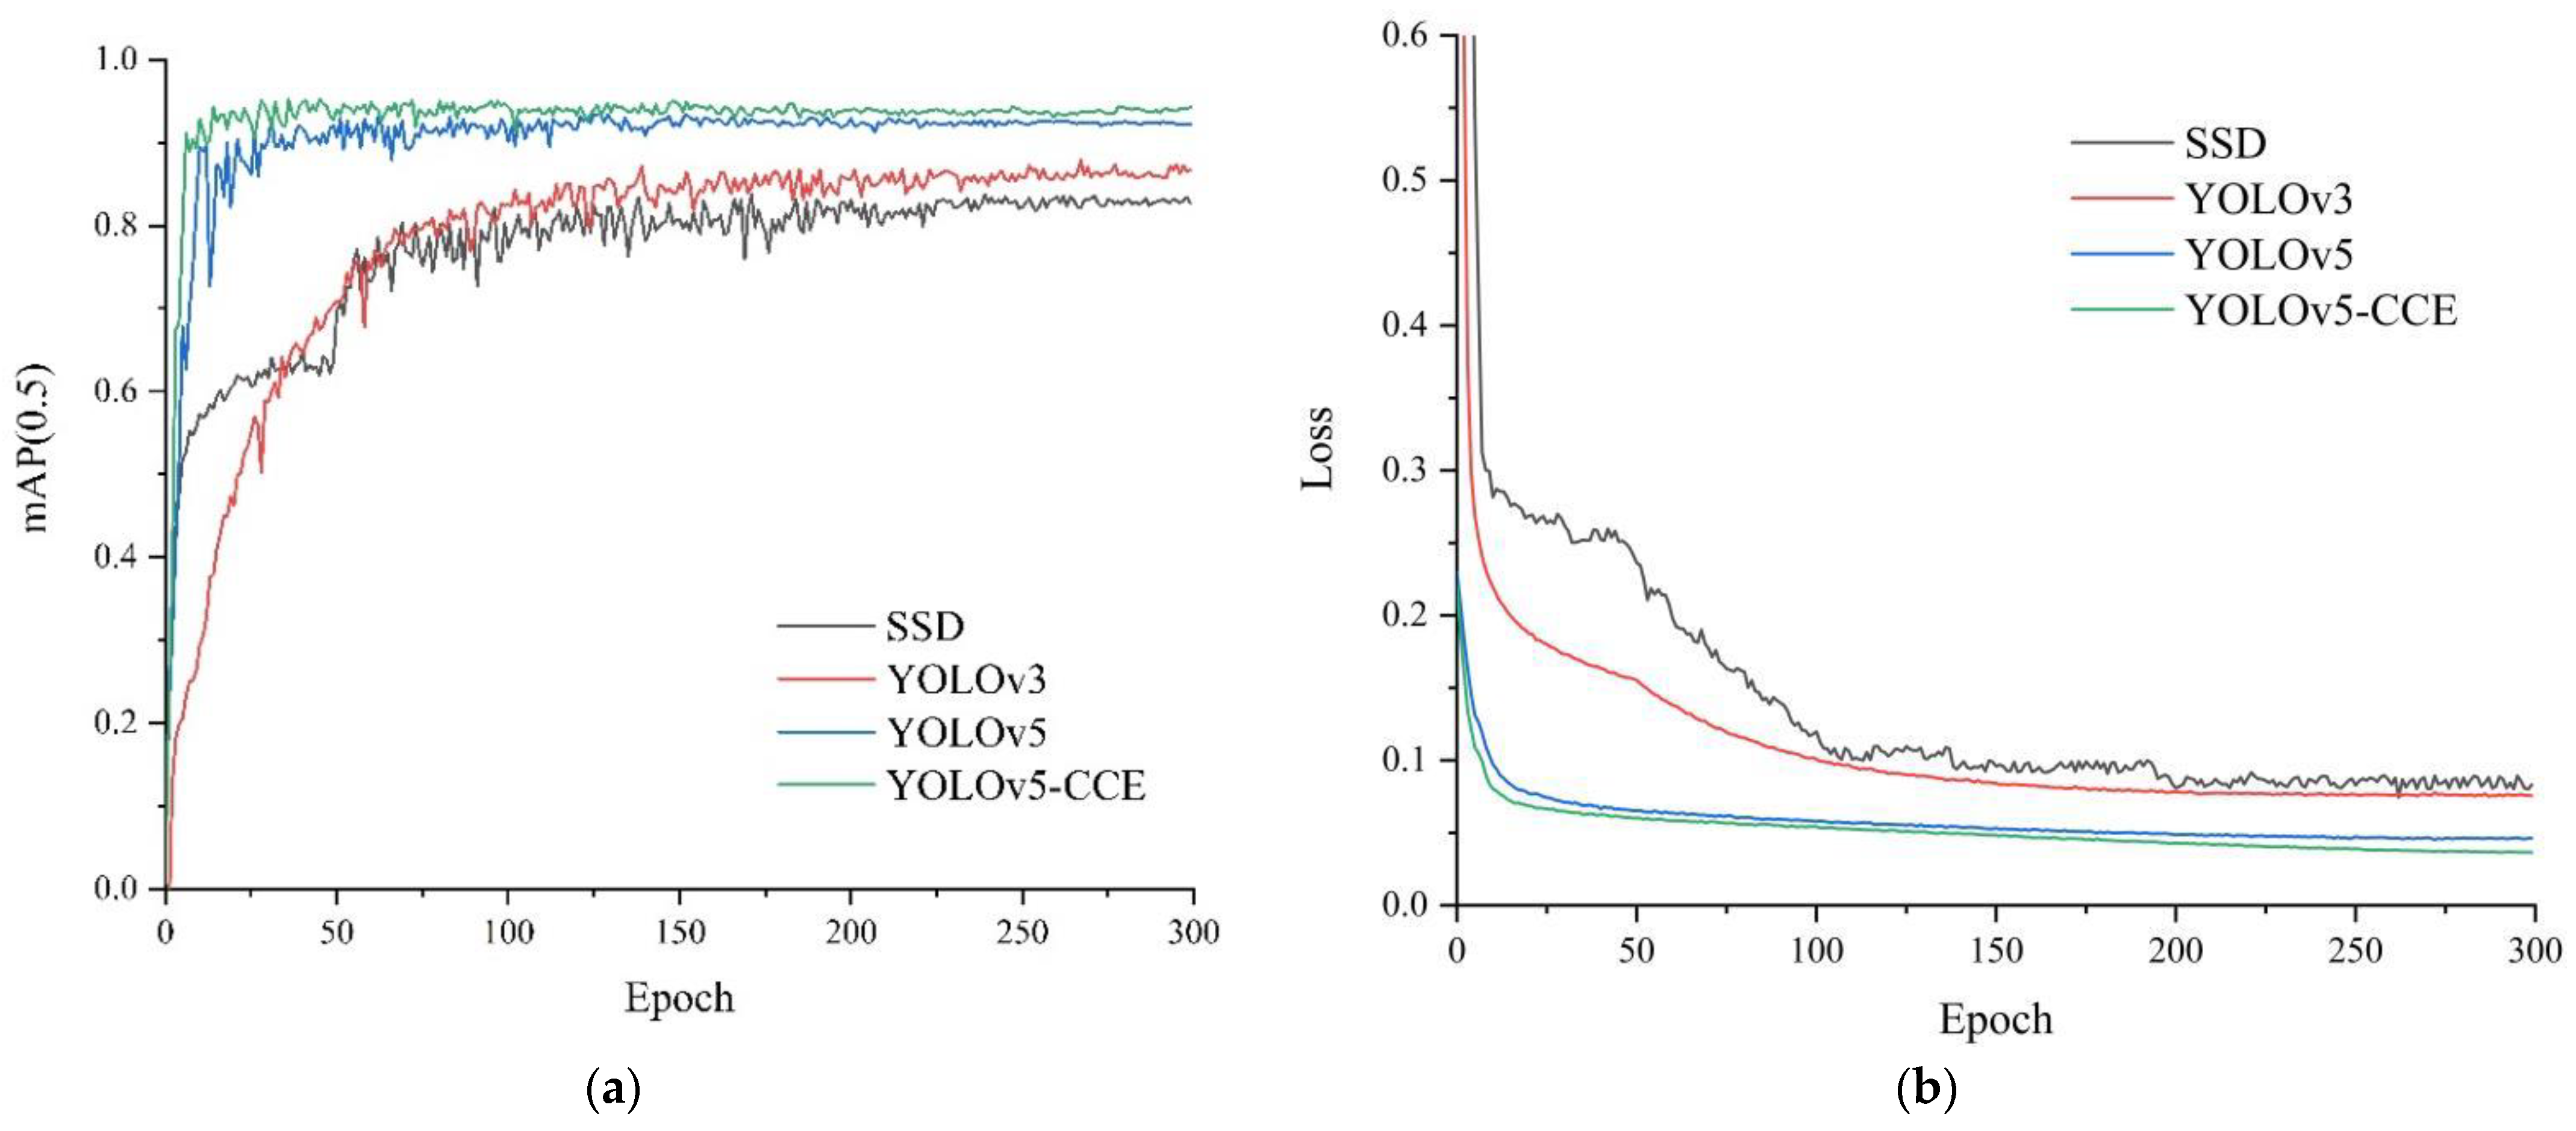
To further verify the performance of the YOLOv5-CCE network model, it was compared with the SSD model, YOLOv3 model, and original YOLOv5 model. The results are shown in Figure 9 and Table 5.

Figure 9.
Results of different models on the data set. (a) The change curve of mAP (0.5), (b) The change curve of loss.
Table 5.
Results of different models.
It can be seen from Figure 9a that the mAP (0.5) value of the improved YOLOV5-CCE model is higher than that of the SSD model, YOLOv3 model, and original YOLOv5 model. The convergence fluctuation of the YOLOv5-CCE model is smaller. As can be seen from Figure 9b, compared with other models, the loss function value of the improved YOLOV5-CCE model decreases faster. As can be seen from Table 5, compared with the SSD model, YOLOv3 model, and YOLOv5 model, the mAP value of the improved YOLOV5-CCE model improved by 10.4%, 8.8%, and 2.1%, respectively. At the same time, the model size is reduced to some extent. It can be concluded that the method proposed in this paper outperforms other classical lightweight networks.
The SSD model, YOLOv3 model, YOLOv5 model, and YOLOV5-CCE model were verified on the test set, and the results are shown in Figure 10. Figure 10a shows the detection results of the SSD model, including objects of two correct detections and two missed detections. Figure 10b shows the detection results of the YOLOv3 model. It also includes objects of two correct detections and two missed detections, and the detection accuracy is slightly higher than that of the SSD model. Figure 10c shows the detection results of the original YOLOv5 model. The objects have been detected, and the detection accuracy is higher than the SSD model and the YOLOv3 model. Figure 10d shows the detection results of the improved YOLOv5-CCE model. There are no missed detections or false detections, and the accuracy is higher than the other three models. Since the anchor box of the SSD model has fixed values, the rate of missed detection is higher. The anchor box of the YOLOv5 and YOLOv5-CCE models are trained to obtain appropriate values, so they have a better generalization ability. Meanwhile, the improved YOLOv5-CCE model also introduces the CA mechanism to embed location information into channel attention, which suppresses other interference features and increases the contrast between the tapping trajectory and the background, thereby reducing the false detection rate. By comparing the detection results of the four models, the effectiveness of the YOLOv5-CCE model in rubber tapping trajectory detection is further proven.
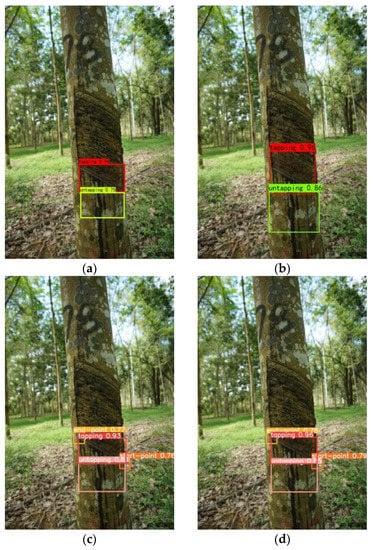
Figure 10.
Detection results of four models. (a) Image predicted by SSD, (b) Image predicted by YOLOv3, (c) Image predicted by YOLOv5, (d) Image predicted by YOLOv5-CCE.
5. Conclusions
In this paper, an improved YOLOv5-based detection method is proposed for detecting the tapping trajectories in complex rubber plantations. The main conclusions are as follows:
(1) The ablation experiments were carried out to verify the effectiveness of the improved network model combining the CA mechanism, Ghost module, and EIoU loss function in this paper. The precision rate of the improved YOLOv5 network model reaches 96.0% and the mAP (0.5) value reaches 95.1%. Compared with the original YOLOv5 network, the P, R, and mAP (0.5) are improved by 2%, 2%, and 1.9%, respectively, while the model parameters and the number of FLOPs reduced by 2.5% and 7.0%. The experimental results demonstrated the effectiveness of the improved method adopted in this paper.
(2) The performance of the YOLOv5-CCE model was verified by comparing with the SSD model, YOLOv3 model, and the original YOLOv5 model. The performance of the improved network model is generally better than the other three models, which meets the detection requirements. The experimental results further prove that the proposed model achieves good detection performance.
In summary, the improved YOLOv5-CCE network model can detect the tapping trajectory more accurately and provide a foundation for the follow-up development of intelligent tapping equipment. Future research will focus on the following aspects:
(1) The MobileNetV3 [58] network will be used to replace the Backbone network to create a lightweight network with higher performance, which matches the lightweight requirements for object detection in small mobile devices.
(2) The network model structure will be further optimized by adding a micro-scale detection layer in the Neck network, to improve the detection performance of the model for small targets.
(3) More image data sets will be collected to expand the application scope of the model. Using transfer learning to detect different types of objects provides a more efficient object detection method to meet practical needs.
Author Contributions
Conceptualization, Z.S. and X.Z.; methodology, Z.S.; software, Z.S.; validation, Z.S., H.Y. and Z.Z.; formal analysis, Z.S.; investigation, H.Y. and J.L.; resources, Z.Z. and X.Z.; data curation, J.L.; writing—original draft preparation, Z.S.; writing—review and editing, Z.Z.; visualization, Z.S. and H.Y.; supervision, Z.S.; project administration, H.Y.; funding acquisition, X.Z. All authors have read and agreed to the published version of the manuscript.
Funding
This research was funded by the Key Research and Development Project of Hainan Province (ZDYF2021XDNY198), Hainan Province Academician Platform Project (HD-YSZX-202005), Hainan Province Academician Platform Project (HD-YSZX-202101), and the National Modern Agricultural Industry Technology System Post Scientist Project (CARS-33-JX2, National Natural Rubber Industry Technology System-Intelligent Production Post).
Institutional Review Board Statement
Not applicable.
Informed Consent Statement
Not applicable.
Data Availability Statement
Not applicable.
Acknowledgments
We would like to thank Zhengbin Liang for his help in collecting the data set.
Conflicts of Interest
The authors declare no conflict of interest.
References
- Hakimi, N.M.F.; Lee, S.H.; Lum, W.C.; Mohamad, S.F.; Al Edrus, S.S.O.; Park, B.D.; Azmi, A. Surface Modified Nanocellulose and Its Reinforcement in Natural Rubber Matrix Nanocomposites: A Review. Polymers 2021, 13, 3241. [Google Scholar] [CrossRef] [PubMed]
- Zheng, T.T.; Zheng, X.Q.; Zhan, S.Q.; Zhou, J.; Liao, S.Q. Study on the ozone aging mechanism of Natural Rubber. Polym. Degrad. Stab. 2021, 186, 109514. [Google Scholar] [CrossRef]
- Men, X.; Wang, F.; Chen, G.Q.; Zhang, H.B.; Xian, M. Biosynthesis of Natural Rubber: Current State and Perspectives. Int. J. Mol. Sci. 2019, 20, 50. [Google Scholar] [CrossRef] [PubMed]
- van Beilen, J.B.; Poirier, Y. Establishment of new crops for the production of natural rubber. Trends Biotechnol. 2007, 25, 522–529. [Google Scholar] [CrossRef]
- Sivaselvi, K.; Gopal, K. Study to enhance the mechanical properties of natural rubber by using the carbon black (N550). Mater. Today Proc. 2020, 26, 378–381. [Google Scholar] [CrossRef]
- Porntrairat, A.; Pattamaprom, C. Preparation of vinyl acetate grafted natural rubber by irradiation method. In Proceedings of the 31st International Conference of the Polymer-Processing-Society (PPS), Jeju Island, Korea, 7–11 June 2015. [Google Scholar]
- Zeng, X.; Huang, H.S. Development and Prospects of Natural Rubber Technology in China. China Trop. Agric. 2021, 1, 25–30. [Google Scholar]
- Zhang, C.L.; Yong, L.Y.; Chen, Y.; Zhang, S.L.; Ge, L.Z.; Wang, S.; Li, W. A Rubber-Tapping Robot Forest Navigation and Information Collection System Based on 2D LiDAR and a Gyroscope. Sensors 2019, 19, 2136. [Google Scholar] [CrossRef]
- Arjun, R.N.; Soumya, S.J.; Vishnu, R.S.; Bhavani, R.R. Semi Automatic Rubber Tree Tapping Machine. In Proceedings of the 2016 International Conference on Robotics and Automation for Humanitarian Applications, Amritapuri, India, 18–20 December 2016; pp. 92–96. [Google Scholar]
- Wongtanawijit, R.; Khaorapapong, T. Nighttime rubber tapping line detection in near-range images Near-Range tapping line shadow acquisition technique with tapping line detection algorithm for automatic rubber tapping robot in nighttime. Multimed. Tools Appl. 2021, 80, 29401–29422. [Google Scholar] [CrossRef]
- Li, S.T.; Zhang, J.; Sun, L.; Liu, Y.N. Study on the Secant Segmentation Algorithm of Rubber Tree. In Proceedings of the 2nd International Conference on Machine Vision and Information Technology (CMVIT), Hong Kong, China, 23–25 February 2018. [Google Scholar]
- Susanto, H.; Hanif, S.A.; Hanif. The Design of Flexible Rubber Tapping Tool with Settings the Depth and Thickness Control. In Proceedings of the 1st South Aceh International Conference on Engineering and Technology (SAICOET), Politeknik Aceh Selatan, Tapak Tuan, Indonesia, 8–9 December 2018.
- Zhou, H.; Zhang, S.; Zhang, J.; Zhang, C.; Wang, S.; Zhai, Y.; Li, W. Design, development, and field evaluation of a rubber tapping robot. J. Field Robot. 2022, 39, 28–54. [Google Scholar] [CrossRef]
- Kianat, J.; Khan, M.A.; Sharif, M.; Akram, T.; Rehman, A.; Saba, T. A joint framework of feature reduction and robust feature selection for cucumber leaf diseases recognition. Optik 2021, 240, 166566. [Google Scholar] [CrossRef]
- Iqbal, Z.; Khan, M.A.; Sharif, M.; Shah, J.H.; Rehman, M.H.U.; Javed, K. An automated detection and classification of citrus plant diseases using image processing techniques: A review. Comput. Electron. Agric. 2018, 153, 12–32. [Google Scholar] [CrossRef]
- Khan, M.A.; Akram, T.; Sharif, M.; Shahzad, A.; Aurangzeb, K.; Alhussein, M.; Haider, S.I.; Altamrah, A. An implementation of normal distribution based segmentation and entropy controlled features selection for skin lesion detection and classification. BMC Cancer 2018, 18, 1–20. [Google Scholar] [CrossRef] [PubMed]
- Nasir, M.; Khan, M.A.; Sharif, M.; Lali, I.U.; Saba, T.; Iqbal, T. An improved strategy for skin lesion detection and classification using uniform segmentation and feature selection based approach. Microsc. Res. Tech. 2018, 81, 528–543. [Google Scholar] [CrossRef] [PubMed]
- Shrivastava, V.K.; Pradhan, M.K. Rice plant disease classification using color features: A machine learning paradigm. J. Plant Pathol. 2021, 103, 17–26. [Google Scholar] [CrossRef]
- Al Hiary, H.; Ahmad, S.B.; Reyalat, M.; Braik, M.; Alrahamneh, Z. Fast and accurate detection and classification of plant diseases. Int. J. Comput. Appl. 2011, 17, 31–38. [Google Scholar] [CrossRef]
- Mohan, K.J.; Balasubramanian, M.; Palanivel, S. Detection and Recognition of Diseases from Paddy Plant Leaf Images. Int. J. Comput. Appl. 2016, 144, 34–41. [Google Scholar] [CrossRef]
- Mukhopadhyay, S.; Paul, M.; Pal, R.; De, D. Tea leaf disease detection using multi-objective image segmentation. Multimed. Tools Appl. 2021, 80, 753–771. [Google Scholar] [CrossRef]
- Ani Brown Mary, N.; Robert Singh, A.; Athisayamani, S. Classification of Banana Leaf Diseases Using Enhanced Gabor Feature Descriptor. Inventive Commun. Comput. Technol. 2021, 145, 229–242. [Google Scholar] [CrossRef]
- Girshick, R.; Donahue, J.; Darrell, T.; Malik, J. Rich feature hierarchies for accurate object detection and semantic segmentation. In Proceedings of the IEEE Conference on Computer Vision and Pattern Recognition, Columbus, OH, USA, 23–28 June 2014; pp. 580–587. [Google Scholar]
- He, K.M.; Zhang, X.Y.; Ren, S.Q.; Sun, J. Spatial Pyramid Pooling in Deep Convolutional Networks for Visual Recognition. IEEE Trans. Pattern Anal. Mach. Intell. 2015, 37, 1904–1916. [Google Scholar] [CrossRef]
- Girshick, R. Fast R-CNN. In Proceedings of the IEEE International Conference on Computer Vision, Santiago, Chile, 7–13 December 2015; pp. 1440–1448. [Google Scholar]
- Ren, S.Q.; He, K.M.; Girshick, R.; Sun, J. Faster R-CNN: Towards Real-Time Object Detection with Region Proposal Networks. IEEE Trans. Pattern Anal. Mach. Intell. 2017, 39, 1137–1149. [Google Scholar] [CrossRef]
- He, K.M.; Gkioxari, G.; Dollar, P.; Girshick, R. Mask R-CNN. In Proceedings of the 16th IEEE International Conference on Computer Vision (ICCV), Venice, Italy, 22–29 October 2017; pp. 2980–2988. [Google Scholar]
- Zhou, C.Q.; Hu, J.; Xu, Z.F.; Yue, J.B.; Ye, H.B.; Yang, G.J. A Novel Greenhouse-Based System for the Detection and Plumpness Assessment of Strawberry Using an Improved Deep Learning Technique. Front. Plant Sci. 2020, 11, 559. [Google Scholar] [CrossRef] [PubMed]
- Jiang, D.; Li, G.F.; Sun, Y.; Hu, J.B.; Yun, J.T.; Liu, Y. Manipulator grabbing position detection with information fusion of color image and depth image using deep learning. J. Ambient. Intell. Humaniz. Comput. 2021, 12, 10809–10822. [Google Scholar] [CrossRef]
- Ilyas, T.; Kim, H. A Deep Learning Based Approach for Strawberry Yield Prediction via Semantic Graphics. In Proceedings of the 21st International Conference on Control, Automation and Systems (ICCAS), Jeju, Korea, 12–15 October 2021; pp. 1835–1841. [Google Scholar]
- Liu, W.; Anguelov, D.; Erhan, D.; Szegedy, C.; Reed, S.; Fu, C.Y.; Berg, A.C. SSD: Single Shot MultiBox Detector. In Computer Vision—ECCV 2016; Part I; Lecture Notes in Computer Science; Springer: Berlin/Heidelberg, Germany, 2016; Volume 9905, pp. 21–37. [Google Scholar] [CrossRef]
- Redmon, J.; Divvala, S.; Girshick, R.; Farhadi, A. You Only Look Once: Unified, Real-Time Object Detection. In Proceedings of the 2016 IEEE Conference on Computer Vision and Pattern Recognition (CVPR), Las Vegas, NV, USA, 27–30 June 2016; pp. 779–788. [Google Scholar]
- Redmon, J.; Farhadi, A. YOLO9000: Better, Faster, Stronger. In Proceedings of the 30th IEEE/CVF Conference on Computer Vision and Pattern Recognition (CVPR), Honolulu, HI, USA, 21–26 July 2017; pp. 6517–6525. [Google Scholar]
- Redmon, J.; Farhadi, A. Yolov3: An Incremental Improvement. arXiv 2018, arXiv:1804.02767. [Google Scholar]
- Bochkovskiy, A.; Wang, C.Y.; Liao, H.Y.M. YOLOv4: Optimal speed and accuracy of object detection. arXiv 2020, arXiv:2004.10934. [Google Scholar]
- Ultralytics YOLOv5. 2021. Available online: https://github.com/ultralytics/yolov5 (accessed on 12 October 2021).
- Yang, R.; Pan, Z.R.; Jia, X.X.; Zhang, L.; Deng, Y.K. A Novel CNN-Based Detector for Ship Detection Based on Rotatable Bounding Box in SAR Images. IEEE J. Sel. Top. Appl. Earth Obs. Remote Sens. 2021, 14, 1938–1958. [Google Scholar] [CrossRef]
- Wang, H.; Shang, S.; Wang, D.; He, X.; Feng, K.; Zhu, H. Plant Disease Detection and Classifification Method Based on the Optimized Lightweight YOLOv5 Model. Agriculture 2022, 12, 931. [Google Scholar] [CrossRef]
- Liu, X.; Li, G.; Chen, W.; Liu, B.; Chen, M.; Lu, S. Detection of Dense Citrus Fruits by Combining Coordinated Attention and Cross-Scale Connection with Weighted Feature Fusion. Appl. Sci. 2022, 12, 6600. [Google Scholar] [CrossRef]
- Lv, J.; Xu, H.; Han, Y.; Lu, W.; Xu, L.; Rong, H.; Yang, B.; Zou, L.; Ma, Z. A Visual Identification Method for the Apple Growth Forms in the Orchard. Comput. Electron. Agric. 2022, 197, 106954. [Google Scholar] [CrossRef]
- Lyu, S.; Li, R.; Zhao, Y.; Li, Z.; Fan, R.; Liu, S. Green Citrus Detection and Counting in Orchards Based on YOLOv5-CS and AI Edge System. Sensors 2022, 22, 576. [Google Scholar] [CrossRef]
- Zhang, C.; Ding, H.; Shi, Q.; Wang, Y. Grape Cluster Real-Time Detection in Complex Natural Scenes Based on YOLOv5s Deep Learning Network. Agriculture 2022, 12, 1242. [Google Scholar] [CrossRef]
- Xu, Z.; Huang, X.; Huang, Y.; Sun, H.; Wan, F. A Real-Time Zanthoxylum Target Detection Method for an Intelligent Picking Robot under a Complex Background, Based on an Improved YOLOv5s Architecture. Sensors 2022, 22, 682. [Google Scholar] [CrossRef] [PubMed]
- Zhao, J.; Zhang, X.; Yan, J.; Qiu, X.; Yao, X.; Tian, Y.; Zhu, Y.; Cao, W. A Wheat Spike Detection Method in UAV Images Based on Improved YOLOv5. Remote Sens. 2021, 13, 3095. [Google Scholar] [CrossRef]
- Gao, G.H.; Wang, S.Y.; Shuai, C.Y.; Zhang, Z.H.; Zhang, S.; Feng, Y.B. Recognition and Detection of Greenhouse Tomatoes in Complex Environment. Traitement Signal 2022, 39, 291–298. [Google Scholar] [CrossRef]
- Chen, Z.; Wu, R.; Lin, Y.; Li, C.; Chen, S.; Yuan, Z.; Chen, S.; Zou, X. Plant Disease Recognition Model Based on Improved YOLOv5. Agronomy 2022, 12, 365. [Google Scholar] [CrossRef]
- Qi, J.; Liu, X.; Liu, K.; Xu, F.; Guo, H.; Tian, X.; Li, M.; Bao, Z.; Li, Y. An improved YOLOv5 model based on visual attention mechanism: Application to recognition of tomato virus disease. Comput. Electron. Agric. 2022, 194, 106780. [Google Scholar] [CrossRef]
- Zhang, D.; Luo, H.; Wang, D.; Zhou, X.; Li, W.; Gu, C.; Zhang, G.; He, F. Assessment of the levels of damage caused by Fusarium head blight in wheat using an improved YoloV5 method. Comput. Electron. Agric. 2022, 198, 107086. [Google Scholar] [CrossRef]
- Xiong, R.; Yang, Y.; He, D.; Zheng, K.; Zheng, S.; Xing, C.; Zhang, H.; Lan, Y.; Wang, L.; Liu, T. On layer normalization in the transformer architecture. In Proceedings of the International Conference on Machine Learning, Online, 13–18 July 2020; pp. 10524–10533. [Google Scholar]
- Loshchilov, I.; Hutter, F. SGDR: Stochastic gradient descent with warm restarts. arXiv 2016, arXiv:1608.03983. [Google Scholar]
- Tay, Y.; Tuan, L.A.; Hui, S.C. Multi-Pointer Co-Attention Networks for Recommendation. In Proceedings of the 24th ACM SIGKDD International Conference on Knowledge Discovery & Data Mining, London, UK, 19–23 August 2018; pp. 2309–2318. [Google Scholar] [CrossRef]
- Jhamb, Y.; Ebesu, T.; Fang, Y. Attentive Contextual Denoising Autoencoder for Recommendation. In Proceedings of the 2018 ACM SIGIR International Conference on Theory of Information Retrieval (ICTIR’18), Tianjin, China, 14–17 September 2018; pp. 27–34. [CrossRef]
- Chen, J.Y.; Zhang, H.W.; He, X.N.; Nie, L.Q.; Liu, W.; Chua, T.S. Attentive Collaborative Filtering: Multimedia Recommendation with Item- and Component-Level Attention. In Proceedings of the 40th International ACM SIGIR Conference on Research and Development in Information Retrieval, Tokyo, Japan, 7–11 August 2017; pp. 335–344. [Google Scholar] [CrossRef]
- Hou, Q.B.; Zhou, D.Q.; Feng, J.S. Coordinate Attention for Efficient Mobile Network Design. In Proceedings of the IEEE/CVF Conference on Computer Vision and Pattern Recognition (CVPR), Electr Network, Online, 19–25 June 2021; pp. 13708–13717. [Google Scholar]
- Han, K.; Wang, Y.H.; Tian, Q.; Guo, J.Y.; Xu, C.J.; Xu, C. GhostNet: More Features from Cheap Operations. In Proceedings of the IEEE/CVF Conference on Computer Vision and Pattern Recognition (CVPR), Electr Network, Seattle, WA, USA, 14–19 June 2020; pp. 1577–1586. [Google Scholar]
- Zheng, Z.H.; Wang, P.; Liu, W.; Li, J.Z.; Ye, R.G.; Ren, D.W. Distance-IoU Loss: Faster and Better Learning for Bounding Box Regression. In Proceedings of the 34th AAAI Conference on Artificial Intelligence/32nd Innovative Applications of Artificial Intelligence Conference/10th AAAI Symposium on Educational Advances in Artificial Intelligence, New York, NY, USA, 7–12 February 2020; pp. 12993–13000. [Google Scholar]
- Zhang, Y.F.; Ren, W.; Zhang, Z.; Jia, Z.; Wang, L.; Tan, T. Focal and Effificient IOU Loss for Accurate Bounding Box Regression. arXiv 2021, arXiv:2101.08158v1. [Google Scholar]
- Howard, A.; Sandler, M.; Chu, G.; Chen, L.C.; Chen, B.; Tan, M.X.; Wang, W.J.; Zhu, Y.K.; Pang, R.M.; Vasudevan, V.; et al. Searching for MobileNetV. In Proceedings of the IEEE/CVF International Conference on Computer Vision (ICCV), Seoul, Korea, 27 October–2 November 2019; pp. 1314–1324. [Google Scholar]


Publisher’s Note: MDPI stays neutral with regard to jurisdictional claims in published maps and institutional affiliations. |
© 2022 by the authors. Licensee MDPI, Basel, Switzerland. This article is an open access article distributed under the terms and conditions of the Creative Commons Attribution (CC BY) license (https://creativecommons.org/licenses/by/4.0/).