Communication

Measurement of Overlapping Leaf Area of Ice Plants Using Digital Image Processing Technique

Department of Bio-Systems Engineering, Institute of Smart Farm, Gyeongsang National University, Jinju 52828, Korea
*
Author to whom correspondence should be addressed.
Agriculture 2022, 12(9), 1321; https://doi.org/10.3390/agriculture12091321
Submission received: 14 June 2022 / Revised: 17 August 2022 / Accepted: 23 August 2022 / Published: 27 August 2022
(This article belongs to the Section Digital Agriculture)

Abstract

:
Non-destructive and destructive leaf area estimation are critical in plant physiological and ecological experiments. In modern agriculture, ubiquitous digital cameras and scanners are primarily replacing traditional leaf area measurements. Thus, measuring the leaflet’s dimension is integral in analysing plant photosynthesis and growth. Leaf dimension assessment with image processing is widely used nowadays. In this investigation employed an image segmentation algorithm to classify the ice plant (Mesembryanthemum crystallinum L.) canopy image with a threshold segmentation technique by grey colour model and calculating the degree of green colour in the HSV (hue, saturation, value) model. Notably, the segmentation technique is used to separate suitable surfaces from a defective noisy background. In this work, the canopy area was measured by pixel number statistics relevant to the known reference area. Furthermore, this paper proposed total leaf area estimation in a destructive method by a computer coordinating area curvimeter and lastly evaluated the overlapping percentage using the total leaf area and canopy area measurements. To assess the overlapping percentage using the proposed algorithm, the curvimeter method experiment was performed on 24 images of ice plants. The obtained results reveal that the overlapping percentage is less than 10%, as evidenced by a difference in the curvimeter and the proposed algorithm’s results with the canopy leaf area approach. Furthermore, the results show a strong correlation between the canopy and total leaf area (R2: 0.99) calculated by our proposed method. This overlapping leaf area finding offers a significant contribution to crop evolution by using computational techniques to make monitoring easier.

1. Introduction

Leaves are fundamental organs to plants and constitute plants’ power generation and aerial environmental sensing units [1]. The amount of photosynthetic light harvested depends directly on the leaf area. Leaf area plays an integral role in plant growth analysis and presumably crop growth, photosynthetic efficiency, light interception, and transpiration. Furthermore, leaf area is a key index in plant breeding practices and plant growth measurement. According to Carvalho et al., 2017 [1], leaf area also indicates productivity and cultural and technical evaluations, such as seedling density, fertilizer, irrigation, and agrochemical application.
In this sense, in modern agriculture, there are direct and indirect techniques for calculating leaf area. Direct methods are destructive, expensive, and involve electronic meters that are difficult to maintain [2]. Therefore, contemporary global operations focus on non-destructive accuracy methods for leaf area and canopy area measurement, as revealed by Madhavi et al., 2021 [3]. Moreover, compared to the destructive method, the major advantage of the non-destructive method is that the dimensions of the leaf surface are measured without detaching the leaf from the plant surface [4]. Regardless, various destructive approaches have been investigated in recent years, namely, the square grid method, planimeter method, gravimetric method, and regression equitation method [4].
The grid counting method entails projecting the leaf onto a piece of grid paper, sketching the leaf surface on the grid paper with a pencil, and counting the number of grids covered by the leaf. This method is time-consuming and laborious to implement for many leaves [5]. The planimeter method consists of two units, a stationary optical scanning system and a microcomputer system (MS), to facilitate embedded and controlling functions. The leaf is placed on a conveyer belt and driven by a servomechanism and controlled by the MS unit. On each leaf, the sample propagates by 0.1 cm and an optical scanner measures the maximum length and breadth of the leaf and registers it as an area, as reported by Dey et al., 2019 [6].
The plant’s leaf is specifically removed and placed on white paper in the gravimetric procedure. Then, the paper is sliced to match the shape of the leaf. The weight of this paper is eventually compared to the weight of the known area on the same piece of paper. The constraints of this approach are difficult and time-consuming when applied to a large number of leaves [1].
Furthermore, as indicated by Montgomery et al., 1911 [7], the regression equation approach estimates the leaf area using the following formula: A = b × l × w, where b is the leaf shape coefficient, l is the length of the leaf, and w is the width of the leaf [4]. Even though this method is fast, the limitation associated with this formula is not similar for every plant, and b varies depending on the plant type.
Accurate and comprehensive validations are still difficult due to the limitations of direct measurement. Several challenges remain, given the requirement of increased accuracy for indirect measurements [8]. The clumping effect, leaf inclination angle, and woody component affect the accuracy of indirect and direct leaf area measurements. Clumping effect correction attained significant progress for continuous canopies with non-randomly distributed leaves [8,9,10].
Indirect non-destructive methods are more straightforward and faster and are not affected by human subjective factors like destructive methods are. However, the accurate evaluation of non-destructive methods highly correlates with the results of destructive methods as ground truths [11]. Digital image processing is one effective non-destructive method for implementing canopy area calculation to analyse plant growth. The canopy area consists of overlapped leaves that are captured by a digital camera. The overlapping leaf area of plants demonstrates the disparity between the actual total leaf area and the canopy area [12].
The image segmentation from plant leaves is one of the effective methods to obtain biomass characteristics from a complicated background. As a result, crop growth conditions, diseases, and insect pest damage are all monitored using the target leaf from the collected photographs. Image segmentation consists of threshold-based methods, region-based methods, edge-based methods, model-based growing methods, and clustered-based methods, as reported by Wang et al., 2018 [12].
The Otsu and Canny operators were proposed by Wang et al., 2013 [13], to segment a single leaf from a leaf image retrieved from an online system’s video stream. Cerutti et al., 2013 [14], devised a two-step active contour segmentation algorithm based on a polygonal leaf model to extract the contour of the leaf from the background. Grand et al., 2015 [15], reported the comparative study of various segmentation methods for images of tree leaves. Chaudhary et al., 2012 [4], proposed CIELAB colour space and the Otsu method for the L component for image segmentation. Simultaneously, the region filling technique was applied to the binary image for calculating the leaf area.
Researchers have used the aforementioned image processing techniques to measure whole leaf and canopy areas accurately [12]. Total and canopy area of leaves are calculated by the following methods: image acquisition, image pre-processing, segmentation, region filling, and area calculation. In addition, other researchers apply threshold-based segmentation or contour extraction approaches for leaf region segmentation [16].
Previously, most of the research focused on leaf area index combined a deep learning algorithm and RGB images obtained by multispectral images. Yamaguchi et al., 2020 [10], explored the leaf area index of rice plant leaves using the RGB images with the model developed by deep learning algorithms. The results showed that the estimation accuracy of the model developed by deep learning was obtained with the highest performance metrics (R2 = 0.963, and RMSE = 0.334) [10]. Apolo et al., 2020 [17], revealed that the measurement of leaf area index in wheat breeding based on gap theory analysis and the hemispherical photograph showed high performance (R2 = 0.94) compared to the ground truth (R2 = 0.81). Moreover, the main drawback of the deep learning approach for leaf area estimation is that more datasets are needed compared to the image processing approach. This study mainly focused on the image processing approach to measure the overlapping leaf area of ice plants. Islam et al., 2021 [18], proposed an image processing algorithm to estimate ice plant leaf area from RGB images under different light conditions. Consequently, the leaf area was calculated from the number of pixels and using the known object area. The results depicted that the correlation between actual and measured leaf area was found to be over R2 = 0.97 under different light conditions.
The canopy area of ice plant leaves in the juvenile stage was measured using an image processing-based approach in this study. Subsequently, the total leaf area of the same ice plant leaves was measured manually using a computer coordinating area curvimeter. The overlapping leaf area was calculated as the difference between the total leaf area and canopy area and is presented as an overlapping percentage. The significance of finding the overlapping leaf area of ice plants is determining the plant productivity, photosynthetic rate, and light interception capacity. Moreover, this proposed algorithm for image segmentation is simple and easily applicable for a greenhouse or closed-type plant production system and does not require highly expensive equipment for leaf area monitoring. Previously, many researchers attempted to use the HSV colour space model for calculating the leaf area. To date, very few studies have applied the image-based leaf area estimation technique for ice plants, especially those grown in plant factories. There is an overall lack of research on the overlapping leaf area measurements of ice plants. To the best of our knowledge, this study is the first of its kind to evaluate the overlapping percentage of ice plants using a destructive and non-destructive method. The method developed in this study can also be used to discern the overlapping leaf area and canopy area of different flat, green, leafy vegetables in the future.

2. Materials and Methods

2.1. Experimental Design

The present investigation was carried out in the controlled plant factory system at Smart Farm Systems Laboratory of Gyeongsang National University, South Korea. The cultivation period spanned from early March to late June 2021, which mostly coincided with the summer season. The plant factory was equipped with control systems recording temperature, humidity, light luminance, and CO2, automatically monitored daily using a specific high-precision sensor unit (Hanam Engineering Co. Ltd., Hanam, Korea) [3,19,20]. The light effects were the same, and the images were taken under light-emitting diodes (LEDs) in controlled conditions in the plant factory, as shown in Figure 1.
Plant images were taken using the digital camera and software implemented in Google Colaboratory and an algorithm developed by the Python program language. The experiment was carried out on 24 ice plant samples different in size and shape to test the performance of the suggested algorithm.
Subsequently, images were resized and converted into HSV colour spaces to extract the image intensity from chroma or the colour information [4]. Consequently, mask the green, sliced the green mask, converted it into two channels, and applied the threshold to all images. The same procedure was applied to the yellow and cyan mask images. Eventually, the final threshold was used for two-channel images. Initially, the same process was applied for reference. The following method was implemented after converting to HSV colour space. Concurrently, the reference magenta colour was masked, the extra mask was sliced, and the background was eroded. Eventually, all the reference images were converted into two channels, and thresholding was applied. Correspondingly, the pixel values of plants and relevant references were calculated. The last canopy area of all ice plants was calculated using a known reference area (Supplementary File S1). Subsequently, ice plant leaves were scanned on grid paper. In the last step, the total leaf area of the same ice plant leaves was measured directly using a computer coordinating area curvimeter. Eventually, the overlapping percentage (%) was calculated by utilising total leaf area and canopy area.

2.2. Calculation of Canopy Area and Total Leaf Area

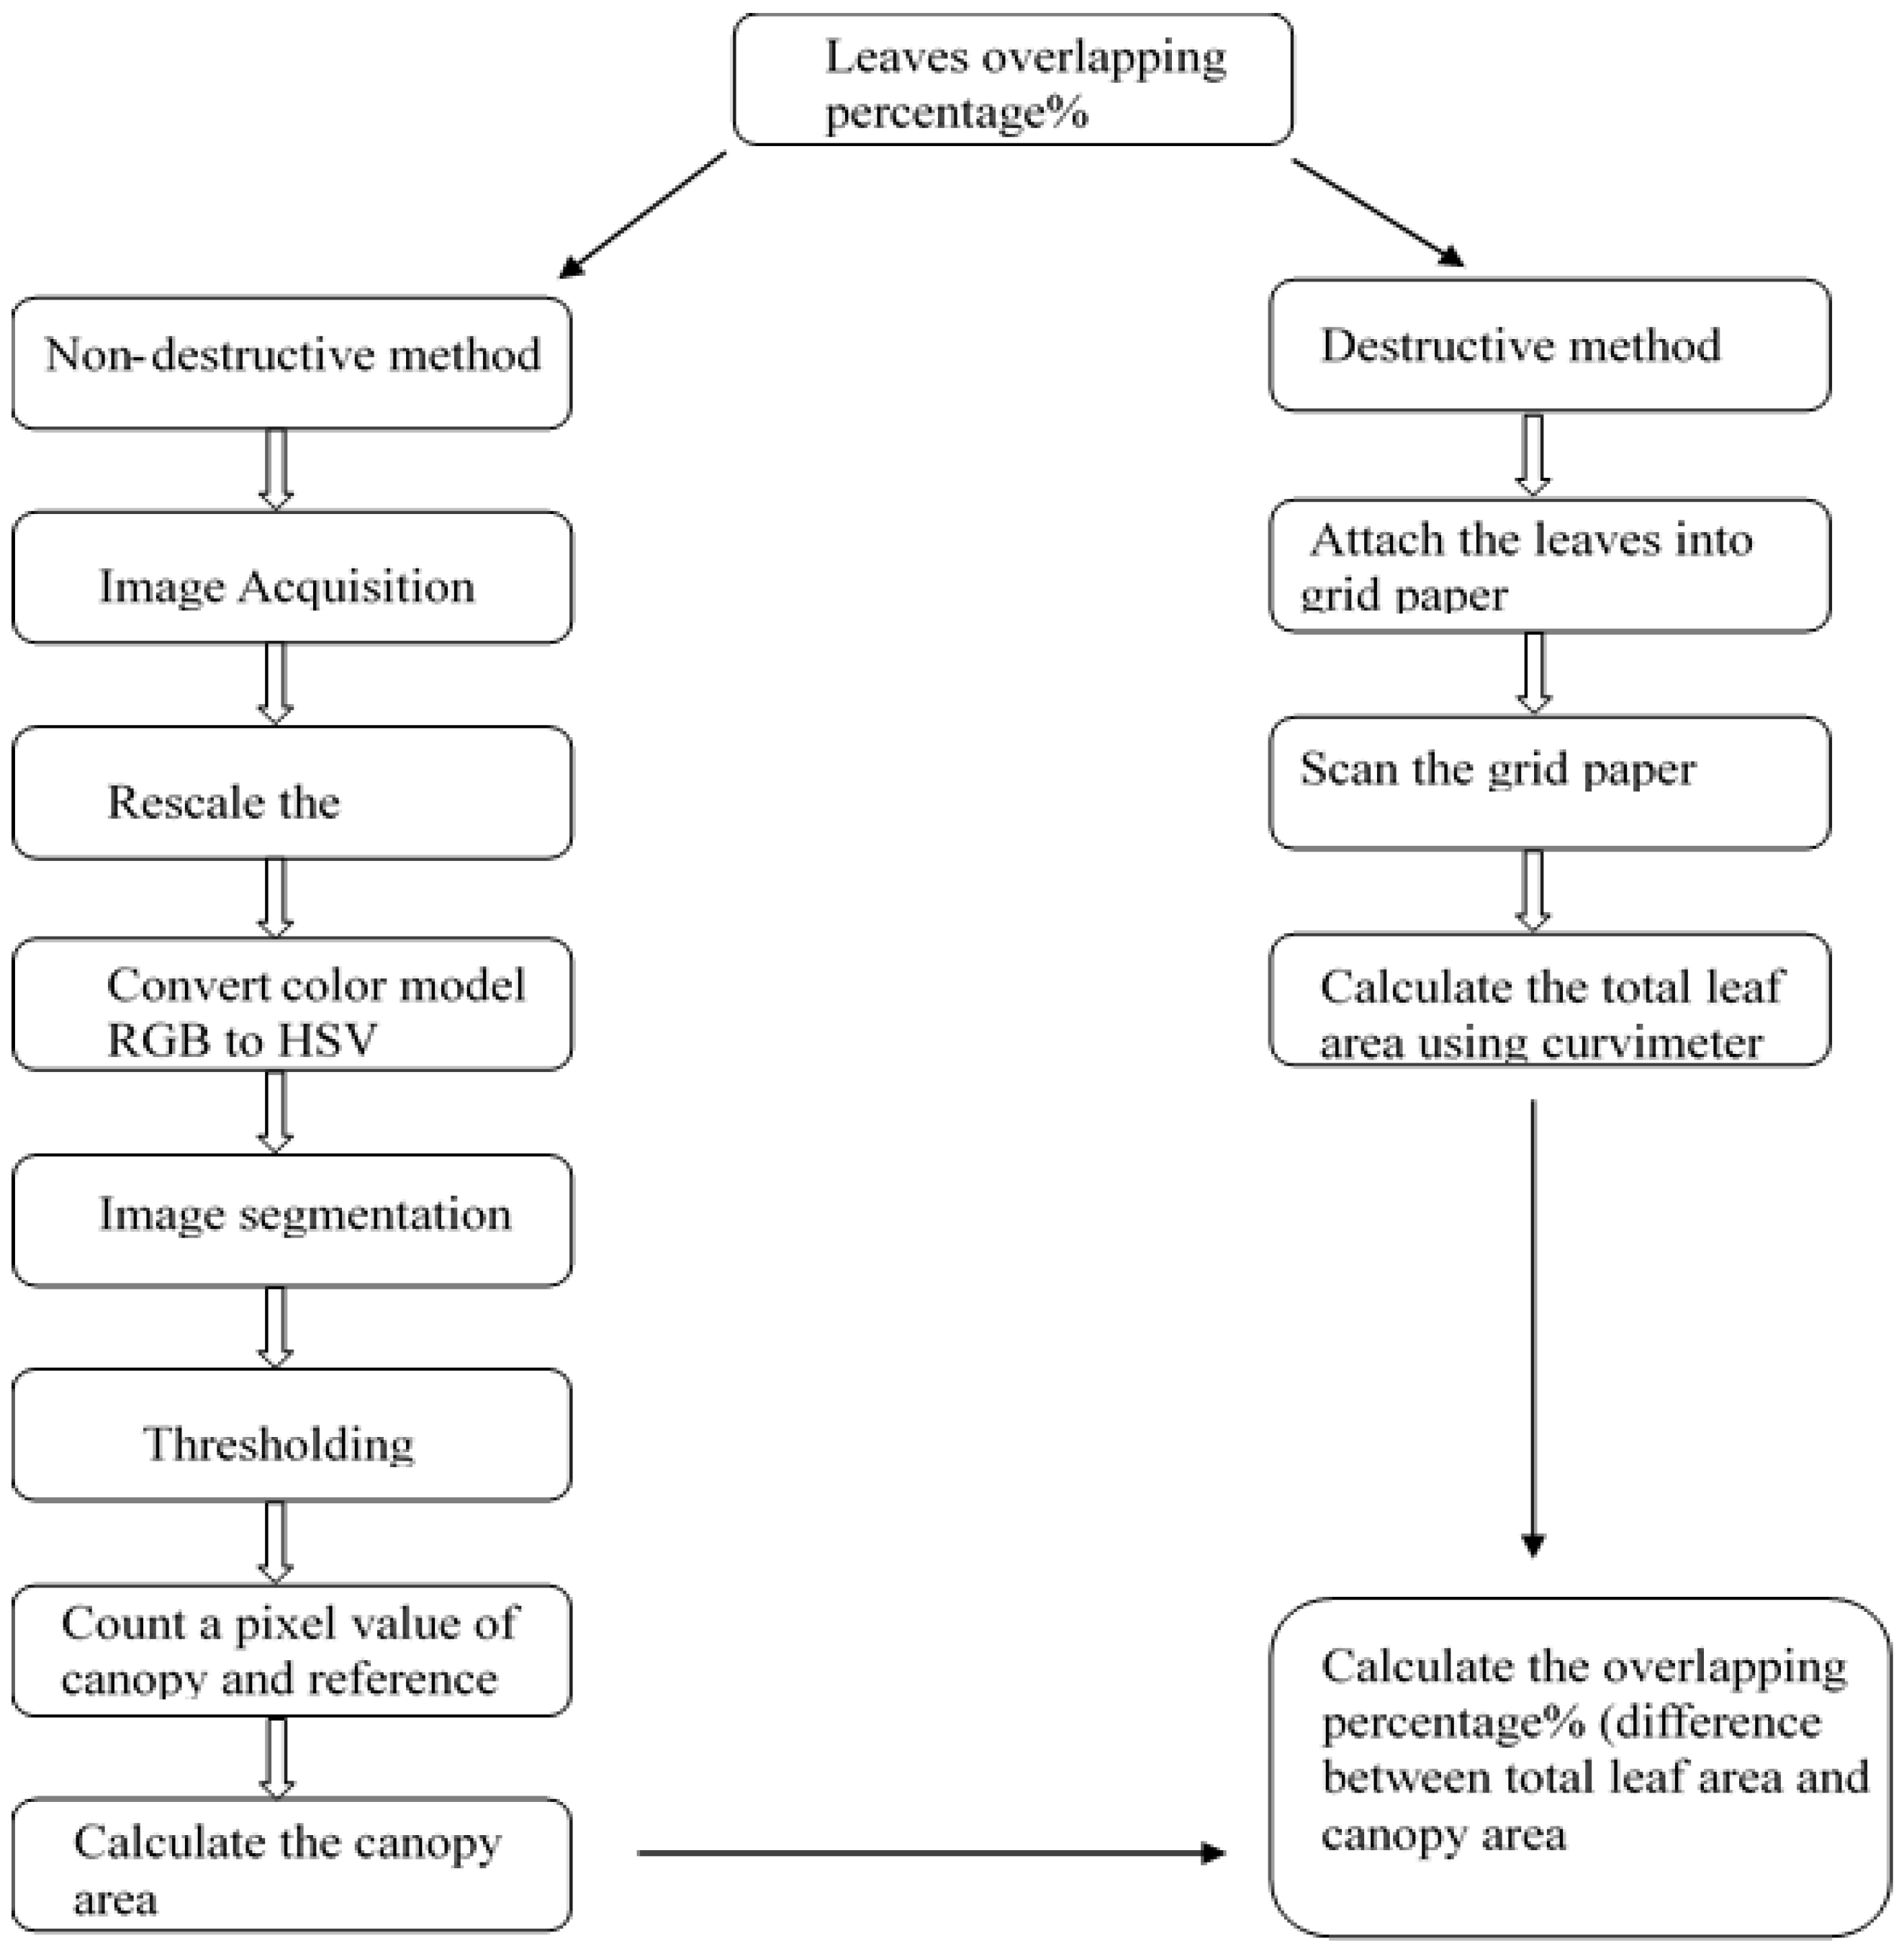
All the procedures for calculating the canopy and total leaf area were implemented according to the diagram illustrated in Figure 2.

2.3. Measurement of the Canopy Area

2.3.1. Image Acquisition

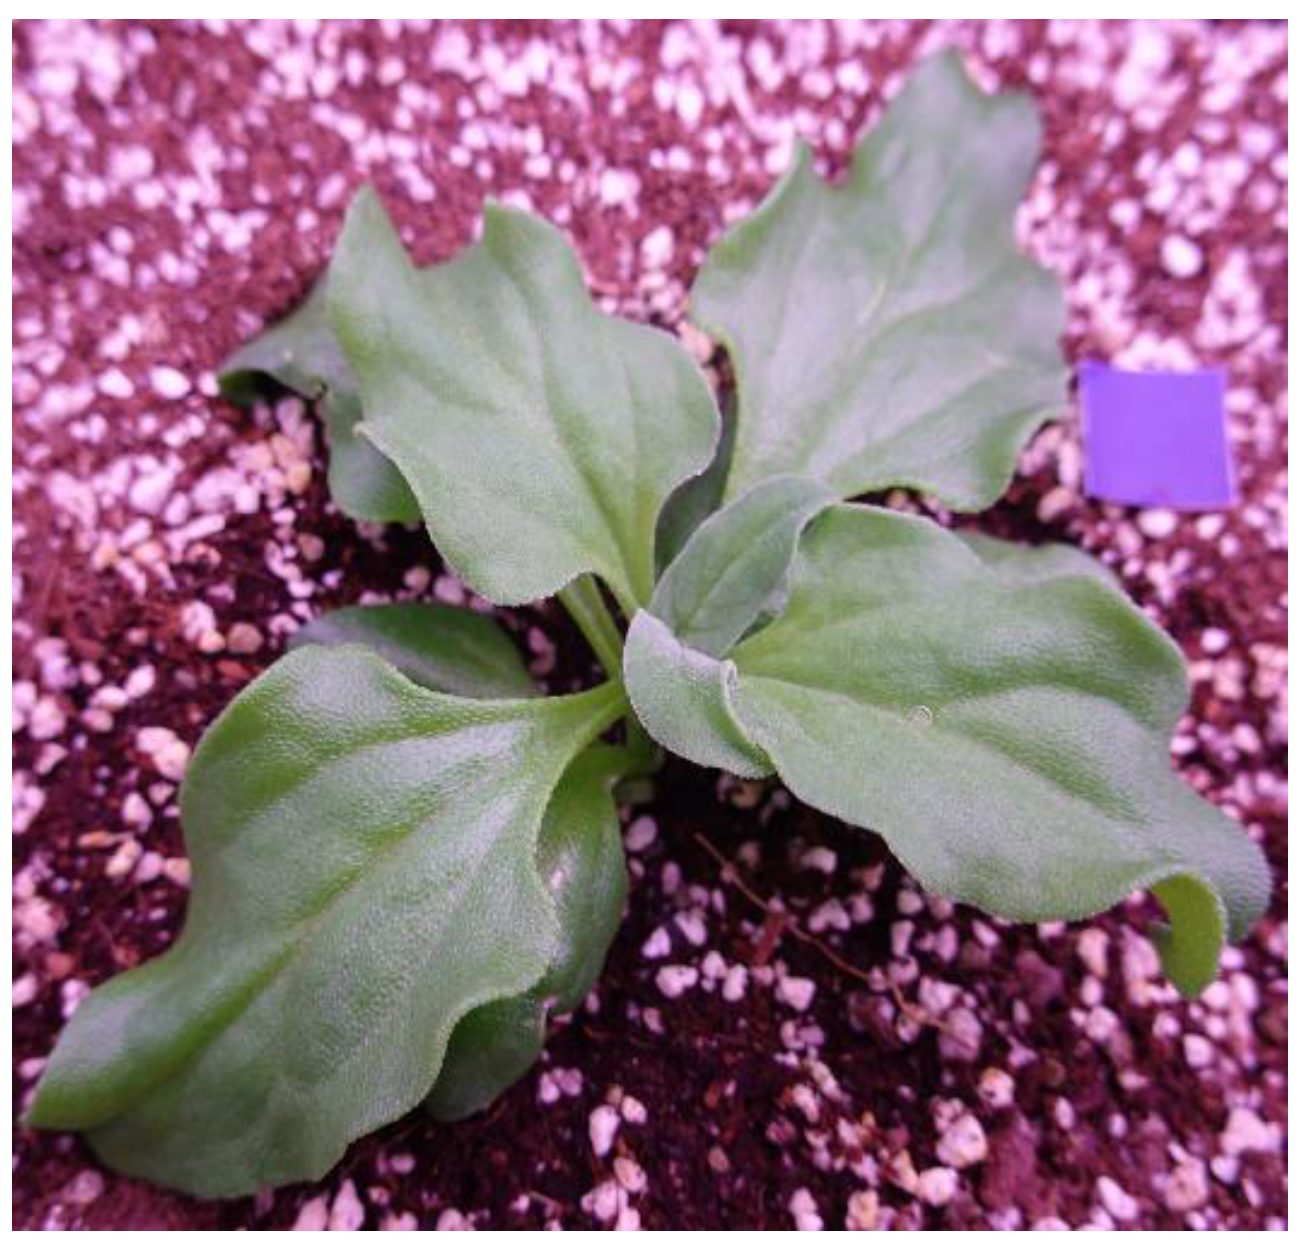
The images of ice plant canopies were obtained using a digital camera (SONY DSC-RX100 vii, Seoul, Korea). For image acquisition, the camera was placed on top of the plant, and the camera angle was nadir to the plant. All images had a resolution of 5472 × 3648 pixels and were stored in JPEG format for the image acquisition; the reference was placed close to the plant. All images were cropped and rescaled up to 25% to reduce the background effect.
The images of ice plants were captured with the purple-coloured square-shaped reference (4 cm2) shown in Figure 3.
  • Image colour transform
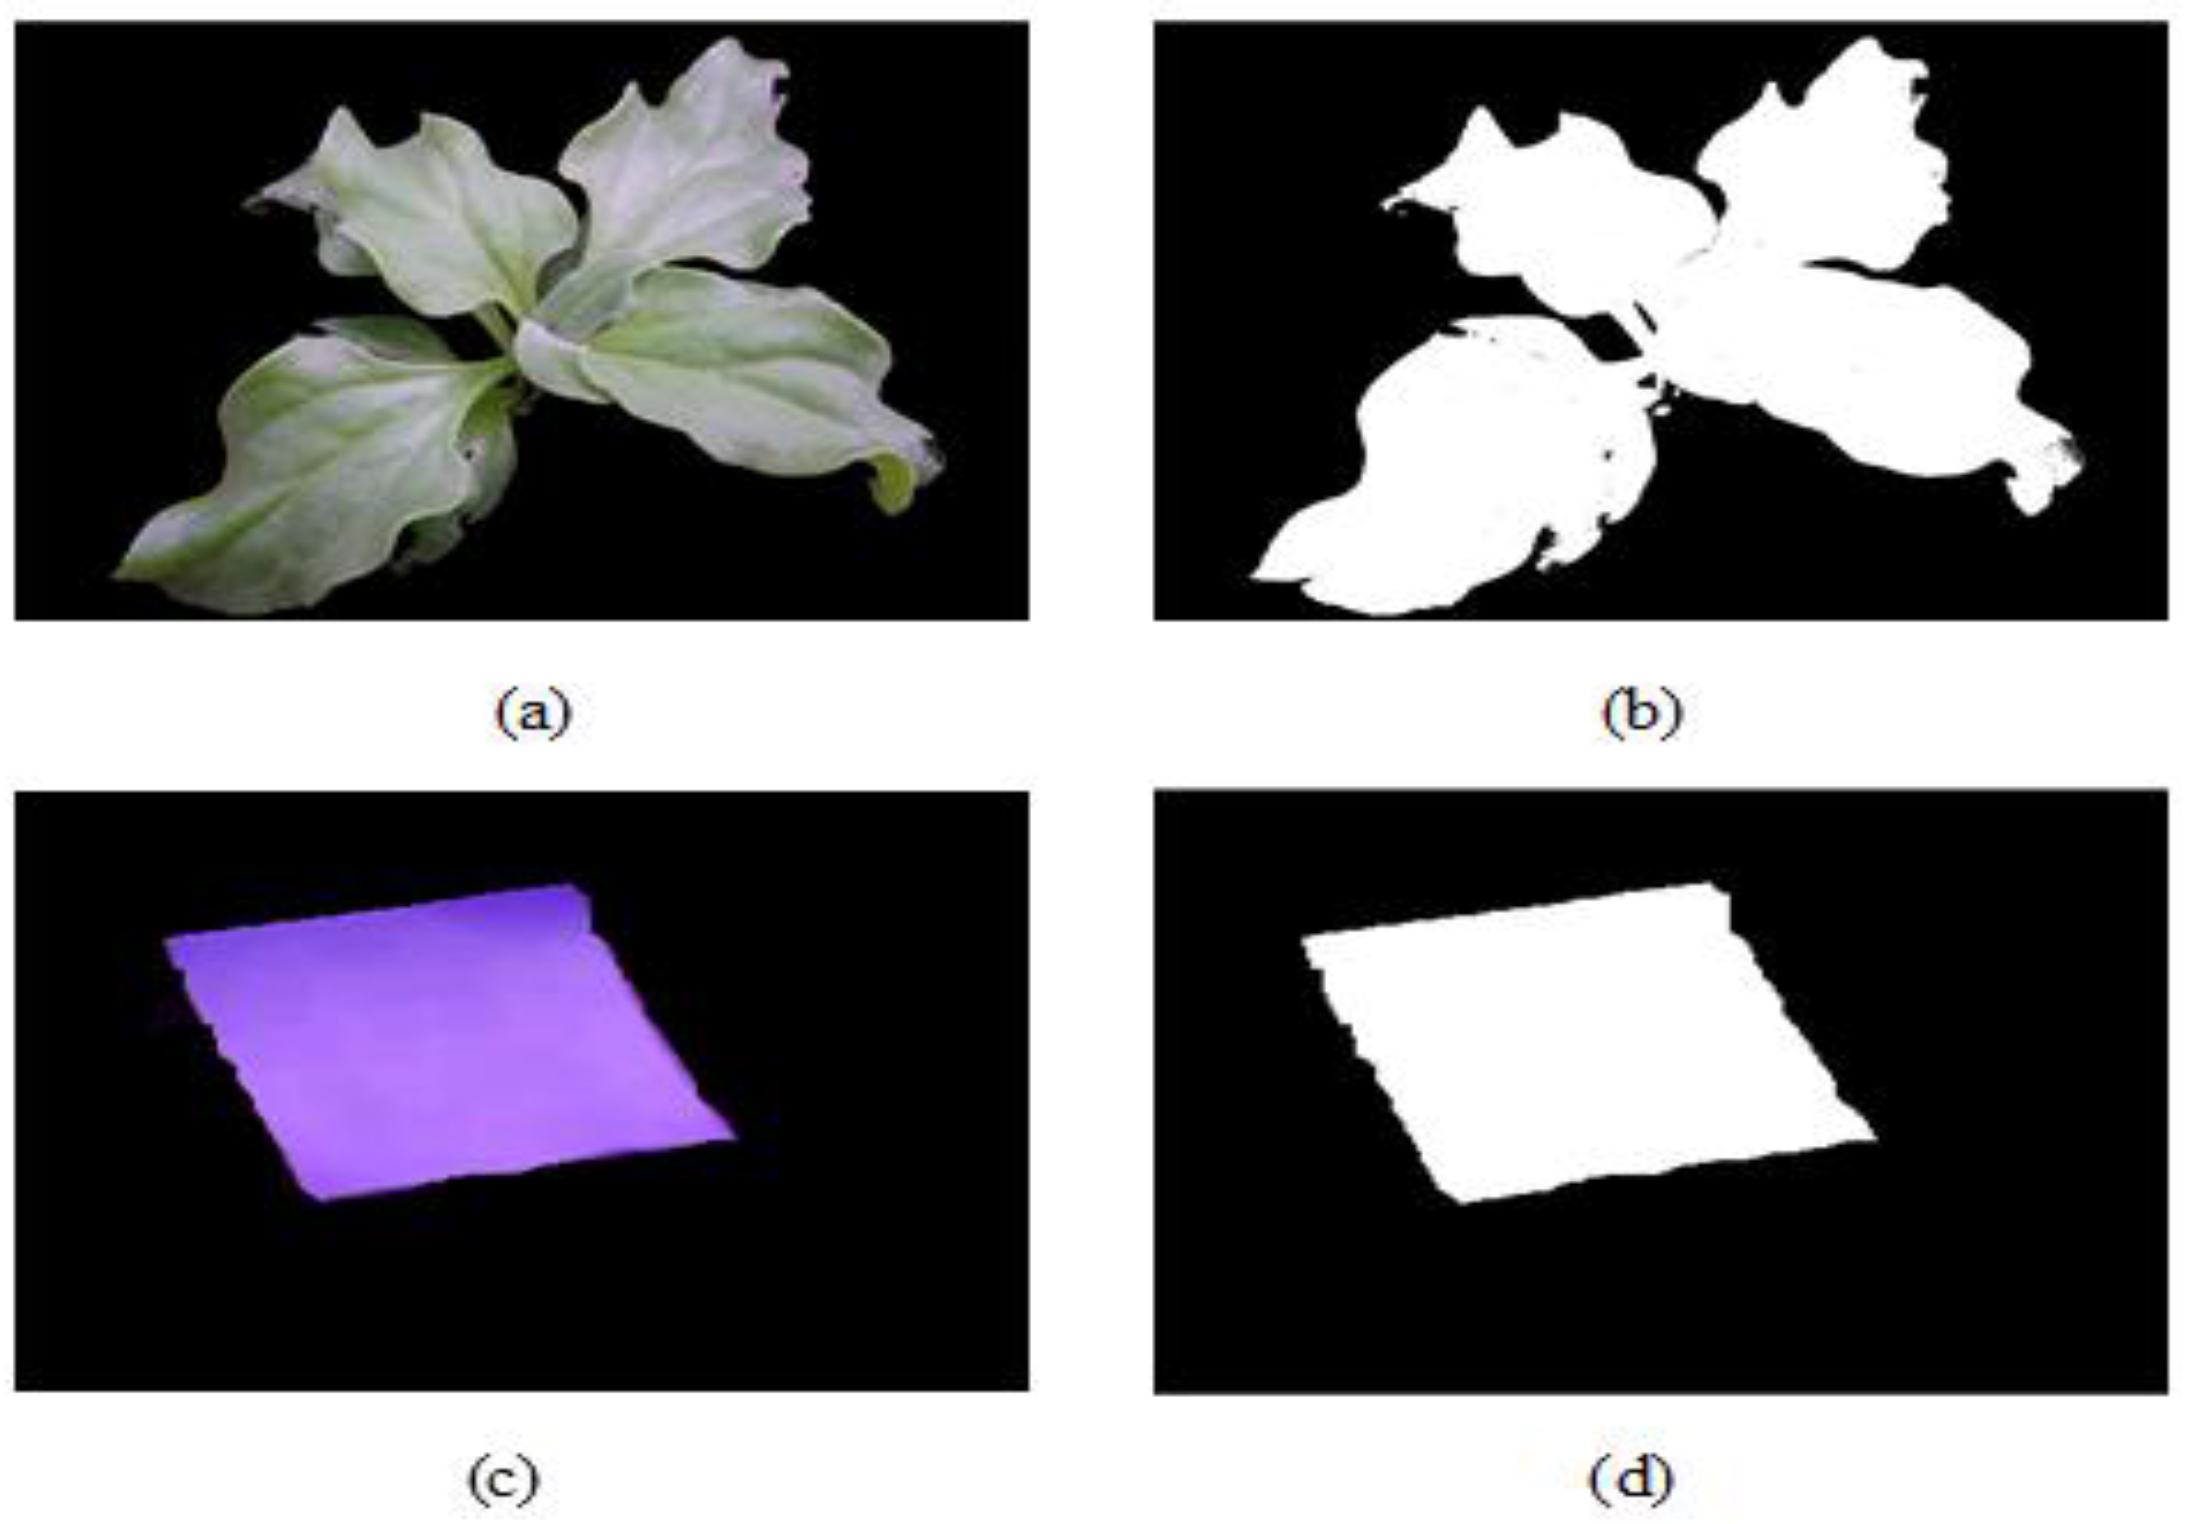
All images were transformed from RGB to HSV colour space to wipe out the noise introduced from the background. Furthermore, this colour space image was used for classification based on the colour of the object. In this image type, the hue channel was used to decide the colour type. The saturation channel represented shades of that colour, and the value channel presented the brightness of the colour [16]. Using HSV images, the green pixels representing the green canopy were classified from each image, as shown in Figure 4.
The colours of an image were differentiated based on Equation (1), which returns a vector with the data that defines the resulting image [16].
dst (I) = {255 → lowerb (I)0 ≤ src (I)0 ≤ upperb (I)0
0 → of the opposite
where dst (I) corresponds to the vector or returned image, 255 is the size of each pixel of the src (I)0 vector or input image, and lowerb (I)0 and upperb (I)0 refer to the lower and upper limits of the HSV colour space, respectively.
b.
Image segmentation
Image segmentation is a process of grouping together pixels that have similar attributes. Notably, this process is integral to correlating the leaf, reference object, and background image. Leaf canopy and the reference were segmented using the threshold technique. The threshold was applied to segment the mask images that extracted the green, yellow, and cyan colour of the canopy. Simultaneously, the colour channel image was retained as the candidate image for the subsequent image segmentation. Eventually, the canopy image was segmented according to the mean value of the grey image and the same colour for the foreground and a different colour for the background, as reported by Chaudhary et al., 2012 [4]. This segmented image was inverted to binary images to determine the pixel values of the plant canopy and the reference (Figure 4).

2.3.2. Canopy Area Calculation

The canopy area of the ice plant was calculated through pixel number statistics. The number of pixels of the leaf region and reference region was measured. In this paper, the reference area is 2 × 2 cm2, or 4 cm2. The canopy area was calculated using Equation (2), as proposed by Lu et al., 2010 [11].
  S l = S f × P l   P f
where Sl and Sf denote the area of the canopy and the reference, respectively. Moreover, Pl and Pf indicate the pixel number of the canopy and the reference. Notably, Sf is known. Pl can be obtained by counting the number of pixels with the grey value of 255 in the plant canopy image. Furthermore, Pf is acquired because the square-shaped reference in the corrected image is known.

2.4. Total Leaf Area Calculation

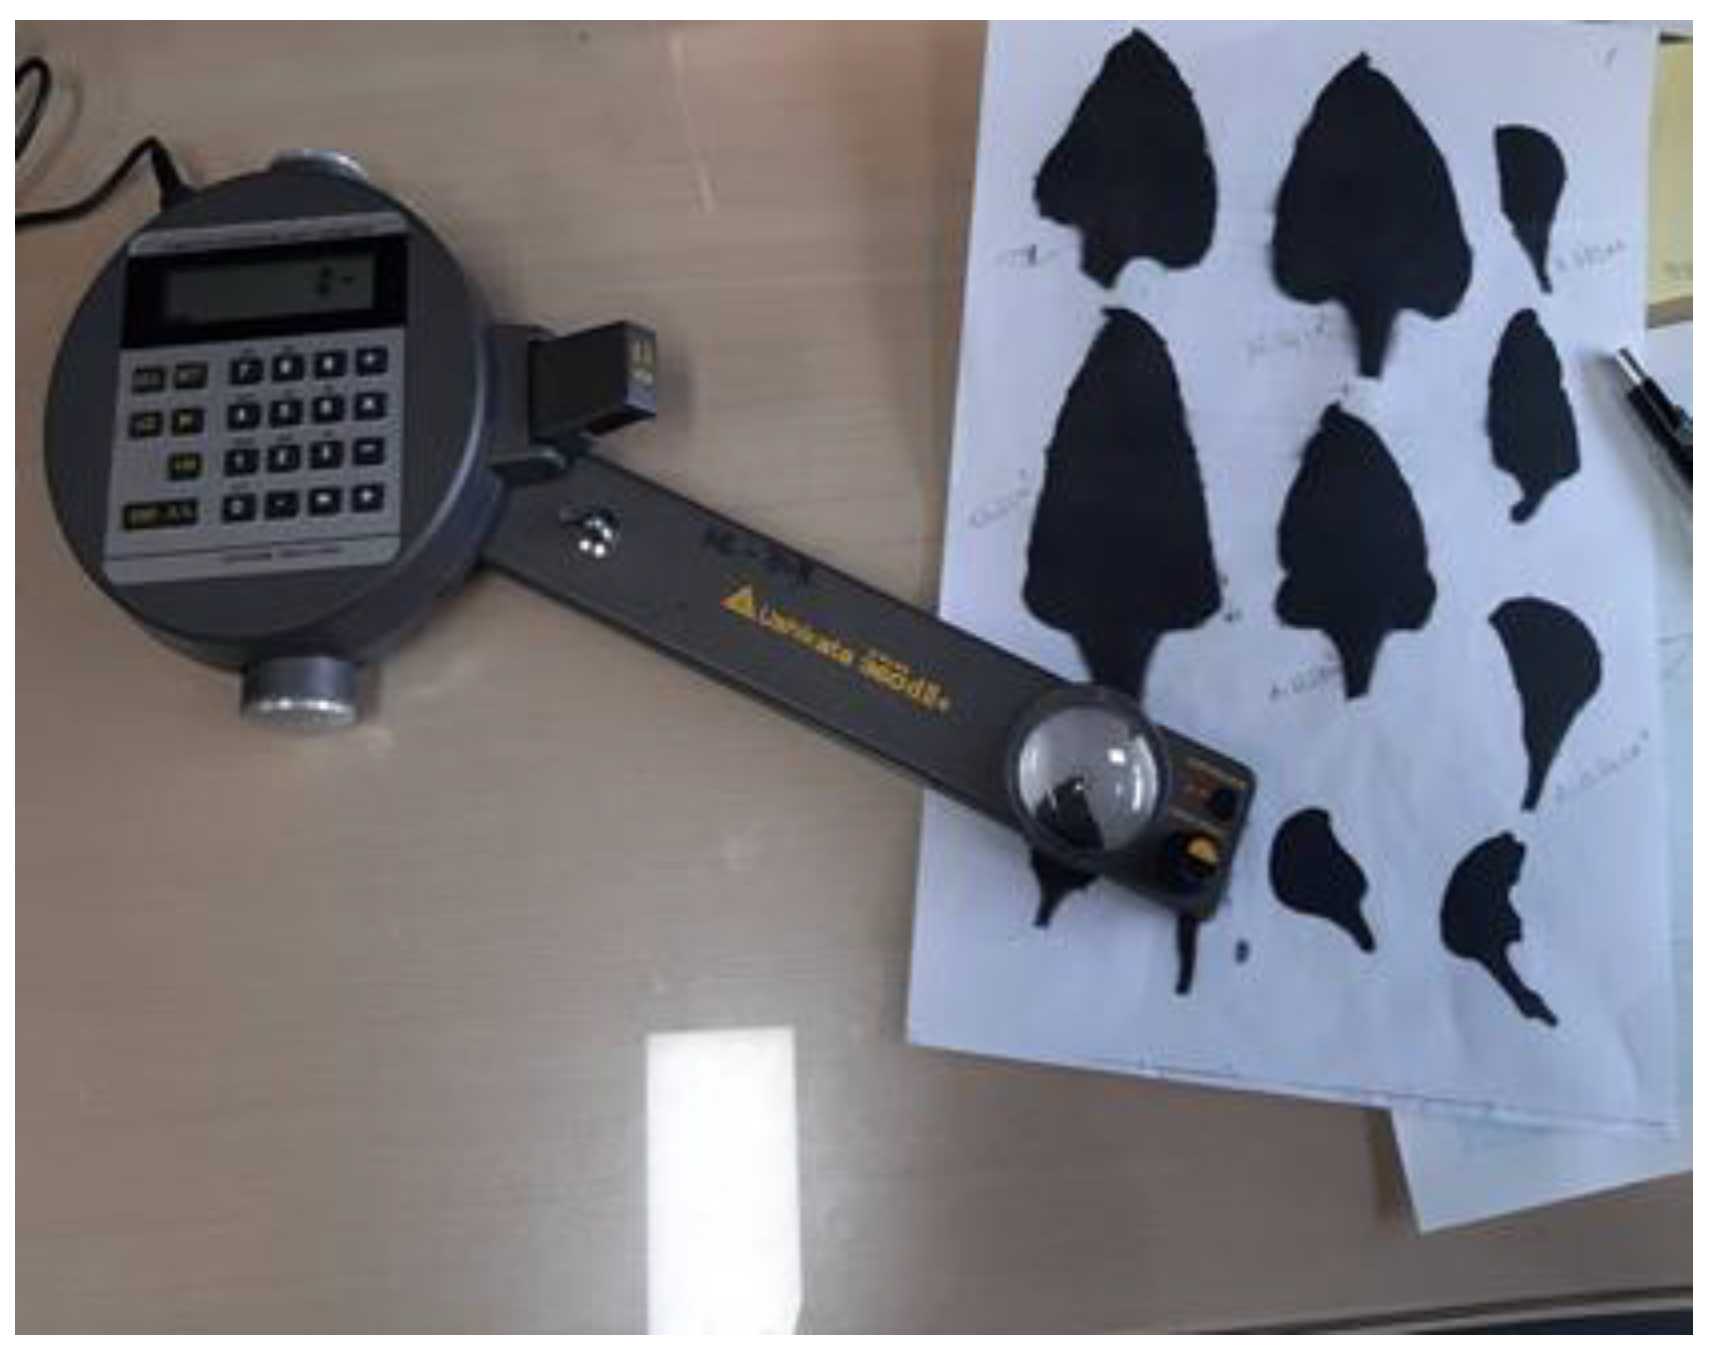
The ice plant samples which were applied for image processing, utilised the total leaf area calculation. Initially, all ice plant leaves were attached to grid papers and scanned by the scanner (Canon Image FORMULA DRM160II). Concurrently, the leaf area was calculated by a computer coordinating area curvimeter (Ushikata Shokai X-Plan360dii, Kobe, Japan), as demonstrated in Figure 5. The accuracy of the curvimeter method was scrutinised with the grid count method. Curvimeter readings coincided with the grid count method. Therefore, the curvimeter method was implemented for all ice plant leaves. Eventually, the overlapping leaf percentage was evaluated by Equation (3), as proposed by Primer et al., 2018 [21].
Leaves   overlapping   percentage ( % ) = Total   leaf   area   ( TA ) Canopy   area   ( CA ) Total   leaf   area   ( TA )   × 100

2.5. Validation Procedure

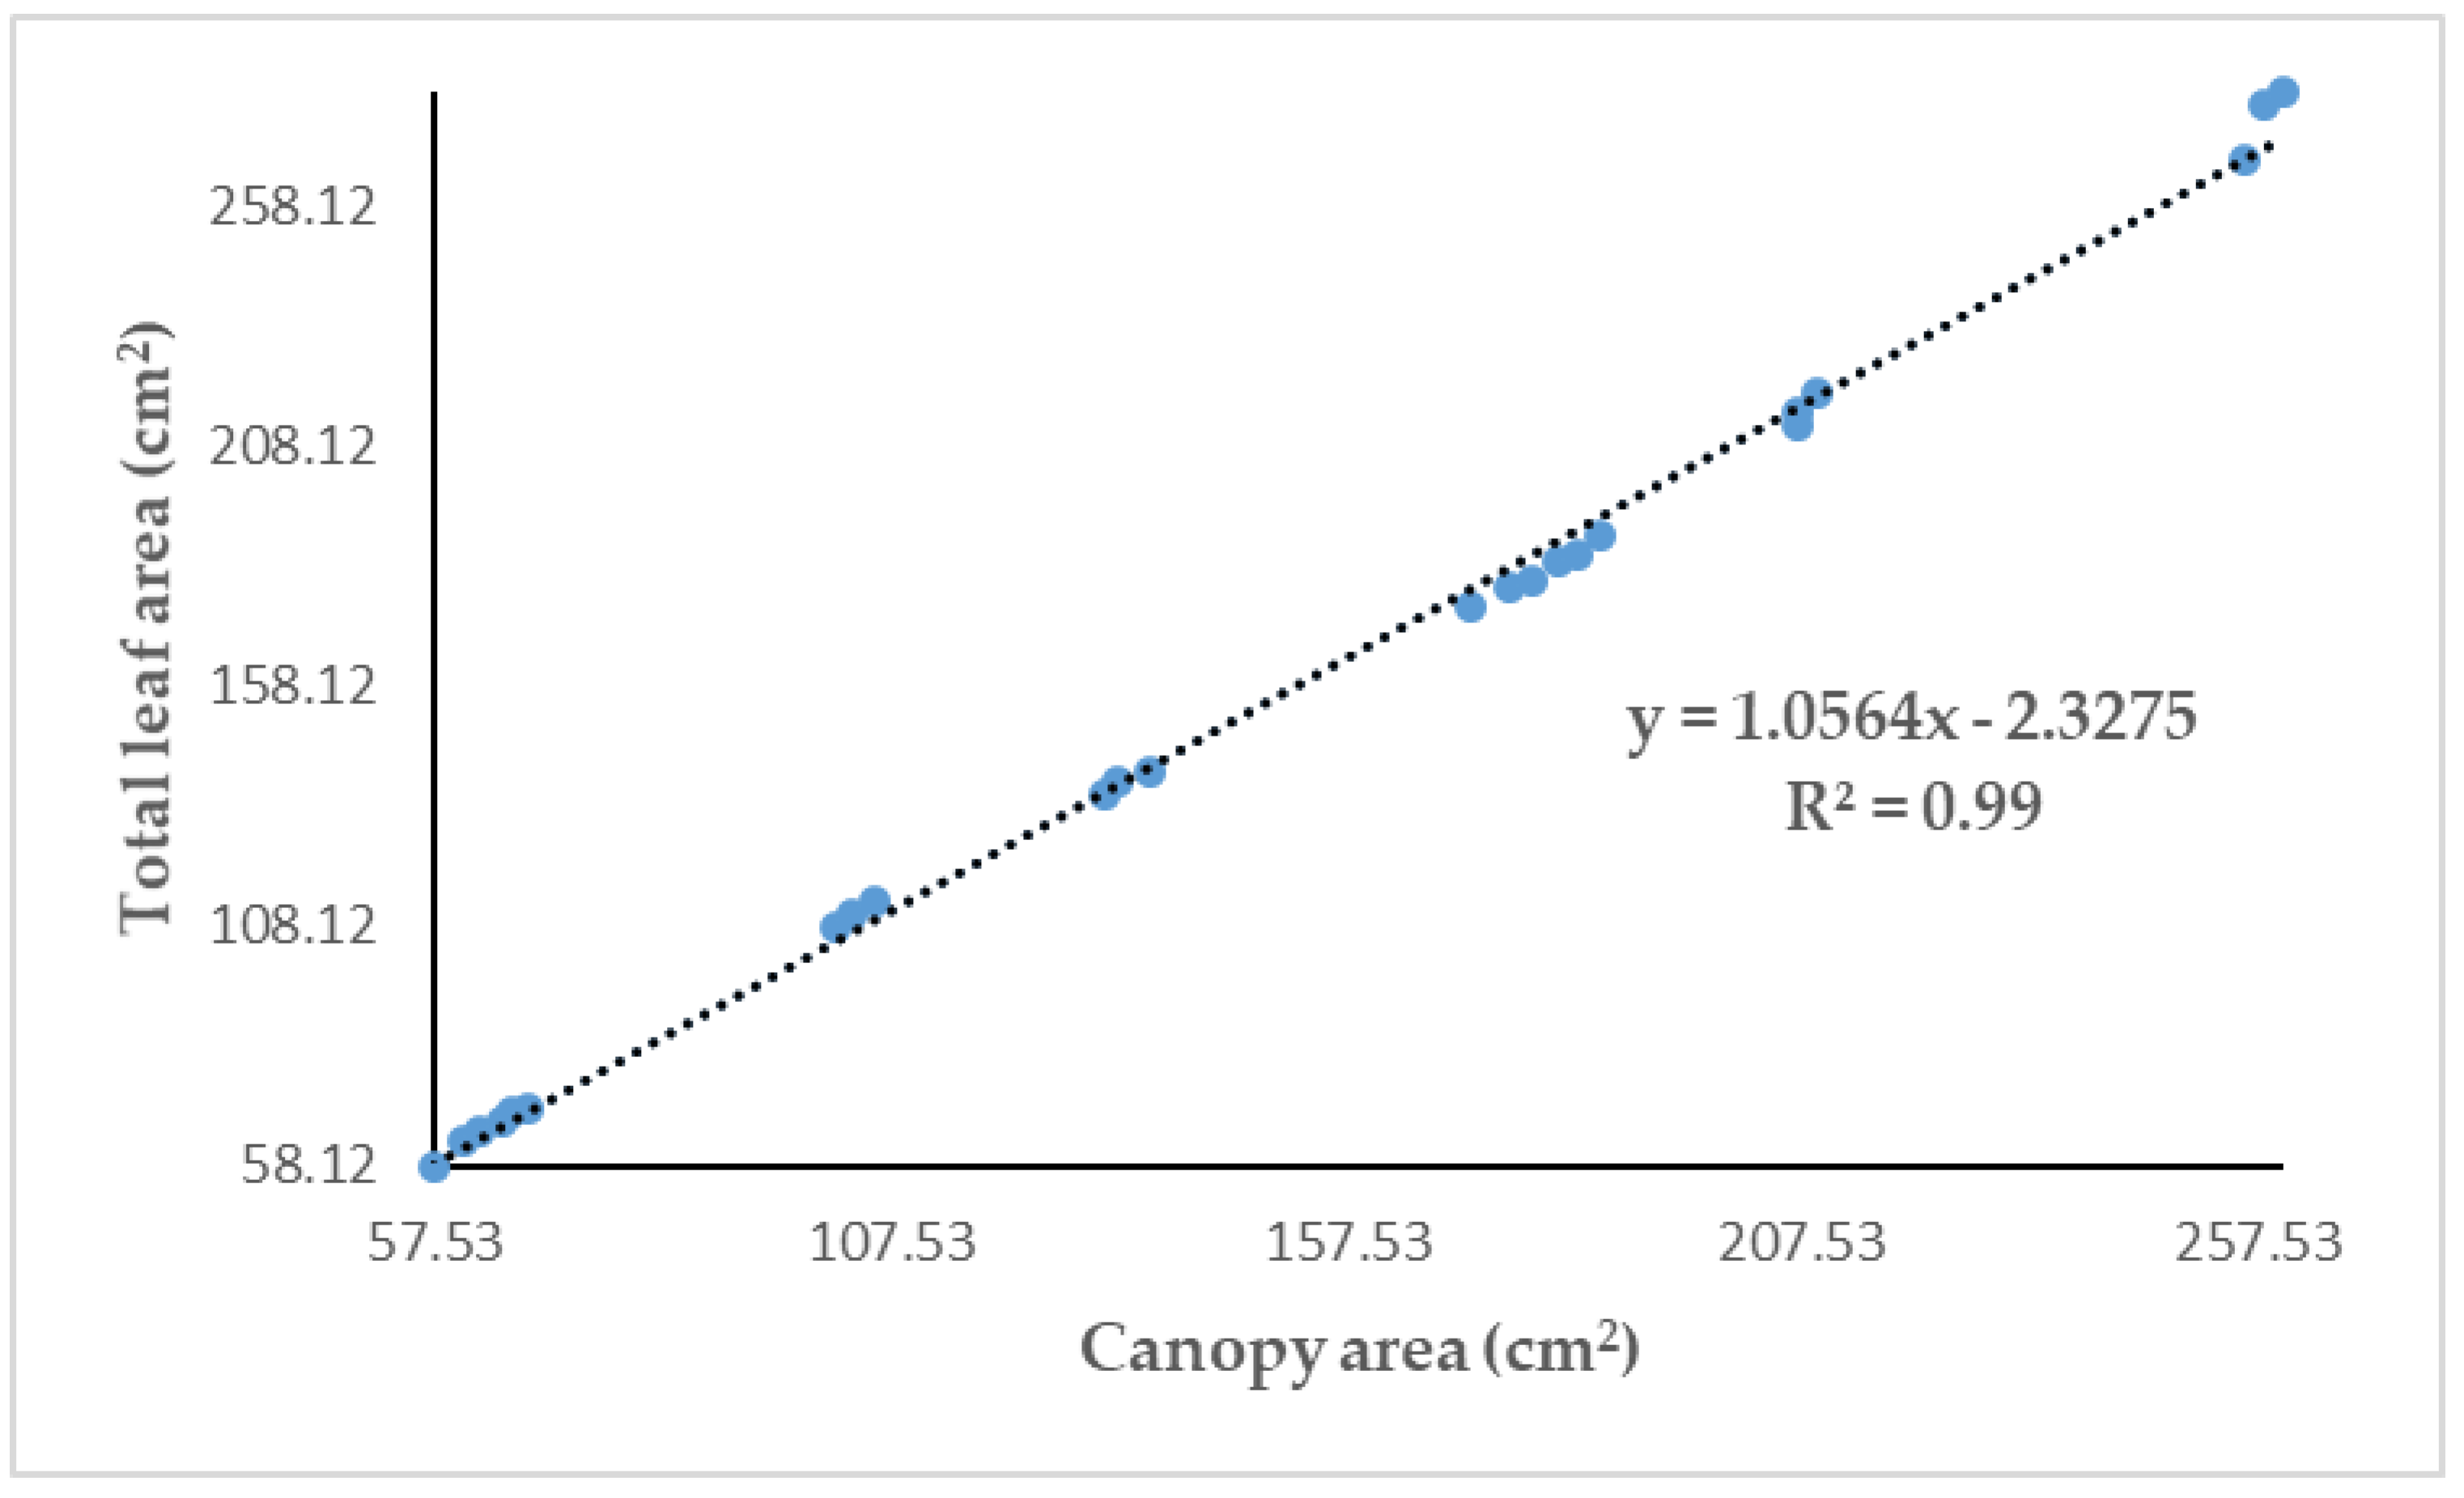
To determine whether there are inconsistencies between the calculated total leaf area and canopy area values, a scatter plot of the total leaf area versus canopy values was produced with a reference line at y = x. To quantify the validity of total leaf area and canopy area by our proposed algorithm, the coefficient of determination (R2) was calculated using Equation (4):
R 2 = 1 Σ t = 1 n ( x i   y i   ) 2 Σ t = 1 n ( x i   y i   ) 2
where x i and y i are the canopy area and the calculated total leaf area, respectively, and n is the number of samples.

3. Results and Discussion

It is crucial to choose a suitable threshold for separating one object from another in an RGB image. In previous studies, the threshold value was frequently determined directly based on the colour features of the foreground and background; alternatively, a suitable threshold may be obtained after converting RGB colour space into HSV colour coordinates [22]. In this study, it was determined that the surface colour of the leaf was uniform, as shown in Figure 3. This may facilitate the determination of an appropriate threshold value based on an HSV image of the ice plant leaf. It was found that there was little colour variation with the reference. In this context, thresholding in the HSV image successfully separated the plants from the background. In addition, the segmentation method used by the proposed method produces suitable results, which means that the loss of the leaf edge pixels, which often results from poor segmentation, may be minimised when extracting the leaf edge from the images. Thus, the structure of the leaf edge is well preserved by the proposed method. As a result, the positions of the ice plant leaf tip and petiole insertion could be accurately located. The sum of the number of pixels belonging to the longest row in the binary image was extremely close to the corresponding canopy area value. The proposed method is also feasible for calculating the canopy area of the ice plants.

3.1. Calculation of Canopy Area and Total Leaf Area

The experiment area of ice plant samples was determined by a manual approach using the curvimeter method and the indirect method of the image processing algorithm. The results are given in Table 1.
In the developed algorithm for calculating the overlapping leaves percentage (%), the overlapping percentage is less than 10%, as evidenced by the preceding experiment. The overlapping leaves are minimal based on the analysis results utilising the datasets, and the viability of the proposed method appears promising. There are two types of leaf overlapping that can be found in plant species, namely, cross overlapping and coplanar overlapping. The interaction of many curved blades from different layers in the canopy or a non-parallel connection among neighbouring edges on the same layer causes the cross overlapping. As indicated by Li et al., 2019 [23], coplanar overlapping occurs when two flat and coplanar leaves link or one leaf covers the others on a plane. The ice plant is an ideal example of coplanar overlapping, as shown in Figure 3. The measurements with the lowest overlapping percentages correspond to plants whose leaflets are positioned at different heights between them, such as plants 1 and 17, unlike plants 23 and 24, whose leaflets are of similar average height [16]. As a result, leaflets being the same height causes high overlapping, and long distances between leaflets results in less overlapping. Accordingly, leaf positions are directly correlated with the overlapping percentage of plants.

3.2. Measurement of the Canopy Area

Sandino et al., 2016 [16], proposed the HSV colour space algorithm to determine the leaf coverage of strawberry plants. This finding resulted in the average accuracy of leaf coverage in cm2, with up to 90% accuracy. Chaudhary et al., 2012 [4], compared the leaf area of 70 leaf samples using the algorithm including CIELAB colour space and the Otsu method. This finding resulted in 99% average accuracy, which was confirmed by comparing the results with the measurement of the grid count method. Lu et al., 2010 [11], suggested a method for calculating the leaf area based on the contour extraction algorithm and ground truth method. This experimental result also showed a low absolute error for leaf area calculation using the image processing technique.
The precise segmentation of leaves is a major challenge in precision agricultural operations, such as identifying weeds in crop fields. Globally, the HSV colour space model with the thresholding technique detects the approximate region of the target plant. The implemented method allows obtaining the overlapping percentage of ice plants and other horticultural crops efficiently and effectively, without relying on the mathematical model variables [24]. This finding could be implemented with other works, and combining the method with other image acquisition systems would be feasible. Estimation of overlapping percentages is vital for identifying the abnormalities present in plants through their leaflets [25].

3.3. Total Leaf Area Calculation

Total leaf area calculated by the curvimeter method gave the nearest values to the canopy area. Therefore, the ice plants overlapped in the lowest percentage compared to other leafy vegetables. However, the planimeter method is fast and efficient compared to cumbersome leaf area meters [4]. Singh et al., 2018 [26], reported the measurement of cucumber leaf area using the grid paper technique and the development of a linear regression model for validating leaf area and leaf area index accuracy. In comparison, the measured and predicted leaf area data showed good agreement with the percent error in the range of 0.8–8.2. Posse et al., 2009 [27], estimated the total leaf area of papaya trees by a non-destructive method. The leaf area of each of papaya leaf was obtained with a leaf area meter, and the authors developed a linear regression model for the determination of the total leaf area. The model looked promising and the coefficient of determination was close to 0.99. Therefore, total leaf area and canopy area are intriguing parameters in understanding the relationship between crop development and the environment [27].
Some improvements can be proposed for future work on predicting overlapping leaves. First, numerous environmental factors such as illumination may alter image features in the field, making correct segmentation more challenging for an autonomous algorithm [28]. Hence, a more practical strategy would be to investigate the major factors influencing segmentation and then devise solutions to address them.

3.4. Validation Results

Figure 6 illustrates the validation results for all the plants using R2 for the canopy area and the total leaf area.
The value R2 for the ice plant leaves has a higher coefficient of determination (R2: 0.99), which means that the calculation could reflect a strong relationship. However, the plant factory light conditions are diverse, and the performance of our method was quite impressive. This method can be implemented to determine the overlapping leaf area and canopy area of different leafy vegetables.

4. Conclusions

The present study concluded that the HSV colour space and threshold method is highly feasible for determining the canopy area and overlapping percentage of ice plants (Mesembryanthemum crystallinum L.). Furthermore, this investigation proposed an image segmentation algorithm to classify the ice plant canopy image with a threshold segmentation technique by grey colour model and calculating the degree of green colour in the HSV model. The novelty of the method is that all images were transformed from RGB to HSV colour space to wipe out the noise introduced from the background. This study sheds light on both destructive and non-destructive approaches for measuring overlapping areas without using the complex method as point clouds. The experiment was carried out on 24 plants of different sizes. The investigation showed less than 10% overlapping percentage with the differences in canopy area measurement with the image processing algorithm and computer coordinating area curvimeter method. The results also showed a strong correlation between the canopy area and total leaf area (R2: 0.99). Overall, the proposed method for estimating the overlapping leaf area of ice plants is effective. The development results can improve the efficiency and accuracy of individual plants’ leaf surface estimation tests. Currently, the proposed method still has some restrictions. Therefore, several parameters need to be tuned for an optimal segmentation result. This study can be extended to add an adaptive mechanism for parameter tuning in the future. In addition, it is suggested that future studies also consider the prediction of overlapped leaf areas of different leafy vegetables using deep learning algorithms. However, it is integral to implement an algorithm to improve its discriminant ability to consider various environmental changes in the future.

Supplementary Materials

The following supporting information can be downloaded at: https://www.mdpi.com/article/10.3390/agriculture12091321/s1 Supplementary File S1. Developed code for the canopy area calculation.

Author Contributions

Conceived and designed the experiment, performed the experiment, analyzed and interpreted the data, wrote the paper, B.G.K.M.; project administration, H.T.K., A.B. and N.E.K. contributed materials and reagents. All authors have read and agreed to the published version of the manuscript.

Funding

This work was supported by the Korea Institute of Planning and Evaluation for Technology in Food, Agriculture, Forestry and Fisheries (IPET) through the Agriculture, Food and Rural Affairs Convergence Technologies Program for Educating Creative Global Leader, funded by the Ministry of Agriculture, Food and Rural Affairs (MAFRA) (717001-7).

Data Availability Statement

The datasets generated during and/or analyzed in the current study are available from the corresponding author on reasonable request.

Conflicts of Interest

The authors declare no conflict of interest.

References

  1. Carvalho, J.O.; Toebe, M.; Tartaglia, F.L.; Bandeira, C.T.; Tambara, A.L. Leaf area estimation from linear measurements in different ages of Crotalaria juncea plants. An. Acad. Bras. Ciências 2017, 89, 1851–1868. [Google Scholar] [CrossRef] [PubMed]
  2. Godoy, L.J.; Yanagiwara, R.S.; Villas Bôas, R.L.; Backes, C.; Lima, C.P. Análise da imagem digital para estimativa da área foliar em plantas de laranja "Pêra". Rev. Bras. Frutic. 2007, 29, 420–424. [Google Scholar] [CrossRef]
  3. Madhavi, B.G.K.; Khan, F.; Bhujel, A.; Jaihuni, M.; Kim, N.E.; Moon, B.E.; Kim, H.T. Influence of different growing media on the growth and development of strawberry plants. Heliyon 2021, 7, e07170. [Google Scholar] [CrossRef] [PubMed]
  4. Chaudhary, P.; Godara, S.; Cheeran, A.N.; Chaudhari, A.K. Fast and accurate method for leaf area measurement. Int. J. Comput. Appl. 2012, 49, 22–25. [Google Scholar] [CrossRef]
  5. Li, Z.; Ji, C.; Liu, J. Leaf Area Calculating Based on Digital Image. In International Conference on Computer and Computing Technologies in Agriculture; Springer: Boston, MA, USA, 2007; pp. 1427–1433. [Google Scholar]
  6. Dey, A.K.; Guha, P.; Sharma, M.; Meshram, M.R. Comparison of different methods of in-situ leaf area measurement of betel leaf (Piper betle L.). Int. J. Recent Technol. Eng. 2019, 7, 1512–1516. [Google Scholar]
  7. Montgomery, E.G. Correlation studies in corn. Neb. Agric. Exp. Stn. Annu. Rep. 1911, 24, 108–159. [Google Scholar]
  8. Yan, G.; Hu, R.; Luo, J.; Weiss, M.; Jiang, H.; Mu, X.; Xie, D.; Zhang, W. Review of indirect optical measurements of leaf area index: Recent advances, challenges, and perspectives. Agric. Meteorol. 2019, 265, 390–411. [Google Scholar] [CrossRef]
  9. Ryu, Y.; Sonnentag, O.; Nilson, T.; Vargas, R.; Kobayashi, H.; Wenk, R.; Baldocchi, D.D. How to quantify tree leaf area index in an open savanna ecosystem: A multi-instrument and multi-model approach. Agric. Meteorol. 2010, 150, 63–76. [Google Scholar] [CrossRef]
  10. Yamaguchi, T.; Tanaka, Y.; Imachi, Y.; Yamashita, M.; Katsura, K. Feasibility of combining deep learning and rgb images obtained by unmanned aerial vehicle for leaf area index estimation in rice. Remote Sens. 2020, 13, 84. [Google Scholar] [CrossRef]
  11. Lu, C.; Ren, H.; Zhang, Y.; Shen, Y. Leaf area measurement based on image processing. In Proceedings of the 2010 International Conference on Measuring Technology and Mechatronics Automation, Changsha, China, 13–14 March 2010; Volume 2, pp. 580–582. [Google Scholar]
  12. Wang, Z.; Wang, K.; Yang, F.; Pan, S.; Han, Y. Image segmentation of overlapping leaves based on Chan–Vese model and Sobel operator. Inf. Processing Agric. 2018, 5, 1–10. [Google Scholar] [CrossRef]
  13. Wang, J.; He, J.; Han, Y.; Ouyang, C.; Li, D. An adaptive thresholding algorithm of field leaf image. Comput. Electron. Agric. 2013, 96, 23–39. [Google Scholar] [CrossRef]
  14. Cerutti, G.; Tougne, L.; Mille, J.; Vacavant, A.; Coquin, D. Understanding leaves in natural images—A model-based approach for tree species identification. Comput. Vis. Image Underst. 2013, 117, 1482–1501. [Google Scholar] [CrossRef] [Green Version]
  15. Grand-Brochier, M.; Vacavant, A.; Cerutti, G.; Kurtz, C.; Weber, J.; Tougne, L. Tree leaves extraction in natural images: Comparative study of preprocessing tools and segmentation methods. IEEE Trans. Image Processing 2015, 24, 1549–1560. [Google Scholar] [CrossRef] [PubMed]
  16. Sandino, J.D.; Ramos-Sandoval, O.L.; Amaya-Hurtado, D. Method for estimating leaf coverage in strawberry plants using digital image processing. Rev. Bras. Eng. Agrícola Ambient. 2016, 20, 716–721. [Google Scholar] [CrossRef]
  17. Apolo-Apolo, O.E.; Pérez-Ruiz, M.; Martínez-Guanter, J.; Egea, G. A mixed data-based deep neural network to estimate leaf area index in wheat breeding trials. Agronomy 2020, 10, 175. [Google Scholar] [CrossRef]
  18. Islam, S.; Reza, M.N.; Chowdhury, M.; Islam, M.N.; Ali, M.; Kiraga, S.; Chung, S.O. Image Processing Algorithm to Estimate Ice-Plant Leaf Area from RGB Images under Different Light Conditions. In IOP Conference Series: Earth and Environmental Science; IOP Publishing: Bristol, UK, 2021; p. 12013. [Google Scholar]
  19. Basak, J.K.; Qasim, W.; Okyere, F.G.; Khan, F.; Lee, Y.J.; Park, J.; Kim, H.T. Mitigating chilling stress of pepper plant (Capsicum annuum L.) using Dimethyl Ether combustion gas in controlled greenhouse. Aust. J. Crop Sci. 2019, 13, 1992–2002. [Google Scholar] [CrossRef]
  20. Madhavi, B.G.; Basak, J.K.; Paudel, B.; Kim, N.E.; Choi, G.M.; Kim, H.T. Prediction of Strawberry Leaf Color Using RGB Mean Values Based on Soil Physicochemical Parameters Using Machine Learning Models. Agronomy 2022, 12, 981. [Google Scholar] [CrossRef]
  21. Primer, S.; Molano-Flores, B.; Zaya, D.N.; Helm, C.; Coons, J. Effect of habitat structure on reproduction and prey capture of a rare carnivorous plant, Pinguicula lutea. Arthropod. Plant Interact. 2018, 12, 671–683. [Google Scholar] [CrossRef]
  22. Wu, X.; Xu, W.; Song, Y.; Cai, M. A detection method of weed in wheat field on machine vision. Procedia Eng. 2011, 15, 1998–2003. [Google Scholar] [CrossRef]
  23. Li, D.; Cao, Y.; Shi, G.; Cai, X.; Chen, Y.; Wang, S.; Yan, S. An overlapping-free leaf segmentation method for plant point clouds. IEEE Access 2019, 7, 129054–129070. [Google Scholar] [CrossRef]
  24. Damgaard, C. Hierarchical and spatially aggregated plant cover data. Ecol. Inform. 2013, 18, 35–39. [Google Scholar] [CrossRef]
  25. Demirsoy, H. Leaf area estimation in some species of fruit tree by using models as a non-destructive method. Fruits 2009, 64, 45–51. [Google Scholar] [CrossRef] [Green Version]
  26. Singh, M.C.; Singh, K.G.; Singh, J.P. Indirect method for measurement of leaf area and leaf area index of soilless cucumber crop. Adv. Plants Agric. Res. 2018, 8, 188–191. [Google Scholar] [CrossRef]
  27. Posse, R.P.; Sousa, E.F.; Bernardo, S.; Pereira, M.G.; Gottardo, R.D. Total leaf area of papaya trees estimated by a nondestructive method. Sci. Agric. 2009, 66, 462–466. [Google Scholar] [CrossRef]
  28. Raj, R.; Walker, J.P.; Pingale, R.; Nandan, R.; Naik, B.; Jagarlapudi, A. Leaf area index estimation using top-of-canopy airborne RGB images. Int. J. Appl. Earth Obs. Geoinf. 2021, 96, 102282. [Google Scholar] [CrossRef]
Figure 1. The ice plants (M. crystallinum) in the plant factory system under controlled environmental conditions.
Agriculture 12 01321 g001
Figure 2. The flowchart of the measurement of overlapping percentage (%) of ice plant leaves.
Agriculture 12 01321 g002
Figure 3. Image acquisition system of ice plant canopy.
Agriculture 12 01321 g003
Figure 4. Segmented image of the ice plant canopy (a), inverted binary ice plant canopy image (b), segmented reference image (c), inverted binary reference image (d).
Agriculture 12 01321 g004
Figure 5. Calculation of the total leaf area of ice plants (M. crystallinum) using the curvimeter method.
Agriculture 12 01321 g005
Figure 6. Correlation between canopy area and total leaf area.
Agriculture 12 01321 g006
Table 1. Comparison of results, measured by the proposed algorithm and curvimeter method.
ImageCA (cm2)TA (cm2)Overlapping Leaves Percentage (%)
157.5358.121.02
260.6263.154.01
362.6365.173.90
46567.583.82
566.2569.174.22
667.8470.153.41
7101.75107.735.55
8103.45110.606.46
9105.85112.906.24
10130.91135.153.13
11132.56137.973.92
12135.86139.982.94
13171.07174.562.00
14175.52178.871.87
15177.76180.321.42
16180.56184.111.93
17182.97185.111.16
18185.50189.702.21
19206.95212.152.45
20207.15215.123.70
21209.13219.174.58
22255.96267.954.47
23258.16279.177.53
24260.13282.187.81
Publisher’s Note: MDPI stays neutral with regard to jurisdictional claims in published maps and institutional affiliations.