Abstract
In a survey of root-knot nematodes in Iran, twenty-nine populations were collected from eleven provinces. All populations were identified as Meloidogyne javanica based on morphological and morphometric characteristics of females, males, J2s, and perineal patterns. Sequence Characterized Amplified Region (SCAR) primers confirmed the morphological studies, and all these populations produced a specific band in 670 bp using Fjav and Rjav primers. Genetic structure analyses using the combination of RAPD and ISSR markers revealed four different groups, which was in agreement with UPGMA cluster analyses. These four groups were related to four different geographic regions with a high geographic distance. The total estimated genetic diversity was 8%, which was a low value. Values of FST and Nm were 0.628 and 0.148, indicating that populations of these four regions were separated from each other; however, some gene flow between them could be attributed to human activities. Mantel test also revealed a negative correlation between genetic diversity and geographic distance.
1. Introduction
One of the most important groups of phyto-parasite nematodes which cause economic damages to different host plants is root-knot nematodes (RKNs). They have a worldwide distribution, obligate parasites with more than 3000 host plant species from monocotyledons, dicotyledons, herbs as well as woody plants; the high level of damage can lead to total crop loss [1,2,3,4]. The traditional and time-consuming diagnosis of the species of root-knot nematodes by morphological and morphometric methods has led to the development of species-specific primers for this nematode [5]. Reliability of these primers, which was developed [6,7], especially for four main pathogenic and widespread species including M. incognita, M. javanica 1949, M. arenaria and M. hapla, was confirmed in Iran [8,9,10] and other countries [11,12,13].
This has now propelled Meloidogyne spp. to the forefront as important pathogens of many crops and other plants [14]. In fact, based on a 2013 survey published in the journal of Molecular Plant Pathology, of the top ten plant parasitic nematodes, Meloidogyne spp. were collectively voted as being at the top of the list [15]. The estimated annual yield loss of plant-parasitic nematodes (PPNs) is over $100 billion worldwide; among PPNs, the most yield-limiting group is root-knot nematodes [16].
M. javanica is the most recovered RKN in Iran; more than 60 host plants have been reported for this species, most of which are vegetables. Although an accurate estimate of the economic damage caused by root-knot nematodes in Iran has not been provided, according to the numerous reports of these nematodes in different regions of Iran, on different hosts, it can be estimated that these nematodes are one of the most important and damaging nematodes in this country [17].
The degree of genetic differentiation among local populations of a species largely depends on the magnitude of gene flow and other processes such as mutation, genetic drift, and locally differing selection pressures occurring independently in each subpopulation [18]. The large genetic variation among populations of PPNs indicates that multiple sources of inoculum might have been introduced to the region or that the populations formerly existed in growing areas [19]. Thus, a thorough knowledge of the population structure of PPNs is essential to developing efficient control strategies [18,20]. Despite the importance of these pathogens in agriculture, the genetic structure of nematode populations is poorly understood [21,22]. The M. javanica genetic diversity has only been determined in two regions of Iran. The genetic study on 21 populations of M. javanica from Razavi Khorasan Province in the northeast of Iran, showed 7% diversity among the populations by using RAPD markers [9]. Recently, 9% (ISSR) and 11% (RAPD) diversity for populations of this species have been reported in the southern regions of Iran [10]. The study of the genetic diversity of these nematodes in other parts of the world also led to similar results and the calculated genetic diversity was almost the same; however, the study of the genetic structure of these nematodes has not yet been conducted anywhere in the world [23,24,25]. Studying genetic diversity on a large scale can provide more useful information for determining the patterns of the distribution of M. javanica in Iran and planning more effective management strategies.
In this study, the genetic structure and diversity on M. javanica populations collected from major vegetable growing regions in Iran were investigated using the RAPD and ISSR markers.
2. Materials and Methods
2.1. Nematode Populations and Light Microscopy
The M. javanica populations (29 populations) were collected from tomato, cucumber, and tobacco fields and greenhouses in different regions of Iran during the years 2018–2019 (Table 1). For morphometric analysis and preparation of perineal patterns, the mature females were extracted from the roots. Also, the males as well as second-stage juveniles (J2s) were killed, fixed on by hot FPG (4:1:1, formaldehyde: propionic acid: glycerol) followed by processing in anhydrous glycerol [26]. The permanent slides were prepared from J2s, perineal patterns, and males for morphological analysis by light microscope (Olympus BX41; Japan) equipped with an eye-piece camera (Dino-eye) and Dino Capture version 2.0 software.

Table 1.
Meloidogyne javanica populations collected from different regions of Iran.
2.2. DNA Extraction
The DNA was extracted from one full egg mass in a 0.2 mL tube containing 16 µL ddH2O with some modifications [27] as follows: the tubes were kept at –80 °C for 15 min and then were vortexed. A total of 20 µL of worm lysis buffer (100 mM Tris-HCl at pH 8, 15 mM MgCl2, 0.05% Mercaptoethanol, 500 mM KCl and 4.5% Tween 20) as well as proteinase K (4 µL, 600 µg/mL) were added. Then, tubes were incubated at 65 °C (1 h) and 95 °C (10 min) followed by centrifugation at 38,000× g for 2 min and kept at –20 °C for further analysis.
2.3. PCR Using Species-Specific Primers
The polymerase chain reaction (PCR) was carried out by using DNA template (1 µL), mastermix (Amplicon Red, 8 µL), primer (10 pmol, 1 µL each) and ddH2O (4 µL) in a 15 µL final volume. The species-specific primers (Table 2) were considered in this study [6,7]. The mixture without DNA template was also considered the negative control. The amplification program was set up as 5 min at 94 °C, followed by 35 cycles including 30 s at 94 °C, 30 s for annealing (64 °C for M. javanica, 54°C for M. incognita, 61 °C for M. arenaria, and 58 °C for M. hapla) and 45 s at 72 °C, and a final step of 5 min at 72 °C.
Table 2.
The species-specific and ISSR, RAPD primers used for Meloidogyne species.
2.4. ISSR and RAPD PCR
For ISSR-PCR, 20 μL reaction mixture was prepared including genomic DNA (2 µL), 2 µL of primer (Table 2) [10], master mix (Amplicon Red, 8 µL) and ddH2O (8 µL). The amplification reactions were programmed as the initial denaturation (94 °C for 3 min), followed by 35 cycles (30 s at 93 °C, 90 s at 48 °C, 1 min at 72 °C) and a final extension (10 min at 72 °C).
For RAPD-PCR, 20 µL reaction mixture was prepared including genomic DNA (2 µL), 2 µL of primer (Table 2) [9,10], master mix (Amplicon Red, 8 µL) and ddH2O (8 µL). The amplification reactions were programmed as the initial denaturation (94 °C for 5 min), followed by 35 cycles (1 min at 94 °C, 1 min at 35 °C, 2 min at 72 °C) and a final extension (5 min at 72 °C). Both ISSR and RAPD products were confirmed by loading (7 µL) on TBE agarose gel (1.7%) and electrophoresis at 75V for 120 min. Two previously identified populations of M. incognita [10] were also used as the out groups.
2.5. ISSR and RAPD Data Analysis
The ISSR and RAPD fragments were scored in all primers as “1” for the presence and “0” for the absence of bands. All steps were repeated twice and the weak or smeared bands were not considered. The distance matrixes were prepared using the Dice and Jaccard coefficients. The Cluster analysis was also carried out using the Numerical Taxonomy Multivariate Analysis System (NTSYSPC V-2.02) [28]. The genetic dissimilarity matrix as well as ultrametric distance matrix were prepared by UPGMA dendrogram with COPH module and compared using Mantel’s matrix correspondence test [29]. A Bootstrapping with 1000 replicates was used by Winboot [30] with the exclusion of the measurements below 60.
The genetic structure of 29 populations was analyzed by “Structure 2.3.4” software [31] by considering the Bayesian method and setting the number of groups (k) as the most liable adjustable parameter. The admixture model with independent allele frequencies was run with 10,000 steps burn-in period and 100,000 replicates chain length based on the Markov Chain Monte Carlo algorithm. For each k value ranging from 1–12, 20 simulations were performed.
Δk statistical test was performed using the “Structure Harvester” program [32] based on the suggestion made by Evanno et al. (2005) [33]. This criterion is based on the mean and standard deviation of the log probability of the data [lnP(D)] obtained for each value of k. Δk value was estimated for each k to obtain the greatest value. After the optimum Δk value was selected, the lower [lnP(D)] value was selected for each value of k. A graph for each replicate was generated, and each color represented a group of structured individuals.
The results of genetic structure and frequency analyses by using GenALEx, version 6.5 for analysis of components variance as well as their significance on genetic diversity within and among populations classified the populations into four distinctive groups [34]. We used P (percentage of polymorphic loci), H (the expected heterozygosity) and I (Shannon’s information index) to calculate the genetic diversity. Also, FST (Fixation index) and Nm (Number of migrants) were used to calculate the differences in populations and the amount of gene flow between populations. These two indices are inversely correlated; by increasing the fixation index, Nm is decreased [35].
3. Results
3.1. Characterization of the Recovered Populations
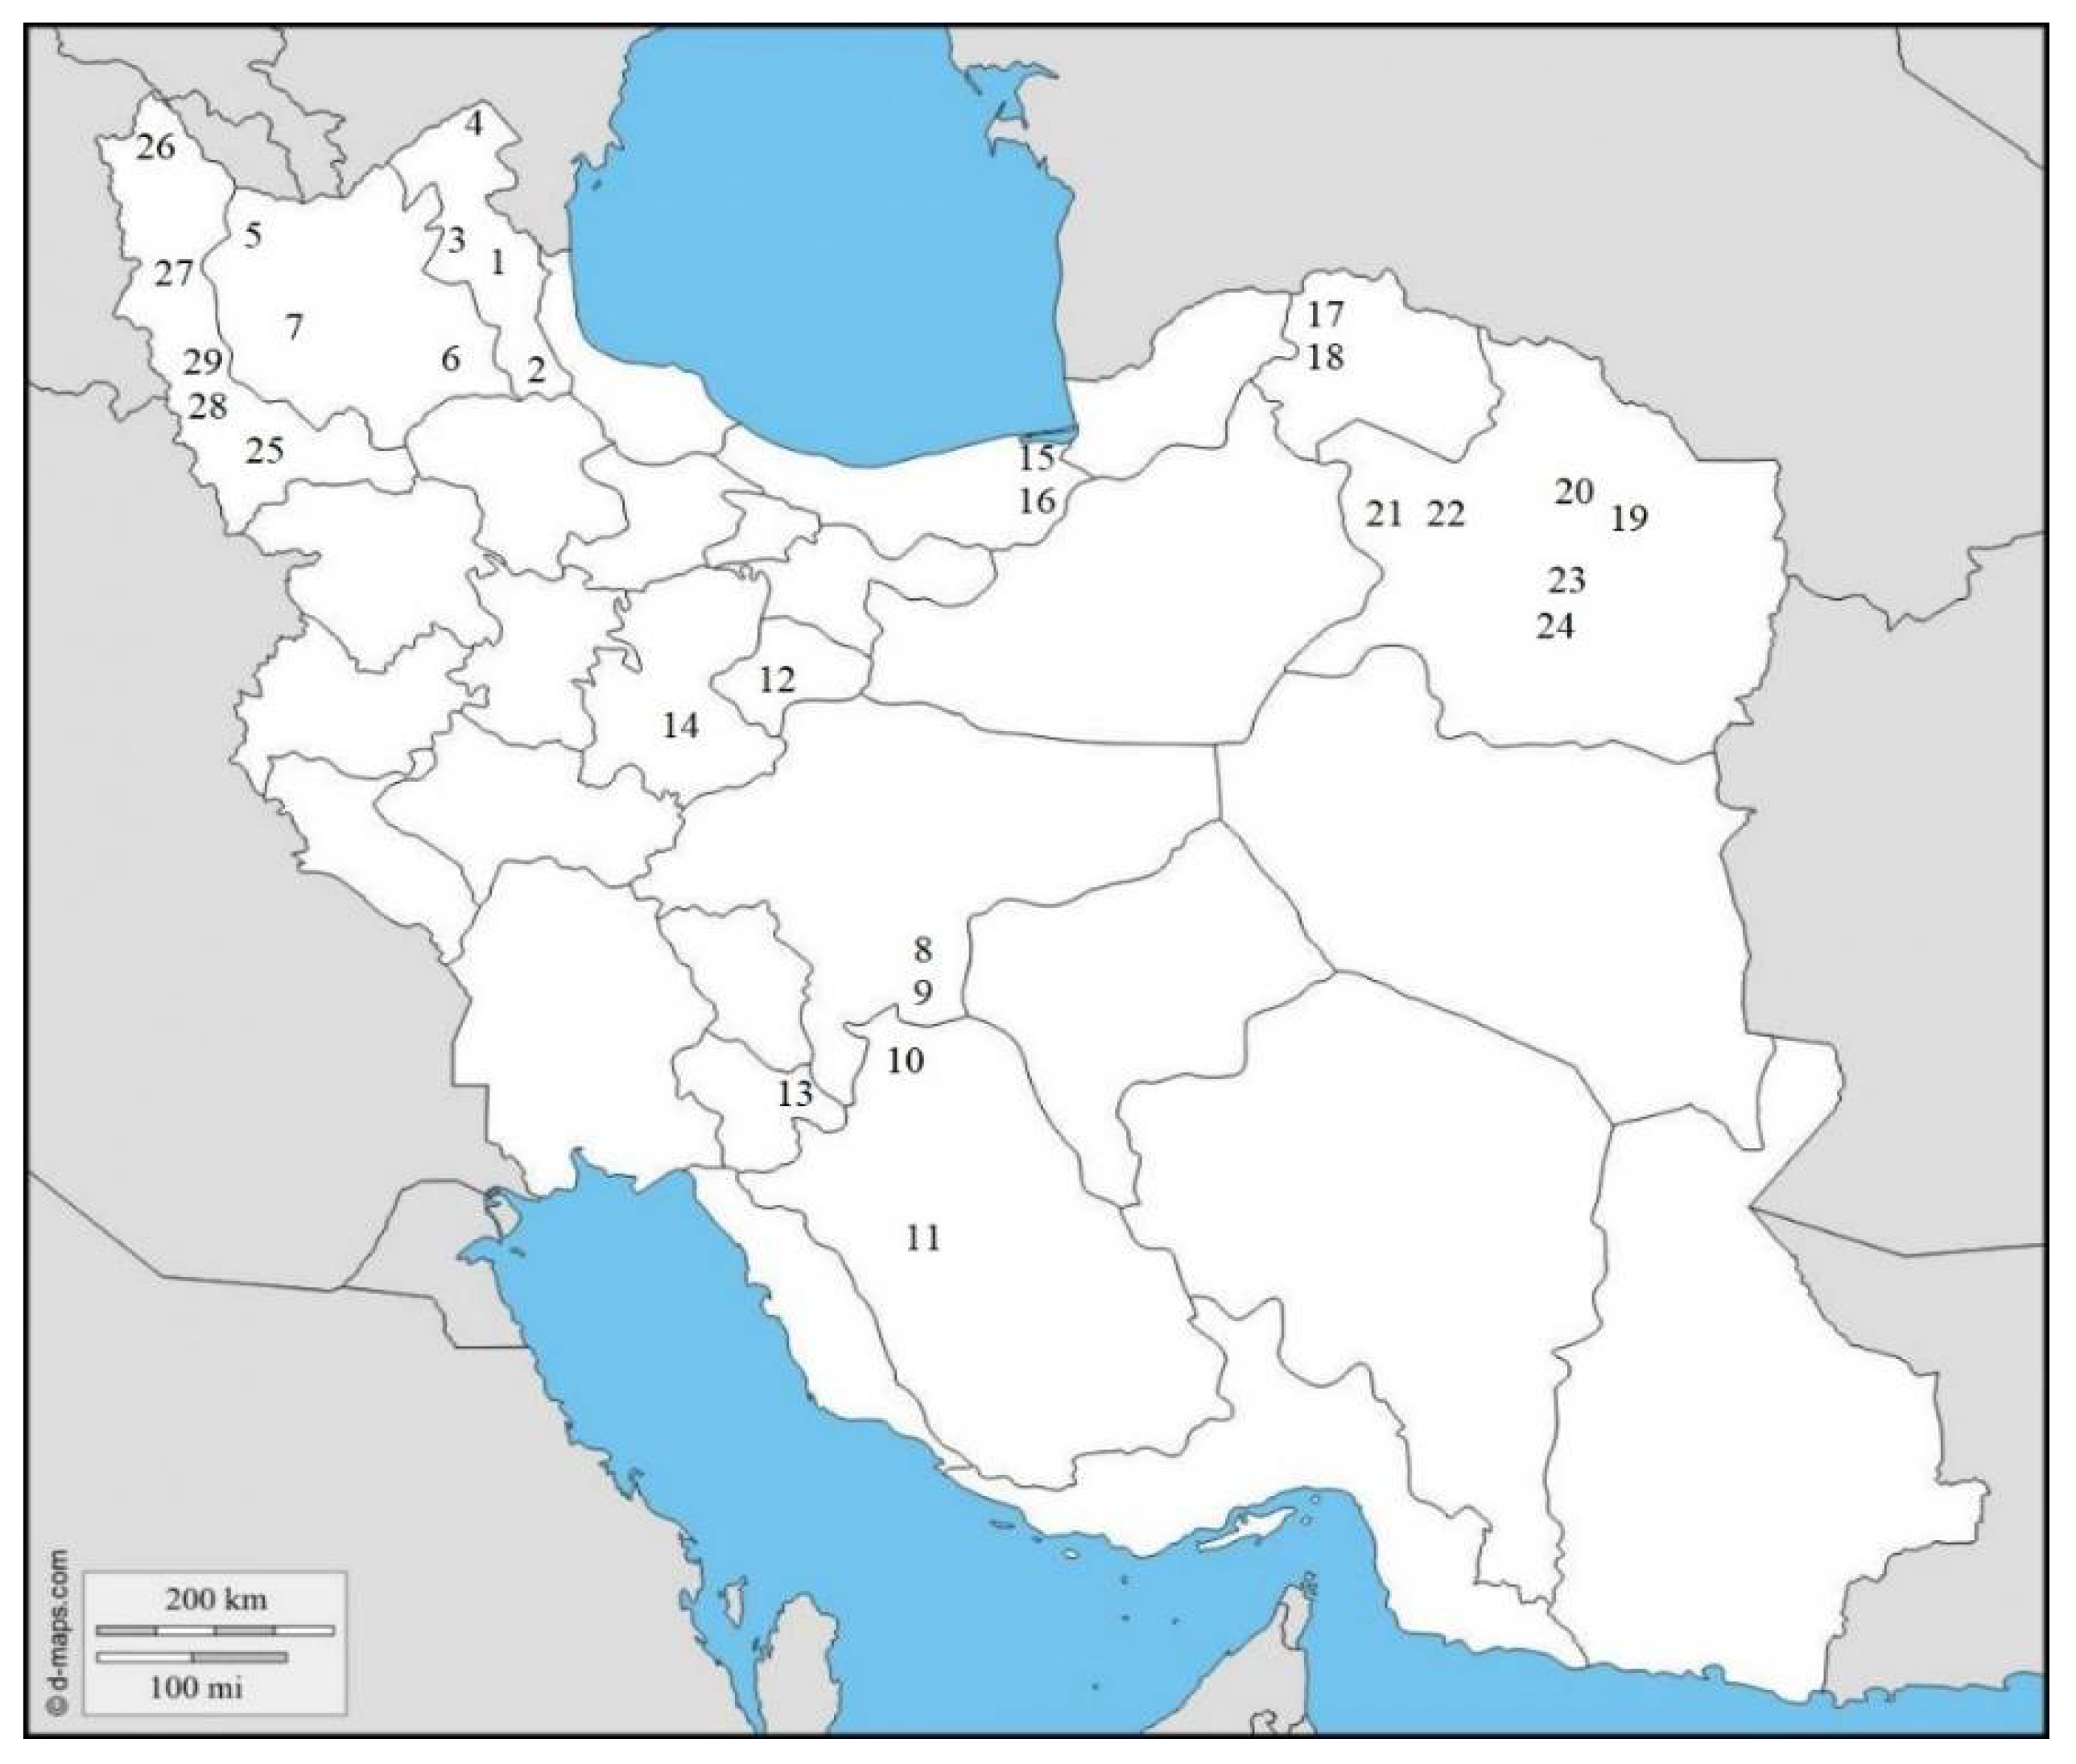
Totally, 29 populations (17 from fields and 12 from greenhouses) of root-knot nematodes were obtained in 11 different provinces of Iran (Table 1 and Figure 1). These populations were analyzed with SCAR species-specific molecular markers for the four major species [6,7]. A unique fragment (670 bp) was obtained in all 29 populations by using species-specific primers of M. javanica (Fjav and Rjav) without no product in the control template (Figure 2). The other three primer sets did not give any bands. The morphometric characters in the females, J2s, and males of all M. javanica populations are presented in Table 3.

Figure 1.
Geographic location of the recovered populations of Meloidogyne javanica in eleven provinces of Iran in this present study (for specifications of codes, see Table 1).
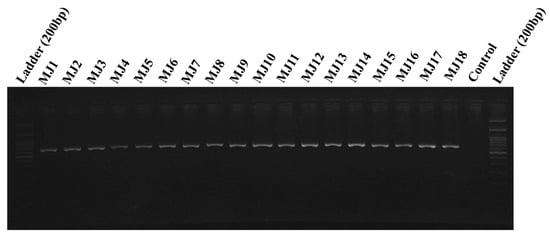
Figure 2.
A 670bp species-specific band obtained in Meloidogyne javanica populations from 11 different provinces of Iran (for specifications of codes, see Table 1).
Table 3.
Average of the morphometrics of females, second-stage juveniles (J2s) and males of the populations of Meloidogyne javanica studied in this research (Measurements are in µm).
3.2. Genetic Diversity and Structure
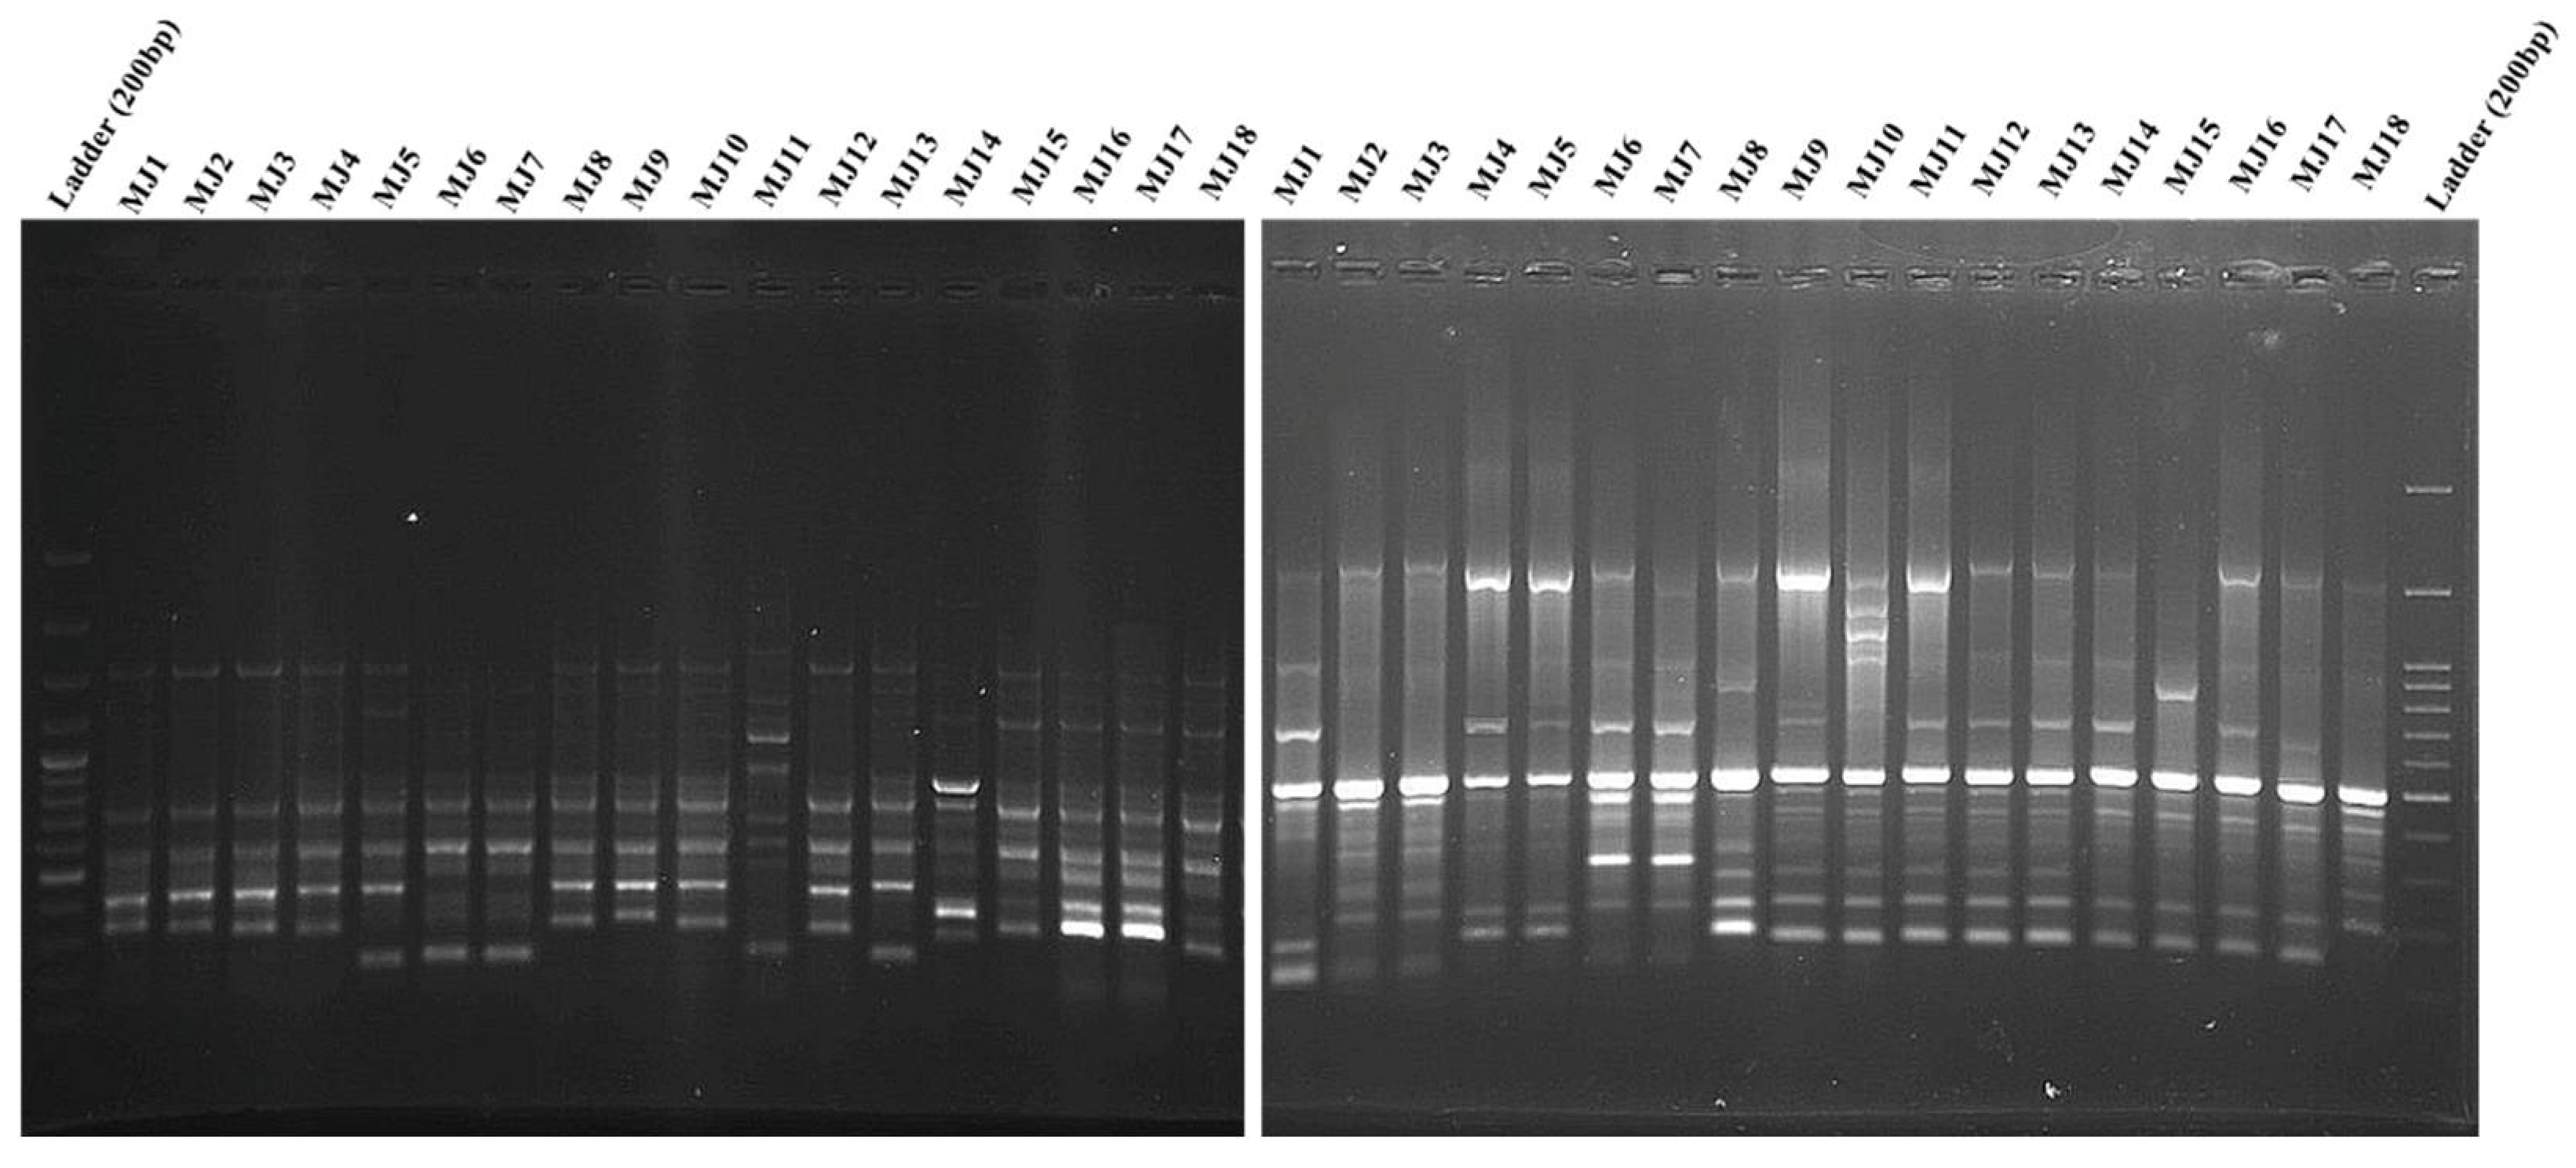
The random primers (10 primers) in RAPD analysis produced 175 bands, of which 142 (81.14%) and 33 (18.85%) bands were polymorphic and monomorphic, respectively. Each primer had a different number of reproducible amplified fragments ranging from 14 to 21 (average 17.5). The ranges of polymorphic and monomorphic bands between primers were 11–17 (average: 14.2) and 1–5 (average: 3.3), respectively (Table 4 and Figure 3 left).
Table 4.
Different bands produced by each primer of RAPD and ISSR for populations of Meloidogyne javanica.
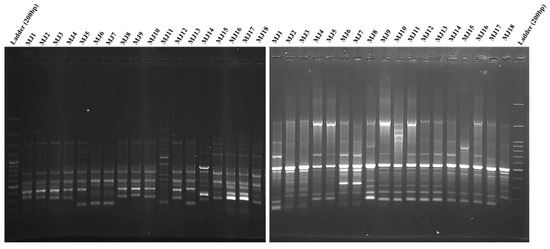
Figure 3.
The patterns of RAPD (left) and ISSR (right) for 18 Meloidogyne javanica populations by using CCA5 and OPA10 primers. DNA Ladder = 200 bp. (For population codes, see Table 1).
For each primer in ISSR, 168 loci, with an average of 16.8 loci were determined; polymorphic and monomorphic bands were 138 (82.14%) and 32 (19.04%), respectively. The bands were produced from 13–20 with an average of 16.8 per primer. The ranges of polymorphic and monomorphic bands between primers were 11–17 (average: 13.8) and 1–6 (average: 3.2), respectively (Table 4 and Figure 3 right).
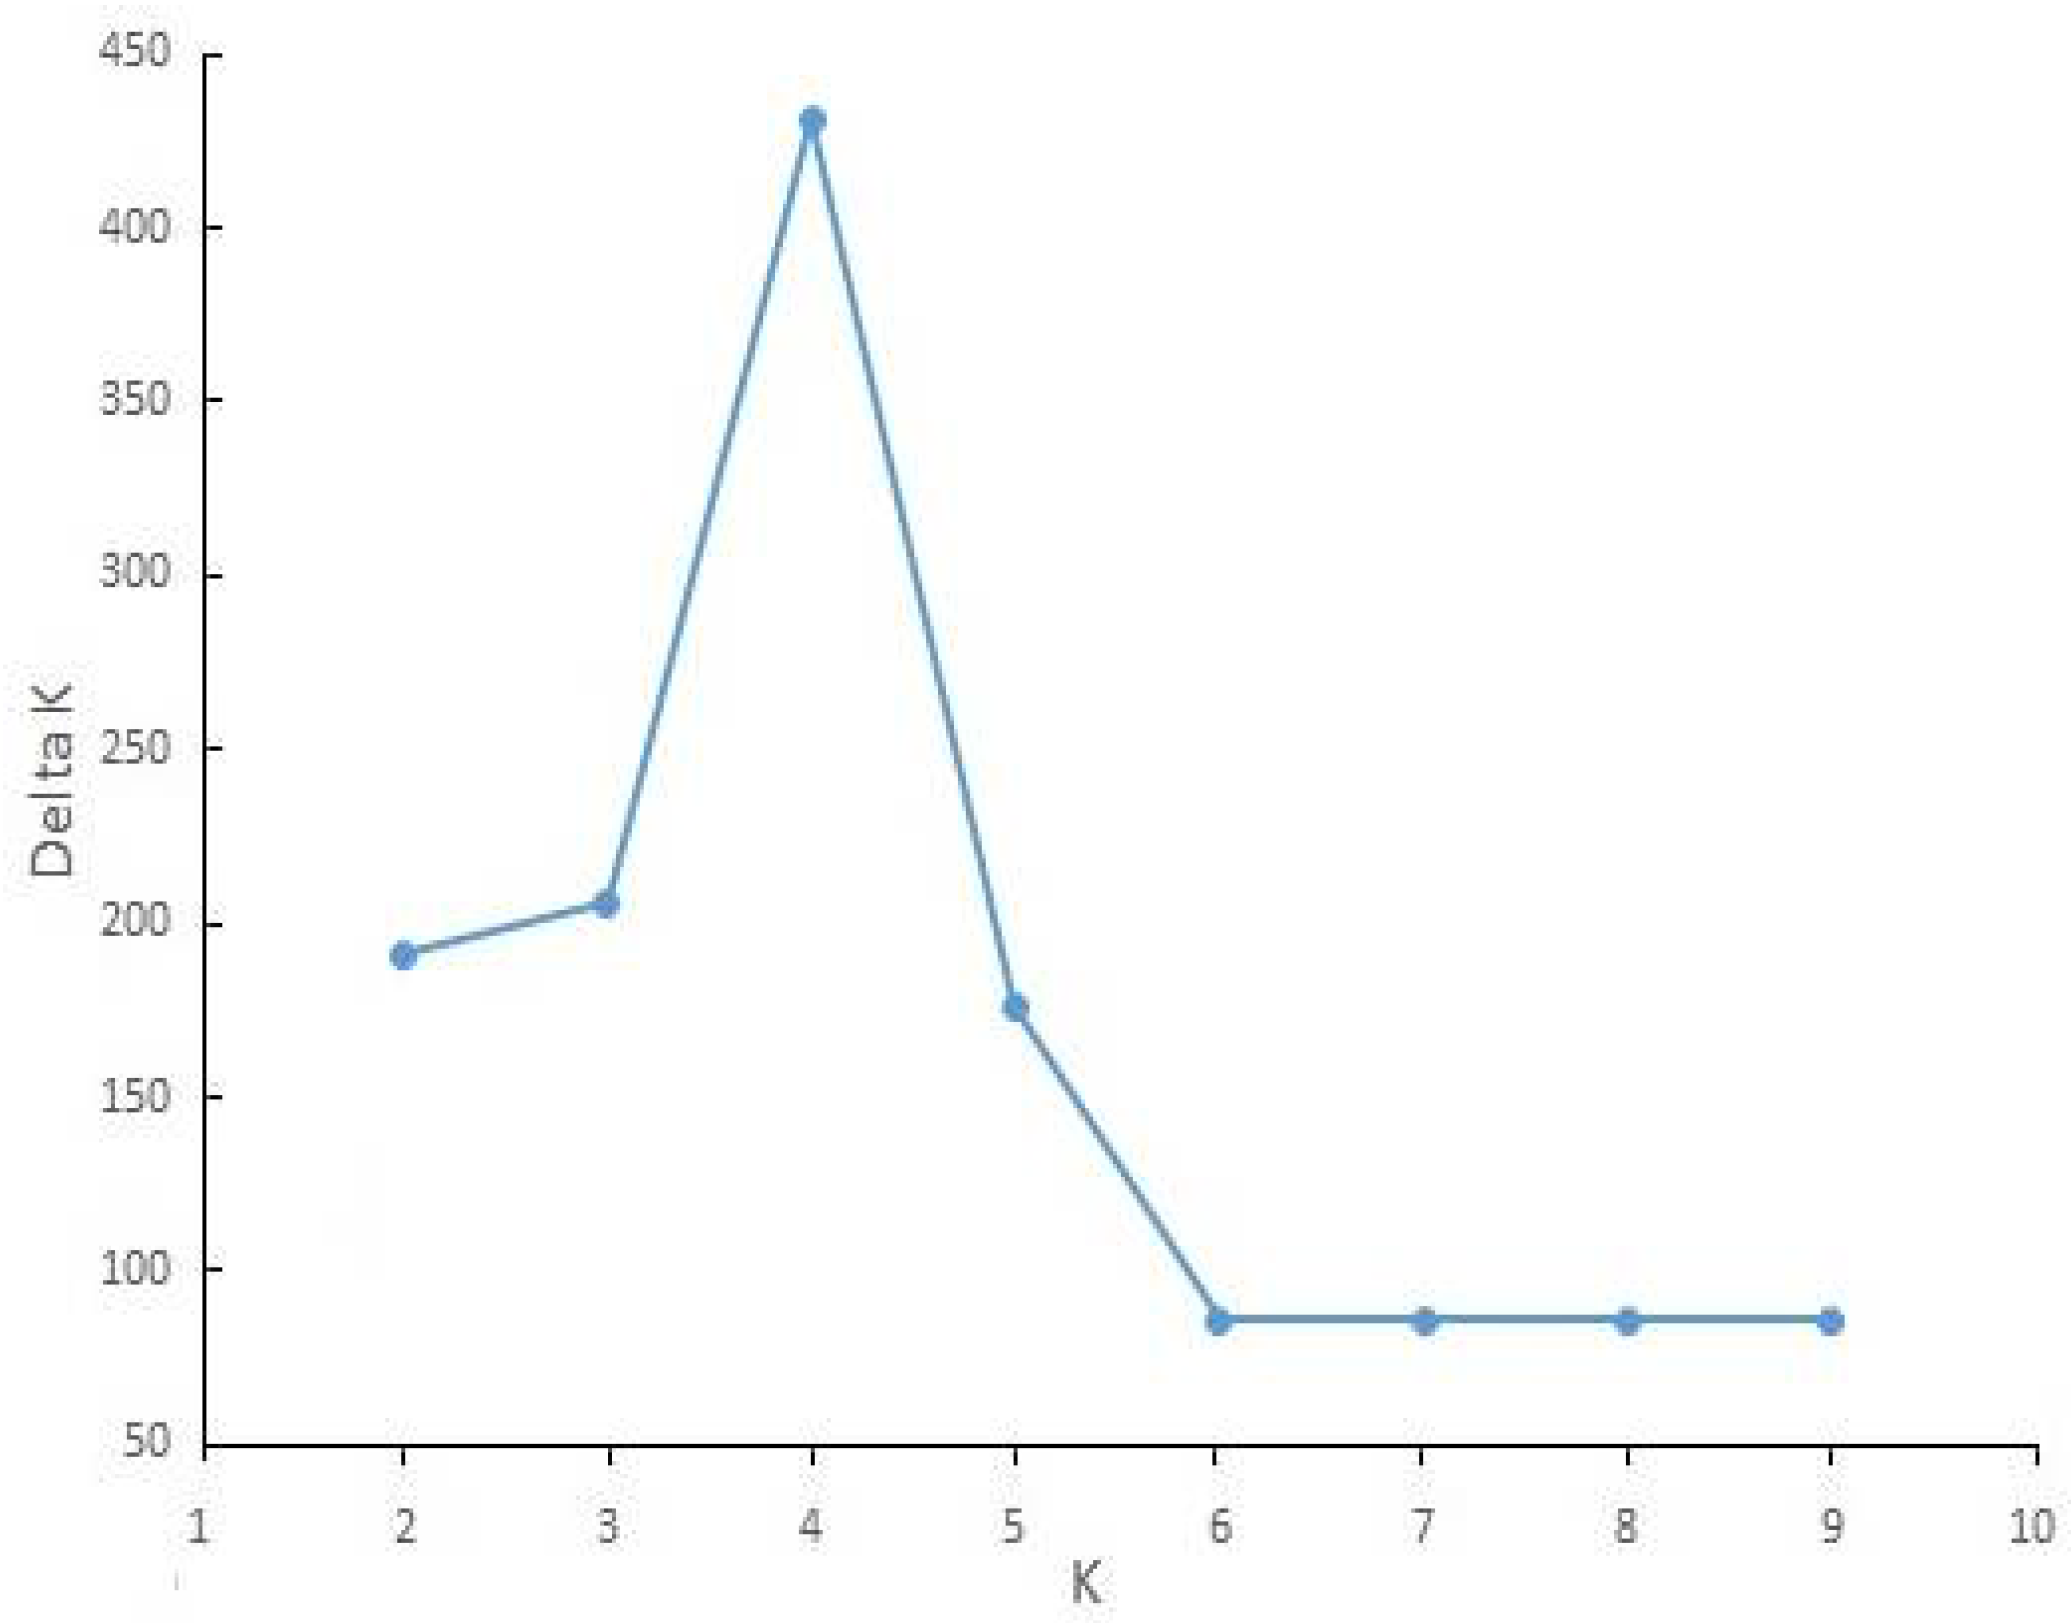
A high similarity in general topology was obtained in UPGMA trees with RAPD and ISSR data and in both of them, four main clades were created; however, the position of a few populations was different. Finally, a dendrogram was created by combining the data sets of RAPD and ISSR, as presented in Figure 4. Bootstrap values were written only for main clades. On the other hand, the ∆k statistic gave the highest value at k = 4 (∆k = 431), and all 29 populations belonged to four genetic clusters (Figure 5). Placement comparison of the populations in four main clades of UPGMA dendrogram and four clusters of structure analyses revealed that there was a high similarity between the two methods. Bar graphs showing genetic diversity structure are placed in front of the dendrogram. Each cluster and the related clades of them in the dendrogram are represented by a different color (blue, green yellow, and red) and labeled as groups 1–4. The average of the Q value was 0.86, 0.83, 0.71, and 0.80 for groups 1–4, respectively.
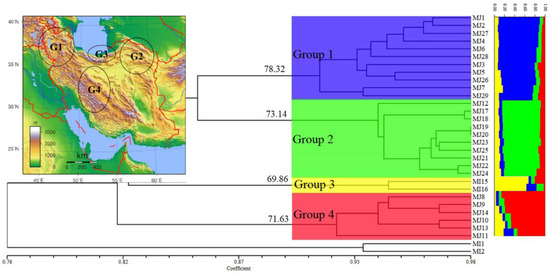
Figure 4.
UPGMA cluster diagram based on Dice coefficient estimated from 339 RAPD and ISSR markers for 29 populations of the Meloidogyne javanica (for population codes, see Table 1 and for geographic distribution, see Figure 1). The values on the dendrogram give the stability of main clades as estimated with a bootstrap procedure. Bar graphs showing genetic diversity structure, as assessed using the Structure software. Each group is represented by a different color (blue, green, yellow, and red). The geographic distribution of the groups is presented in the Iran map in the above-left corner.

Figure 5.
ΔK output from the structure harvester for Meloidogyne javanica in the present study.
All populations were defined in four groups based on their positions in four clusters, and frequency, AMOVA, and PCoA analyses were carried out. Group 1 contained eleven populations (MJ1–7 and MJ26–29) and all of them were collected from three northwestern provinces of Iran (Ardabil, East Azerbaijan and West Azerbaijan) (Table 1; Figure 1 and Figure 4). Values of P, I, H and uHe (27.43%, 0.167, 0.115 and 0.121) revealed that this group, with about 12.1%, exhibited the highest genetic diversity, as compared to that of the other three groups (Table 5). Northwestern region of Iran is a mountainous region with a cold to the temperate climate and semi-humid conditions.
Table 5.
The Genetic diversity values by combining RAPD and ISSR markers in Meloidogyne javanica populations were collected from Iran (groups defined based on K = 4).
Group 2 contained ten populations (MJ12 and MJ17-25). Most of the populations of this group were related to Razavi Khorasan and North Khorasan provinces in northeastern Iran (MJ17–24), as well as one population of Ghom province (MJ12) and one population of Mahabad city in West Azerbaijan province (Table 1; Figure 1 and Figure 4). Values of P, I, H, and uHe for this group were 15.58%, 0.112, 0.078, and 0.082 respectively, with about 8.2% genetic diversity. The Northeast of Iran includes two climates; Razavi Khorasan province is a temperate, semi-humid, and mountainous region, but North Khorasan province is a mountainous and temperate one with high humidity, especially in the northern parts of this province. In the UPGMA dendrogram, one population of Ghom (MJ12) and two populations of North Khorasan province (MJ17 and 18) are somewhat separated from the rest of the group, despite the same genetic structure as other populations of the group. MJ25, collected from the tomato in Mahabad city, West Azerbaijan province, in northwestern Iran, was placed near the populations of Razavi Khorasan province. The high similarity in climatic conditions between the two provinces could be the reason.
Group 3 included two populations (MJ15-16) of Galugah city in Mazandaran province which were collected from the roots of tobacco. This region is one of the most important tobacco-growing areas in Iran (Table 1; Figure 1 and Figure 4). Values of P, I, H and uHe (5.90%, 0.036, 0.024 and 0.033) revealed the lowest genetic diversity (about 3.3%) in comparison to the other three groups (Table 5); however, it should be noted that two populations from a region could not be the correct criterion for assessing the genetic diversity; however, this value can indicate the genetic diversity in the tobacco fields of this region. This region (and generally three northern provinces of Iran), which is separated from the rest of Iran by the Alborz mountains, has a temperate climate with very high humidity.
Group 4 contained six populations (MJ8–11 and MJ13–14) and all these populations were collected from four provinces in central or southern parts of Iran (Esfahan, Fars, Kohgiluyeh and Boyer-Ahmad and Markazi provinces) (Table 1; Figure 1 and Figure 4). This group, with values of P, I, H and uHe (16.52%, 0.109, 0.078 and 0.085), has about 8.5% genetic diversity (Table 5). This region shows a variety of climates, from cold and mountainous ones to warm and dry ones. The genetic variation means (P, I, H and uHe) were 17.11%, 0.106, 0.074 and 0.08, respectively, thus revealing about 8% genetic diversity for all populations studied (Table 5).
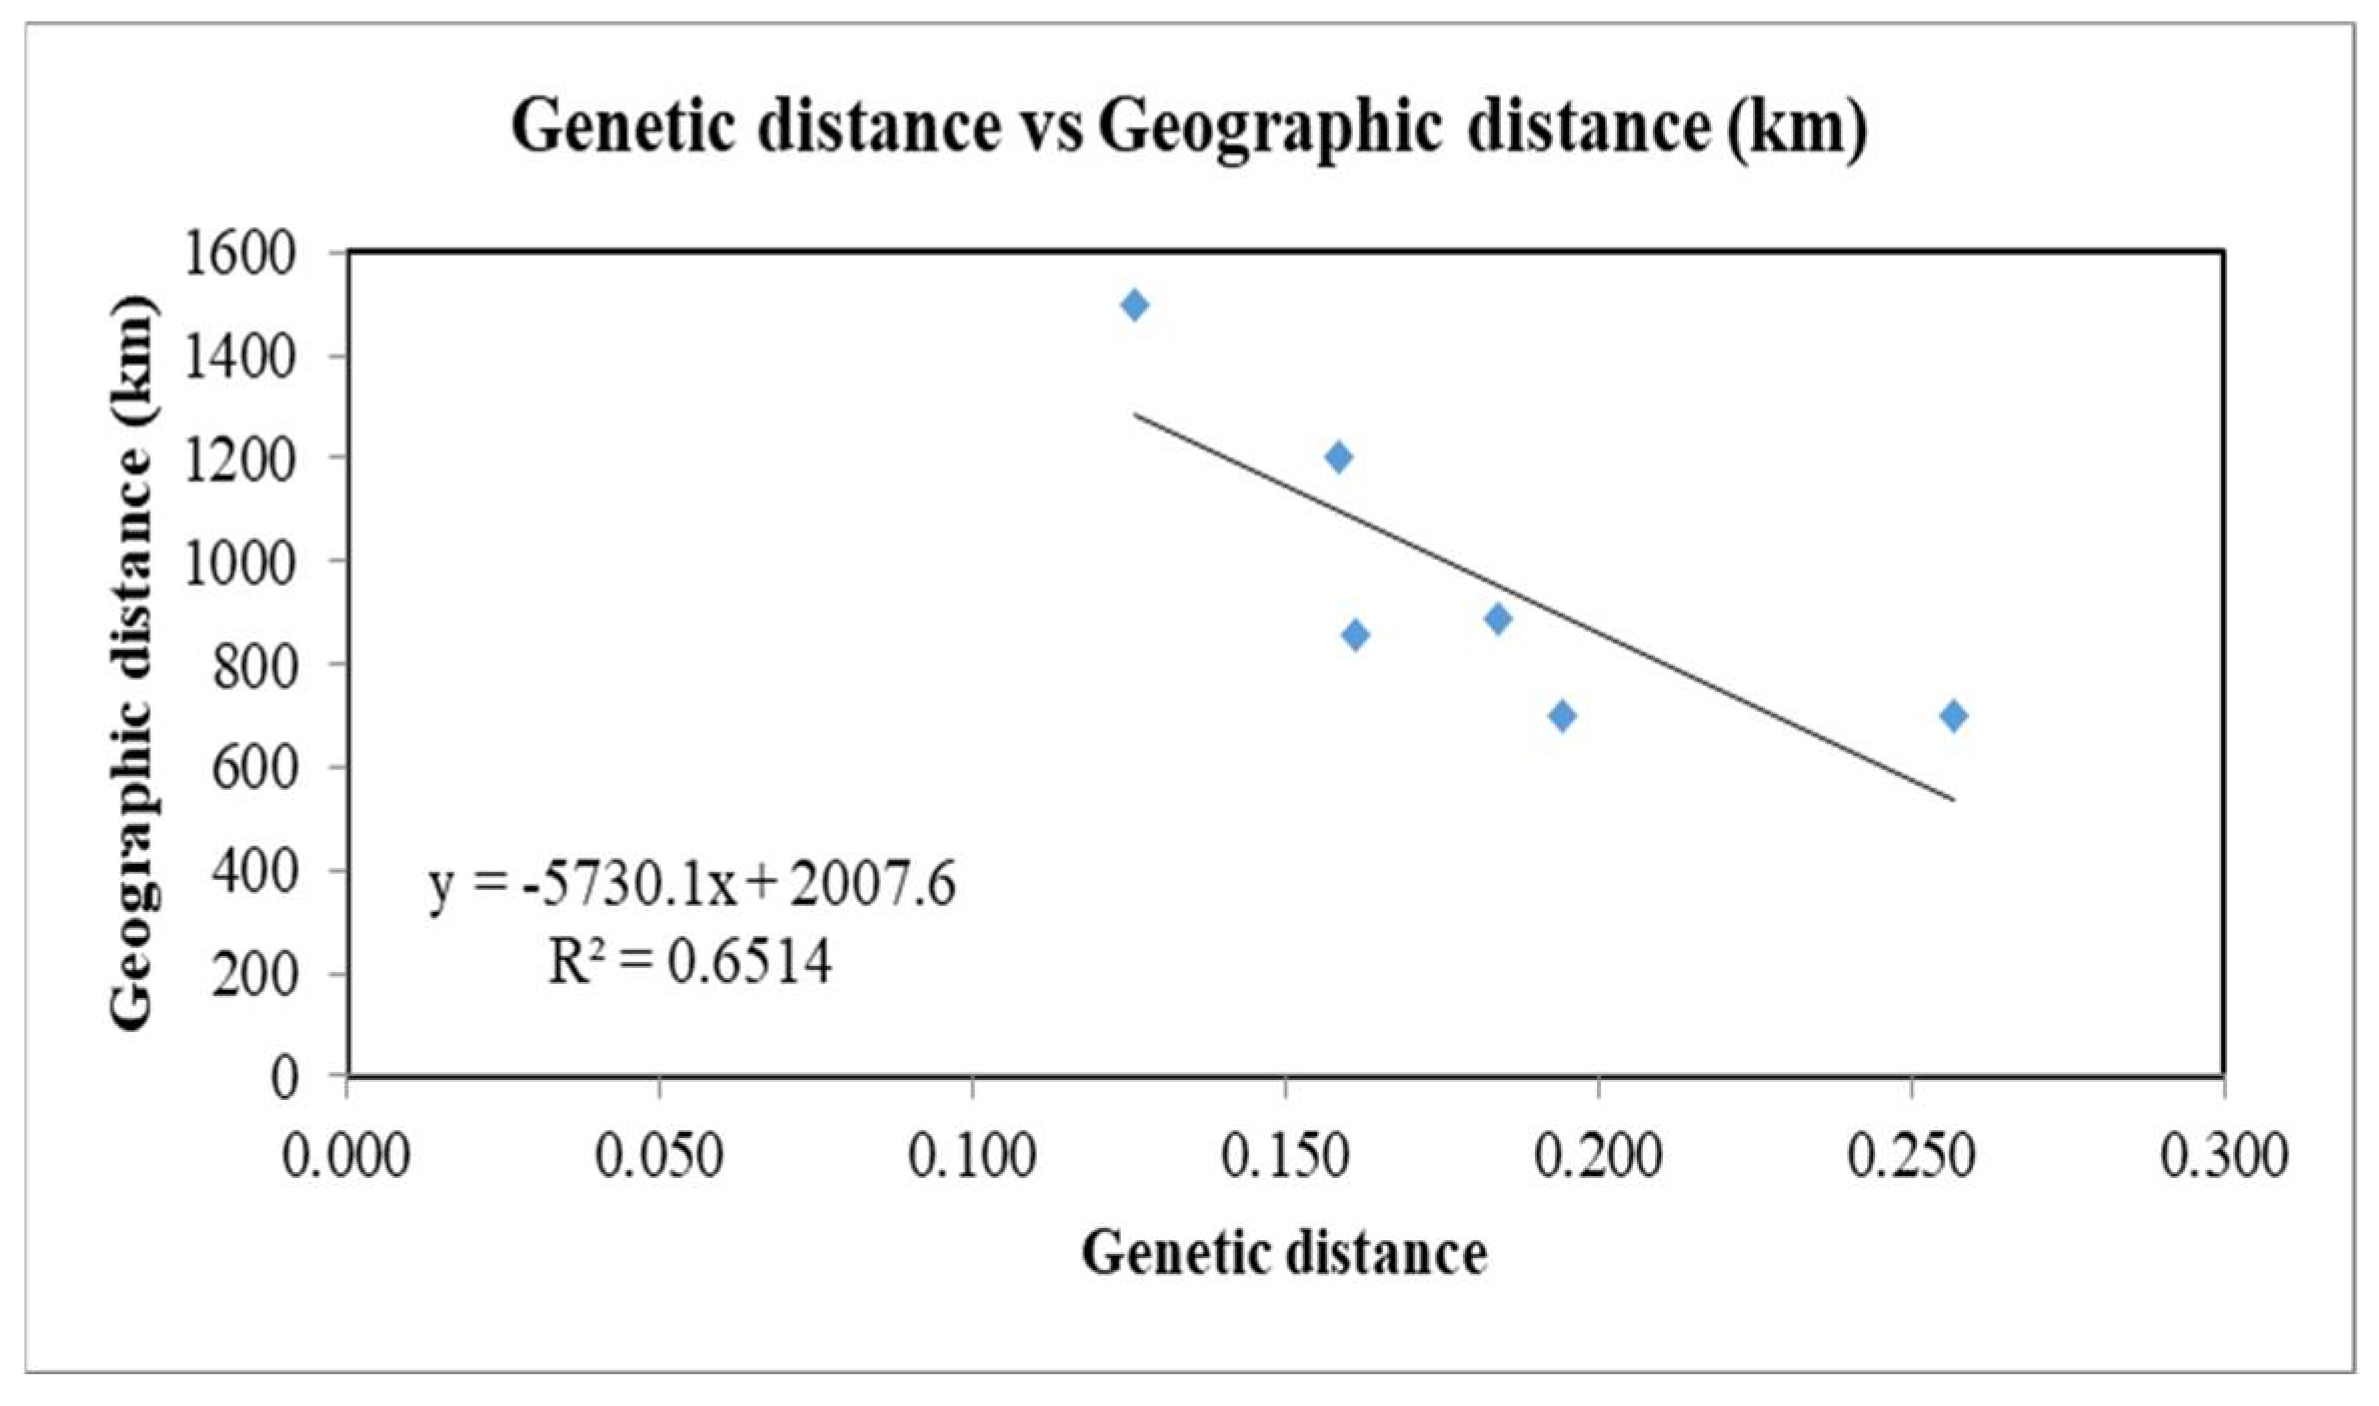
Geographic distances between four different groups were measured approximately by the distance of the central city of groups to each other (Table 6). The range of Nei’s unbiased genetic distance (D) between groups 1 and 4 was 0.126 to 0.257. The lowest value was between groups 1 and 2 (with about 1500 km geographical distance), while the highest one was between groups 3 and 4 (with about 700 km geographical distance) (Table 6). Mantel test indicated a negative correlation between genetic distance and geographic distance in the four groups, with a relatively high value of R square (R2 = 0.651) (Figure 6).
Table 6.
Nei’s unbiased genetic distance (detected by the combination of RAPD and ISSR markers) and geographic distance between pairs of the groups of Meloidogyne javanica populations in Iran.
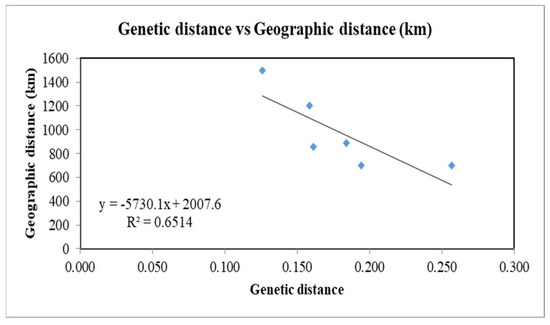
Figure 6.
Mantel test showing the correlation between genetic distance and geographic distance of groups for the recovered populations of Meloidogyne javanica from Iran.
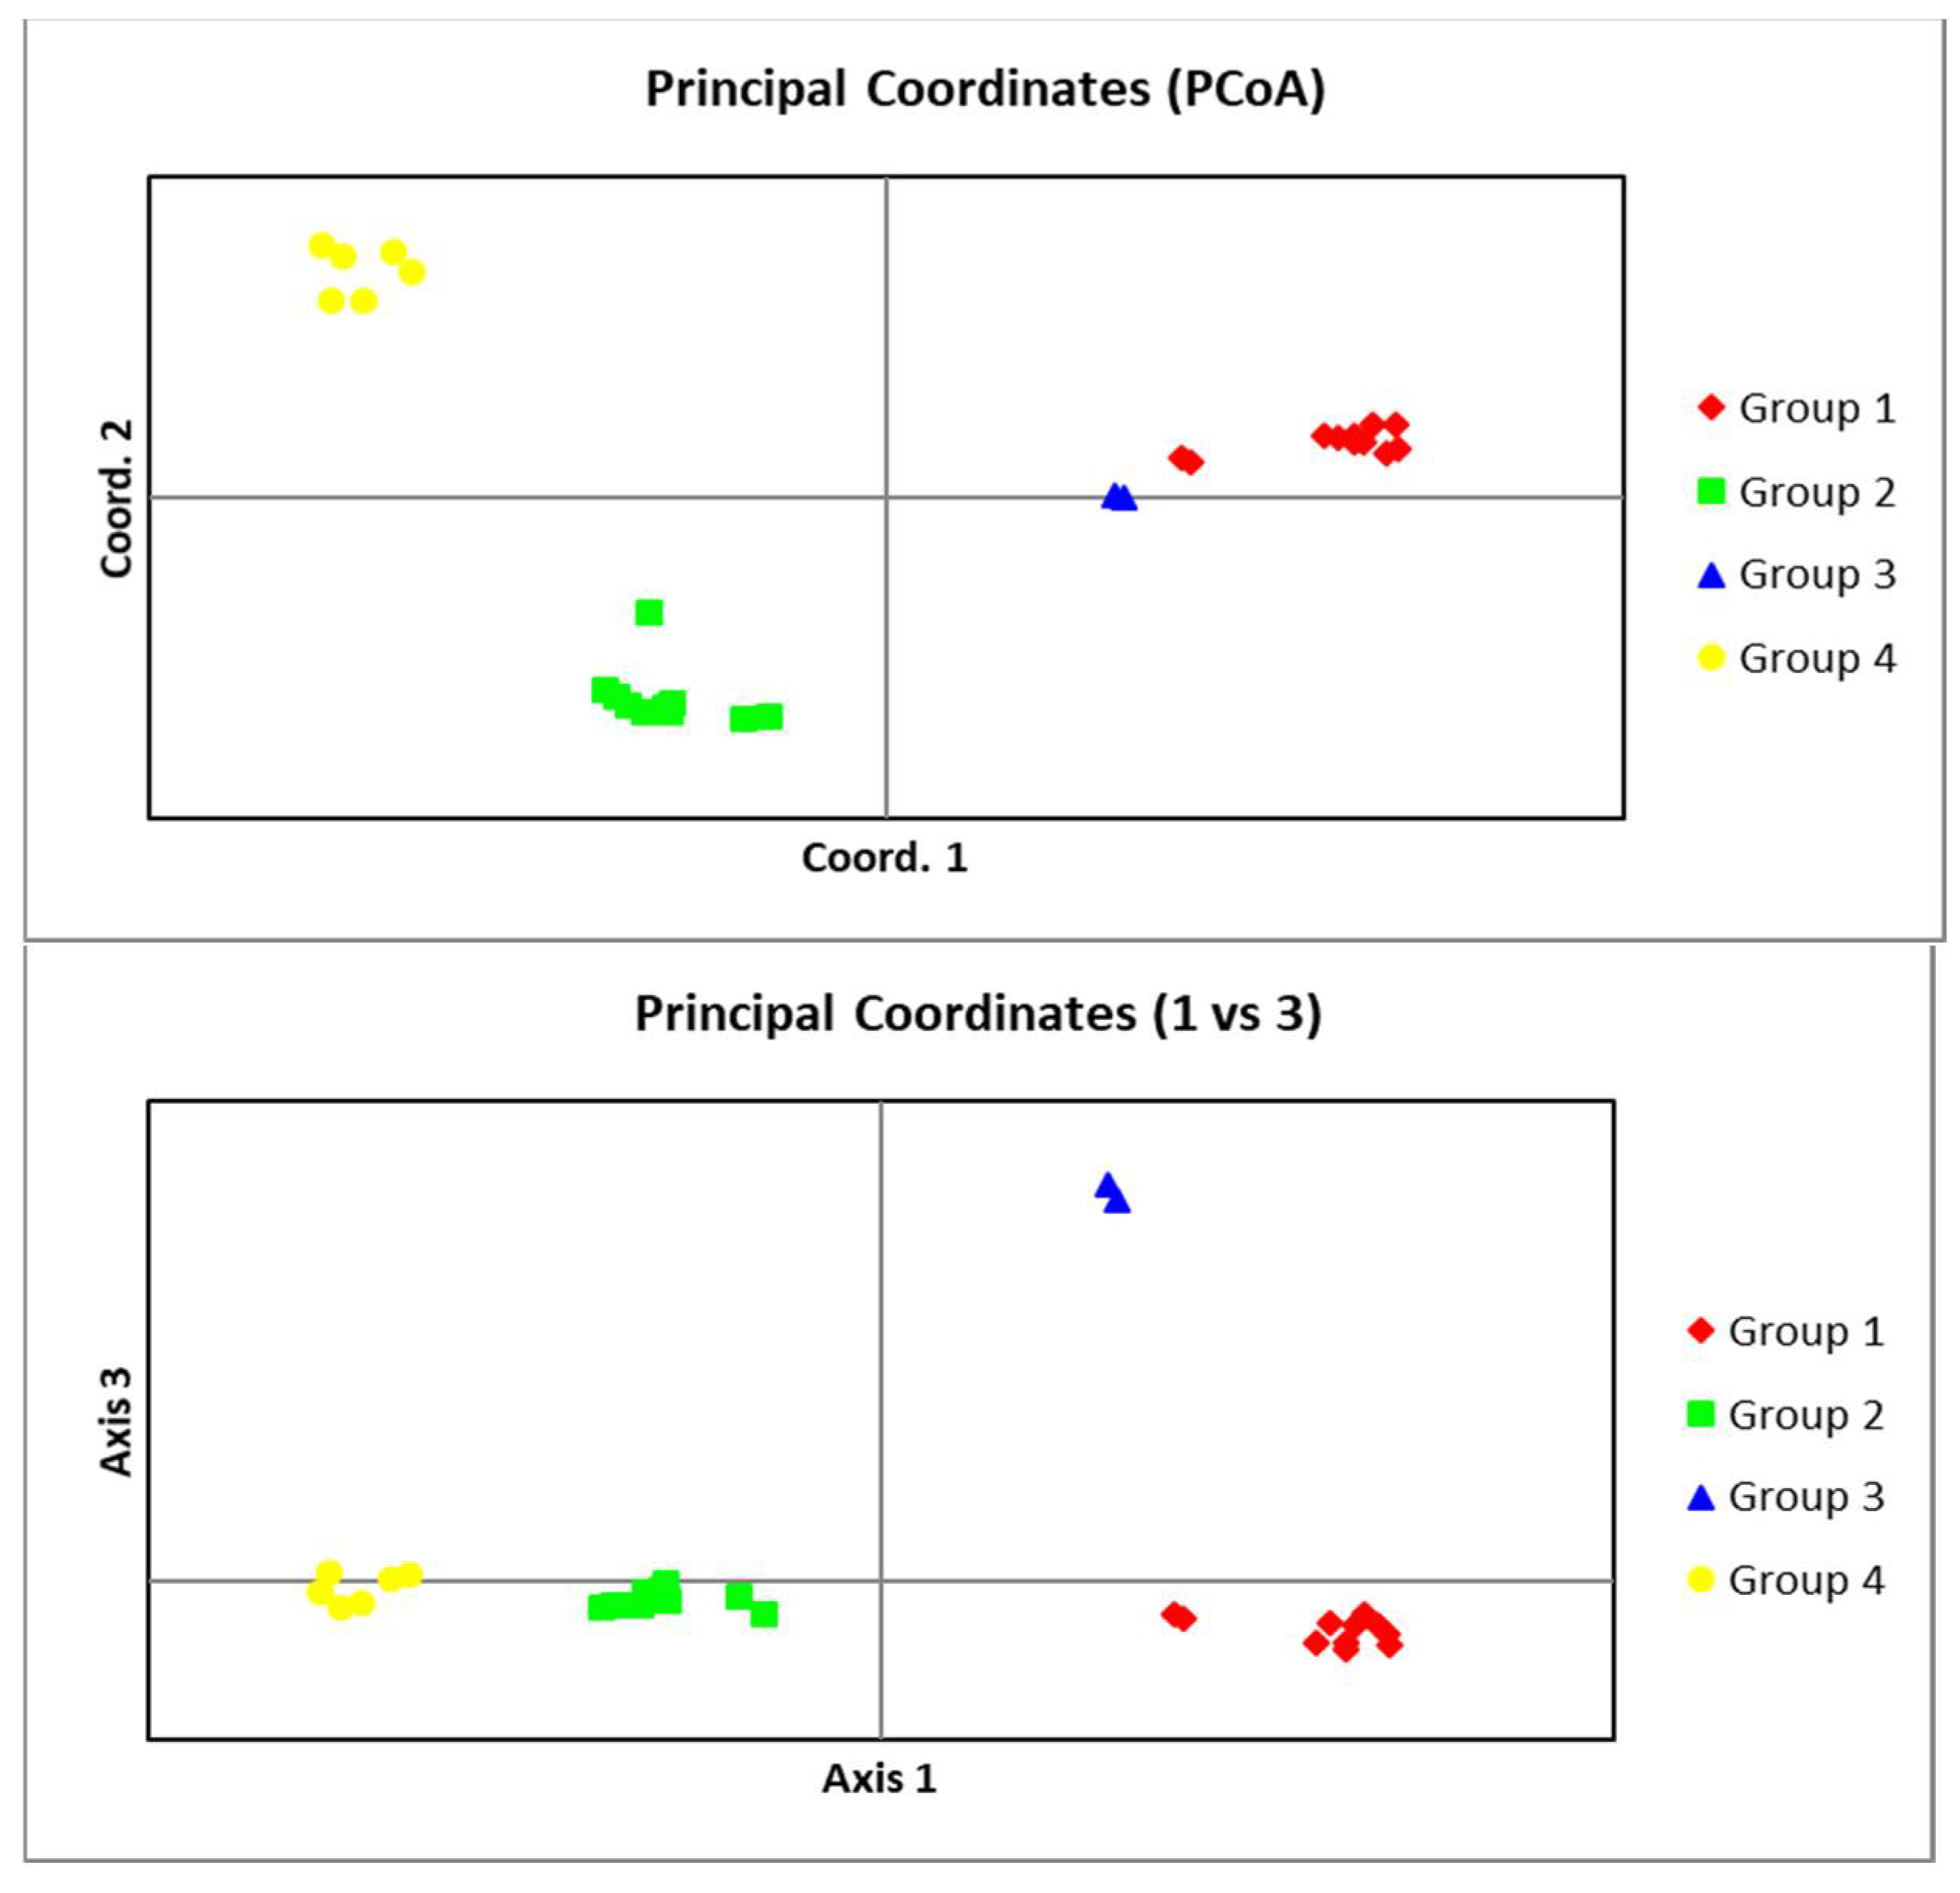
In AMOVA analysis, the percentage of molecular variances within and among groups was 37% and 62%, respectively (Table 7). Results of PCoA analyses are presented as two graphs for PC1 vs. PC2 and PC1 vs. PC3 in Figure 7, revealing a good separation for groups. The first two variables explained almost 61%, and the first three ones accounted for about 80% of the total variance.
Table 7.
Analysis of the molecular variance (AMOVA) of Meloidogyne javanica populations based on RAPD and ISSR data.
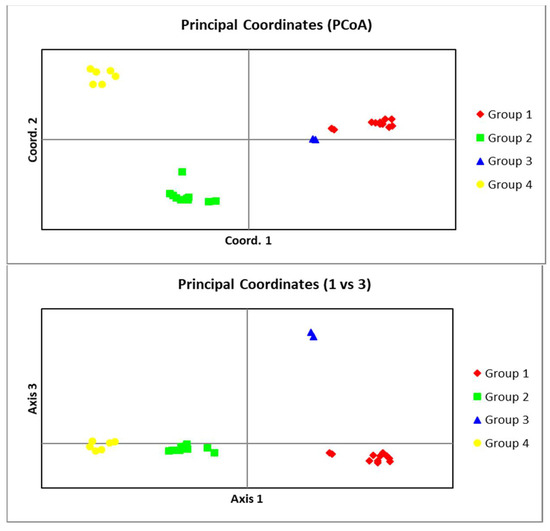
Figure 7.
The bi-dimensional dispersion according to the principal coordinates analysis obtained using the GenAlex software (Above: PC1 vs. PC2, below: PC1 vs. PC3) for Meloidogyne javanica populations from Iran.
The lowest FST value was between groups 1 and 2 (FST = 0.575), which had the highest Nm value (Nm = 0.184). On the other hand, groups 3 and 4 had the highest FST (FST = 0.726) and lowest Nm (Nm = 0.094), respectively. Total FST and Nm were 0.628 (P = 0.001) and 0.148, respectively. Values of FST and Nm for different groups (different regions) are presented in Table 8.
Table 8.
Pairwise estimate of FST and Nm among four groups of the populations of Meloidogyne javanica from Iran.
4. Discussion
The results of this study confirmed that M. javanica could be considered the most predominant species of root-knot nematode infecting vegetable fields and greenhouses in Iran. Morphological and morphometrical characterization was confirmed by species-specific SCAR primers. These primers produced a 670 bp band for all populations, thus indicating the effective performance of these primers; the results were, thus, in agreement with those obtained from other studies [8,9,10,11,12,13].
This is the first comprehensive study of the genetic structure of RKNs in Iran. Previous researches were carried out in limited areas; for this reason, genetic diversity and amount of frequency were determined in different cities. Since a clear boundary between geographical areas cannot be considered due to the distribution of nematodes by human activities, populations’ definition at higher levels in four different groups could be fitted with the results of the genetic structure. These four groups belong to four different regions and are relatively far apart.
There was no considerable morphological or morphometric difference between populations of the studied groups, and we could not separate four groups based on morphological or morphometric characteristics; therefore, their diagnostic characteristics are not given separately.
There were many similarities between the results of the two markers; however, the genetic diversity calculated with ISSR was slightly higher than that conducted by RAPD (8.8% and 6.6%, respectively) (data are not presented). The total estimated genetic diversity for all populations was 8%, which could be considered a low value. In this study, the low genetic diversity in M. javanica populations was similar to the previous results on M. javanica in different crops [23,24,25,36].
The estimated genetic diversity for Northeastern Iran in the present study (8.2%) was nearly the same as the amount calculated previously [9] (7%); however, this value was estimated for the first time in other regions.
By considering host plants (without considering geographic region), the amount of genetic diversity for the populations of M. javanica isolated from tomato was nearly twice more than that of the isolates of cucumber (21.3% and 10.3%, respectively), thus indicating that intraspecific variation could be influenced by the host plant. On the other hand, the genetic diversity in fields and greenhouses was relatively equal, about 19.2% and 18.3%, respectively. Usually, greenhouse soil is supplied from fields; even if the soil was pasteurized, it is still possible for nematodes to enter the greenhouse via agricultural inputs.
However, due to the traditional methods of cultivation in Iran and the tendency of farmers to provide their agricultural inputs (e.g., transplants) from a source near their own fields, it seems that the movement and distribution of different nematode populations are limited; the genetic diversity is very low and genetic changes are confined to intra-region distances.
Although the results of this study revealed that the pathway of distribution of the population was from k = 1 to k = 4, due to the low number of populations and lack of data from other regions of Iran, only the probability of distribution was estimated in the present study. Increasing the number of populations and extending the geographical areas to be studied in future works can help to better understand the distribution patterns.
5. Conclusions
Meloidogyne javanica is considered the most prevalent species of root-knot nematodes infecting vegetable fields and greenhouses in Iran. There was no considerable morphological or morphometric difference between the populations of the studied groups. The results of this study, thus, showed that as the geographical distance was increased, the border between the populations became clearer. Increasing the number of populations and investigating the pathogenicity of different groups in different regions of Iran and even in other parts of the world could help to clarify the boundaries between populations. The possibility of the existence of similar groups in other regions of the world needs to be investigated and can be very useful in finding the route of the movement of these nematodes.
Author Contributions
Conceptualization, Y.R.D. and M.C.M.T.F.; methodology, A.M.H., M.R. and Reza Ghaderi; software, A.J. and C.E.d.S.O.; formal analysis, A.M.H., M.R. and R.G.; investigation, Y.R.D., M.C.M.T.F., A.M.H. and R.G.; data curation, M.R., A.J. and C.E.d.S.O.; writing—original draft preparation, A.M.H., M.R. and R.G.; writing—review and editing, Y.R.D. and M.C.M.T.F.; supervision, Y.R.D. and M.C.M.T.F.; funding acquisition, R.G. All authors have read and agreed to the published version of the manuscript.
Funding
This research was funded by Iranian National Science Foundation (INFS; project No. 96008747) and Shiraz University.
Acknowledgments
The authors appreciate Abdollah Ahmadpour (Higher Education Center of Shahid Bakeri Miyandoab, Urmia University, Iran) for his scientific help and comments for improving of the work. Also, the authors wish to gratefully thank the Iranian National Science Foundation (INFS; project No. 96008747) and Shiraz University for financial support.
Conflicts of Interest
The authors declare no conflict of interest.
References
- Abad, P.B.; Favery, M.N.; Ross, P.; Serena, C. Root-knot nematode parasitism and host response: Molecular basis of a sophisticated interaction. Mol. Plant Pathol. 2003, 4, 217–224. [Google Scholar] [CrossRef] [PubMed]
- Buenna, A.P.; Garcia-Alvarez, A.; Diez-Rojo, M.A.; Ros, C.; Fernandez, P.; Lacasa, A. Use of pepper crop residues for the control of root knot nematodes. Biores. Technol. 2007, 98, 2846–2851. [Google Scholar] [CrossRef]
- Ye, W.; Zeng, Y.; Kerns, J. Molecular characterisation and diagnosis of root-knot nematodes (Meloidogyne spp.) from turfgrasses in North Carolina, USA. PLoS ONE 2015, 10, e0143556. [Google Scholar] [CrossRef]
- Janssen, T.; Karssen, G.; Verhaeven, M.; Coyne, D.; Bert, W. Mitochondrial coding genome analysis of tropical root-knot nematodes (Meloidogyne) supports haplotype based diagnostics and reveals evidence of recent reticulate evolution. Sci. Rep. 2016, 6, 1–13. [Google Scholar]
- Cunha, T.G.D.; Visôtto, L.E.; Lopes, E.A.; Oliveira, C.M.G.; God, P.I.V.G. Diagnostic methods for identification of root-knot nematodes species from Brazil. Ciên. Rur. 2018, 48, 1–12. [Google Scholar] [CrossRef]
- Zijlstra, C. Identification of Meloidogyne chitwoodi, M. fallax and M. hapla based on SCAR-PCR: A powerful way of enabling reliable identification of populations or individuals that share common traits. Eur. J. Plant Pathol. 2000, 106, 283–290. [Google Scholar] [CrossRef]
- Zijlstra, C.; Donkers-Venne, D.T.H.M.; Fargette, M. Identification of Meloidogyne incognita, M. javanica and M. arenaria using sequence characterised amplified region (SCAR) based PCR assays. Nematology 2000, 2, 847–853. [Google Scholar]
- Askarian, H.; Sharifnabi, B.; Olia, M.; Moghadam, E.M.; Akhavan, A. Identification of Meloidogyne javanica using morphological and morphometrical characters and species-specific primers. J. Sci. Technol. Agric. Nat. Res. 2009, 13, 279–290. [Google Scholar]
- Mokaram Hesar, A.; Mehdikhani Moghadam, E.; Tanha Maafi, Z. Morphometrical and genetic diversity of Meloidogyne javanica isolates from the north east of Iran. J. Nematode Morph. System. 2011, 14, 1–11. [Google Scholar]
- Ghaderi, R.; Dehghan, A.A.; Hesar, A.M.; Karegar, A. Genetic intraspecific diversity of Meloidogyne javanica parasitizing vegetables in southern Iran. J. Nematol. 2020, 52, 1–13. [Google Scholar] [CrossRef]
- Adam, M.A.M.; Phillips, M.S.; Blok, V.C. Molecular diagnostic key for identification of single juveniles of seven common and economically important species of root-knot nematode (Meloidogyne spp.). Plant Pathol. 2007, 56, 190–197. [Google Scholar] [CrossRef]
- Baidoo, R.; Joseph, S.; Mengistu, T.M.; Brito, J.A.; McSorley, R.; Stamps, R.H.; Crow, W.T. Mitochondrial haplotype-based identification of root-knot nematodes (Meloidogyne spp.) on cut foliage crops in Florida. J. Nematol. 2016, 48, 193–202. [Google Scholar] [CrossRef]
- Rusinque, L.; Inácio, M.L.; Mota, M.; Nóbrega, F. Morphological, biochemical and molecular characterisation of Meloidogyne javanica, from North Portugal, in tomato. Rev. Ciên. Agrá. 2018, 41, 193–198. [Google Scholar] [CrossRef]
- Onkendi, E.M.; Kariuki, G.M.; Marais, M.; Moleleki, L.N. The threat of root-knot nematodes (Meloidogyne spp.) in Africa: A review. Plant Pathol. 2014, 63, 727–737. [Google Scholar] [CrossRef] [Green Version]
- Jones, J.T.; Haegeman, A.; Danchin, E.G.; Gaur, H.S.; Helder, J.; Jones, M.G.; Perry, R.N. Top 10 plant-parasitic nematodes in molecular plant pathology. Mol. Plant Pathol. 2013, 14, 946–961. [Google Scholar] [CrossRef] [PubMed]
- Forghani, F.; Hajihassani, A. Recent advances in the development of environmentally benign treatments to control root-knot nematodes. Front. Plant Sci. 2020, 11, 1125. [Google Scholar] [CrossRef]
- Mahdikhani Moghadam, E. Nematodes of the family Meloidogynidae. In Plant-Parasitic Nematodes in Iran; Ghaderi, R., Kashi, L., Karegar, A., Eds.; Shiraz, Marjae elm & Iranian Society of Nematology: Shiraz, Iran, 2018; pp. 397–418. [Google Scholar]
- Lax, P.; Dueñas, J.R.; Gardenal, C.; Doucet, M. Assessment of genetic variability in populations of Nacobbus aberrans (Thorne, 1935) Thorne & Allen, 1944 (Nematoda: Pratylenchidae) from Argentina. Nematology 2007, 9, 261–270. [Google Scholar]
- Devran, Z.; Söğüt, M.A. Distribution and identification of root-knot nematodes from Turkey. J. Nematol. 2009, 41, 128–133. [Google Scholar]
- Hyman, B.C. Molecular systematics and population biology of phytonematodes: Some unifying principles. Fund. Appl. Nematol. 1996, 19, 309–313. [Google Scholar]
- Plantard, O.; Porte, C. Population genetic structure of the sugar beet cyst nematode Heterodera schachtii: A gonochorist and amphimictic species with highly inbred but weakly differentiated populations. Mol. Ecol. 2004, 13, 3341. [Google Scholar] [CrossRef]
- Rashidifard, M.; Fourie, H.; Véronneau, P.Y.; Marais, M.; Daneel, M.S.; Mimee, B. Genetic diversity and phylogeny of South African Meloidogyne populations using genotyping by sequencing. Sci. Rep. 2018, 8, 1–9. [Google Scholar] [CrossRef] [PubMed]
- Randig, O.; Bongiovanni, M.; Carneiro, R.M.D.G.; Castagnone-Sereno, P. Genetic diversity of root-knot nematodes from Brazil and development of SCAR markers specific for the coffee-damaging species. Genome 2002, 45, 862–870. [Google Scholar] [CrossRef] [PubMed]
- Cofcewicz, E.T.; Carneiro, R.M.D.G.; Castagnone-Sereno, P.; Quénéhervé, P. Enzyme phenotypes and genetic diversity of root-knot nematodes parasitising Musa in Brazil. Nematology 2004, 6, 85–95. [Google Scholar] [CrossRef]
- Medina, I.L.; Gomes, C.B.; Correa, V.R.; Mattos, V.S.; Castagnone-Sereno, P.; Carneiro, R.M.D.G. Genetic diversity of Meloidogyne spp. parasitising potato in Brazil and aggressiveness of M. javanica populations on susceptible cultivars. Nematology 2017, 19, 69–80. [Google Scholar] [CrossRef]
- de Grisse, A.T. Redescription ou modifications de quelques techniques utilisées dans l’étude des nématodes phytoparasitaires. Med. Van Den Rijks. Land. Gent. 1969, 34, 351–369. [Google Scholar]
- Tanha Maafi, Z.T.; Subbotin, S.A.; Moens, M. Molecular identification of cyst-forming nematodes (Heteroderidae) from Iran and a phylogeny based on ITS-rDNA sequences. Nematology 2003, 5, 99–111. [Google Scholar] [CrossRef]
- Rohlf, F.J. NTSYSpc: Numerical Taxonomy and Multivariate Analysis System, Version 2.02; Exeter Software: Setauket, NY, USA, 2000.
- Mantel, N. The detection of disease clustering and a generalized regression approach. Cancer Res. 1967, 27, 209–220. [Google Scholar]
- Yap, I.V.; Nelson, R.J. WINBOOT: A Program for Performing Bootstrap Analysis for Binary Data to Determine the Confidence Limits of UPGMA-Based Dendrograms; Discussion Paper Series No. 14; International Rice Research Institute: Los Baños, Philippines, 1996. [Google Scholar]
- Pritchard, J.K.; Stephens, M.; Donnelly, P. Inference of population structure using multilocus genotype data. Genetics 2000, 155, 945–959. [Google Scholar] [CrossRef]
- Earl, D.A.; Vonholdt, B.M. STRUCTURE HARVESTER: A website and program for visualizing STRUCTURE output and implementing the Evanno method. Conserv. Gen. Res. 2012, 4, 359–361. [Google Scholar] [CrossRef]
- Evanno, G.; Regnaut, S.; Goudet, J. Detecting the number of clusters of individuals using the software STRUCTURE: A simulation study. Mol. Ecol. 2005, 14, 2611–2620. [Google Scholar] [CrossRef]
- Peakall, R.O.D.; Smouse, P.E. GENALEX 6: Genetic analysis in Excel. Population genetic software for teaching and research. Mol. Ecol. Notes. 2006, 6, 288–295. [Google Scholar] [CrossRef]
- Milgroom, M.G. Population Biology of Plant Pathogens: Genetics, Ecology, and Evolution; (No. 581.2 M644p); APS Press: St. Paul, MN, USA, 2015. [Google Scholar]
- Carneiro, R.M.D.G.; dos Santos, M.F.A.; Almeida, M.R.A.; Mota, F.C.; Gomes, A.C.M.M.; Tigano, M.S. Diversity of Meloidogyne arenaria using morphological, cytological and molecular approaches. Nematology 2008, 10, 819–834. [Google Scholar]


Publisher’s Note: MDPI stays neutral with regard to jurisdictional claims in published maps and institutional affiliations. |
© 2022 by the authors. Licensee MDPI, Basel, Switzerland. This article is an open access article distributed under the terms and conditions of the Creative Commons Attribution (CC BY) license (https://creativecommons.org/licenses/by/4.0/).