Article

Responses of Wheat Yield under Different Fertilization Treatments to Climate Change Based on a 35-Year In Situ Experiment

1
College of Resources and Environment, Northwest A & F University, Yangling, Xianyang 712100, China
2
The State Key Laboratory of Soil Erosion and Dryland Farming on the Loess Plateau, Institute of Soil and Water Conservation, Northwest A&F University, Yangling, Xianyang 712100, China
3
CAS Center for Excellence in Quaternary Science and Global Change, Xi’an 710061, China
*
Author to whom correspondence should be addressed.
Agriculture 2022, 12(9), 1498; https://doi.org/10.3390/agriculture12091498
Submission received: 31 July 2022 / Revised: 2 September 2022 / Accepted: 15 September 2022 / Published: 18 September 2022
(This article belongs to the Section Ecosystem, Environment and Climate Change in Agriculture)

Abstract

:
Fertilization, as one of many important field management practices, can increase crop yields. However, whether different levels of fertilization will affect the response of wheat yields to inter-annual climate variations and long-term climate trends is not clear. In this study, 35-year wheat yields were used to investigate the responses of wheat yield to inter-annual climate variations and long-term climate trends under different fertilization treatments. The first difference method was used to de-trend wheat yields and climate variables and stepwise regression analysis was used to quantify the yield–climate relationship. The experimental design consisted of a control treatment (CK without fertilization) and three fertilizer treatments: nitrogen, phosphorus, and manure (NPM with 120 kg ha−1 N, 26.2 kg ha−1 P, and 75 t ha−1 manure), nitrogen and phosphorus (NP with 120 kg ha−1 N and 26.2 kg ha−1 P), and manure (M with 75 t ha−1 manure). Compared to the CK treatment, the NPM, NP, and M treatments increased wheat yield by an average of 201.9, 161.7, and 130.6% and increased yield inter-annual variability by an average of 191.2, 149.3, and 144.2%, respectively, during the study period (1985–2020). Inter-annual climate fluctuations in the study area explained 45, 38, 27, and 29% of wheat yield variations and 35-year climatic trends contributed to wheat yield decreases of 0.3, 0.7, 1.6, and 1.8% for the NPM, NP, M, and CK treatments, respectively. The results show the impact of inter-annual climate fluctuations on yield increases with the increasing level of fertilization, while the effect of long-term climate trends on yield decreases with the increasing level of fertilization.

1. Introduction

Wheat is the second-most-produced cereal grain in the world, after maize. Potential impacts of climate change on wheat yield have attracted great attention from farmers, governmental officials, and scientists. Some studies have used biophysical simulation models and field experiments to estimate the effect of changes in climate variables on wheat yields [1,2]. For example, Zhao et al. (2017) [3] predicted a 6.0 ± 2.9% loss in global wheat yield with each degree Celsius increase. Asseng et al. (2015) [4] simulated wheat yields of 30 global locations from 1981 to 2010 and their results showed that wheat yield decreased by 1–28% with an increase of 2 °C and decreased by 6–55% with an increase of 4 °C. Recent studies used regression models to examine the response of wheat yields to climate change by developing de-trended yield–climate relationships [5,6,7,8,9]. These studies estimated wheat yields as a function of climate variables while controlling for time-invariant fixed effects, such as soil quality and other land characteristics [10]. For example, Lobell et al. (2005) [11] analyzed the effects of climate change on wheat yields in an irrigated region of Mexico between 1980 and 2002 and found that at least 58% of wheat yield variability can be attributed to cooling of growing season nighttime temperatures. Licker et al. (2013) [6] found wheat yields in Rostov, Russia, were strongly correlated with May and June average temperatures, which could explain 49 and 16% of inter-annual yield variability between 1973 and 2010, respectively, while in Picardy, France, wheat yields were significantly impacted by November precipitation and minimum summer temperatures, which explained 26 and 23% of inter-annual yield variability, respectively. In Australia, climate trends were found to be responsible for 30 to 50% of the observed increase in wheat yields between 1952 and 1996, with increases in minimum temperatures identified as being the dominant influence [7]. However, past research has only considered the impacts of field management measures, in particular fertilization, on the yield trends [7,9]. Less attention has been paid to the potential contributions of the increasing level of fertilization to mitigate the impact of climate change on wheat yields. In the last several decades, the amount of fertilization has increased and fertilizer quality has been improved, which not only alters the yield trends of wheat [12,13] but also might decrease the response of wheat yields to climate change.
Wheat is one of the most important cereal crops in dryland regions [14]. Insufficient water is the main limiting factor for wheat development [15]. Appropriate fertilization can promote water uptake by wheat roots from deeper soil layers while maintaining more precipitation in the soil profile, which increases water availability for wheat growth [16,17,18]. Therefore, fertilization is one important measure to maintain high yields in dryland wheat. Although the positive effects of fertilization on crop yields are significant, high levels of fertilization do not always result in high yields because high levels of fertilization sometimes increase the severity of crop water stress in severe dry years [19,20]. Therefore, investigating the responses of wheat yield under different levels of fertilization to climate change is of great importance.
Winter wheat (Triticum aestivum L.) is one of the main local food crops in the Loess Plateau of China and accounts for 44% of the planted area [21,22]; increasing wheat yield is an important goal to maintain local food supply. The site of this study is the southern Loss Plateau, where many scholars have studied the effect of different fertilization treatments on wheat yield [23,24,25] and the responses of wheat yield to climate change [26,27]. However, whether wheat yields under different fertilization levels will respond differently to local climate change is not known. In this study, we systematically compared the difference in wheat yields under four fertilization treatments based on 35 years of in situ experimental data (1985–2020) collected at the Changwu Agri-ecological Station on the Loess Plateau. Stepwise regression analysis was used to identify the most relevant climate variables for yield variation for each fertilization treatment and empirical regression equations were developed to quantify the impact of climate trend on yield for each treatment. The objectives of this study were to: (1) compare the difference in wheat yields under four long-term fertilization treatments; (2) identify the major climate variables for yield variations for each fertilization treatment; and (3) analyze the impact of climate trend on wheat yields.

2. Materials and Methods

2.1. Experimental Site and Meteorological Condition

This study was conducted from 1985 to 2020 at the Changwu Agri-ecological Research Station (107°41′ E, 35°14′ N) in Shaanxi Province on the Southern Loess Plateau of China. The experimental site is 1220 masl and flat. The climate is semi-humid. Average annual precipitation was 575 mm from 1968 to 2020, with large inter-annual variability and uneven seasonal distribution. The annual average temperature is 9.5 °C, with monthly averages of −4.7 °C in January and 22.1 °C in July. The mean frost-free period is 194 days, average annual solar radiation is 5266 MJ m−2, and potential evapotranspiration (PET) is 967 mm. According to the FAO soil classification system, the soil at the experimental site is silty clay loam with 8% sand, 70% silt, and 22% clay. The soil texture in the root zone is uniform and loose and the soil bulk density ranges from 1.17 to 1.30 g cm−3. Groundwater level remains at a depth of about 80 m below soil surface, which precludes upward capillary flow into the root zone.

2.2. Field Experiments

The experimental site is located at Shilipu Long-term Experimental Field of Changwu Agri-ecological Research Station, which was established in 1984 and consists of 36 treatments and 108 plots.
In this study, four different fertilization treatments of winter wheat were selected. The experiment had a randomized complete block design with three replicates of four fertilization treatments: (1) no fertilization as a control (CK), (2) chemical fertilization with 120 kg ha−1 N and 26.2 kg ha−1 P (NP), (3) manure fertilization with 75 t ha−1 (M), and (4) chemical and manure fertilization with 120 kg ha−1 N, 26.2 kg ha−1 P, and 75 t ha−1 manure (NPM). The N and P contents in the manure were 1.164 and 0.611 g kg−1, respectively. These fertilization treatments were determined based on the initial soil N and P content and local fertilization practices [28]. The 12 plots were all 10.3 m long × 6.5 m wide, with a 1.0 m buffer zone between each plot. All fertilizers were mixed and applied at sowing. Winter wheat was sown annually from middle to late September at 163 kg ha−1 for each treatment and harvested from late June to early July the year after. From 1985 to 2020, three varieties of winter wheat were planted to improve wheat yield: Changwu 131 from 1985 to 1995, Changwu 134 from 1996 to 2011, and Changhang 1 from 2012 to 2020. For grain yield determination, the plots were harvested by hand. During the fallow period of each year, all plots were tilled by hand hoeing to a depth of 30 cm and kept bare.
After 35-year fertilization treatments, soil organic matter content, total N and P contents and field capacity significantly increased in NP, M, and NPM treatments, while soil bulk density increased in NP treatment and decreased in M and NPM treatments (Table 1) [29,30].

2.3. Climate Data

Daily meteorological data were obtained from a weather station located at the experimental site. The monitored variables include precipitation, daily maximum temperature (Tmax), daily minimum temperature (Tmin), relative humidity (RH), wind speed, sunshine hours (SH), and radiation (after 1995). For this study, we calculated average Tmax, Tmin, RH, and SH for each growing season of winter wheat from 1985 to 2020; cumulative values of precipitation for each growing season (Pg), fallow period (Pf), and hydrological year from July to June the year after (Py) were also calculated.

2.4. De-Trending Method

Inter-annual yield variations in crop yield are largely driven by climate [7,31,32,33], but crop management improvements including updated varieties, fertilization, and biocide application have contributed to crop yield increases in previous decades [34,35]. To evaluate yield responses to inter-annual climate variations, the yield increase driven by technological improvement needs to be excluded. The first-difference method has been widely used to remove the impacts of non-climatic factors [7,36,37,38]. The first difference is defined as the yield difference between two successive years:
Δ Y i = Y i Y i 1 ,   i = 1 ,   2 , n
where ΔYi is the first difference of yield and Yi and Yi−1 are the yields in the ith and (i−1)th year, respectively. The same de-trending method was used for climate variables. The first difference of Tmax (ΔTmax), Tmin (ΔTmin), RH (ΔRH), SH (ΔSH), Pg (ΔPg), Pf (ΔPf), and Py (ΔPy) from 1985 to 2020 were calculated. Then ΔTmax, ΔTmin, ΔRH, ΔSH, ΔPg, ΔPf, and ΔPy were used to evaluate the impacts of inter-annual climate variations on yield.

2.5. Statistical Analyses

Correlation analyses between ΔY and ΔTmax, ΔTmin, ΔRH, ΔSH, ΔPg, ΔPf, and ΔPy were performed using Pearson’s method and stepwise regression analysis was carried out to evaluate all climate variables for their potential contributions to yield variation and exclude the variables not statistically significant in a multiple regression model (p < 0.05). Significant differences between means of treatments were determined by paired t-tests. Multiple comparisons were tested by Duncan’s method at the p < 0.05 level. All statistical analyses were conducted using SPSS 26.0 [39].

3. Results

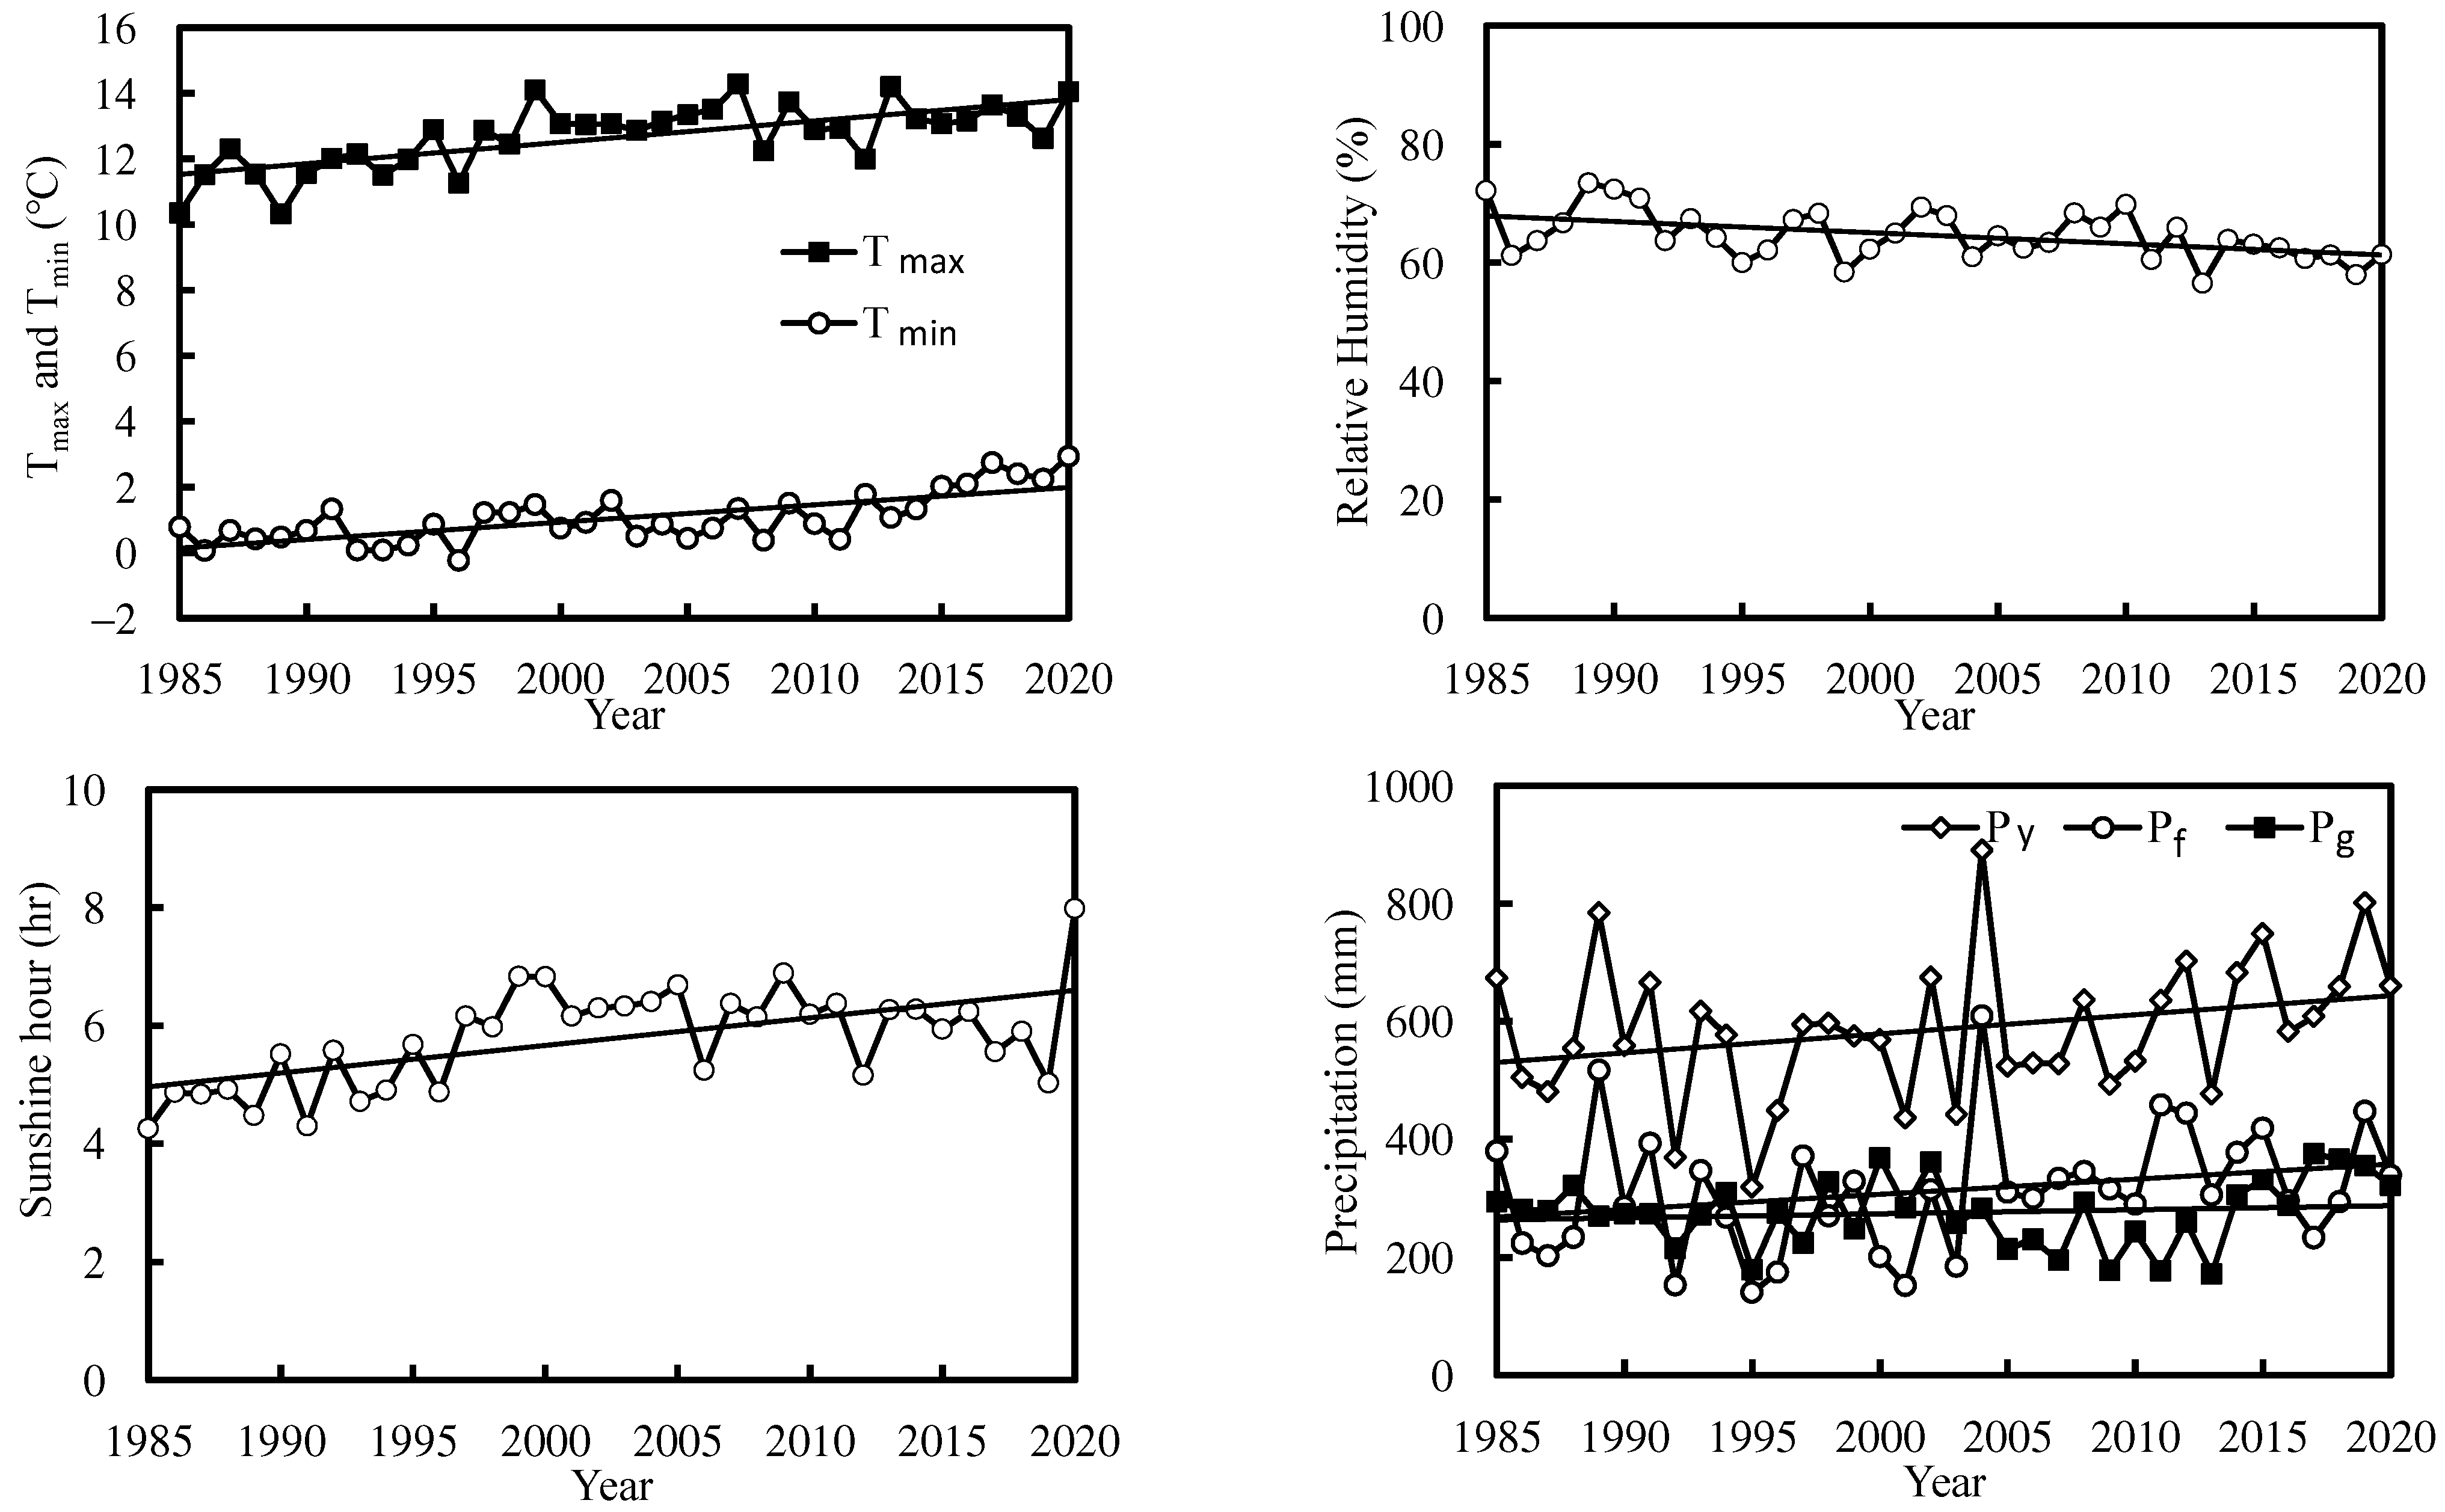
3.1. Climate Variables during the Study Period from 1985 to 2020

The inter-annual variations and long-term trends of Tmax, Tmin, RH, SH, Pg, Pf, and Py from 1985 to 2020 are shown in Figure 1. Tmax varied from 10.3 to 14.3 °C with a mean of 12.7 °C and presented a significant upward trend of 0.065 °C a−1 (Table 2). The variation in Tmin was from −0.2 °C in 1996 to 2.9 °C in 2020, with a mean of 1.1 °C. Annual change in Tmin was 0.053 °C a−1, with a significantly increasing trend. Different from Tmax and Tmin, RH showed a significant downward trend with a slope of −0.189% per year. SH varied from 4.3 h in 1985 to 8.0 h in 2020 with a mean of 5.8 h and a significant increasing trend of 0.047 h a−1. The variations in Pg, Pf, and Py were 171.7–373.8, 140.2–608.8, and 318.4–890.5 mm with fluctuation ranges of 203.1, 468.6, and 572.1 mm, respectively. These large variations indicate precipitation in the study area is unstable and the frequency of severe dry years is about 20%. The annual changes in Pg, Pf, and Py were 0.683, 2.564, and 3.247 mm a−1, respectively, but the increasing trends were not significant (Table 2).

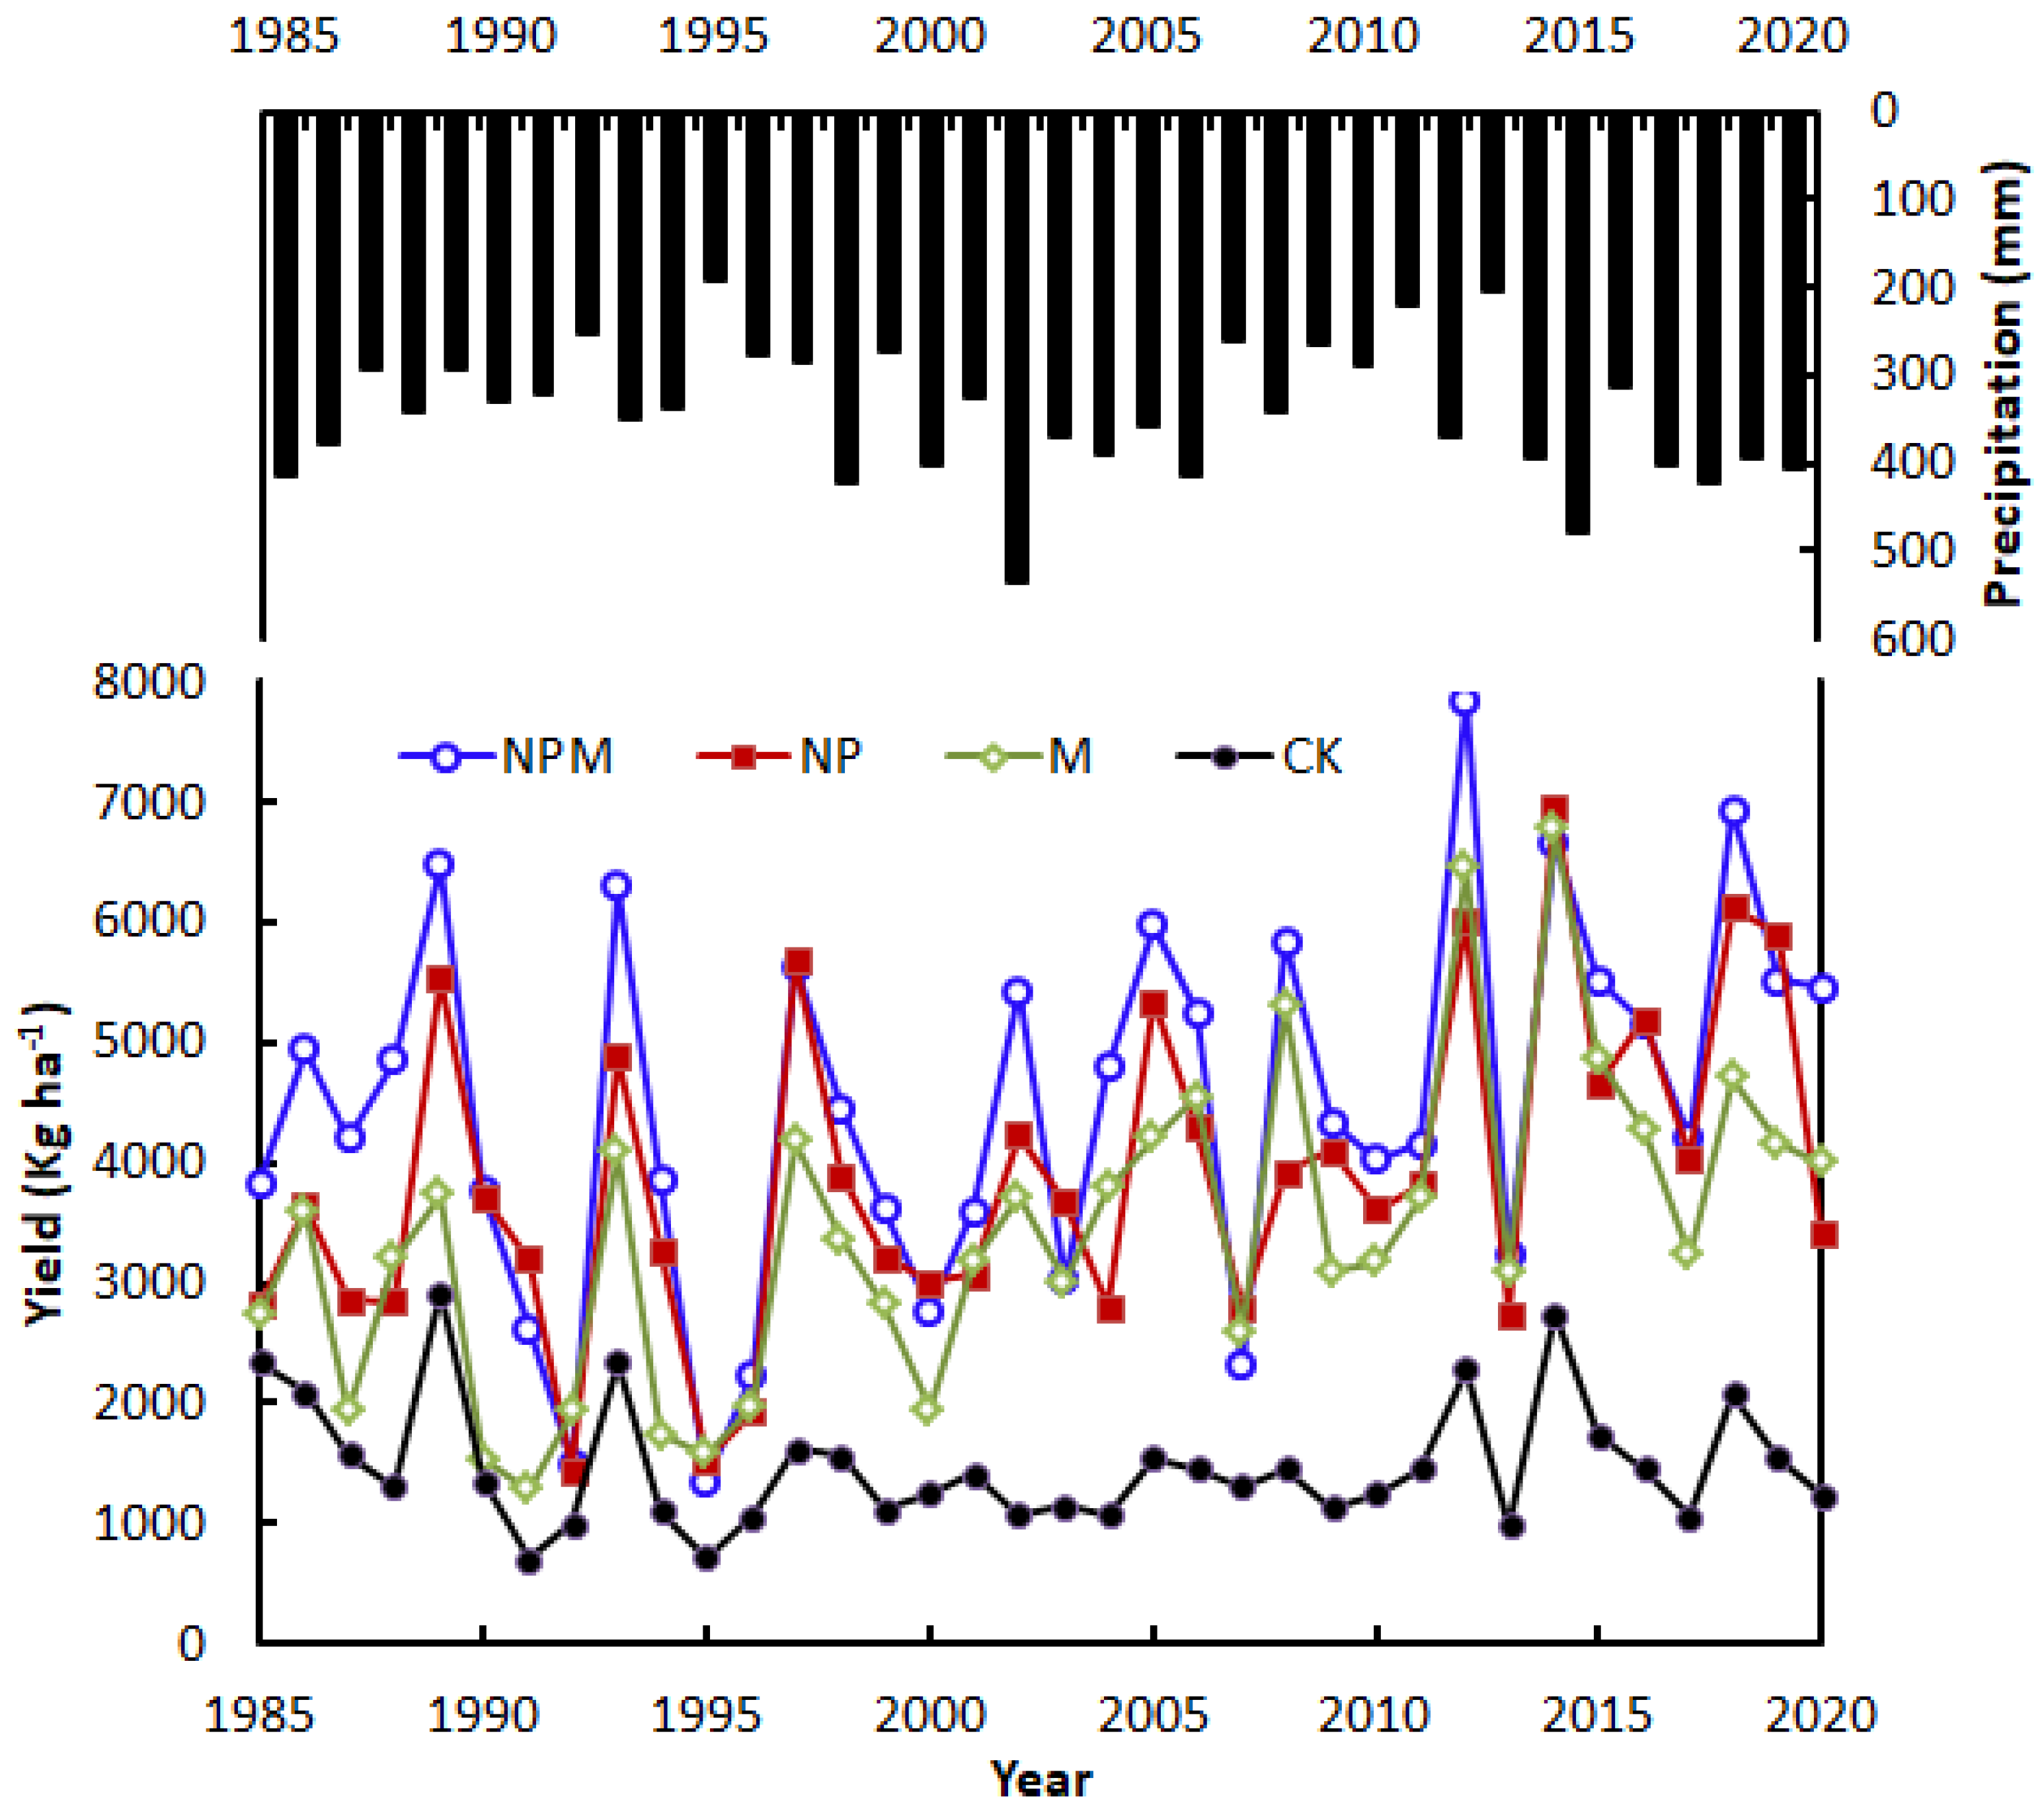
3.2. Wheat Yields under Different Fertilization Treatments

Variations in wheat yield under different fertilization treatments from 1985 to 2020 are shown in Figure 2, with associated statistical parameters given in Table 3. Compared to CK, yield increased with the level of fertilization (i.e., M < NP < NPM) and the means of all treatments during the study period were significantly different from one another (Table 3). On average, NPM, NP, and M increased wheat yield by 201.9, 161.7, and 130.6%, respectively, compared to CK. During the study period, the slope of yield versus time for the CK treatment was not significantly different from zero, while wheat yields for the NPM, NP, and M treatments had significantly increasing trends. The average increase rate was 56.5, 70.8, and 50.7 kg·ha−1·a−1 for NPM, NP, and M, respectively. Among the three fertilization treatments, M treatment had the largest potential to increase yield and the differences in yield between M vs. NPM and M vs. NP generally decreased during the latter years of the study period.
Values of standard deviation (STD) for the NPM, NP, and M treatments also increased compared to CK by an average of 191.2, 149.3, and 144.2%, respectively. The increase in the STD of yield with the level of fertilization indicates that the response of wheat yield to inter-annual climate variations is more sensitive for high-fertilization treatments. In dry years, high yield could not be achieved with high fertilization, whereas in wet years, the higher fertilization treatments produced greater yield. For example, in the drier growing seasons of 1992, 1995, 1996, 2007, and 2013, very small differences in yield were observed across the three fertilization treatments. However, larger differences were observed for the wetter growing seasons of 1989, 1993, 2012, 2014, and 2018 (Figure 2).

3.3. Relationship between Wheat Yield and Climate Variables

Correlations between year-to-year changes in wheat yield (ΔY) and climate variables (ΔTmax, ΔTmin, ΔRH, ΔSH, ΔPg, ΔPf, and ΔPy) under different fertilization treatments are shown in Table 4. ΔY under all treatments is positively correlated with ΔRH, ΔPf, and ΔPy and negatively correlated with ΔTmax. For the NPM treatment, ΔY is also positively correlated with ΔPg. This indicates high temperature and low rainfall are not conducive to good wheat yields. The climate variables that significantly affect wheat yields are roughly the same for the four fertilization treatments, but to varying degrees. For the NPM treatment, ΔY is most correlated with ΔPy (r = 0.556); for the NP treatment, ΔY is most correlated with ΔRH (r = 0.533); and for the M and CK treatments, ΔY is most sensitive to ΔTmax (r = −0.523 and −0.542, respectively). Among the different climate variables, ΔPg is negatively correlated with both ΔTmax and ΔSH.
Table 5 shows the stepwise regression analyses for ΔY and the de-trended climate variables for each fertilization treatment. ΔY in the NPM treatment is primarily determined by ΔPy and ΔRH, which contribute to 45% of the variation. In the NP treatment, ΔPf and ΔRH cause 38% of the variation in wheat yield. In the M and CK treatments, ΔY has a significantly negative relation with ΔTmax, explaining 27 and 29% of the inter-annual yield variability, respectively. Therefore, the impact of inter-annual climate variations on wheat yield increases with the level of fertilization.

3.4. Effect of Long-Term Climate Trend on Yields under Different Fertilization Treatments

Table 6 shows the long-term trends from 1985 to 2020 in major climate variables and their effects on yield change for each fertilization treatment. The individual impact of each climatic variable on yield was calculated by multiplying the trend in that variable (Table 2) by the yield response computed in Table 5. In the study area, Tmax shows a significantly increasing trend of 0.07 °C a−1; RH significantly decreases by 0.19% a−1; Py and Pf increase by 3.25 and 2.56 mm a−1, respectively, but these increases are not significant. For the NPM and NP treatments, the RH trend has a negative impact on yield increase, while Py and Pf trends have positive impacts on yield increase. For the M and CK treatments, the Tmax trend has a negative impact on yield change. The long-term trends in major climate variables RH and Py result in yield decreases of 14.8 ± 16.8 kg ha−1 a−1 for the NPM treatment and 25.5 ± 14.2 kg ha−1 a−1 for the NP treatment. For the M and CK treatments, the long-term trend in Tmax decreased yield by 55.5 ± 15.8 and 26.3 ± 7.1 kg ha−1 a−1, respectively (Table 6). The long-term trend in climate change has a negative impact on yield and results in decreases of 0.3, 0.7, 1.6, and 1.8% for the NPM, NP, M, and CK treatments, respectively. The impact of the long-term trend in climate decreases with increasing levels of fertilization.

4. Discussion

4.1. Wheat Yields under Different Fertilization Treatments

Fertilization is an important agronomic measure to increase crop yields [40,41,42,43]. In our study, NPM, NP, and M treatments, respectively, increased wheat yields by 201.9, 161.7, and 130.6% compared to the CK treatment during the study period (1985–2020). Because the initial soil N and P contents and organic carbon (SOC) were low (Table 1), soil nutrients and SOC were gradually consumed in large quantities during the long-term growth of crops. Additional artificial fertilization can compensate for the deficiency in soil nutrients and SOC, thereby affecting the growth and development of crops and frequently increasing crop yield. Chemical fertilizer can provide quick-acting nutrients to rapidly promote crop growth, while manure not only directly increases soil carbon but also indirectly increases long-term SOC due to the decomposition of crop residues and litter, which can broadly regulate soil nutrients and the soil micro-environment [44], thereby positively affecting crop yield. Compared to the sole application of chemical fertilizer or manure, the combination of chemical fertilizer and manure allows available soil nitrogen, which is the most critical nutrient affecting wheat yield [45], to accumulate and, thus, sustainably increase crop yield [46]. In addition to increasing soil nutrient availability, the combination of chemical fertilizer and manure also alleviates soil acidification, increasing the soil pH to provide a favorable environment for wheat growth, which, in turn, improves wheat yield [47]. This rationale explains why the yield increase under the NPM treatment in the present experiment was the largest.
Chemical fertilizer and manure both increase cumulative soil carbon and nitrogen pools with an increasing number of fertilization years [48]. Although the yield under the M treatment did not significantly increase in the early stages of fertilization, it rapidly increased in later years and the gap between the yields of the M treatment and the NP and NPM treatments gradually narrowed; this indicates the effect of manure on wheat yields reflects hysteresis. Lin et al. (2009) [49] showed that yields with chemical fertilizer are higher in the early stages of long-term fertilization than those with long-term manure application; however, the yield with manure reached or exceeded the yield with chemical fertilizer in the later stage of their experiment. This is because the nutrients provided by chemical fertilizer can almost immediately be absorbed and utilized by crops, while manure first requires mineralization and decomposition by microorganisms and biological enzymes to release nutrients. Although only a small portion of the nutrients provided by manure can be directly utilized by crops and most of the nutrients are released slowly [50], manure is more effective than chemical fertilizer in improving soil fertility [51]. This rationale explains why, for the M treatment, the yield increase gradually rose and average rate of increase was the highest overall.
All of the fertilization treatments increased wheat yield variability. Compared to the CK treatment, the NPM, NP, and M treatments increased the STD by an average of 191.2, 149.3, and 144.2%, respectively. In the rain-fed conditions, precipitation was the only source of water for crop growth. The increase in wheat yield promoted by fertilization always requires the consumption of more water, which is provided by soil water storage at planting [28]. High rates of fertilization will increase rooting depth [18,19] and make more water available for crop use. However, this increased rooting depth can only be effective in mitigating mild water stresses when replenishment of soil water during the non-growing season is sufficient. Under conditions of low soil water levels, increased rooting depth cannot completely compensate for increased transpiration demand. Therefore, high yields could not be obtained in the dry years of 1992, 1995, 1996, 2007, and 2013 for fertilized treatments (Figure 2). Similar results were observed by Frederick and Camberato (1994) [52], who note a decrease in economic return during dry years for treatments with high fertilization. This rationale explains why wheat yield variability in our study increased with the level of fertilization.

4.2. Climate Variables and Their Relationships with Yield Variations under Different Fertilization Treatments

Inter-annual variability in crop yields is well known to depend on climate variables [7,31]. Our results show ΔY for each treatment is positively correlated with ΔRH, ΔPf, and ΔPy, negatively correlated with ΔTmax, and not significantly correlated with ΔTmin or ΔSH (Table 4). The correlations of ΔY with ΔPy and ΔTmax are consistent with previous studies conducted with wheat in Australia [7,53] and the correlation between ΔY and ΔRH is consistent with a previous study by Homayoun et al. (2021) [54] for winter wheat in Iran. Lobell et al. (2005) [11] showed that ΔTmin is a major factor contributing to wheat yield increase, with a negative effect on wheat yield variations for irrigated systems in Mexico, while Wang et al. (2015) [7] showed that ΔTmin is a positive factor on wheat yield variations in rain-fed environments in Australia. However, in our study, ΔY is not significantly correlated with ΔTmin for any of the treatments. In the study area, non-growing season rainfall accounted for 70% of the annual precipitation and can contribute to stored soil water at the end of summer that can be used by winter wheat. Non-growing season rainfall plays an important role in winter wheat yield variation. Wang et al. (2015) [55] studied the contribution of non-growing season rainfall to winter wheat water and nitrogen use efficiencies and showed 51.8–67.4% of water consumption by winter wheat in dry growing seasons is provided by pre-growth season rainfall. This rationale explains why ΔY for each treatment is significantly correlated with ΔPf. With the exception of the NPM treatment, ΔY is not significantly correlated with ΔPg; this is attributed to growing season precipitation not following any trend during the study period.
Notably, the impacts of ΔTmax, ΔRH, ΔPg, ΔPf, and ΔPy on yield variation are interactive [7,11,53]. For example, in our study, ΔRH has a positive effect on ΔY due to a strong positive correlation between ΔRH and ΔPg (Table 4). Here, we assume ΔRH effects on ΔY can be attributed to Pg variation, suggesting an indirect impact of growing season precipitation on yield variation. In addition, ΔRH is strongly negatively correlated with ΔTmax (Table 4) and might be a proxy for the effect of Tmax on yield variation. The different fertilization treatments significantly impacted winter wheat yields (Table 3) and frequently resulted in different levels of water use (Pf and Pg) [28,55], which ultimately affected the stepwise regression equations between ΔY and climate variables (Table 5); climate variables ΔRH and ΔPy are employed in the NPM equation, ΔRH and ΔPf in the NP equation, and only ΔTmax in the M and CK equations. However, this does not mean ΔTmax had no significant impact on ΔY for the NPM and NP treatments and precipitation had no significant impact on ΔY for the M and CK treatments. For the NPM and NP treatments, ΔTmax was not identified as a significant factor affecting ΔY, probably because its impact was largely accounted for by ΔRH due to the correlation between the two variables (Table 4). For the M and CK treatments, ΔPg, ΔPf, and ΔPy were not identified as significant factors affecting ΔY, probably because the impact of precipitation was largely accounted for by ΔTmax due to the correlation between ΔTmax and ΔPy. In addition, less stored soil water would have been consumed less by crops with M and CK treatments than that with NPM and NP treatments, so the soil water storage at harvest would have been greater for the M and CK treatments than for NPM and NP treatments [28], resulting in their yields being less dependent on precipitation variables (Table 4). Overall, the responses of the M and CK treatments to inter-annual climate variations were around one-third lower than for the NPM and NP treatments. This indicates the influence of inter-annual climate variations on winter wheat yield increases with increasing levels of fertilization.

4.3. Effect of Long-Term Climate Trend on Yields under Different Fertilization Treatments

The impact of climate trends on crop yields is profound and non-negligible. Wang et al. (2015) [7] found climatic trends increased wheat yield by 8.5 to 21.2% in four different climatic regions of New South Wales, Australia, over the last 78 years. However, Licker et al. (2013) [6] analyzed the climatic impacts on winter wheat yields in Picardy, France, and Rostov, Russia, from 1973 to 2010 and found climatic trends caused an 11% decrease in winter wheat yield in Picardy but had no significant impact in Rostov. Therefore, the impact of climate trends on winter wheat yields appears to vary with climatic zone [6,11,33]. In this study, the long-term climate trends had a negative impact on wheat yield under all four treatments. For the NPM and NP treatments, Py and Pf trends were not significant but their slight increasing trends still had a positive effect on yields; in contrast, the markedly decreasing trend in RH reduced yields. Homayoun et al. (2021) [54] also demonstrated a positive relationship between wheat yield and humidity trend under rain-fed conditions. For the M and CK treatments, the significant upward trend in Tmax reduced yields. You et al. (2009) [56] found a 1% increase in growing season temperature reduced wheat yield by about 0.5%. Although long-term climate trends in the study area negatively impacted wheat yield for each treatment, the magnitude of the impact was low. The climate trend only resulted in yield decreases of 0.3, 0.7, 1.6, and 1.8% for the NPM, NP, M, and CK treatments, respectively.
The impact of long-term climate trends on winter wheat yields decreased with increasing levels of fertilization. Fertilization could improve crop response to long-term climate change to a certain extent and decrease the sensitivity of crop production to climate change. A study by Chen et al. (2018) [12] shows inorganic and organic fertilizers can both reduce the influence of climate change on crop yield compared to no fertilizer treatment; they attributed this effect to improved soil fertility. Poor soil fertility brought about poor environmental services, which compounded the negative impacts of climate change. In addition, the warming trend resulted in soil carbon loss and soil organic matter decay [57], which were improved by fertilization. In the present study, the response to climate trends was greater for the M treatment than for the other fertilization treatments. This dependence might be attributed to the influence of temperature on soil nutrient release from organic amendments [58] and the unfavorable effects would be mitigated by chemical fertilizer addition.
However, our study did not take into account adaptation measures that may occur under long-term climate change, suggesting that our approach only estimated the actual impact of climate trend on wheat yield under different fertilization treatments. The interactions of different climate variables and their impacts on wheat yield were not considered in our approaches. In addition, the climate change was divided into inter-annual climate variations and long-term climate trend and the comprehensive impact of climate change on wheat yield for each treatment was not given in this study. In future research, the interaction of climate variables and the comprehensive impact of climate change on wheat yield need to be studied.

5. Conclusions

A 35-year in situ experiment of winter wheat was conducted on the Loess Plateau of China to investigate the responses of wheat yield under different fertilization treatments to climate inter-annual variability and long-term trends. The following conclusions can be drawn from the study results:
(1)
Fertilization treatments increased wheat yield and yield variability. Compared to the CK treatment, NPM, NP, and M treatments increased wheat yield by an average of 201.9, 161.7, and 130.6%, respectively, and increased the STD by an average of 191.2, 149.3, and 144.2% during the study period (1985–2020), respectively.
(2)
Tmax, Tmin, RH, and SH showed significant trends in the study area, but precipitation did not. Wheat yields in all treatments were positively correlated with RH, Pf, and Py and negatively correlated with Tmax (p < 0.05 for all). For the NPM treatment, yield was also positively correlated with Pg (p < 0.05).
(3)
Climate inter-annual fluctuations explained 45, 38, 27, and 29% of the yield variation for the NPM, NP, M, and CK treatments, respectively, which shows the impact of inter-annual climate variations on wheat yield increases with level of fertilization.
(4)
The 35-year climatic trends contributed to wheat yield decreases of 0.3, 0.7, 1.6, and 1.8% for the NPM, NP, M, and CK treatments, respectively, which indicate fertilization decreases the sensitivity of wheat yield to climate trend changes.

Author Contributions

Conceptualization, M.H. and T.D.; methodology, M.H., R.Z. and Y.Y.; validation, R.Z. and M.H.; formal analysis, R.Z. and Y.Y.; investigation, R.Z. and Y.Y.; resources, Y.Z.; data curation, T.D. and Y.Z.; writing—original draft preparation, R.Z.; writing—review and editing, M.H.; visualization, R.Z.; supervision, M.H.; project administration, M.H.; funding acquisition, M.H. All authors have read and agreed to the published version of the manuscript.

Funding

This research was financially supported by the Strategic Priority Research Program of the Chinese Academy of Sciences (No. XDB40020202).

Institutional Review Board Statement

Not applicable.

Informed Consent Statement

Not applicable.

Data Availability Statement

The data presented in this study are available in Data Centre of the Changwu Agri-Ecological Experimental Station at http://cwa.cern.ac.cn/meta/metaData (permission required).

Acknowledgments

This research was financially supported by the Strategic Priority Research Program of the Chinese Academy of Sciences (No. XDB40020202). The authors thank the members of the Changwu Agri-Ecological Experimental Station, Chinese Academy of Sciences, for their assistance.

Conflicts of Interest

The authors declare that they have no conflict of interest.

References

  1. Long, S.P.; Ainsworth, E.A.; Leakey, A.D.B.; Nosberger, J.; Ort, D.R. Food for thought: Lower- than-expected crop yield stimulation with rising CO2 concentrations. Science 2006, 312, 1918–1921. [Google Scholar] [CrossRef]
  2. Schierhorn, F.; Faramarzi, M.; Prishchepov, A.V.; Koch, F.J.; Mueller, D. Quantifying yield gaps in wheat production in Russia. Environ. Res. Lett. 2014, 9, 084017. [Google Scholar] [CrossRef]
  3. Zhao, C.; Liu, B.; Piao, S.; Wang, X.; Lobell, D.B.; Huang, Y.; Huang, M.; Yao, Y.; Bassu, S.; Ciais, P.; et al. Temperature increase reduces global yields of major crops in four independent estimates. Proc. Natl. Acad. Sci. USA 2017, 114, 9326–9331. [Google Scholar] [CrossRef]
  4. Asseng, S.; Ewert, F.; Martre, P.; Roetter, R.P.; Lobell, D.B.; Cammarano, D.; Kimball, B.A.; Ottman, M.J.; Wall, G.W.; White, J.W.; et al. Rising temperatures reduce global wheat production. Nat. Clim. Chang. 2015, 5, 143–147. [Google Scholar] [CrossRef]
  5. Schlenker, W.; Roberts, M.J. Nonlinear temperature effects indicate severe damages to US crop yields under climate change. Proc. Natl. Acad. Sci. USA 2009, 106, 15594–15598. [Google Scholar] [CrossRef]
  6. Licker, R.; Kucharik, C.J.; Dore, T.; Lindeman, M.J.; Makowski, D. Climatic impacts on winter wheat yields in Picardy, France and Rostov, Russia: 1973–2010. Agric. For. Meteorol. 2013, 176, 25–37. [Google Scholar] [CrossRef]
  7. Wang, B.; Chen, C.; Liu, D.L.; Asseng, S.; Yu, Q.; Yang, X. Effects of climate trends and variability on wheat yield variability in eastern Australia. Clim. Res. 2015, 64, 173–186. [Google Scholar] [CrossRef]
  8. Miao, R.; Khanna, M.; Huang, H. Responsiveness of crop yield and acreage to prices and climate. Am. J. Agric. Econ. 2016, 98, 191–211. [Google Scholar] [CrossRef]
  9. Huzsvai, L.; Zsembeli, J.; Kovacs, E.; Juhasz, C. Response of winter wheat (Triticum aestivum L.) yield to the increasing weather fluctuations in a continental region of four-season climate. Agronomy 2022, 12, 314. [Google Scholar] [CrossRef]
  10. Hsiang, S. Climate econometrics. Ann. Rev. Resour. Econ. 2016, 8, 43–75. [Google Scholar] [CrossRef]
  11. Lobell, D.B.; Ortiz-Monasterio, J.I.; Asner, G.P.; Matson, P.A.; Naylor, R.L.; Falcon, W.P. Analysis of wheat yield and climatic trends in Mexico. Field Crops Res. 2005, 94, 250–256. [Google Scholar] [CrossRef]
  12. Chen, H.; Deng, A.; Zhang, W.; Li, W.; Qi, Y.; Yang, T.; Zheng, C.; Cao, C.; Chen, F. Long-term inorganic plus organic fertilization increases yield and yield stability of winter wheat. Crop J. 2018, 6, 589–599. [Google Scholar] [CrossRef]
  13. Liu, C.A.; Li, F.R.; Zhou, L.M.; Zhang, R.H.; Yu, J.; Lin, S.L.; Wang, L.J.; Siddique, K.H.M.; Li, F.M. Effect of organic manure and fertilizer on soil water and crop yields in newly-built terraces with loess soils in a semi-arid environment. Agric. Water Manag. 2013, 117, 123–132. [Google Scholar] [CrossRef]
  14. Antle, J.M.; Cho, S.; Tabatabaie, S.M.H.; Valdivia, R.O. Economic and environmental performance of dryland wheat-based farming systems in a 1.5 degrees C world. Mitig. Adapt. Strateg. Glob. Chang. 2019, 24, 165–180. [Google Scholar] [CrossRef]
  15. Zhang, X.; Dong, Z.; Wu, X.; Gan, Y.; Chen, X.; Xia, H.; Kamran, M.; Jia, Z.; Han, Q.; Shayakhmetova, A.; et al. Matching fertilization with water availability enhances maize productivity and water use efficiency in a semi-arid area: Mechanisms and solutions. Soil Till. Res. 2021, 214, 105164. [Google Scholar] [CrossRef]
  16. Bandyopadhyay, K.K.; Misra, A.K.; Ghosh, P.K.; Hati, K.M. Effect of integrated use of farmyard manure and chemical fertilizers on soil physical properties and productivity of soybean. Soil Till. Res. 2010, 110, 115–125. [Google Scholar] [CrossRef]
  17. Wang, J.; Liu, W.; Dang, T. Responses of soil water balance and precipitation storage efficiency to increased fertilizer application in winter wheat. Plant Soil 2011, 347, 41–51. [Google Scholar] [CrossRef]
  18. Read, D.W.L.; Warder, F.G.; Cameron, D.R. Factors affecting fertilizer response of wheat in southwestern Saskatchewan. Can. J. Soil Sci. 1982, 62, 577–586. [Google Scholar] [CrossRef]
  19. Nielsen, D.C.; Halvorson, A.D. Nitrogen fertility influence on water-stress and yield of winter-wheat. Agron. J. 1991, 83, 1065–1070. [Google Scholar] [CrossRef]
  20. Fan, T.; Stewart, B.A.; Yong, W.; Junjie, L.; Guangye, Z. Long-term fertilization effects on grain yield, water-use efficiency and soil fertility in the dryland of Loess Plateau in China. Agric. Ecosyst. Environ. 2004, 106, 313–329. [Google Scholar] [CrossRef]
  21. Huang, M.B.; Li, Y.S. On potential yield increase of dryland winter wheat on the loess tableland. J. Nat. Resour. 2000, 15, 143–148. [Google Scholar]
  22. Jin, K.; Cornelis, W.M.; Schiettecatte, W.; Lu, J.; Yao, Y.; Wu, H.; Gabriels, D.; De Neve, S.; Cai, D.; Jin, J.; et al. Effects of different management practices on the soil-water balance and crop yield for improved dryland farming in the Chinese Loess Plateau. Soil Till. Res. 2007, 96, 131–144. [Google Scholar] [CrossRef]
  23. Zhang, H.; Yu, X.; Jin, Z.; Zheng, W.; Zhai, B.; Li, Z. Improving grain yield and water use efficiency of winter wheat through a combination of manure and chemical nitrogen fertilizer on the Loess plateau, China. J. Soil Sci. Plant Nutr. 2017, 17, 461–474. [Google Scholar] [CrossRef]
  24. Wang, J.; Liu, W.Z.; Dang, T.H.; Sainju, U.M. Nitrogen fertilization effect on soil water and wheat yield in the Chinese Loess Plateau. Agron. J. 2013, 105, 143–149. [Google Scholar] [CrossRef]
  25. Liu, J.; LI, C.Y.; Xing, Y.W.; Wang, Y.; Xue, Y.L.; Wang, C.R.; Dang, T.H. Effects of long-term fertilization on soil organic phosphorus fractions and wheat yield in farmland of Loess Plateau. Chin. J. Appl. Ecol. 2020, 31, 157–164. [Google Scholar]
  26. Wang, X.; Qadir, M.; Rasul, F.; Yang, G.; Hu, Y. Response of soil water and wheat yield to rainfall and temperature change on the Loess Plateau, China. Agronomy 2018, 8, 101. [Google Scholar] [CrossRef]
  27. Liu, C.; Yang, H.; Gongadze, K.; Harris, P.; Huang, M.; Wu, L. Climate change impacts on crop yield of winter wheat (Triticum aestivum) and maize (Zea mays) and soil organic carbon stocks in Northern China. Agriculture 2022, 12, 614. [Google Scholar] [CrossRef]
  28. Huang, M.B.; Dang, T.H.; Gallichand, J.; Goulet, M. Effect of increased fertilizer applications to wheat crop on soil-water depletion in the Loess Plateau, China. Agric. Water Manag. 2003, 58, 267–278. [Google Scholar] [CrossRef]
  29. Dong, D.X.; Li, Y.S. Field Study On Yield Potentiality Of Winter Wheat And Effect Of Water And Fertilizer. Res. Soil Water Conserv. 1989, 6, 124–129. [Google Scholar]
  30. Li, C.Y.; Hao, Y.H.; Xue, Y.L.; Wang, Y.; Dang, T.H. Effects of long-term fertilization on soil microbial biomass carbon, nitrogen, and phosphorus in the farmland of the Loess Plateau, China. J. Agro-Environ. Sci. 2020, 39, 1783–1791. [Google Scholar]
  31. Chen, C.C.; McCarl, B.A.; Schimmelpfennig, D.E. Yield variability as influenced by climate: A statistical investigation. Clim. Chang. 2004, 66, 239–261. [Google Scholar] [CrossRef]
  32. Porter, J.R.; Semenov, M.A. Crop responses to climatic variation. Philos. Trans. R. Soc. B Biol. Sci. 2005, 360, 2021–2035. [Google Scholar] [CrossRef]
  33. Lobell, D.B.; Schlenker, W.; Costa-Roberts, J. Climate trends and global crop production since 1980. Science 2011, 333, 616–620. [Google Scholar] [CrossRef] [PubMed]
  34. Asseng, S.; Pannell, D.J. Adapting dryland agriculture to climate change: Farming implications and research and development needs in Western Australia. Clim. Chang. 2012, 118, 167–181. [Google Scholar] [CrossRef]
  35. Yu, Y.; Huang, Y.; Zhang, W. Changes in rice yields in China since 1980 associated with cultivar improvement, climate and crop management. Field Crops Res. 2012, 136, 65–75. [Google Scholar] [CrossRef]
  36. Nicholls, N. Increased Australian wheat yield due to recent climate trends. Nature 1997, 387, 484–485. [Google Scholar] [CrossRef]
  37. Lobell, D.B.; Asner, G.P. Climate and management contributions to recent trends in US agricultural yields. Science 2003, 299, 1032. [Google Scholar] [CrossRef] [PubMed]
  38. Zhang, T.; Zhu, J.; Wassmann, R. Responses of rice yields to recent climate change in China: An empirical assessment based on long-term observations at different spatial scales (1981–2005). Agric. For. Meteorol. 2010, 150, 1128–1137. [Google Scholar] [CrossRef]
  39. IBM Corp. IBM SPSS Statistics for Windows; Version 26.0; IBM Corp: Armonk, NY, USA, Released; 2019. [Google Scholar]
  40. Chen, D.; Yuan, L.; Liu, Y.; Ji, J.; Hou, H. Long-term application of manures plus chemical fertilizers sustained high rice yield and improved soil chemical and bacterial properties. Eur. J. Agron. 2017, 90, 34–42. [Google Scholar] [CrossRef]
  41. Liu, Q.; Xu, H.; Yi, H. Impact of fertilizer on crop yield and C:N:P stoichiometry in arid and semi-arid soil. Int. J. Environ. Res. Public Health 2021, 18, 4341. [Google Scholar] [CrossRef] [PubMed]
  42. Allam, M.; Radicetti, E.; Petroselli, V.; Mancinelli, R. Meta-analysis approach to assess the effects of soil tillage and fertilization source under different cropping systems. Agriculture 2021, 11, 823. [Google Scholar] [CrossRef]
  43. Atique-ur-Rehman; Qamar, R.; Altaf, M.M.; Alwahibi, M.S.; Al-Yahyai, R.; Hussain, M. Phosphorus and potassium application improves fodder yield and quality of sorghum in Aridisol under diverse climatic conditions. Agriculture 2022, 12, 593. [Google Scholar] [CrossRef]
  44. Kuzyakov, Y.; Blagodatskaya, E. Microbial hotspots and hot moments in soil: Concept & review. Soil Biol. Biochem. 2015, 83, 184–199. [Google Scholar]
  45. Chuan, L.; He, P.; Pampolino, M.F.; Johnston, A.M.; Jin, J.; Xu, X.; Zhao, S.; Qiu, S.; Zhou, W. Establishing a scientific basis for fertilizer recommendations for wheat in China: Yield response and agronomic efficiency. Field Crops Res. 2013, 140, 1–8. [Google Scholar] [CrossRef]
  46. Heinze, S.; Oltmanns, M.; Joergensen, R.G.; Raupp, J. Changes in microbial biomass indices after 10 years of farmyard manure and vegetal fertilizer application to a sandy soil under organic management. Plant Soil 2011, 343, 221–234. [Google Scholar] [CrossRef]
  47. Holland, J.E.; White, P.J.; Glendining, M.J.; Goulding, K.W.T.; McGrath, S.P. Yield responses of arable crops to liming—An evaluation of relationships between yields and soil pH from a long-term liming experiment. Eur. J. Agron. 2019, 105, 176–188. [Google Scholar] [CrossRef] [PubMed]
  48. Gai, X.P.; Liu, H.B.; Yang, B.; Wang, H.Y.; Zhai, L.M.; Lei, Q.L.; Wu, S.X.; Ren, T.Z. Responses of crop yields, soil carbon and nitrogen stocks to additional application of organic materials in different fertilization years. Sci. Agric. Sin. 2019, 52, 676–689. [Google Scholar]
  49. Lin, Z.; Zhao, B.Q.; Yuan, L.; Bing-So, H. Effects of organic manure andfertilizers long-term located application on soil fertility and crop yield. Sci. Agric. Sin. 2009, 42, 2809–2819. [Google Scholar]
  50. Li, Y.Q.; Wen, Y.C.; Lin, Z.; Zhao, B.Q. Effect of different manures combined with chemical fertilizer on yields of crops and gaseous N loss in farmland. J. Plant Nutr. Fertil. 2019, 25, 1835–1846. [Google Scholar]
  51. Cai, A.; Xu, M.; Wang, B.; Zhang, W.; Liang, G.; Hou, E.; Luo, Y. Manure acts as a better fertilizer for increasing crop yields than synthetic fertilizer does by improving soil fertility. Soil Till. Res. 2019, 189, 168–175. [Google Scholar] [CrossRef]
  52. Frederick, J.R.; Camberato, J.J. Leaf net CO2-exchange rate and associated leaf traits of winter-wheat grown with various spring nitrogen-fertilization rates. Crop Sci. 1994, 34, 432–439. [Google Scholar] [CrossRef]
  53. Yu, Q.; Li, L.; Luo, Q.; Eamus, D.; Xu, S.; Chen, C.; Wang, E.; Liu, J.; Nielsen, D.C. Year patterns of climate impact on wheat yields. Int. J. Climatol. 2013, 34, 518–528. [Google Scholar] [CrossRef]
  54. Faghih, H.; Behmanesh, J.; Rezaie, H.; Khalili, K. Climate and rainfed wheat yield. Theor. Appl. Climatol. 2021, 144, 13–24. [Google Scholar] [CrossRef]
  55. Wang, Q.; Chai, J.; Wang, X. Influence of rainfall in summer fallow period on water and nitrogen use efficiency of winter wheat on Loess plateau. Trans. Chin. Soc. Agric. Eng. 2015, 31, 82–88. [Google Scholar]
  56. You, L.; Rosegrant, M.W.; Wood, S.; Sun, D. Impact of growing season temperature on wheat productivity in China. Agric. For. Meteorol. 2009, 149, 1009–1014. [Google Scholar] [CrossRef]
  57. Melillo, J.M.; Frey, S.D.; DeAngelis, K.M.; Werner, W.J.; Bernard, M.J.; Bowles, F.P.; Pold, G.; Knorr, M.A.; Grandy, A.S. Long-term pattern and magnitude of soil carbon feedback to the climate system in a warming world. Science 2017, 358, 101–104. [Google Scholar] [CrossRef] [PubMed]
  58. Ellert, B.H.; Bettany, J.R. Temperature-dependence of net nitrogen and sulfur mineralization. Soil Sci. Soc. Am. J. 1992, 56, 1133–1141. [Google Scholar] [CrossRef]
Figure 1. Variations in average maximum and minimum temperatures (Tmax and Tmin), relative humidity (RH), sunshine hours (SH), and precipitation (Pg) during the growing season, precipitation during the fallow period (Pf), and total precipitation in hydrological year (Py) from July to June the year after from 1985 to 2020.
Agriculture 12 01498 g001
Figure 2. Variation in precipitation during the growing season and winter wheat yield under different fertilization treatments from 1985 to 2020.
Agriculture 12 01498 g002
Table 1. Changes in soil properties under different fertilization treatments before and after the long-term experiment.
Soil Organic Matter (g kg−1)Soil Total N
(g kg−1)
Soil Total P
(g kg−1)
Bulk Density (g cm−3)Field Capacity (cm−3 cm−3)
0–20 cm0–40 cm
Before experiment 10.40.80.661.350.281
Experiment conducted for 35 aNP14.480.910.951.370.310
M17.461.190.871.340.312
NPM19.271.241.011.330.356
Table 2. Estimated regression parameters of Tmax, Tmin, RH, SH, Pg, Pf, and Py vs. time (Tmax, the maximum temperature; Tmin, the minimum temperature; RH, relative humidity; SH, sunshine hours; Pg, precipitation during the growing season; Pf, precipitation during the fallow period; and Py, total precipitation in hydrological year from July to June the year after).
Climate VariableSlopeStandard ErrorT ValueR2p Value
Tmax (°C)0.0650.0125.660.485<0.0001
Tmin (°C)0.0530.0095.870.504<0.0001
RH (%)−0.1890.061−3.130.224<0.0036
SH (h)0.0470.0114.210.3430.0002
Pg (mm)0.6830.9190.740.0160.463
Pf (mm)2.5641.6521.550.0660.1299
Py (mm)3.2471.8691.740.0820.0914
Table 3. Statistical parameters of winter wheat yield under different fertilization treatments.
TreatmentsMean (kg ha−1)Maximum (kg ha−1)Minimum (kg ha−1)STD (kg ha−1)Slope of Yield vs. Time (kg ha−1 a−1)
NPM4494.9 d7849.01350.01533.750.7 *
NP3895.3 c6971.32345.51312.656.5 *
M3432.4 b6771.31280.01285.870.2 *
CK1488.7 a2916.2710.0526.6−2.5
(1) Different letters within a column indicate significant differences at p < 0.05; (2) STD, standard deviation; (3) * slope of yield vs. time was significant at p < 0.05.
Table 4. Pearson correlation matrix of ΔY and climate variables ΔTmax, ΔTmin, ΔRH, ΔSH, ΔPg, ΔPf, and ΔPy under different fertilization treatments (* p < 0.05; ** p < 0.01) (*ΔTmax, ΔTmin, ΔRH, ΔPg, and ΔSH are the first difference in average maximum temperature, average minimum temperature, relative humidity, precipitation, and sunshine hours during the growing season. ΔPf and ΔPy are the first difference in precipitation during the fallow period and hydrological year from July to June the year after).
TreatmentΔY (kg ha−1)ΔTmax (°C)ΔTmin (°C)ΔRH (%)ΔSH (h)ΔPg (mm)ΔPf (mm)ΔPy (mm)
ΔY
(kg ha−1)
NPM1−0.494 **0.1000.519 **−0.2580.400 *0.464 **0.556 **
NP1−0.407 *0.0890.533 **−0.2650.2050.368 *0.396 *
M1−0.523 **−0.0340.427 *−0.2440.3200.342 *0.420 *
CK1−0.542 **−0.0860.511 **−0.2320.1920.347 *0.372 *
ΔTmax (°C)-10.389 *−0.543 **0.629 **−0.612 **−0.235−0.447 **
ΔTmin (°C)--10.2240.051−0.0570.2990.231
ΔRH (%)---1−0.2260.461 **0.1230.291
ΔSH (h)----1−0.445 **−0.298−0.434 **
ΔPg (mm)-----10.1660.546 **
ΔPf (mm)------10.917 **
ΔPy (mm)-------1
Table 5. Results of stepwise regression analysis between ΔY (kg ha−1 a−1) and climate variables of ΔTmax, ΔTmin, ΔRH, ΔSH, ΔPg, ΔPf, and ΔPy for different fertilization treatments. (ΔTmax, ΔTmin, ΔRH, ΔPg, and ΔSH are the first difference in average maximum temperature, average minimum temperature, relative humidity, precipitation, and sunshine hours during the growing season. ΔPf and ΔPy are the first difference in precipitation during the fallow period and hydrological year from July to June the year after).
TreatmentStepwise Regression EquationR2p Value
NPMΔY = 101.23 + 171.08ΔRH + 5.40ΔPy0.449<0.0001
NPΔY = 78.17 + 182.93ΔRH + 3.72ΔPf0.3770.0005
MΔY = 126.75 − 854.30ΔTmax0.2740.0013
CKΔY = 11.24 − 404.73ΔTmax0.2940.0008
Table 6. Observed trends in growing season climatic conditions and their estimated impact on yield (1985–2020) (ΔTmax and ΔRH are the first differences in average maximum temperature and relative humidity during the growing season. ΔPf, and ΔPy are the first differences in precipitation during the fallow period and hydrological year from July to June the year after. The relative impact is equal to the sum of estimated yield impact divided into the mean in Table 3).
ΔTmax ΔRH ΔPy ΔPfSum
(kg ha−1 a−1)
Relative Impact (%)
Climate Trend0.07 (°C a−1)−0.19 (% a−1)3.25
(mm a−1)
2.56
(mm a−1)
Estimated yield impact (kg ha−1 a−1)NPM-−32.3 ± 11.317.6 ± 5.4-−14.8 ± 16.8−0.3
NP-−34.6 ± 9.8-9.5 ± 4.4−25.5 ± 14.2−0.7
M−55.5 ± 15.8---−55.5 ± 15.8−1.6
CK−26.3 ± 7.1---−26.3 ± 7.1−1.8
Publisher’s Note: MDPI stays neutral with regard to jurisdictional claims in published maps and institutional affiliations.

