Article

Weed Identification in Soybean Seedling Stage Based on Optimized Faster R-CNN Algorithm

1
College of Information Technology, Jilin Agricultural University, Changchun 130118, China
2
Northeast Institute of Geography and Agroecology, Chinese Academy of Sciences, Changchun 130102, China
*
Author to whom correspondence should be addressed.
Agriculture 2023, 13(1), 175; https://doi.org/10.3390/agriculture13010175
Submission received: 21 November 2022 / Revised: 30 December 2022 / Accepted: 9 January 2023 / Published: 10 January 2023
(This article belongs to the Section Crop Protection, Diseases, Pests and Weeds)

Abstract

:
Soybean in the field has a wide range of intermixed weed species and a complex distribution status, and the weed identification rate of traditional methods is low. Therefore, a weed identification method is proposed based on the optimized Faster R-CNN algorithm for the soybean seedling. Three types of weed datasets, including soybean, with a total of 9816 photos were constructed, and cell phone photo data were used for training and recognition. Firstly, by comparing the classification effects of ResNet50, VGG16, and VGG19, VGG19 was identified as the best backbone feature extraction network for model training. Secondly, an attention mechanism was embedded after the pooling layer in the second half of VGG19 to form the VGG19-CBAM structure, which solved the problem of low attention to the attention target during model training using the trained Faster R-CNN algorithm to identify soybean and weeds in the field under the natural environment and compared with two classical target detection algorithms, SSD and Yolov4. The experimental results show that the Faster R-CNN algorithm using VGG19-CBAM as the backbone feature extraction network can effectively identify soybeans and weeds in complex backgrounds. The average recognition speed for a single image is 336 ms, and the average recognition accuracy is 99.16%, which is 5.61% higher than before optimization, 2.24% higher than the SSD algorithm, and 1.24% higher than the Yolov4 algorithm. Therefore, this paper’s optimized target detection model is advantageous and can provide a scientific method for accurate identification and monitoring of grass damage.

1. Introduction

Soybean is an important oilseed crop species in the national food security system, and it plays an essential role in the food structure of the Chinese population [1]. Natural soybean growth in the field is complex, and weeds usually accompany soybean throughout its growth and development cycle and are tenacious. These weeds compete with soybeans for sunlight, water, inorganic salts, and space to survive, affecting the quality and yield of soybeans and hindering their growth and development. To increase soybean production and improve economic efficiency, it is imperative to identify and promptly treat weeds using preventative methods. Traditional manual weeding methods are time-consuming and inefficient, and improper use of herbicides can also directly contaminate the soil and growing environment. Efficient detection and identification methods for soybeans and weeds are necessary to achieve accurate weed identification and monitoring.
There is a wide range of methods in the field of weed detection, such as spectral recognition [2] and machine learning recognition [3]. However, the equipment required for spectral recognition methods is expensive, and the operation process is too cumbersome for widespread dissemination and application. Nahina et al. [4] analyzed the performance of several machine learning algorithms, such as random forest, support vector machine, and K-nearest neighbor in weed detection in Australian pepper fields. Although machine learning methods can crop identify and weed, problems such as unstable environmental factors can lead to low accuracy. The high accuracy of weed identification and localization using deep learning methods is currently a prerequisite to guaranteeing efficient weed eradication and management. Traditional target detection methods have used sliding windows to search the entire image to extract texture, scale, and spatial transformation features, which is inefficient due to a large number of useless borders and is time-consuming [5]. This approach has a significant drawback—not only does it result in a large number of useless borders, leading to inefficiency, but it is also too time-consuming. Weed growth is complex in natural conditions, and the variety of external influences can seriously affect the performance of traditional target detection methods. Moreover, deep learning methods can use the universal deep-level features of image data as well as perform intensive data image processing tasks to work under natural environmental conditions. Among the many deep learning algorithms, convolutional neural networks (CNNs) perform remarkably well in the field of plant classification detection [6,7,8,9,10,11,12,13] and can achieve accurate recognition of target objects [14,15,16,17,18]. CNNs can be used as a method to identify target objects accurately, such as in plant classification, and recent innovations have effectively improved their recognition accuracy [19,20]. Hamid, Y. et al. [21] describe that seed classification is performed using MobileNetV2 and deep learning convolutional neural networks (DCNNs). A total of 14 different classes of seeds were used in the experiments. The results show that the accuracy of both training and test sets is above 95%. Albarrak, K. et al. [22] proposed an efficient data classification model by creating eight different classes of date fruit datasets to train the proposed model, using preprocessing techniques such as image enhancement, decay learning rate, model checkpoints, and hybrid weight adjustment to improve the accuracy. The results show an accuracy of 99% based on the MobileNetV2 architecture.
Currently, target detection algorithms based on deep learning methods are mainly divided into two categories: single-stage target detection methods and two-stage target detection methods. At present, commonly used one-stage target detection algorithms mainly include Yolov2 [23], Yolov3 [24], Yolov4 [25], and SSD [26], and two-stage target detection algorithms include R-FCN [27], Fast R-CNN [28], and Faster R-CNN [29]. Generally, two-stage target detection methods have higher recognition accuracy. Compared with one-stage algorithms, two-stage algorithms are more complex and slower but have a low recognition miss rate, high accuracy, and high real-time performance. The target detection algorithm Faster R-CNN can be trained end-to-end to significantly improve its all-around performance, and it has good detection speed results and low miss and false detection rates for localization recognition of small targets. With the development of deep learning, the accuracy of VGG [30], ResNet [31], and other network structures has improved, but this process decreases the detection speed of the model. The seedling stage is the most critical stage in the entire growth and development cycle of soybean, as both soybean and weeds are in urgent need of nutrients from the soil during the seedling stage, and the impact of their presence is relatively small. At the mature stage, weeds can take too many soil resources from soybean, so the impact of weeds should be eradicated at the seedling stage. Zhanghui et al. [32] proposed a weed identification model incorporating multi-scale detection and attention mechanism that has a high reference value for solving the problem of rapid and accurate identification of weeds in peanut fields. However, weed identification and detection methods generally have simple crop backgrounds with a single weed species. Lifangfu et al. [33] proposed a field weed identification algorithm based on the VGG model that has some support for actual field weed identification. However, there is less research on the complex growth states of crops accompanied by multiple weeds. The similarity of weed and crop shapes and colors also affects accuracy, leading to problems that cannot be solved within acceptable timeframes. The above studies show that although deep learning can solve the problem of image processing, there are still the following problems: (1) Although the network model is adopted for weed detection to improve the identification accuracy and recognition effect, the identification of a single category cannot meet the current agricultural situation. (2) Improve the recognition speed of the model network through clipping, make the model insensitive to target information, and reduce its recognition accuracy.
Based on the discussion above, to solve the problem of identifying weeds in the soybean seedling stage under natural conditions and apply the target detection algorithm to field crops, this paper takes the soybean seedling stage in the field as the research object and performs data enhancement by various methods on the acquired data. The feature extraction network with the best detection effect is selected, a focused attention module is added, and the training process of the network is optimized. Finally, a weed detection and identification method based on the optimized Faster R-CNN algorithm is proposed for the detection and identification of weeds in soybean seedlings in the field, which can provide a scientific method for monitoring and eradicating weeds.

2. Materials and Methods

2.1. Materials

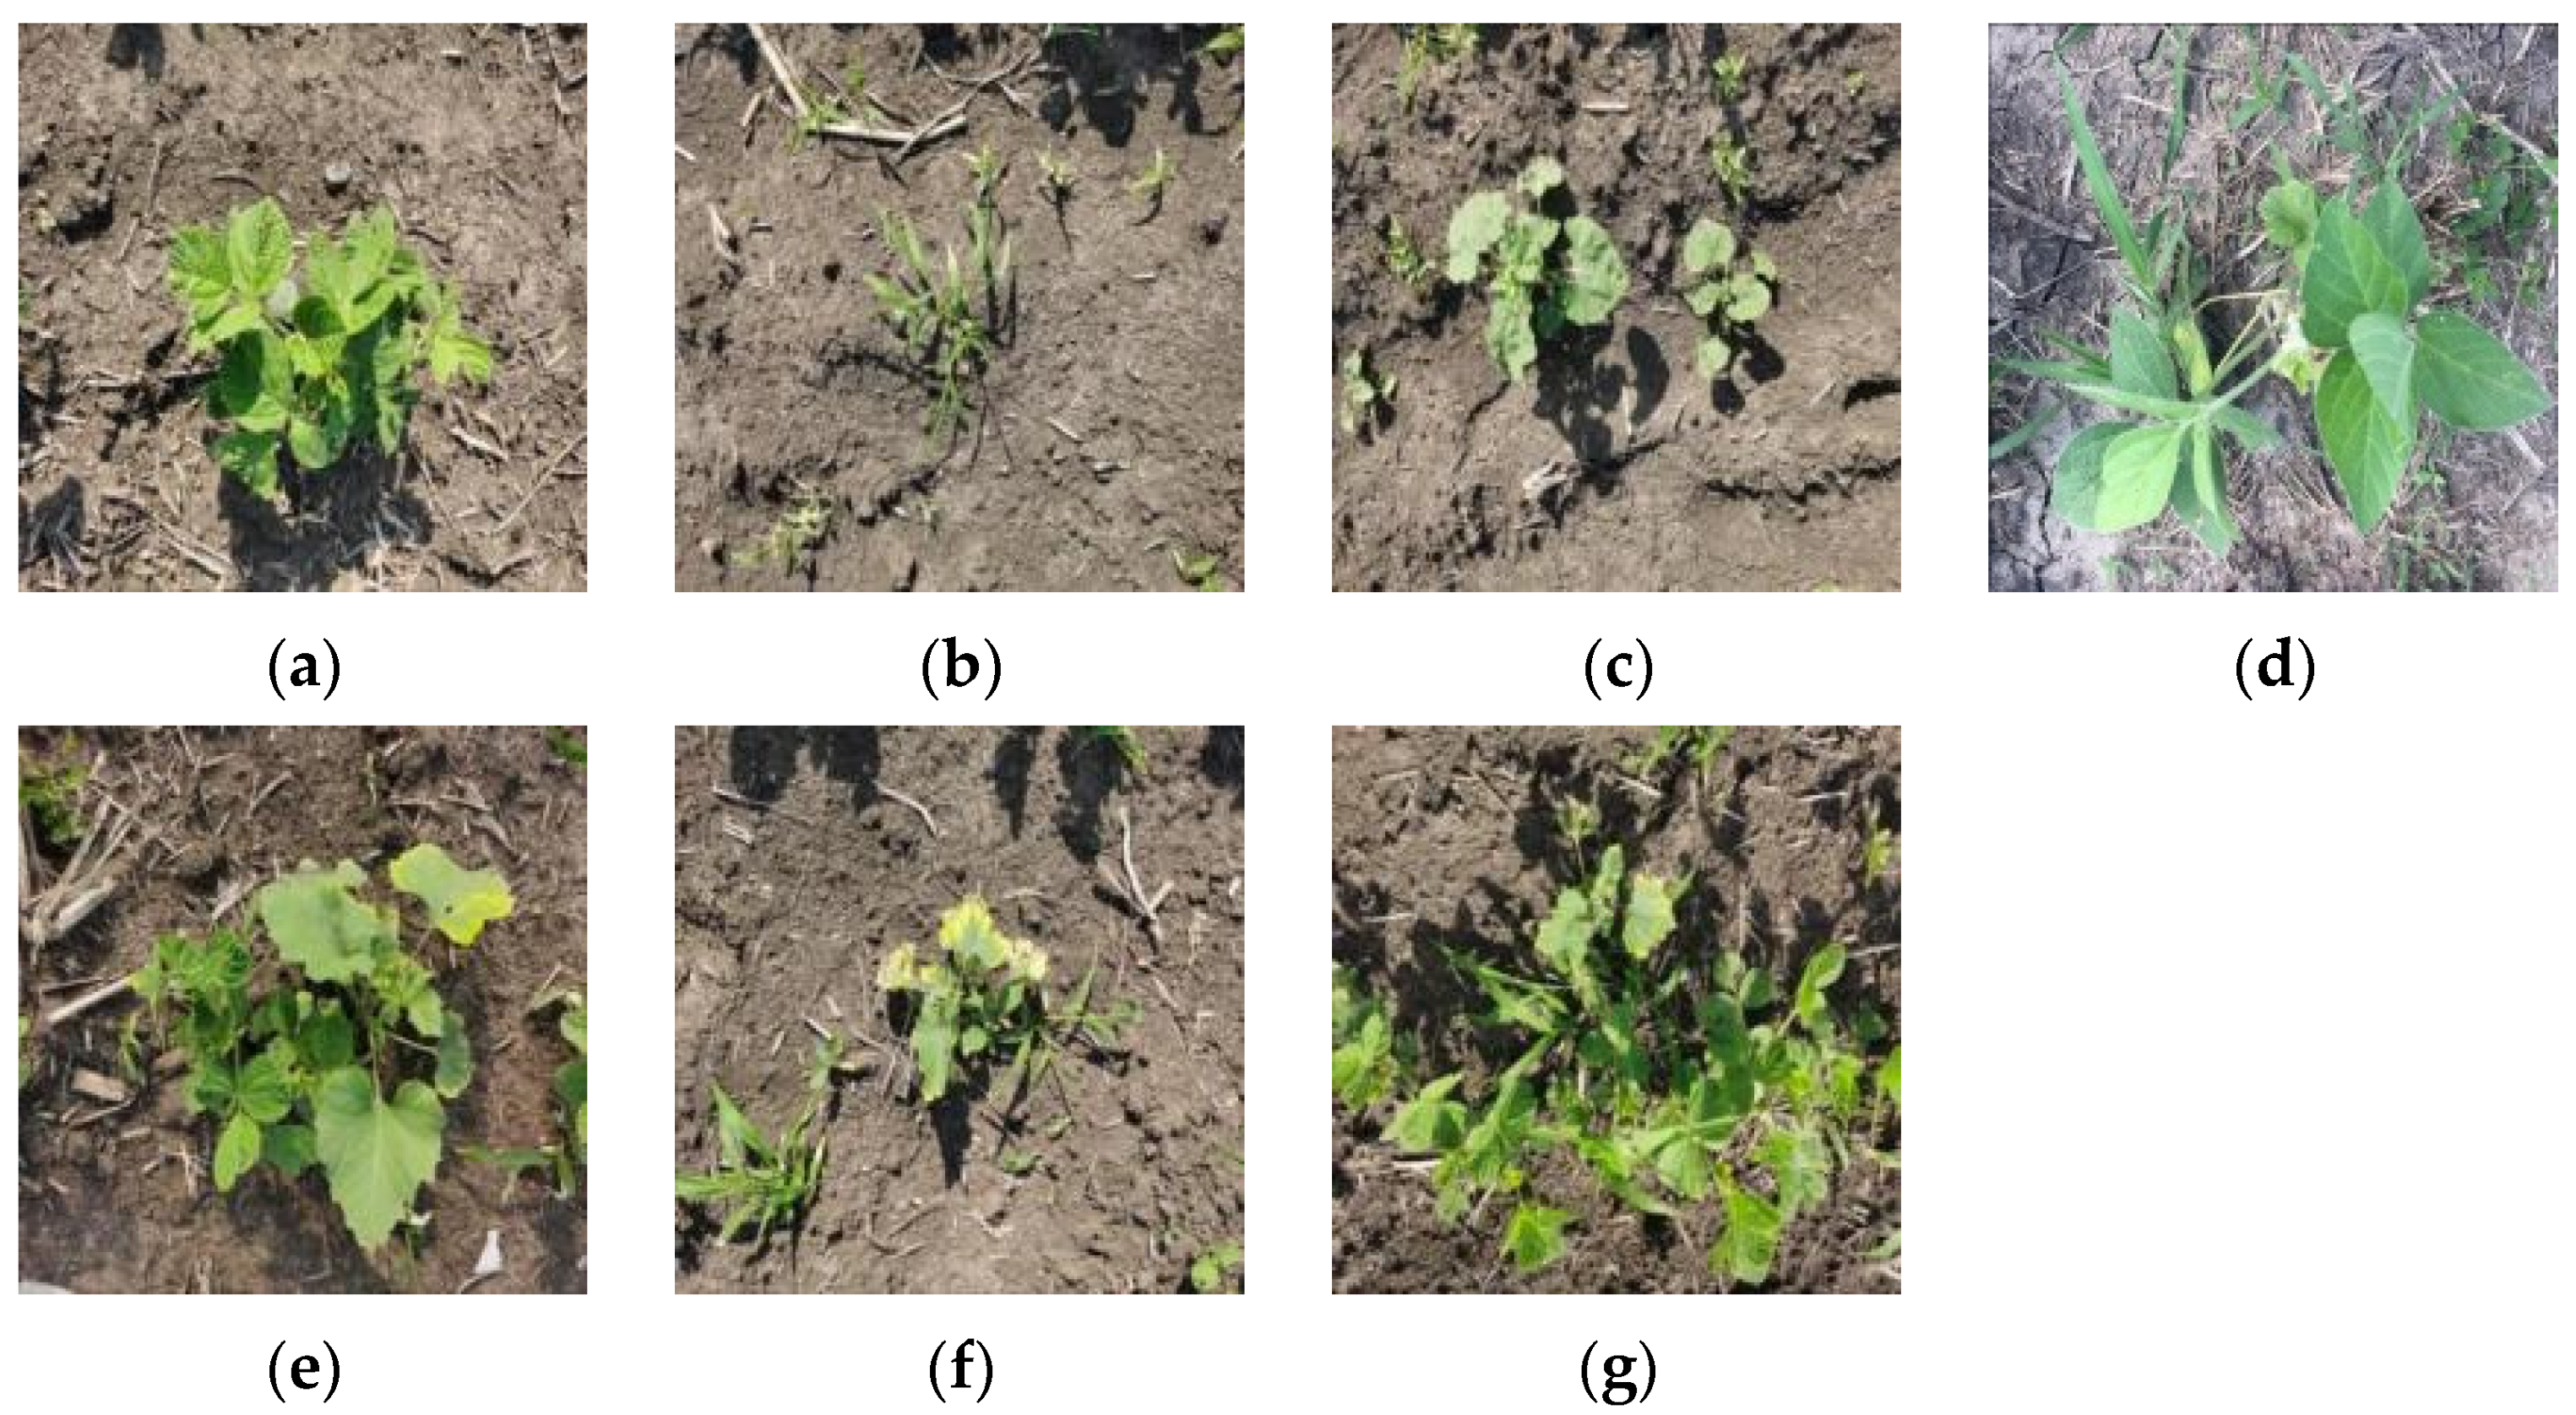
2.1.1. Data Acquisition

The study area was located at 43°48′41.39″ N, 125°23′6.01″ E in a soybean field at the teaching and research base of Jilin Agricultural University in Changchun, Jilin Province, where the soybean was in its seedling stage and a natural growth state, covering an area of about 6500 m2. The experimental data were acquired by mobile phone photography. The device used is a Huawei Mate 30 phone with a vertical ground angle. The collection time is in mid-June 2021, and the time period is from 9:00 to 15:00. A total of 918 valid images were taken, of which 818 images were taken at an average height of 0.5 m. An additional 100 shots taken at an average height of 1 m were used for subsequent validation of the model’s detection capability, which had a resolution of 3000 * 4000 pixels and were in jpg format. Seven treatments were designed for the study area: soybean, grass weed, broadleaf weed, soybean with grass weed, soybean with broadleaf weed, grass weed mixed with broadleaf weed, and soybean with grass weed mixed with broadleaf weed. An example of the different growth states is shown in Figure 1.

2.1.2. Data Pre-Processing

The target detection algorithm used in this paper uses CNNs to extract features from targets in images, which is a supervised training method. Therefore, the collected data samples are manually labeled with the image labeling tool LabelImg, and the labeled data are saved in PASCAL VOC format.
CNNs use raw data as input. They have high flexibility and generalization ability but require much training to obtain the target feature information from the raw data [34]. During the data acquisition process, although multiple growth states of soybeans and weeds were considered, there were other factors that affected the data quality, such as wind direction, wind speed, and sunlight. Therefore, data enhancement was carried out using image rotation (rotation angles of 90°, 180°, and 270°), brightness transformation, saturation transformation, and horizontal flipping. An example data enhancement diagram is shown in Figure 2.
The number of samples can be increased by image rotation to avoid distortion or overfitting during recognition due to too few samples or a small scale [35]. By changing the brightness and saturation of the test samples, the growth of soybean and weed under different weather conditions can be simulated to prevent overfitting and improve the generalization ability of the model. The number of samples after data enhancement was 9816. The training set (training set + validation set) and the test set occupied 70% and 30% of the sample size, respectively. The training set and validation set were also randomly assigned at a ratio of 7:3.

2.2. Methods

2.2.1. Introduction to the Faster R-CNN Target Detection Algorithm

The Faster R-CNN target detection algorithm improves upon the R-CNN and Fast R-CNN algorithms by using a region proposal network (RPN) instead of the time-consuming traditional method of select search. It can be regarded as the combination of “RPN + Fast R-CNN,” which is a typical two-stage target detection algorithm.
The Faster R-CNN structure is shown in Figure 3, which consists of three parts: feature extraction, RPN, and Faster-CNN. The main steps for soybean weed identification at the seedling stage based on the optimized Faster R-CNN are as follows:
(1) The input training data are resized by fixing the short side of the incoming image to become 600 pixels in size but not changing the aspect ratio of the original data to ensure that no frames are lost, followed by a backbone feature extraction network. This will be processed by a CNN feature extraction to obtain a shared feature layer that will be used in the model structure for the candidate RPN network and Fast R-CNN sharing;
(2) Input the shared feature layer extracted by the feature extraction network into the candidate RPN and use the shared feature layer to obtain the suggestion frame. In this paper, we design anchor scales of {128 × 128, 256 × 256, 512 × 512} and aspect ratios of {1:1, 1:2, 2:1} for 9 types of anchors according to the different sizes of soybean and weed data. The Softmax binary classification function then judges the anchors to determine whether they contain objects and other detail (e.g., whether they belong to the foreground or the background), and the positions of the suggested frames are fine-tuned to obtain the exact positions of the final detection frames for subsequent recognition and localization of soybeans and weeds. The loss function for an image is a superposition of a classification loss function and a regression loss function. In training, the loss functions of the RPN (1), the classification layer (2), and the regression layer (3) are as follows:
L p i , t i = 1 N cls L cls p i , p i + λ 1 N reg p i L reg t i , t i ,
L cls p i , p i = log p i p i + 1 p i 1 p i ,
L reg t i , t i = R t i t i ,
R = smooth L 1 x = 0.5 x 2                     i f   x < 1 x 0.5     otherwise .
where L is the RPN loss; I is the index of anchor points; N cls is the number of classification samples; N reg is the number of regression samples; L cls is the classification layer loss; L reg is the regression layer loss; λ are weighting parameters; p i is the predicted probability of the target; p i is the value of the anchor point discriminant, taking the value 0/1; t i are the four parametric coordinate vectors of the predicted border; t i are the four parametric coordinate vectors of the actual border; smooth L 1 is the smoothing loss function; x is the difference between the predicted border vector and the actual border vector;
(3) The ROI pooling layer in Fast R-CNN intercepts the acquired suggestion frame on the shared feature layer and resizes the intercepted local shared feature layer to the same feature layer, and their size is fixed;
(4) Using bbox_pred (bounding box regression unit) to adjust the parameters of the obtained suggested boxes to achieve position regression, predict the position of the optimal bounding box, and use the Softmax classification unit to obtain the final predicted category results.

2.2.2. Faster R-CNN Target Detection Algorithm Optimization

Feature Extraction Network Meritocracy

The Faster R-CNN target detection model initially used a backbone feature extraction network of ZFNet and VGG16, which consisted of 13 convolutional layers and 3 fully connected layers, with all convolutional layers using 3 × 3 convolutional kernels and all pooling layers choosing 2 × 2 pooling kernels. Although VGG16 can extract more subtle features from the input, with the development of neural networks, better feature extraction network structures have emerged, such as ResNet50 and VGG19. ResNet50 has two basic modules: the Conv Block module and the Identity Block module. Among them, the Conv Block input and output dimensions are different, so they cannot be connected in series, and its function is to change the dimension of the network. The Identity Block input dimension is the same as the output dimension, which can be connected in series and used to deepen the network. The difference between VGG19 and VGG16 is that VGG19 has three more convolutional layers than VGG16, and although the VGG16 model is lighter than VGG19, VGG19 has a slightly better performance capability. When detecting weeds in the young soybean and seedling stages, the backbone network structure is required to ensure recognition accuracy and recognition speed. In this paper, VGG19 was selected as the backbone feature extraction network for Faster R-CNN to extract the features of soybean, grassy weeds, and broad-leaved weeds, and two structures, ResNet50 and VGG16, were chosen as comparisons to verify the effects of different feature extraction network structures on the generalization ability of the model.

Embedded Attention Mechanism Module

The Convolutional Block Attention Module (CBAM) is a lightweight, general-purpose module for various CNNs, effectively improving the expressive power of CNNs and allowing end-to-end training with the basic CNN. CBAM is a combination of channel attention mechanisms and spatial attention mechanisms. The CBAM structure is shown in Figure 4a.
As seen in Figure 4a, the CBAM architecture contains two separate sub-modules, the Channel Attention Module (CAM) and the Spatial Attention Module (SAM), which perform attention operations on the channel and space, respectively. The CAM can be divided into two parts: global average pooling and maximum global pooling in parallel on the incoming feature layers of individual soybeans and weeds. The number of channels is compressed using a multilayer perceptron (MLP), and after expansion to the original number of channels, the two activated results are obtained after using the ReLU activation function. The CAM structure is shown in the bottom-left portion of Figure 4a.
SAM takes the input soybean and weed feature layers and averages them over the channels of each feature point. The SAM structure is shown in the bottom-right portion of Figure 4a.
VGG19 contains 16 convolutional layers and 3 fully connected layers, and a pooling layer of 2 × 2 pooling kernel size is added after each convolutional block. Most experiments chose to add the attention module after each convolutional layer, and although there would be an effect improvement, inserting the attention mechanism after each convolutional layer would increase the complexity of the network architecture and training process. Although CBAM is a lightweight module, overuse can undermine its lightweight nature. The small number of pooling layers can reduce complexity [36]. Emphasis should be placed on embedding the second half of the backbone network, as once the front part is modified, it is equivalent to training the entire network model from 0, which severely affects its convergence speed. Therefore, we conducted experiments to embed the CBAM structure behind the Block4 and Block5 pooling layers to show that it is more helpful to add the CBAM structure in each layer. This is carried out to increase the weight of sufficient channels, the weight of effective position information, and make the training process pay more attention to the relevant information of the detected target, which can improve the generalization ability and detection performance of the model. The embedding position is shown in Figure 4b(1–3).

Dropout Algorithm Optimization

Neural networks are excellent for computer vision tasks such as classification due to their large number of neurons and large network structure. However, the large size of the network also brings with it the risk of overfitting [37], and insufficient training data can lead to overfitting of the network during training. Using a dropout [38] algorithm is one strategy to avoid overfitting during the training process. Because the three feature extraction networks (ResNet50, VGG16, and VGG19) were trained on millions of large-scale datasets and the amount of data used in this experiment was relatively small, the dropout algorithm was selected for training to optimize the detection performance of the model in order to prevent the model from overfitting due to the small amount of data, and the dropout optimization was set after the fully connected layer of the feature extraction network structure.

2.2.3. Comparison of Weed Detection Methods at the Seedling Stage

The aim of this study is to establish an optimized detection algorithm for identifying weeds at the soybean seedling stage that is suitable for use in natural environments. After identifying weeds, the optimal structure among the three feature extraction network structures and embedding CBAM in the optimal structure are determined by the average accuracy rate and recognition speed. The collection is compared and analyzed with the mainstream target algorithms SSD and Yolov4 to evaluate the performance of the optimized model.

2.2.4. Test Platform

The software and hardware environments for model training and testing are shown in Table 1.

2.2.5. Network Model Training

In this paper, the Faster R-CNN target detection algorithm is adopted as the training base framework, pre-training weights are selected as weights, alternate optimization is used for training, and three feature extraction networks—ResNet50, VGG16, and VGG19—are selected as the backbone feature extraction networks for Faster R-CNN training. In order to enhance the generalization capability of the model, the Adam optimizer uses momentum to optimize the direction of the gradient and the adaptive learning rate to speed up convergence by dynamically adjusting the learning rate. The value of the momentum factor is set to 0.9, the initial value of the learning rate is set to 0.0001, and the learning rate decays by cosine annealing recession. The number of training rounds is set to the epoch (one epoch for all training sets), and the epoch value is set to 200. Based on the loss function curve, training is terminated early if the loss value decreases to save training time.

2.2.6. Trial Evaluation Indicators

This paper experiments with the use of mean Average Precision (mAP), F1 value, Precision (P), and Recall (Recall) in each category as metrics for the analysis and evaluation of algorithm precision.
Precision indicates the proportion of correct classifications in all prediction boxes, and Recall indicates the proportion of correct classifications in all labeled boxes. Equations (4) and (5) are shown below:
Precision = TP TP + FP ,
Recall = TP TP   +   FN ,
where TP represents the number of correct classifications for each category; FP represents the number of incorrect classifications for each category; and FN is the number of missed detections for each category.
AP represents the area underneath the Precision-Recall curve. Generally. the better the classifier, the higher the AP value, as shown in Equation (6) below:
AP = 1 0 Precision   d   Recall .
The mAP is the average of multiple-category APs. The size of the mAP value must be in the interval [0, 1] (the larger, the better), and Equation (7) is shown below:
mAP = 1 x 1 x AP .
The F1 value is a measure of the classification problem, which is the summed average of precision and recall, and Equation (8) is shown below:
F 1 = 2 × Precision   ×   Recall Precision   +   Recall .
The evaluation indicators selected for this study were calculated using a threshold value of 0.5.

3. Results

3.1. Impact of Three Feature Extraction Networks (ResNet50, VGG16, VGG19) on the Model

The accuracy and time of the three feature extraction networks (ResNet50, VGG16, and VGG19) for recognizing the same number of images were compared, and the recognition accuracy results are shown in Table 2. It can be seen that in terms of average recognition time, VGG19 < ResNet50 < VGG16, with the VGG19 model having the lowest average recognition time. In terms of average accuracy rate, ResNet50 < VGG16 < VGG19. Although the Faster R-CNN model using VGG19 as the feature extraction network had a low accuracy for soybean recognition, the recognition rate of the two types of weeds was significantly higher than the other two, with the highest average accuracy rate of 93.55%. The reason for this result is that given the perceptual field, the entire network of VGG19 uses the same sizes: 3 × 3 convolutional kernel size and 2 × 2 maximum pooling size. Using stacked small convolutional kernels can increase the network depth to ensure learning more complex patterns and can extract finer features, thus having a higher accuracy rate. The structure of VGG16 and VGG19 is not fundamentally different—only the network depth is different, where VGG19 adds three convolutional layers on top of VGG16 to deepen the depth of the network and improve performance. The ResNet50 network structure consists of two residual network structures: the Conv Block and the Identity Block. The role of Conv Block is to change the dimension of the network, whereas the role of Identity Block is to deepen the network. However, the error in the network layer depth will increase to a certain extent. As the effect becomes worse, the phenomenon of gradient disappearance becomes more pronounced. Backpropagation cannot feed the gradient to the front network layer, and the front network parameters cannot be updated, resulting in poor training. In summary, in the target detection method used in this paper (Faster R-CNN), the VGG19 feature extraction network structure outperforms the detection performance of ResNet50 and VGG16. Therefore, the VGG19 feature extraction network is selected as the backbone feature extraction network of the Faster R-CNN target detection model.

3.2. Effect of Adding CBAM on Model Accuracy

The CBAM structure is embedded after the pooling layer of VGG19, and the results are shown in Table 3. It can be seen that after Block4 and Block5 are embedded into the CBAM structure, the model performance is significantly improved, and F1, R and P are increased by 0.09, 5.74% and 9.54%, respectively. The average recognition rate increases by 5.61% from 99.16%, and the average recognition time decreases. However, the average recognition rate increases after Block4 and Block5 pooling layers, but the overall recognition efficiency is lower than that after Block4 and Block5 co-embedding. The reason is that after the CBAM structure is embedded. The extracted features are global features with richer semantic information. In the training process, the model increases the weight of the influence channel and the weight of sufficient position information, which makes the training process pay more attention to the relevant information of the detected target. As can be seen in Table 3, after embedding CBAM in VGG19, the evaluation indicators of the model have been improved to a certain extent. After Block4 and Block5 are embedded in CBAM, the evaluation indicators of the model are shown in Figure 5.

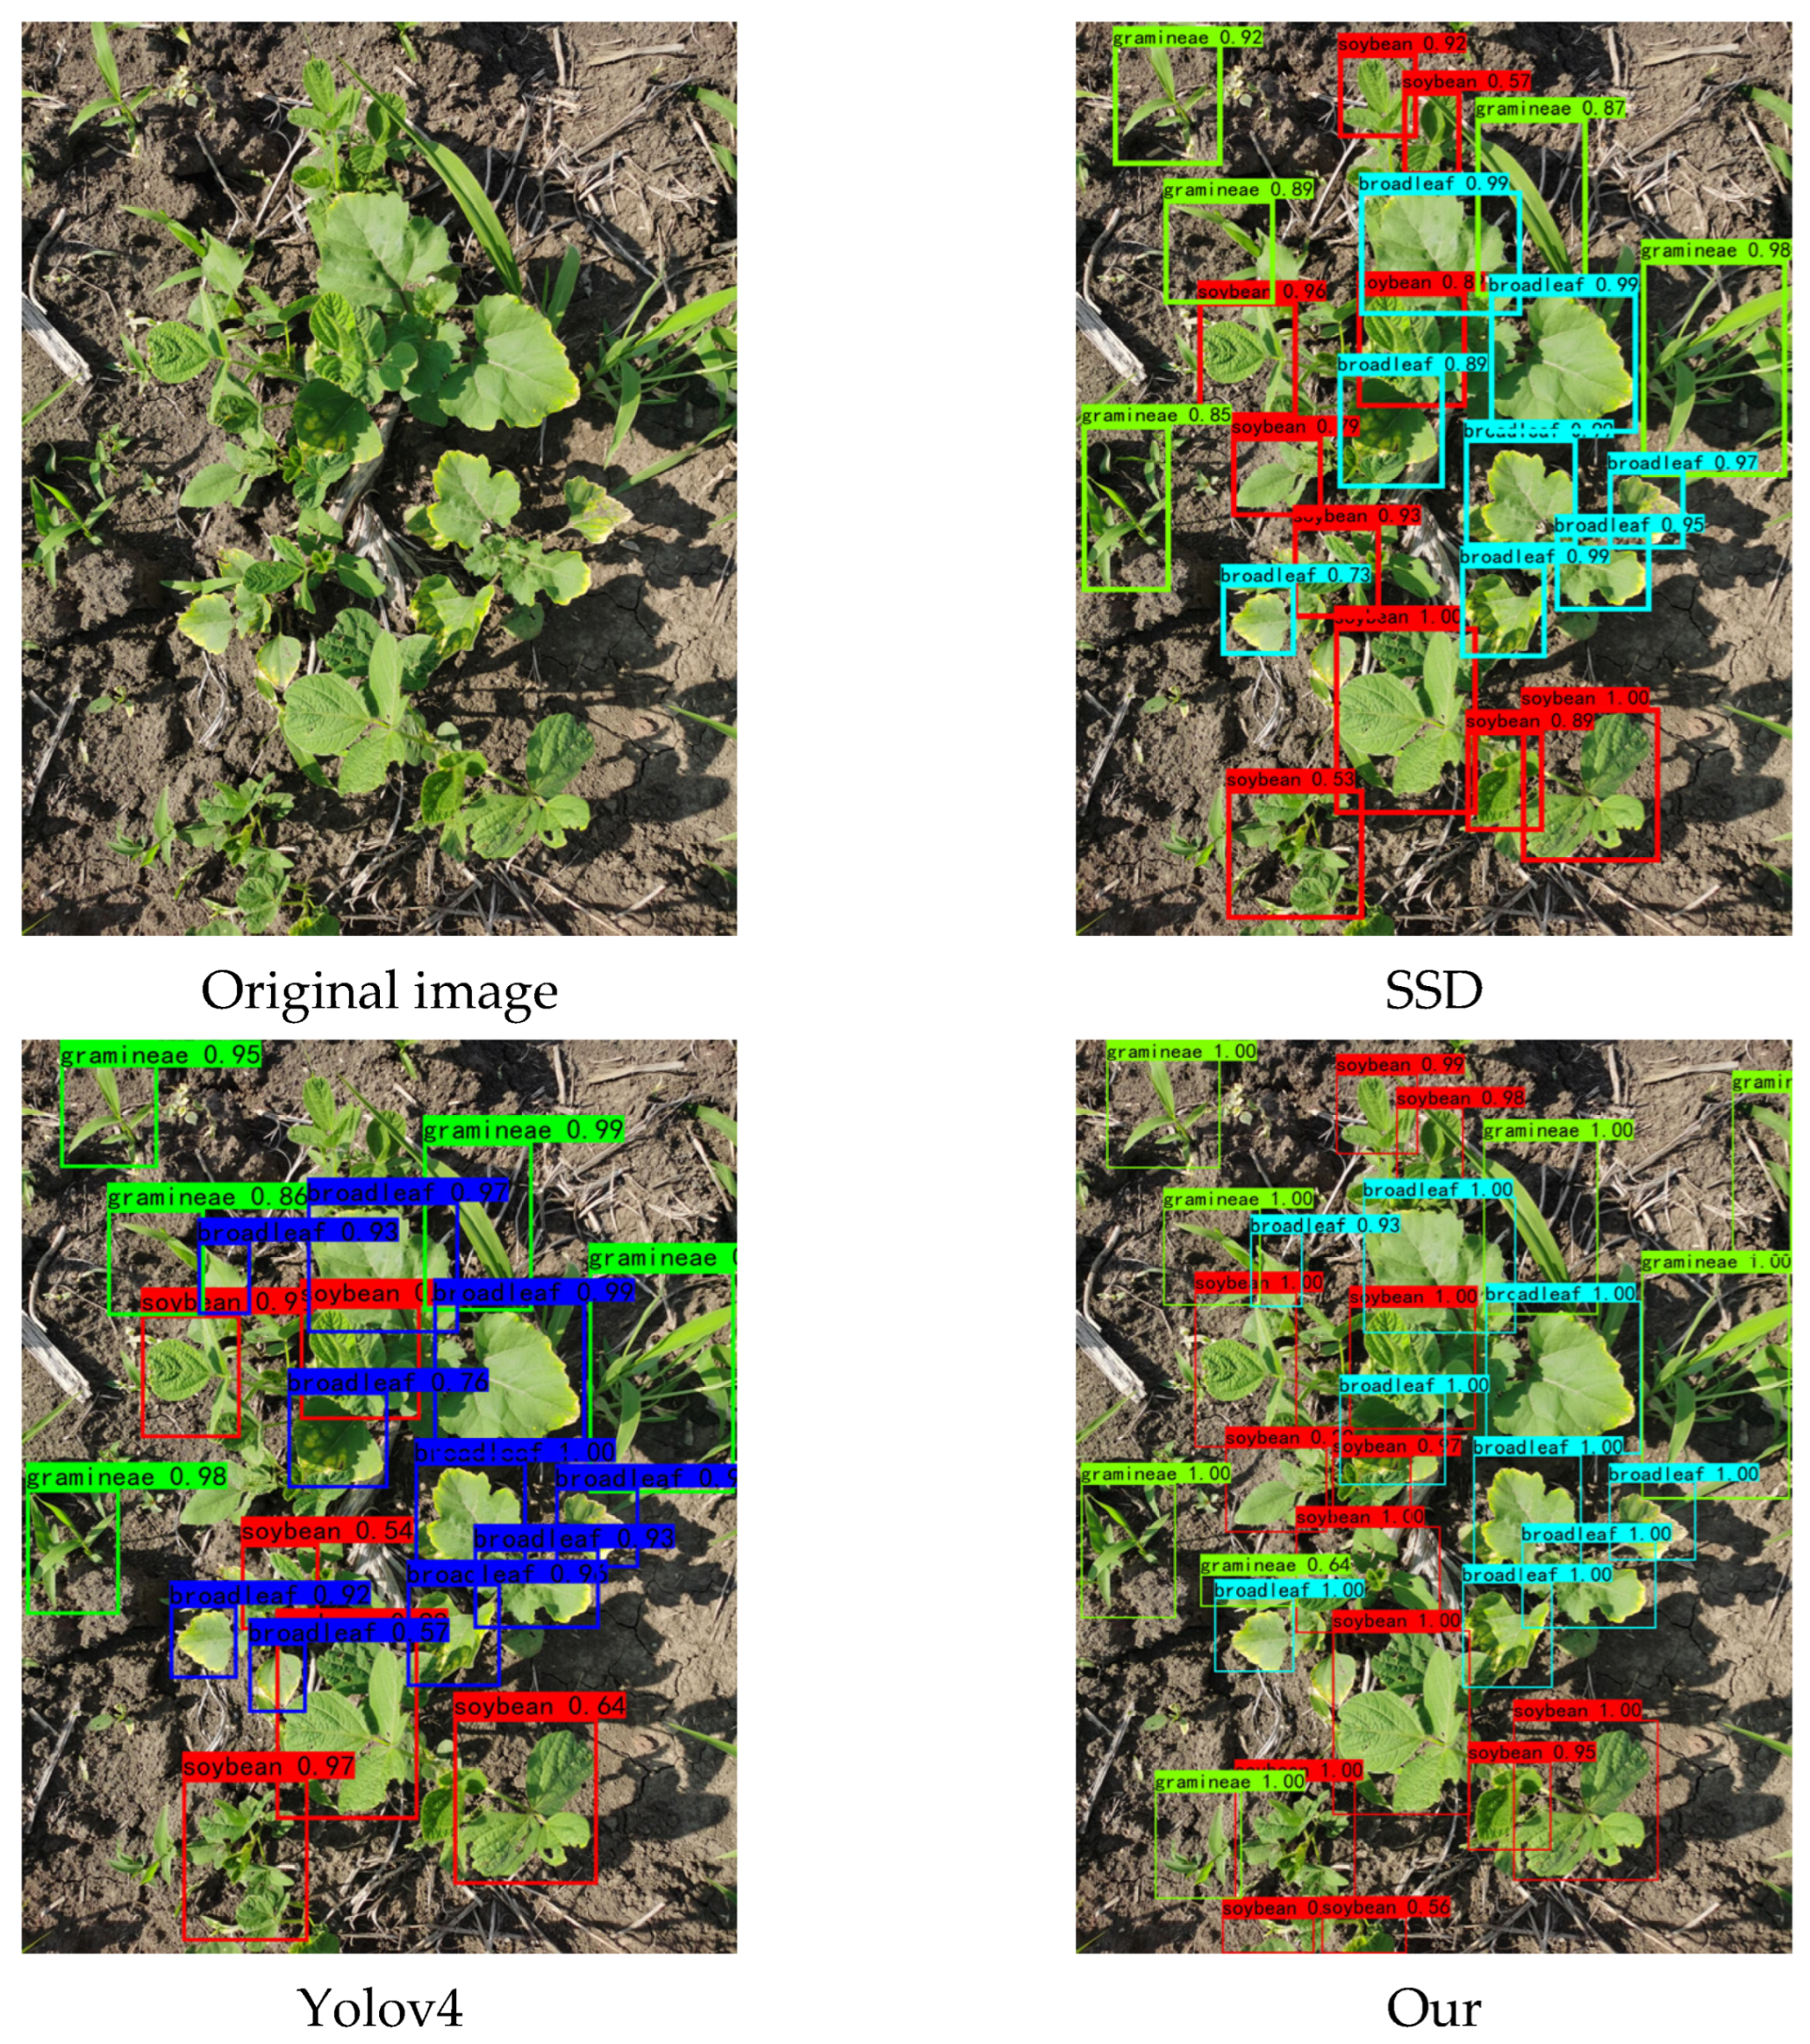
3.3. Comparison with Other Detection Model Algorithms

Under the same dataset and test platform, the mainstream target detection algorithms SSD and Yolov4 were selected to compare and analyze the performance effects of the optimized models. The average accuracy and recognition effects are shown in Table 4 and Figure 6. It can be seen that the Faster R-CNN method with the embedded CBAM structure outperforms SSD and Yolov4 in all three evaluation metrics: F1, R, and P. The optimized Faster R-CNN method used the least average recognition time. The average accuracy of the Faster R-CNN method with the embedded CBAM structure reached 99.16%, which was 2.24% and 1.24% higher than that of the SSD and Yolov4 methods, respectively. The average accuracy of the SSD method was 96.92%, which was slightly lower than that of the Yolov4 model. The Yolov4 method has a single grid in the regression process, which leads to less accurate localization of weeds. The single grid space setting is not conducive to the model’s prediction in the dense distribution of weed states and the proximity of the two, which results in a higher rate of missed detection, leads to a lower detection accuracy. Faster R-CNN replaces the Selective Search method in Fast R-CNN with RPN, effectively reducing the time cost and intercepting the ROI on the shared feature layer using the suggestion frame, substantially improving accuracy.
From the method comparison results in Figure 6, it can be seen that the optimized Faster R-CNN in this paper is more successful compared with SSD and Yolov4 under complex background conditions, both in terms of missed detection and recognition accuracy, so the optimized Faster R-CNN algorithm in this paper is more suitable for weed detection during the soybean seedling period.

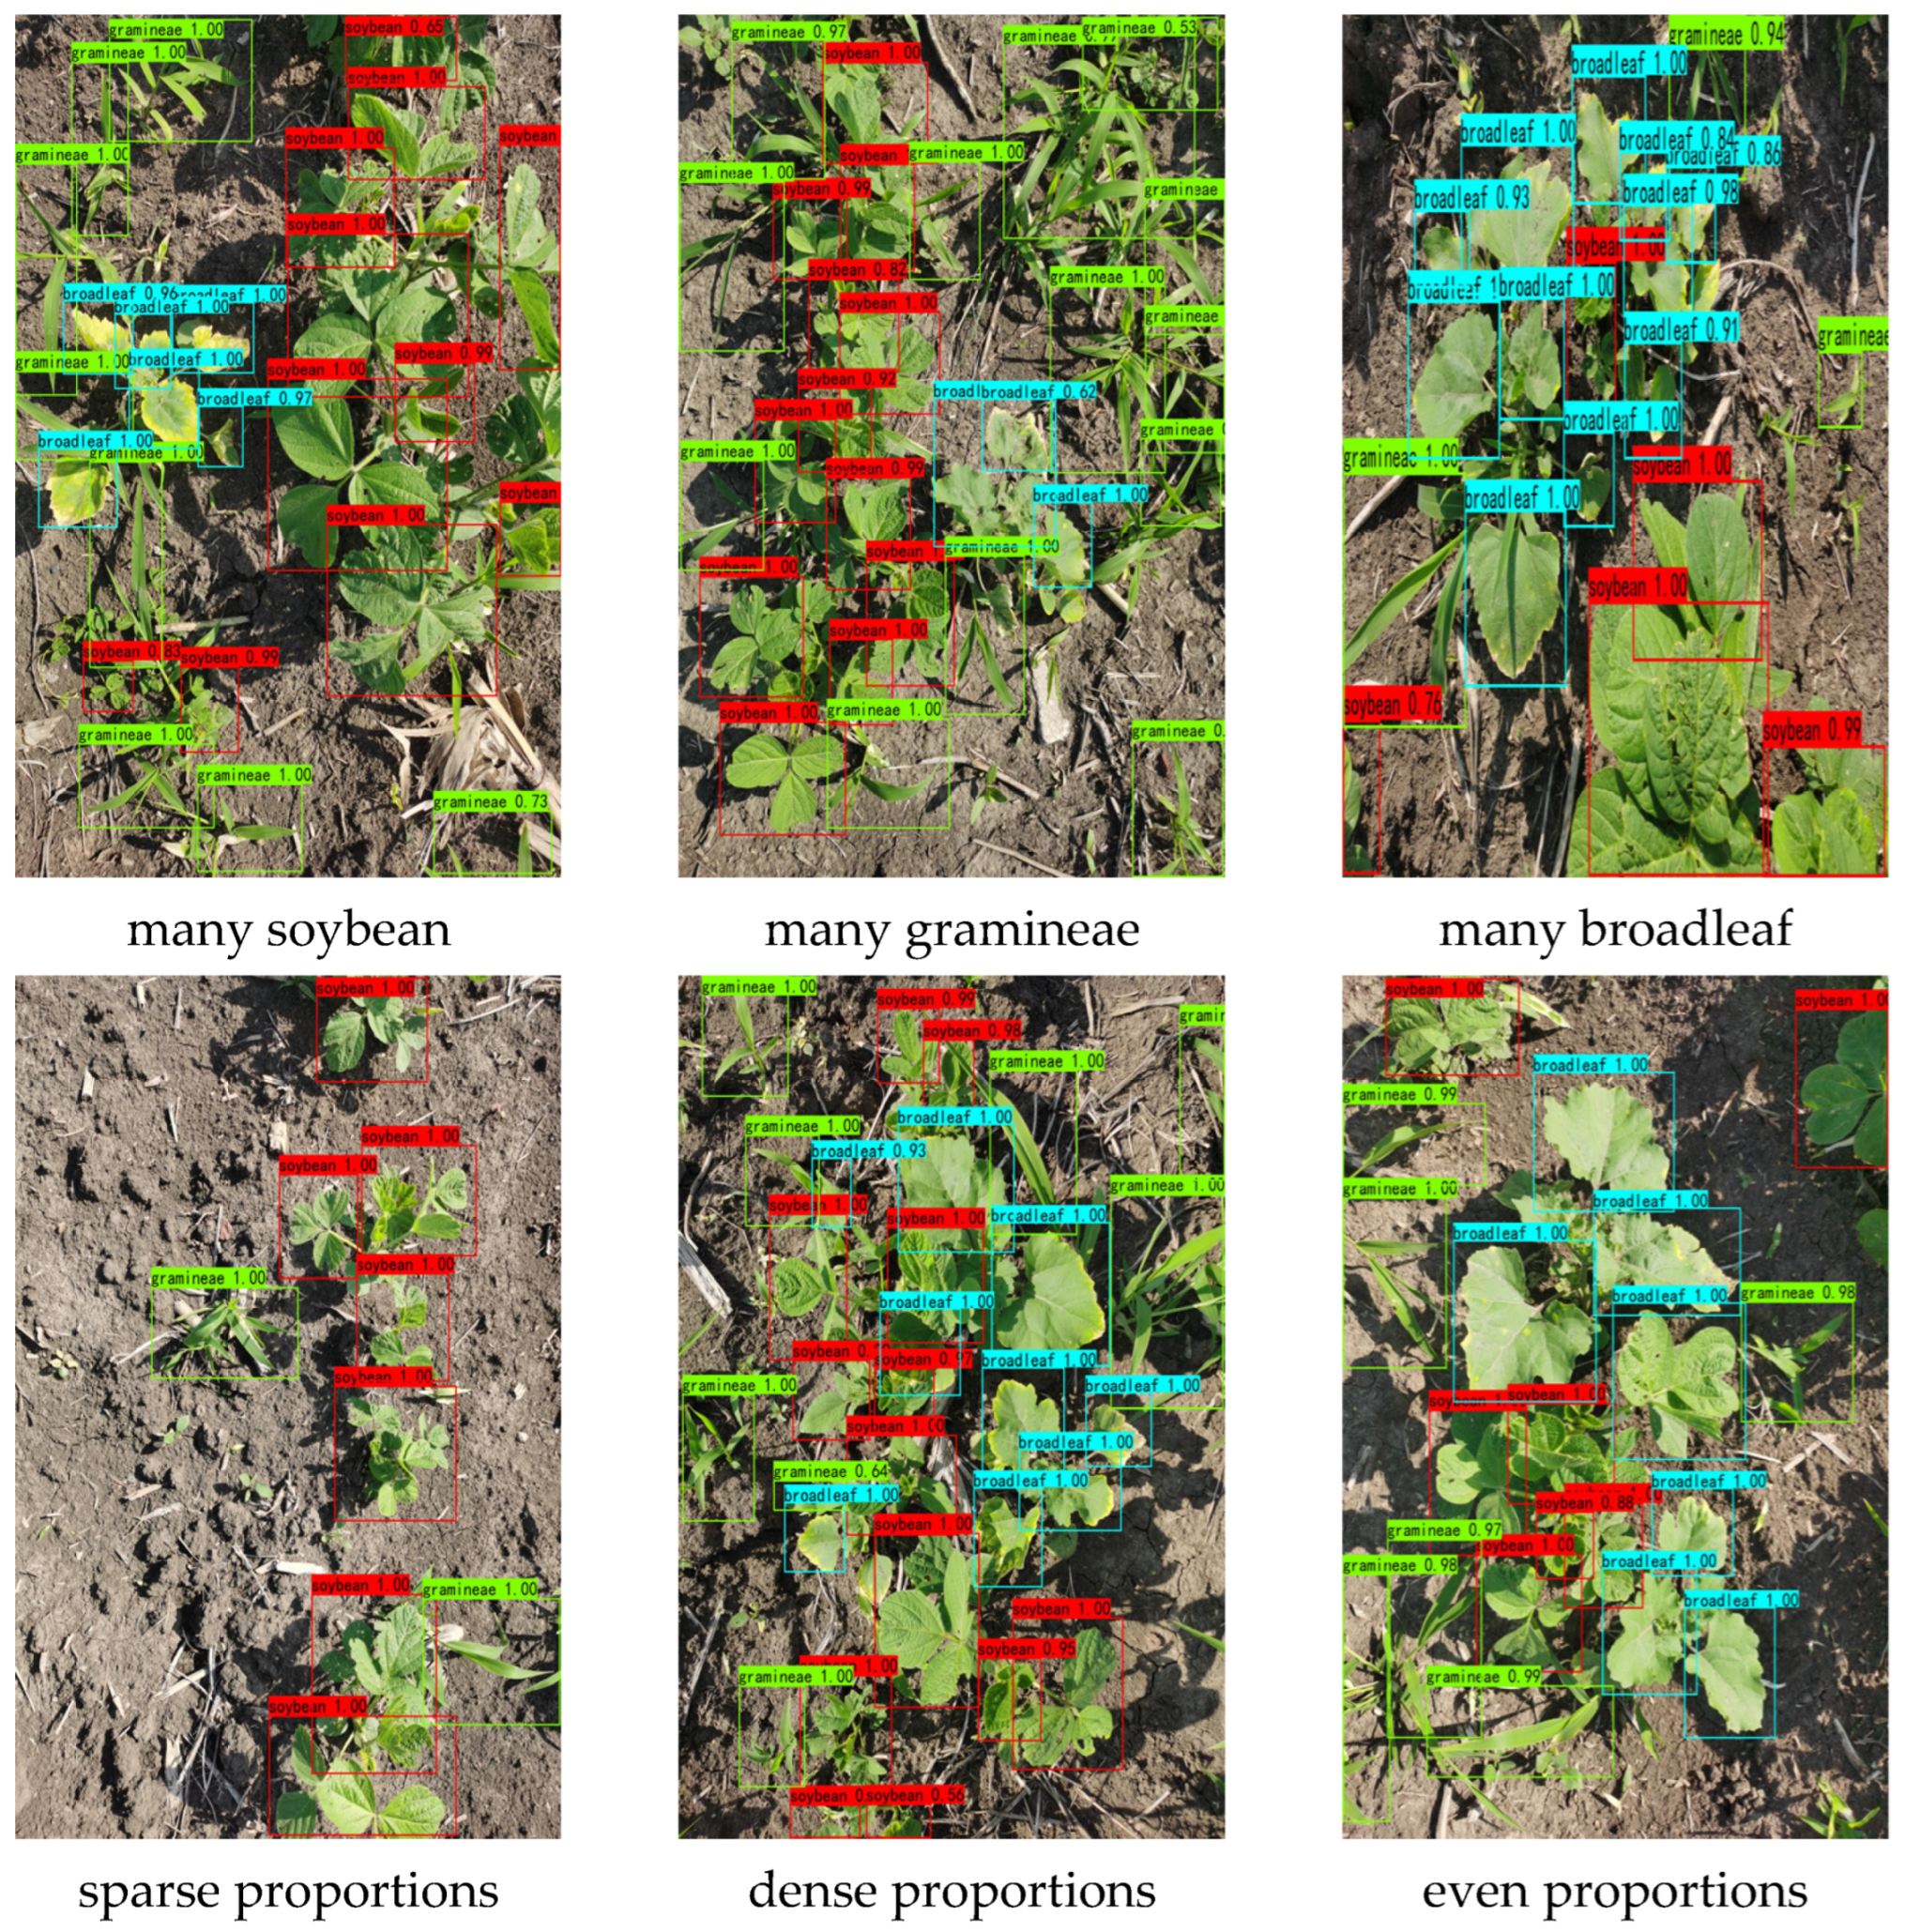
3.4. Application of Weed Detection at Seedling Stage in the Natural Environment

As shown by the growth state recognition results in Figure 7, the recognition results for all seven different growth states were good, and even if some of the leaves were obscured by each other, they were detected correctly. However, the accuracy of the prediction results for some images was low, most likely due to the presence of some leaves at the edges of the images when constructing the dataset, which affects the training effect and average recognition accuracy of the model. The problem of missed and false detection exists because the soybean weed studied in the experiment is at the seedling stage, and the soybean leaves at the seedling stage are to some extent more similar to the broad-leaved type of weed in terms of shape and spatial characteristics. In addition, the problem is caused by the presence of small growth in some of the identified targets. As can be seen in Table 5, using the optimized model to recognize 100 images with an average collection height of 1 m in a natural environment, the average accuracy rate reached 90.23%. The average recognition time per image was 590 ms, owing to the increase in the number of targets per image due to the increase in collection height. Therefore, the optimized method is feasible and practical and can support the identification of weeds at the seedling stage of soybean in the field.

4. Discussion

4.1. Deep Learning-Based Target Detection

This study applied a deep learning target detection method to detect soybeans and weeds in the field with good detection results. In weed detection work using deep learning methods, many researchers have used traditional machine learning algorithms for weed detection in field drone data. Such drones acquire data quickly and save time and effort. However, due to the height issue, the ground plants are relatively narrow, resulting in a certain degree of similarity in morphology, shape, and space between the crop and the weed, and the recognition accuracy is not high, which makes weed identification difficult. In contrast, deep learning can determine the characteristics of crops and weeds through convolutional operations and effective stacked neural networks, which can solve the problem of weed detection in natural environments with complex backgrounds. A related researcher [39,40] has effectively solved the problem of weed detection using deep-learning network models, proving that deep learning is efficient in the fields of crop identification and weed identification. However, agriculture is highly susceptible to the natural environment and bad weather, such as flooding and high temperatures. Therefore, it is also subject to certain limitations.

4.2. Disadvantages and Limitations

Although the weed identification network proposed in this paper can be more effective than traditional target detection algorithms in identifying weeds in soybean fields in their natural state, some problems still require further research. The weed species in this paper include only grassy weeds and broadleaf weeds. Future studies will be more detailed regarding specific weed species rather than broad weed categories. Secondly, the data used in this study were collected at a small identification scale, and future studies will focus on considering data collected by unmanned aerial vehicles (UAVs). Finally, this study demonstrates the practicality of using attention mechanisms to optimize the network structure. Nevertheless, excellent methods for target detection continue to develop, such as receptive field block (RFB) [41], and spatial pyramid pooling (SPP) [42], and some researchers are now considering how to integrate these advanced methods with their networks and thus improve the speed and accuracy of detection, which is worthy of further exploration.

5. Conclusions

This paper proposes an optimized Faster R-CNN-based weed identification method for the soybean seedling stage using photographs of soybean seedlings in the field as the original data.
The CBAM module is embedded after the latter half of the pooling layer of the backbone feature extraction network VGG19. The performance of the embedding at different levels is compared, and an optimization strategy is added to the model training process. The results showed that the average accuracy of the optimized model was 99.16%, an improvement of 5.61% over the previous one, and the detection effect was significantly improved. Weed detection with multiple weed companions and different proportions could be achieved. Comparing the performance of three backbone feature extraction networks, ResNet50, VGG16, and VGG19, in the Faster R-CNN model, it was determined that VGG19 had the best structure with an average accuracy rate of 93.55%. It was also used as the backbone model for subsequent experiments. The average accuracy of the optimized Faster R-CNN model was 2.24% higher than that of the target detection algorithm SSD and 1.24% higher than that of the target detection algorithm Yolov4, which indicates that the optimized Faster R-CNN model is more advantageous. The generalization ability of the model was verified using 100 soybean data collected at a height of 1 m in a natural environment at the seedling stage in the field. The average accuracy reached 90.31% and the average recognition time was 0.59 s, which proved that the optimized method in this paper has certain feasibility and practicality and can provide scientific support for grass damage monitoring and control.
In future work, this study will use appropriate agricultural machinery equipped with a camera platform and computer platform to mark crops and weeds with different colors to eradicate weeds. In addition, this model can also be embedded in the APP function module of smart phones to help farmers identify weeds and provide certain drug use suggestions.

Author Contributions

Conceptualization, X.Z.; methodology, X.Z. and J.C.; software, Y.H.; validation, J.C., J.Z. and Y.C.; formal analysis, Y.H.; investigation, H.A.; resources, H.L.; data curation, J.C. and H.L.; writing—original draft preparation, J.C.; writing—review and editing, X.Z. and J.C.; visualization, C.D.; supervision, X.Z. and H.L.; project administration, J.Z.; funding acquisition, X.Z. All authors have read and agreed to the published version of the manuscript.

Funding

This research was funded by the Jilin Agricultural University Introduction of Talents Project (No.202020010) and National Key Research and Development Program Grant (No.2021YFD1500100).

Institutional Review Board Statement

Not applicable.

Informed Consent Statement

Not applicable.

Data Availability Statement

The datasets used and/or analyzed during the current study are available from the corresponding authors upon reasonable request.

Acknowledgments

The authors would like to thank all contributors to this study.

Conflicts of Interest

The authors declare no conflict of interest.

References

  1. Liu, Z.; Ying, H.; Chen, M.; Bai, J.; Xue, Y.; Yin, Y.; Batchelor, W.D.; Yang, Y.; Bai, Z.; Du, M.; et al. Optimization of China’s maize and soy production can ensure feed sufficiency at lower nitrogen and carbon footprints. Nat. Food 2021, 2, 426–433. [Google Scholar] [CrossRef]
  2. Nursyazyla, S.; Norasma, C.N.; Huzaifah, M.R.M.; Shukor, J.A.; Nisfariza, M.N.; Fazilah, F.I.W. The Application of Hyperspectral Remote Sensing Imagery (HRSI) for Weed Detection Analysis in Rice Fields: A Review. Appl. Sci. 2022, 12, 2570. [Google Scholar]
  3. Zhao, X.; Wang, X.; Li, C.; Fu, H.; Yang, S.; Zhai, C. Cabbage and Weed Identification Based on Machine Learning and Target Spraying System Design. Front. Plant Sci. 2022, 13, 2299. [Google Scholar] [CrossRef]
  4. Islam, N.; Rashid, M.M.; Wibowo, S.; Xu, C.Y.; Morshed, A.; Wasimi, S.A.; Moore, S.; Rahman, S.M. Early Weed Detection Using Image Processing and Machine Learning Techniques in an Australian Chilli Farm. Agriculture 2021, 11, 387. [Google Scholar] [CrossRef]
  5. Oh, C.K.; Kim, T.; Cho, Y.K.; Cheung, D.Y.; Lee, B.I.; Cho, Y.S.; Kim, J.I.; Choi, M.G.; Lee, H.H.; Lee, S. Convolutional neural network-based object detection model to identify gastrointestinal stromal tumors in endoscopic ultrasound images. J. Gastroenterol. Hepatol. 2021, 36, 3387–3394. [Google Scholar] [CrossRef] [PubMed]
  6. Li, Z.; Li, Y.; Yang, Y.; Guo, R.; Yang, J.; Yue, J.; Wang, Y. A high-precision detection method of hydroponic lettuce seedlings status based on improved Faster RCNN. Comput. Electron. Agric. 2021, 182, 106054. [Google Scholar] [CrossRef]
  7. Arora, N.; Kumar, Y.; Karkra, R.; Kumar, M. Automatic vehicle detection system in different environment conditions using fast R-CNN. Multimed Tools Appl. 2022, 81, 18715–18735. [Google Scholar] [CrossRef]
  8. Subeesh, A.; Bhole, S.; Singh, K.; Chandel, N.; Rajwade, Y.; Rao, K.; Kumar, S.; Jat, D. Deep convolutional neural network models for weed detection in polyhouse grown bell peppers. Artif. Intell. Agric. 2022, 6, 47–54. [Google Scholar] [CrossRef]
  9. Khan, S.; Tufail, M.; Khan, M.T.; Khan, Z.A.; Anwar, S. Deep learning-based identification system of weeds and crops in strawberry and pea fields for a precision agriculture sprayer. Precis. Agric. 2021, 22, 1711–1727. [Google Scholar] [CrossRef]
  10. Aaron, E.; Aanis, A.; Varun, A.; Dharmendra, S. Deep Learning-Based Object Detection System for Identifying Weeds Using UAS Imagery. Remote Sens. 2021, 13, 5182. [Google Scholar]
  11. Hennessy, J.; Esau, J.; Schumann, W.; Zaman, U.; Corscadden, W.; Farooque, A. Evaluation of cameras and im-age distance for CNN-based weed detection in wild blueberry. Smart Agric. Technol. 2022, 2, 100030. [Google Scholar] [CrossRef]
  12. Razfar, N.; True, J.; Bassiouny, R.; Venkatesh, V.; Kashef, R. Weed detection in soybean crops using custom lightweight deep learning models. J. Agric. Food Res. 2022, 8, 100308. [Google Scholar] [CrossRef]
  13. Wang, Y.-H.; Su, W.-H. Convolutional Neural Networks in Computer Vision for Grain Crop Phenotyping: A Review. Agronomy 2022, 12, 2659. [Google Scholar] [CrossRef]
  14. Rani, S.V.; Kumar, P.S.; Priyadharsini, R.; Srividya, S.J.; Harshana, S. Automated weed detection system in smart farming for developing sustainable agriculture. Int. J. Environ. Sci. Technol. 2022, 19, 9083–9094. [Google Scholar] [CrossRef]
  15. Hasan, A.M.; Sohel, F.; Diepeveen, D.; Laga, H.; Jones, M.G. A survey of deep learning techniques for weed detection from images. Comput. Electron. Agric. 2021, 184, 106067. [Google Scholar] [CrossRef]
  16. Jin, X.; Che, J.; Chen, Y. Weed Identification Using Deep Learning and Image Processing in Vegetable Plantation. IEEE Access 2021, 9, 10940–10950. [Google Scholar] [CrossRef]
  17. Gerassimos, P.G.; Philipp, R.; Jeremy, K.; Dionisio, A.; Roland, G. Weed Identification in Maize, Sunflower, and Potatoes with the Aid of Convolutional Neural Networks. Remote Sens. 2020, 12, 4185. [Google Scholar]
  18. Yu, J.; Schumann, A.W.; Cao, Z.; Sharpe, S.; Boyd, N.S. Weed Detection in Perennial Ryegrass With Deep Learning Convolutional Neural Network. Front. Plant Sci. 2019, 10, 1422. [Google Scholar] [CrossRef] [Green Version]
  19. Ying, B.; Xu, Y.; Zhang, S.; Shi, Y.; Liu, L. Weed Detection in Images of Carrot Fields Based on Improved YOLO v4. Trait. Signal 2021, 38, 341–348. [Google Scholar] [CrossRef]
  20. Li, Q.; Zhao, F.; Xu, Z.; Li, K.; Wang, J.; Liu, H.; Qin, L.; Liu, K. Improved YOLOv4 algorithm for safety management of on-site power system work. J. Egyr. 2022, 8, 739–746. [Google Scholar] [CrossRef]
  21. Hamid, Y.; Wani, S.; Soomro, A.B.; Alwan, A.A.; Gulzar, Y. Smart Seed Classification System based on Mo-bileNetV2 Architecture. In Proceedings of the 2022 2nd International Conference on Computing and Information Technology (ICCIT), Tabuk, Saudi Arabia, 25–27 January 2022; pp. 217–222. [Google Scholar]
  22. Albarrak, K.; Gulzar, Y.; Hamid, Y.; Mehmood, A.; Soomro, A.B. A Deep Learning-Based Model for Date Fruit Classification. Sustainability 2022, 14, 6339. [Google Scholar] [CrossRef]
  23. Zhou, H.; Zhao, Y.; Xiang, W. Method for judging parking status based on yolov2 target detection algorithm. Procedia Comput. Sci. 2022, 199, 1355–1362. [Google Scholar] [CrossRef]
  24. Chen, J. IOT Monitoring System for Ship Operation Management Based on YOLOv3 Algorithm. J. Control. Sci. Eng. 2022, 2022, 2408550. [Google Scholar] [CrossRef]
  25. Zuo, J.; Han, F.; Meng, Q. A SECI Method Based on Improved YOLOv4 for Traffic Sign Detection and Recognition. J. Phys. Conf. Ser. 2022, 2337, 012001. [Google Scholar] [CrossRef]
  26. Gao, X.; Xu, J.; Luo, C.; Zhou, J.; Huang, P.; Deng, J. Detection of Lower Body for AGV Based on SSD Algorithm with ResNet. Sensors 2022, 22, 2008. [Google Scholar] [CrossRef] [PubMed]
  27. Wang, J.; Luo, J.; Liu, B.; Feng, R.; Lu, L.; Zou, H. Automated diabetic retinopathy grading and lesion detection based on the modified R-FCN object-detection algorithm. IET Comput. Vis. 2020, 14, 1–8. [Google Scholar] [CrossRef]
  28. Lee, Y.S.; Park, W.H. Diagnosis of Depressive Disorder Model on Facial Expression Based on Fast R-CNN. Diagnostics 2022, 12, 317. [Google Scholar] [CrossRef]
  29. Yan, D.; Li, G.; Li, X.; Zhang, H.; Lei, H.; Lu, K.; Cheng, M.; Zhu, F. An Improved Faster R-CNN Method to Detect Tailings Ponds from High-Resolution Remote Sensing Images. Remote. Sens. 2021, 13, 2052. [Google Scholar] [CrossRef]
  30. Sheriff, S.T.M.; Kumar, J.V.; Vigneshwaran, S.; Jones, A.; Anand, J. Lung Cancer Detection using VGG NET 16 Architecture. J. Physics Conf. Ser. 2021, 2040, 012001. [Google Scholar] [CrossRef]
  31. Alyaa, J.J.; Naglaa, M.R. Infrared Thermal Image Gender Classifier Based on the Deep ResNet Model. Adv. Hum-Compute. Inter. 2022, 2022, 3852054. [Google Scholar]
  32. Zhang, H.; Wang, Z.; Guo, Y.; Ma, Y.; Cao, W.; Chen, D.; Yang, S.; Gao, R. Weed Detection in Peanut Fields Based on Machine Vision. Agriculture 2022, 12, 1541. [Google Scholar] [CrossRef]
  33. Fu, L.; Lv, X.; Wu, Q.; Pei, C. Field Weed Recognition Based on an Improved VGG With Inception Module. Int. J. Agric. Environ. Inf. Syst. 2020, 11, 13. [Google Scholar] [CrossRef]
  34. Haq, M.A. CNN Based Automated Weed Detection System Using UAV Imagery. Comput. Syst. Sci. Eng. 2022, 42, 837–849. [Google Scholar] [CrossRef]
  35. Russakovsky, O.; Deng, J.; Su, H.; Krause, J.; Satheesh, S.; Ma, S.; Huang, Z.; Karpathy, A.; Khosla, A.; Bernstein, M.; et al. ImageNet Large Scale Visual Recognition Challenge. Int. J. Comput. Vision 2015, 115, 211–252. [Google Scholar] [CrossRef]
  36. Awan, M.J.; Masood, O.A.; Mohammed, M.A.; Yasin, A.; Zain, A.M.; Damaševičius, R.; Abdulkareem, K.H. Image-Based Malware Classification Using VGG19 Network and Spatial Convolutional Attention. Electronics 2021, 10, 2444. [Google Scholar] [CrossRef]
  37. Cao, W.; Feng, Z.; Zhang, D.; Huang, Y. Facial Expression Recognition via a CBAM Embedded Network. Procedia Comput. Sci. 2020, 174, 463–477. [Google Scholar] [CrossRef]
  38. Srivastava, N.; Hinton, G.; Krizhevsky, A.; Sutskever, I.; Salakhutdinov, R. Dropout: A simple way to prevent neural networks from overfitting. J. Mach. Learn. Res. 2014, 15, 1929–1958. [Google Scholar]
  39. Chen, J.; Wang, H.; Zhang, H.; Luo, T.; Wei, D.; Long, T.; Wang, Z. Weed detection in sesame fields using a YOLO model with an enhanced attention mechanism and feature fusion. Comput. Electron. Agric. 2022, 202, 107412. [Google Scholar] [CrossRef]
  40. Dos Santos Ferreira, A.; Freitas, D.M.; da Silva, G.G.; Pistori, H.; Folhes, M.T. Weed detection in soybean crops using ConvNets. Comput. Electron. Agric. 2017, 143, 314–324. [Google Scholar] [CrossRef]
  41. Zhang, W.; Wang, J.; Guo, X.; Chen, K.; Wang, N. Two-Stream RGB-D Human Detection Algorithm Based on RFB Network. IEEE Access 2020, 8, 123175–123181. [Google Scholar] [CrossRef]
  42. Xie, J.; Zhu, M.; Hu, K. Improved seabird image classification based on dual transfer learning framework and spatial pyramid pooling. Ecol. Inform. 2022, 72, 101832. [Google Scholar] [CrossRef]
Figure 1. Example diagram of different growth states: (a) Soybean, (b) Gramineae, (c) Broadleaf, (d) Soybean + Gramineae, (e) Soybean + Broadleaf, (f) Gramineae + Broadleaf, and (g) Soybean + Gramineae + Broadleaf.
Agriculture 13 00175 g001
Figure 2. Sample data enhancement diagram.
Agriculture 13 00175 g002
Figure 3. Structure diagram of Faster R-CNN. Note: p represents the predicted probability of the current category.
Agriculture 13 00175 g003
Figure 4. CBAM structure and VGG19-CBAM structure.
Agriculture 13 00175 g004
Figure 5. Map of evaluation indicators. Note: From top to bottom, the indicator charts are those of AP, P, R, and F1.
Agriculture 13 00175 g005aAgriculture 13 00175 g005b
Figure 6. Results of the three target detection identification methods. Note: The red, green, and blue (light blue) detection boxes in the figure are the detected soybean, grass weeds, and broadleaf weeds, respectively.
Agriculture 13 00175 g006
Figure 7. Identification results of soybean and weed with different growth states and ratios. Note: The red, green, and blue detection boxes in the figure are the detected soybean, grass weed, and broadleaf weed, respectively.
Agriculture 13 00175 g007
Table 1. Test platform configuration table.
ConfigurationParameter
Operating SystemWindows 10 Professional Workstation Edition
CPUXeon Gold 6248R*2 [48 cores 3 GHz]
GPUNVIDIA RTX4000
Accelerate EnvironmentCUDA10.0 CuDNN7.4.1.5
TensorFlow1.13.2
Python3.7
Data Annotation ToolsLabelImg
Table 2. Comparison of the recognition accuracy of three feature extraction networks.
Feature Extraction NetworkAccuracy (AP)/%Average Recognition
Time/ms
SoybeanGrass WeedBroadleaf WeedmAP
ResNet5095.6889.3895.2993.45338
VGG1695.4689.4695.6293.51330
VGG1995.3489.5895.7193.55316
Table 3. Comparison of results before and after embedding attention mechanism.
MethodsF1R/%P/%mAPAverage Recognition Time/ms
Faster R-CNN (VGG19)0.8693.2280.6693.55316
Faster R-CNN (VGG19) + CBAM(Block4)0.9297.5787.2698.94350
Faster R-CNN (VGG19) + CBAM(Block5)0.9498.2089.499.05347
Faster R-CNN (VGG19) + CBAM(Block4,5)0.9598.9690.299.16336
Note: F1, R, and P are the average values of the three target categories (soybean, grassy weeds, and broadleaf weeds).
Table 4. Comparison table of the performance of the three methods.
MethodsFaster R-CNN + CBAM
(VGG19)
SSD
(VGG16)
Yolov4
(CSPDarkNet53)
Indicators
Soybean identification accuracy99.0296.9997.83
Grass weed identification accuracy99.3095.3997.00
Accuracy of broadleaf weed recognition99.1697.9098.21
F1/%0.950.910.94
R/%98.9694.2891.94
P/%90.2087.7996.64
mAP/%99.1696.9297.92
Average recognition time/ms336450386
Table 5. Validation accuracy table.
CategoryAccuracy Rate/%Average Accuracy Rate/%Average Recognition Time/ms
Soybean90.0692.69590
Grass weed87.96
Broadleaf weed92.69
Disclaimer/Publisher’s Note: The statements, opinions and data contained in all publications are solely those of the individual author(s) and contributor(s) and not of MDPI and/or the editor(s). MDPI and/or the editor(s) disclaim responsibility for any injury to people or property resulting from any ideas, methods, instructions or products referred to in the content.

