
Design and Experimental Study of a Bionic Blade for Harvesting the Wild Chrysanthemum Stem

Abstract
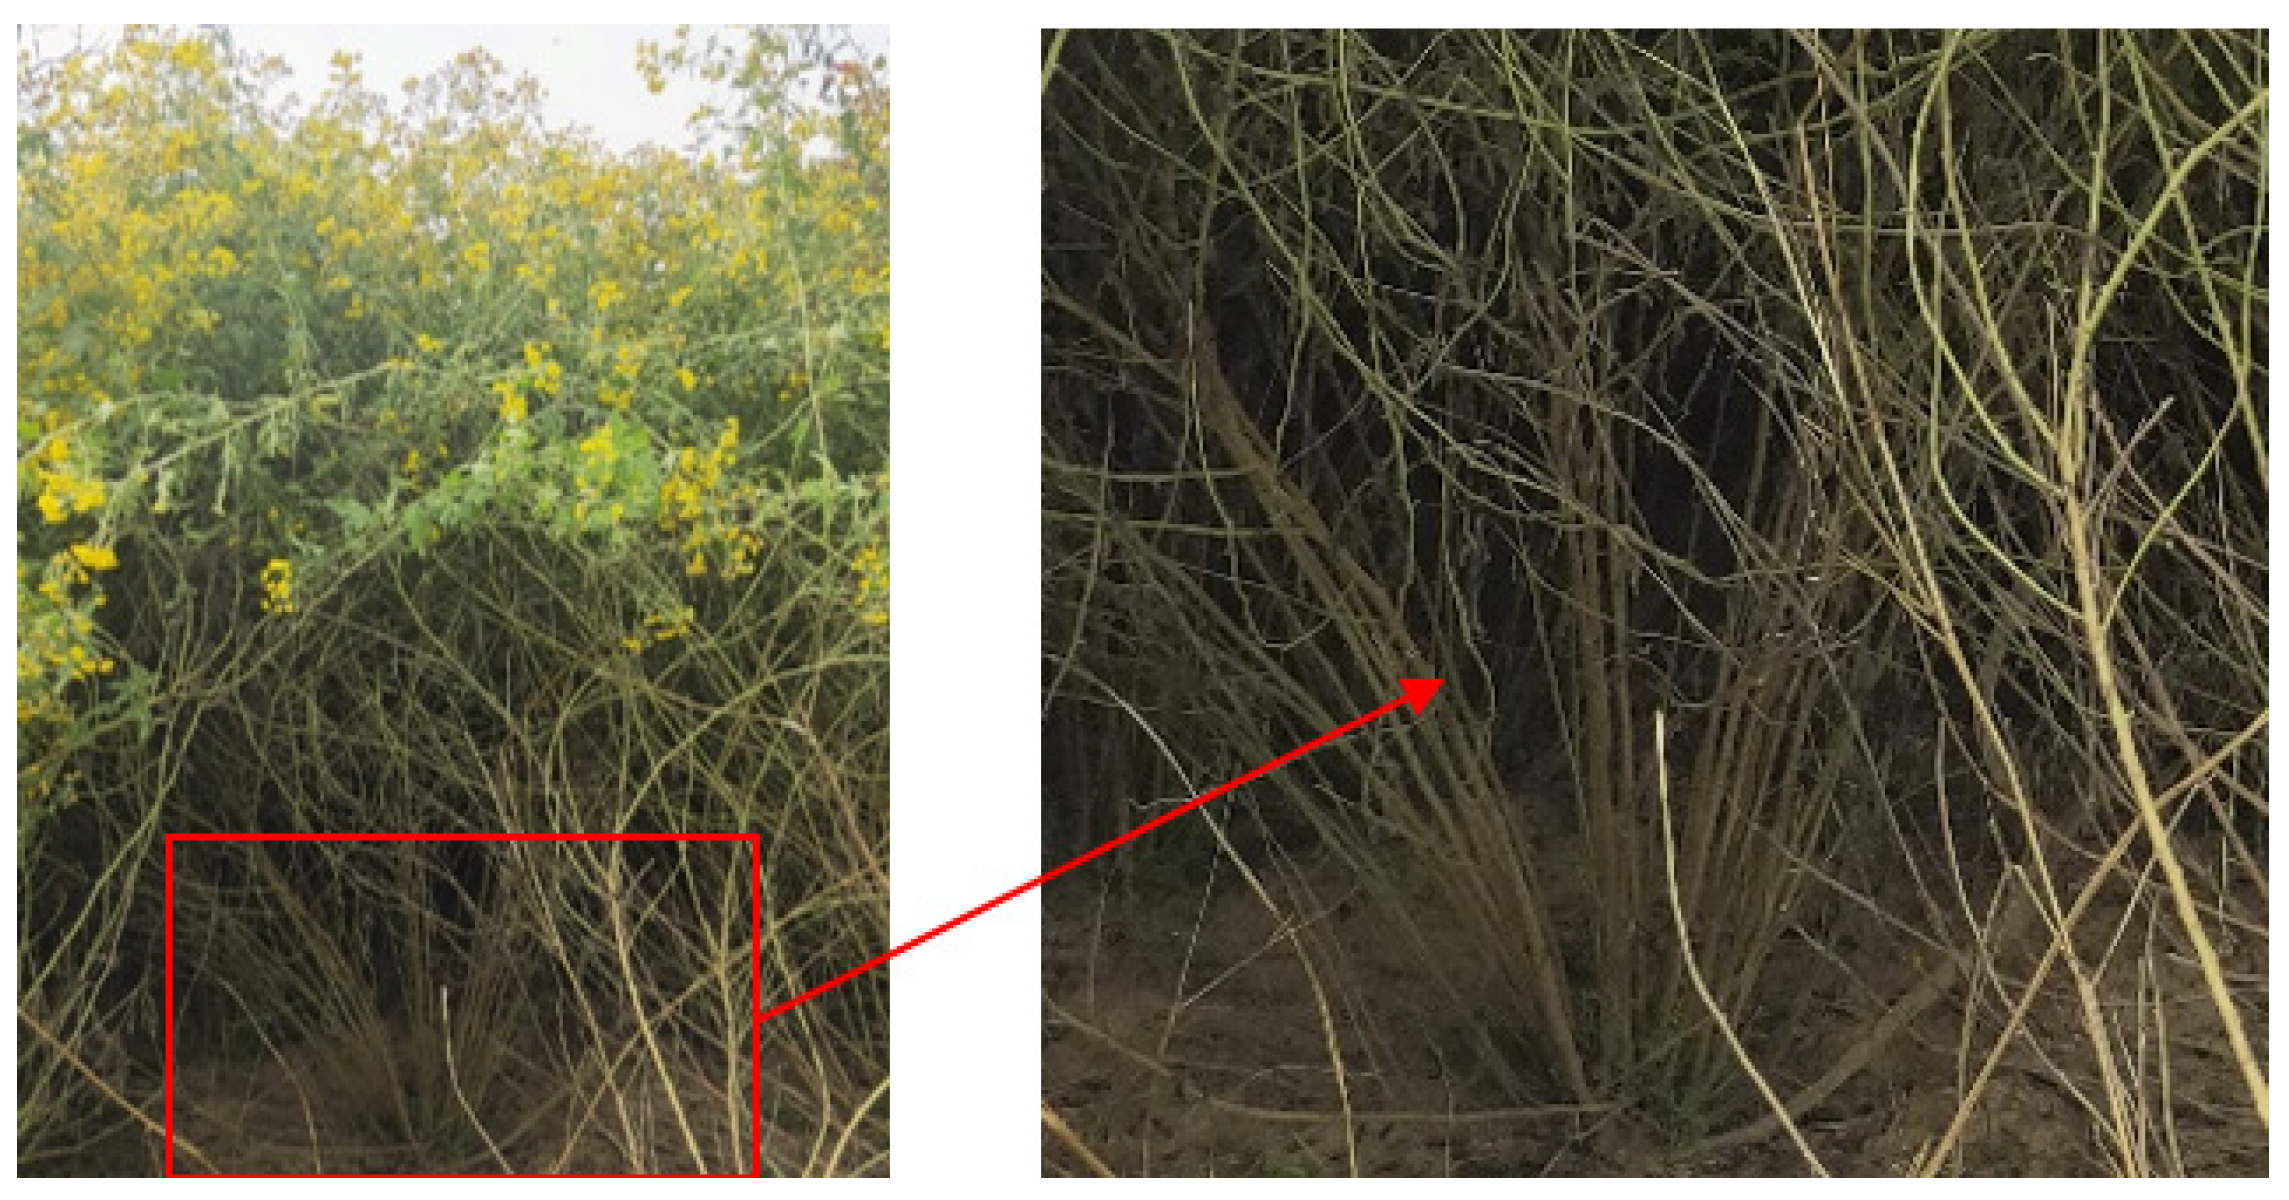
:1. Introduction
2. Materials and Methods
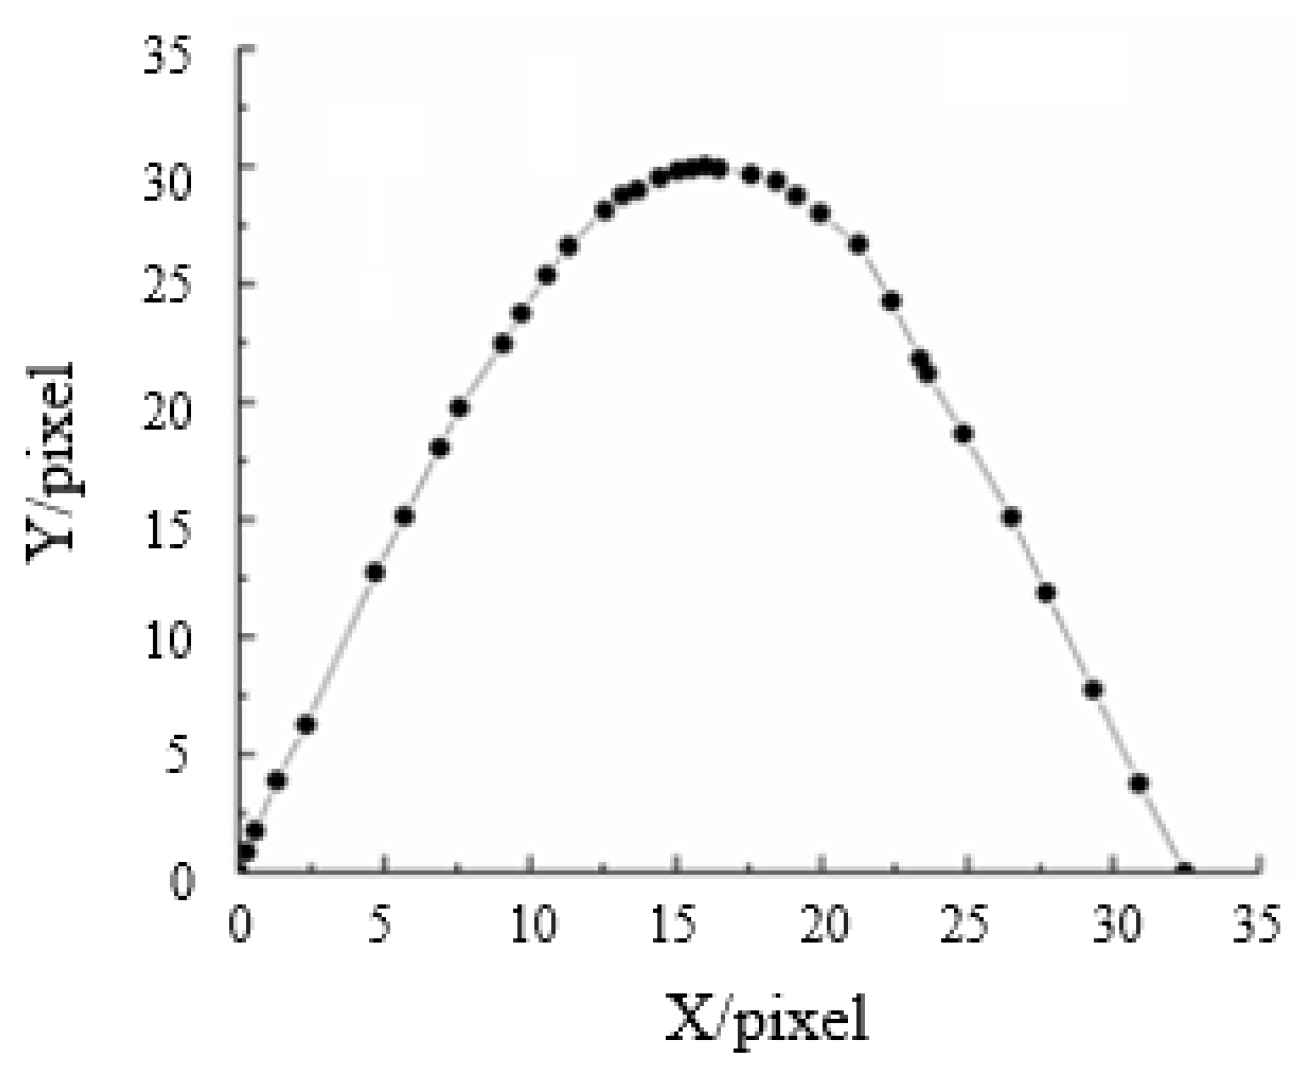
2.1. Selecting the Cricket’s Contour Curve
2.2. Blade Design
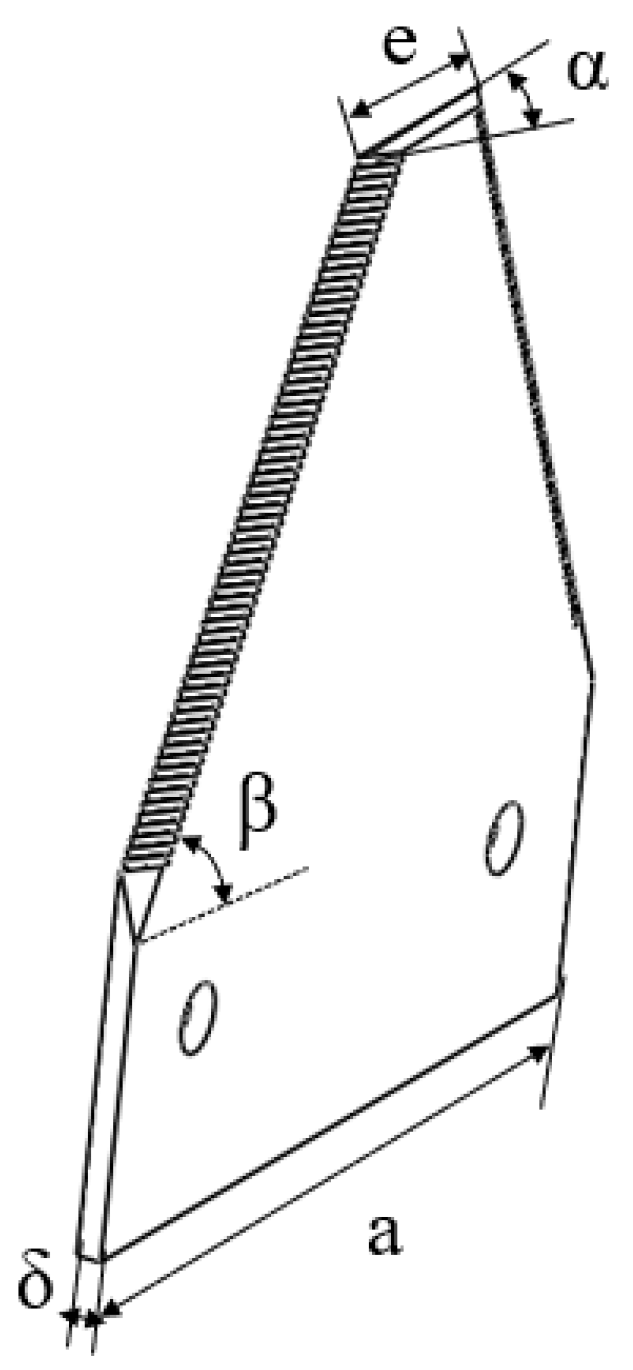
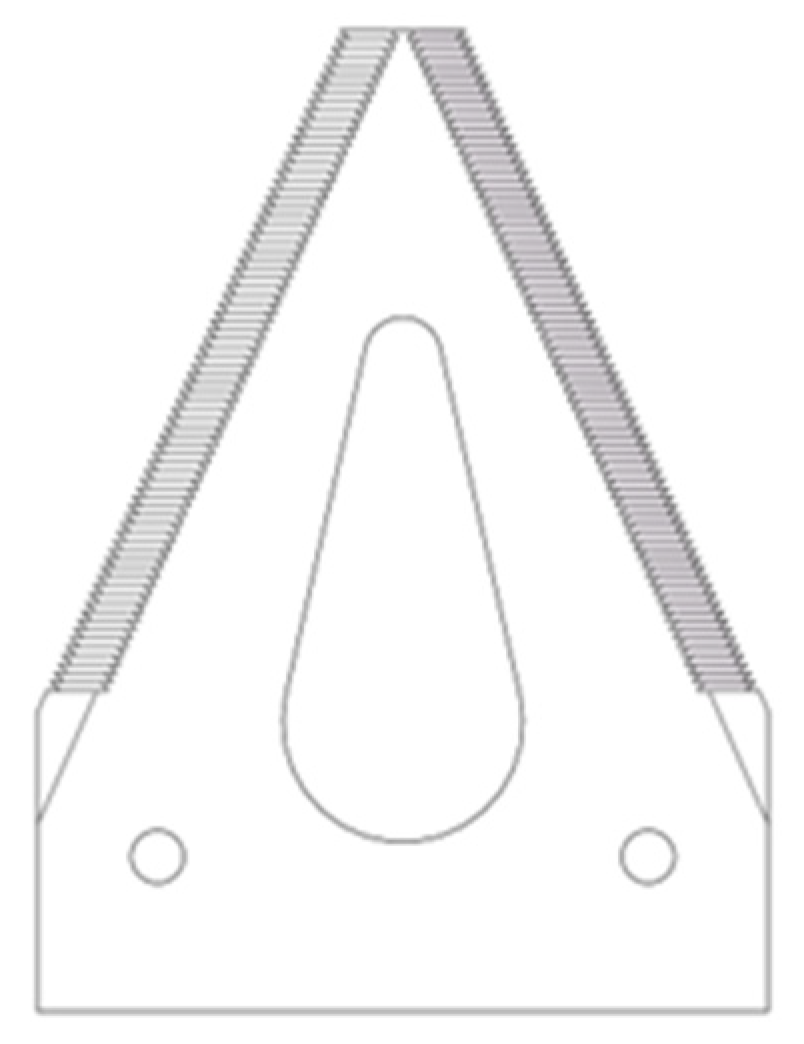
2.2.1. Moving Blade Design
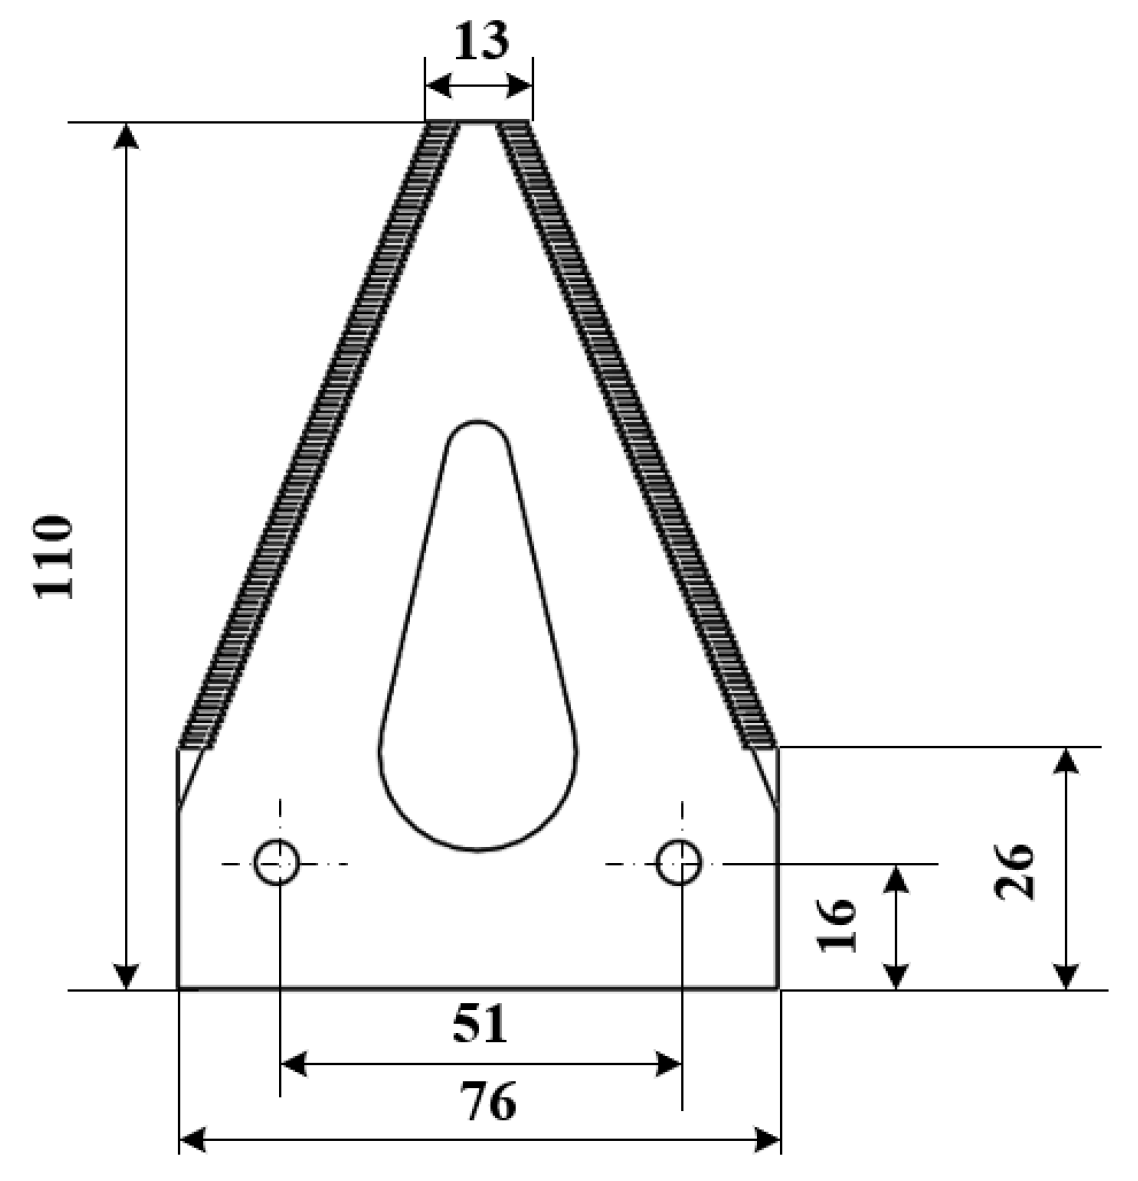
2.2.2. Fixed Blade Selection
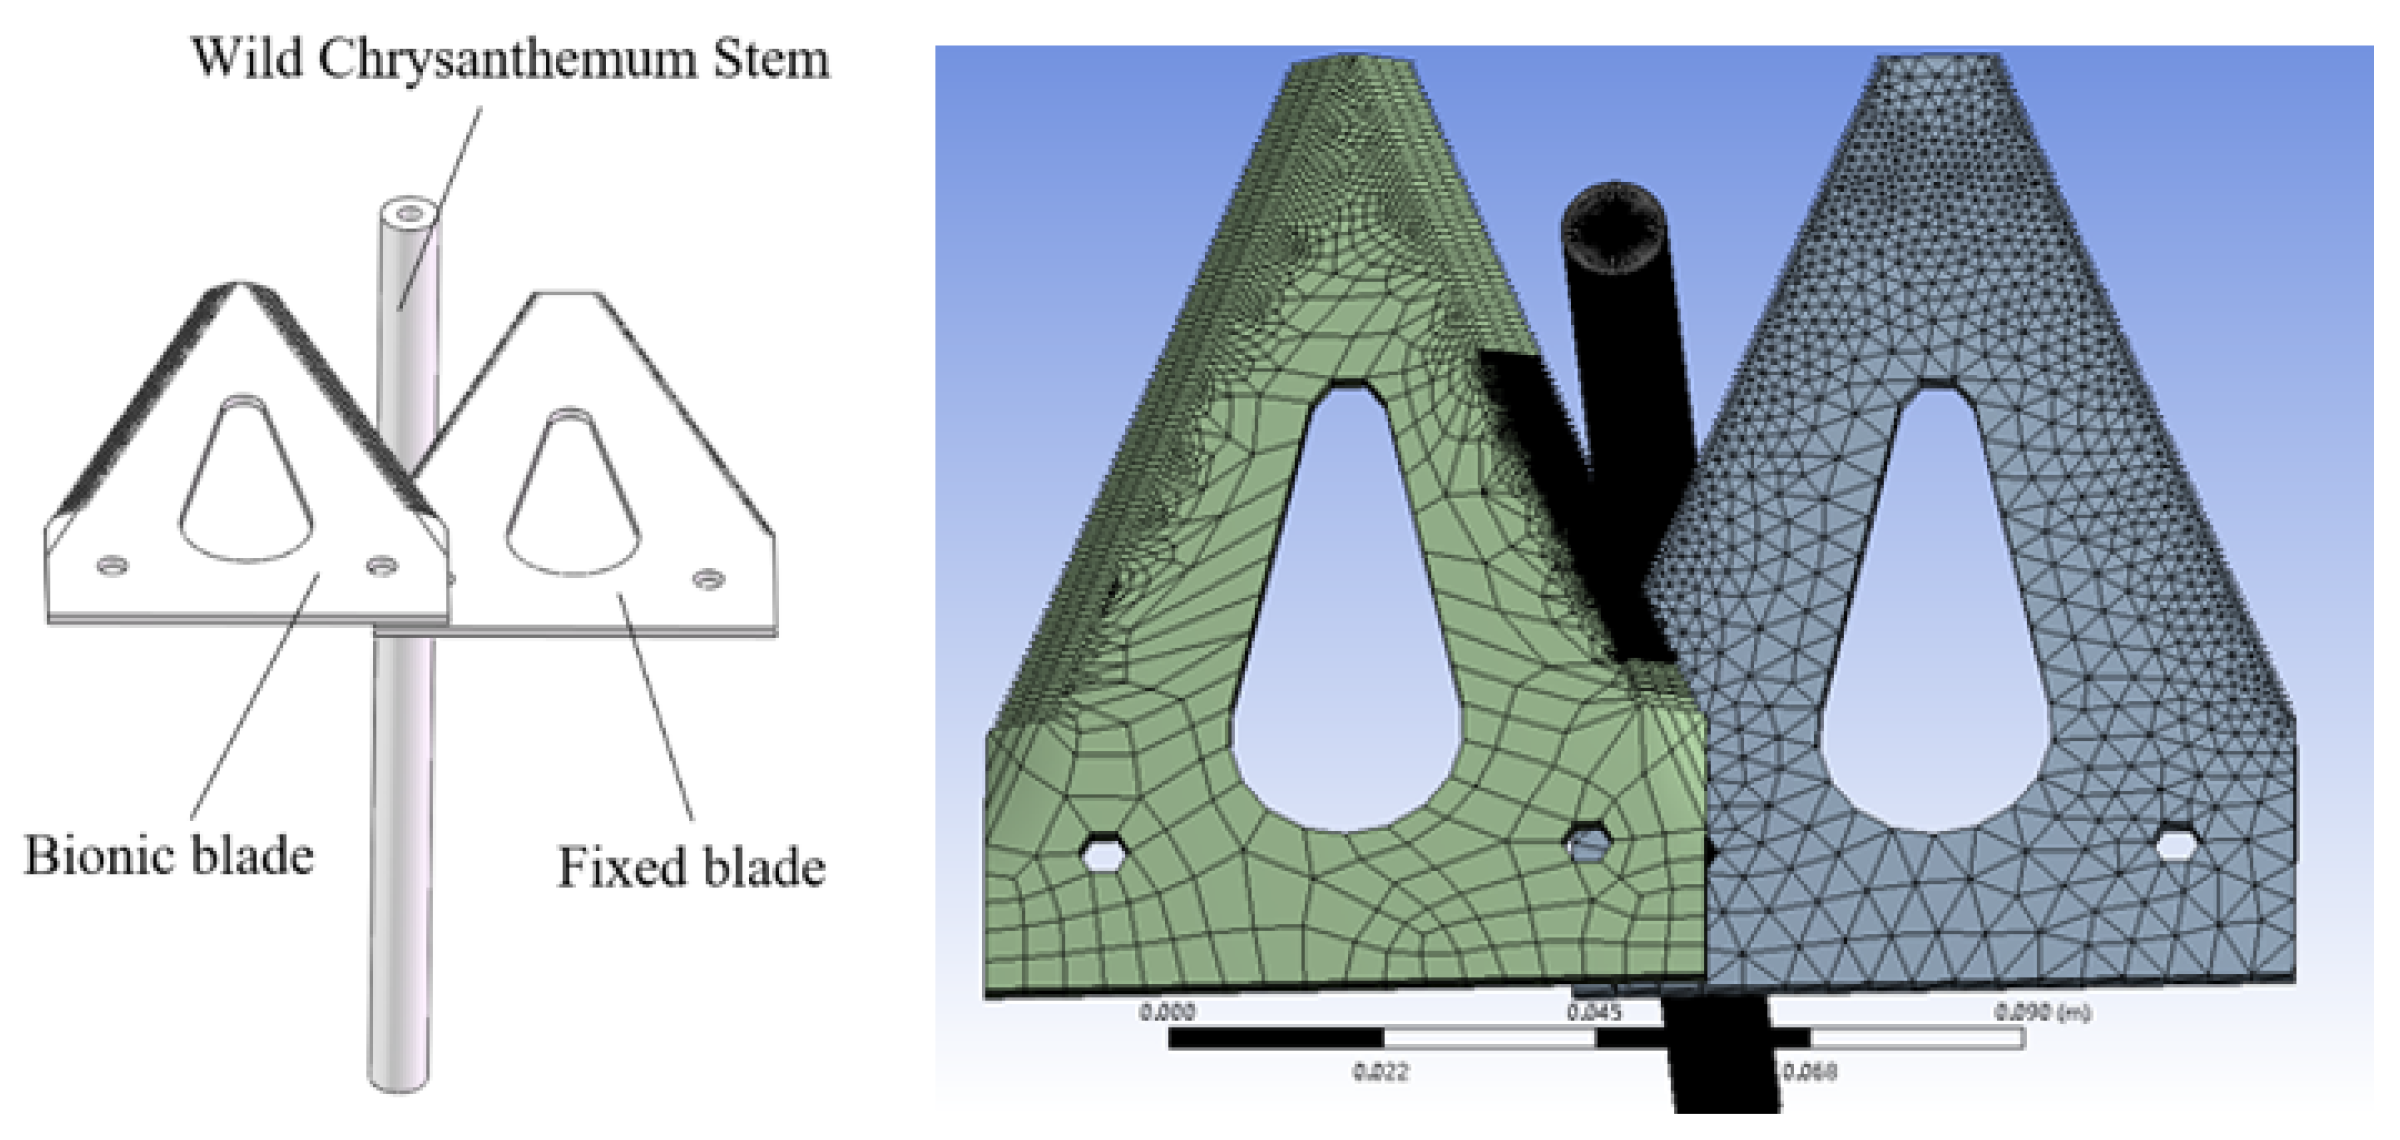
2.3. Establishing the Finite Element Model
2.3.1. Model Simplification
- (1)
- The inner medulla of the stem was ignored, and the stem was regarded as a hollow cylinder with a diameter of 11 mm and an inner diameter of 4.51 mm;
- (2)
- The soil constraint on the stem of the wild chrysanthemum was regarded as the fixed-end constraint;
- (3)
- The modeling object was a single stem without considering the interaction between stems;
- (4)
- The stem geometric model was simplified, and the stem length was set to 30 cm;
- (5)
- The cutting position was set to 10 cm from the top of the stem.
2.3.2. Establishing the Cutting System
2.4. Experimental Design
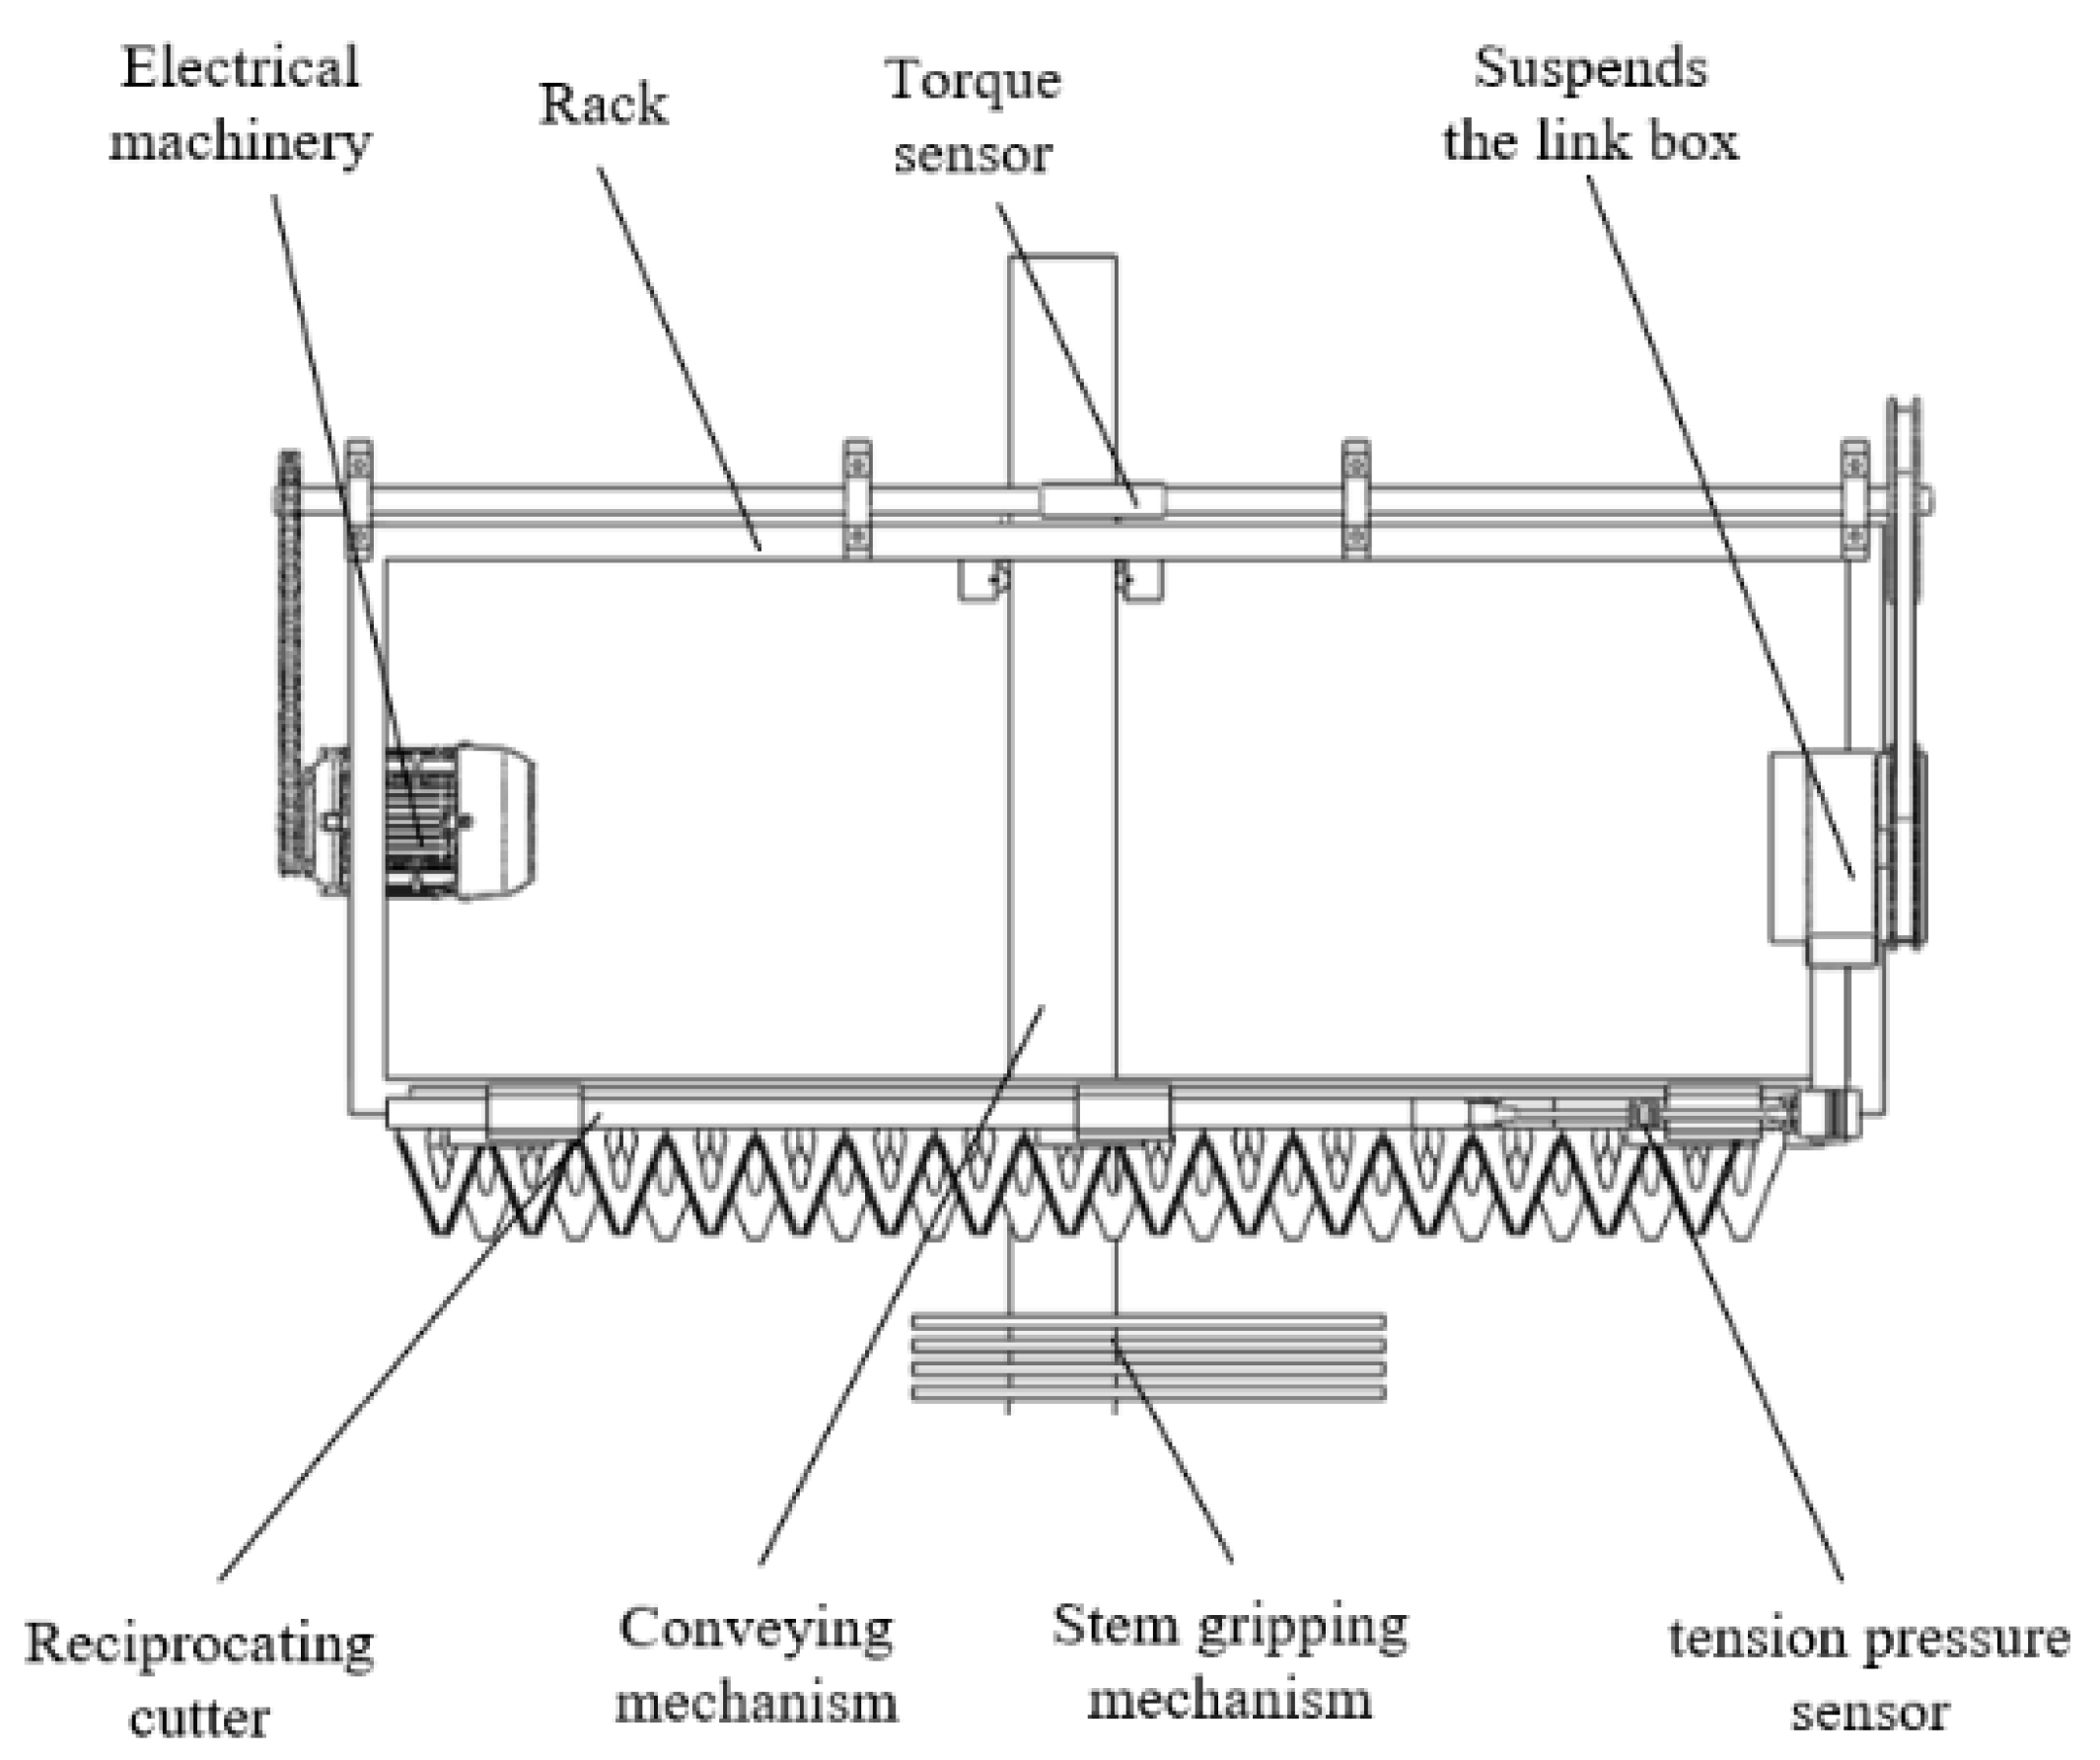
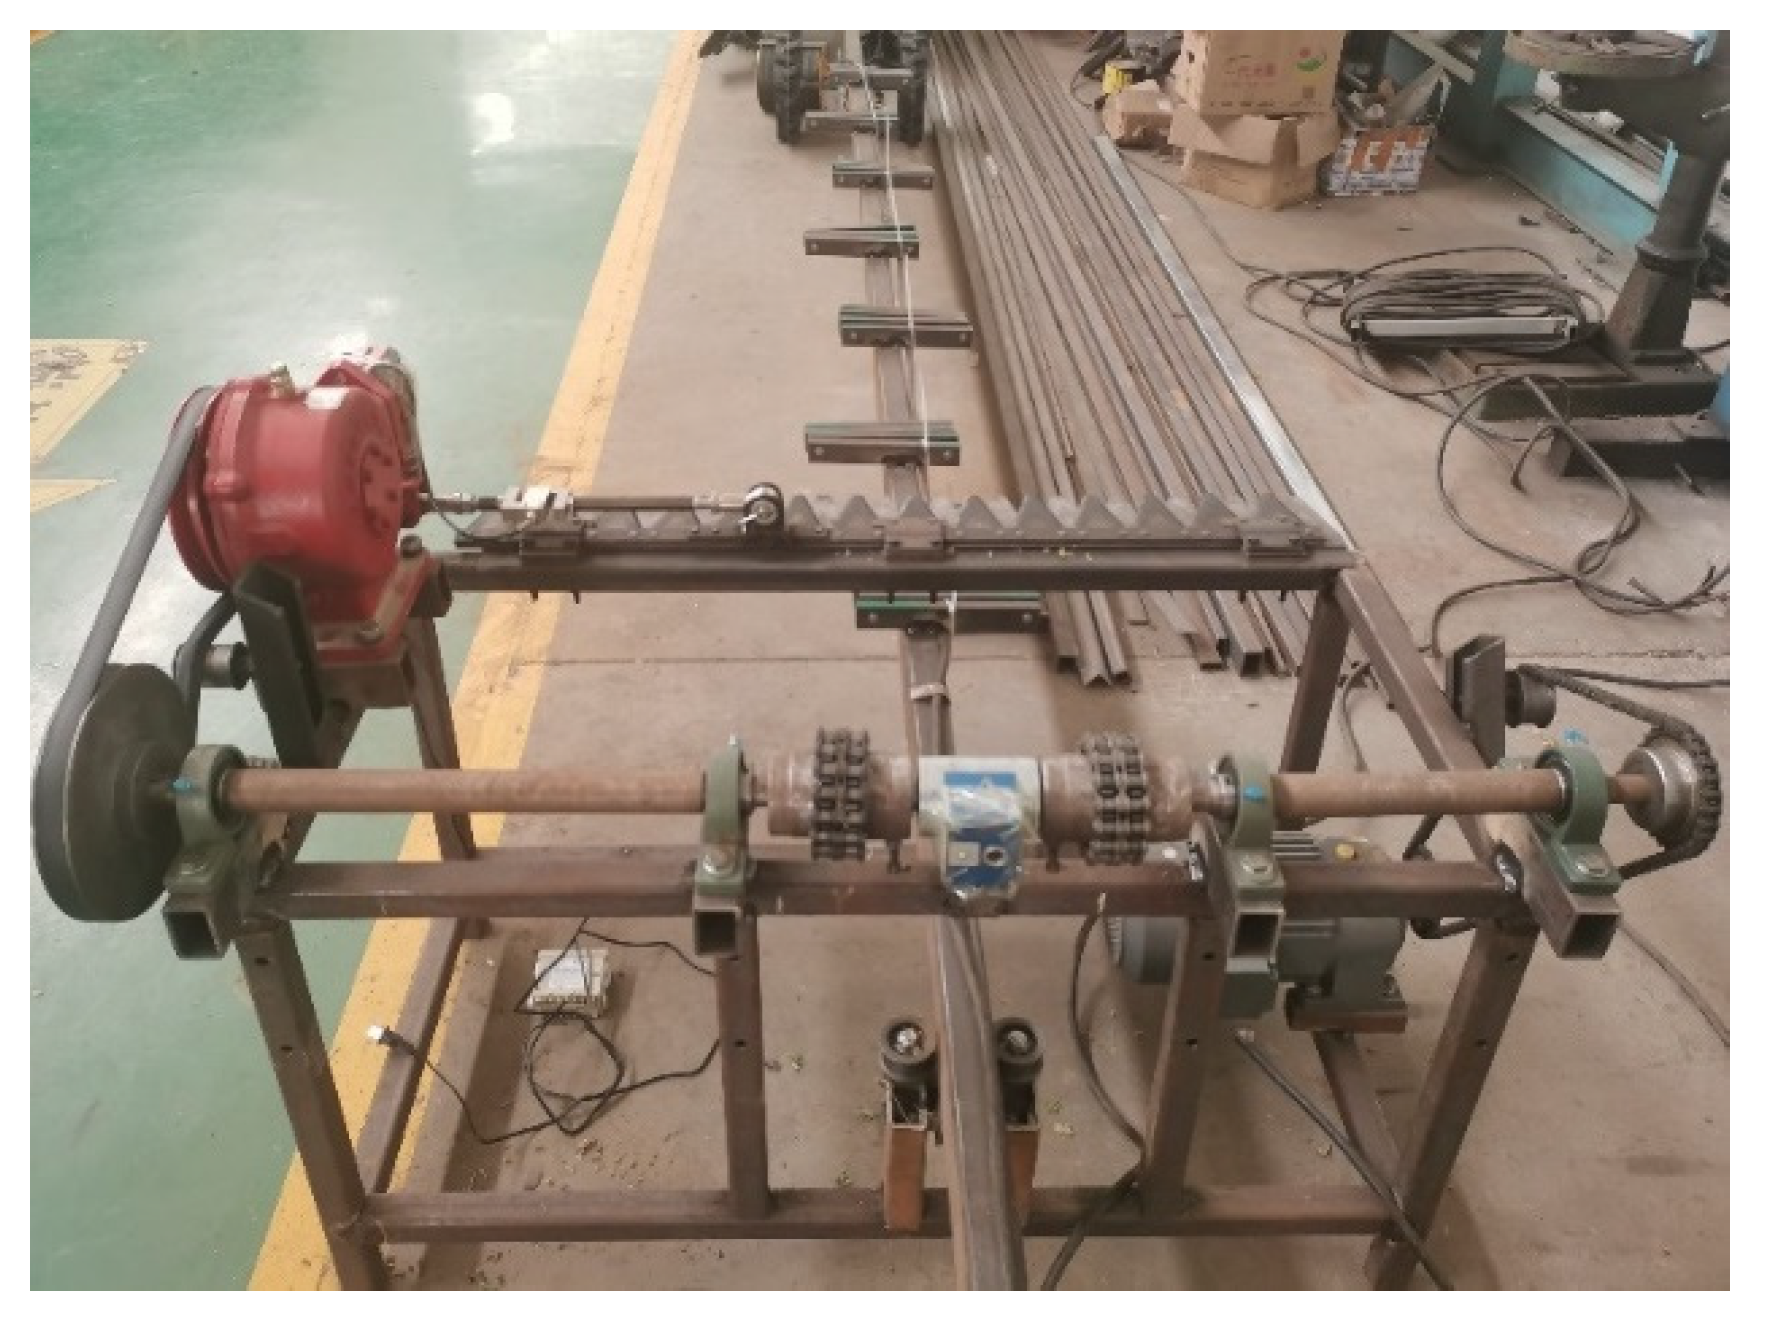
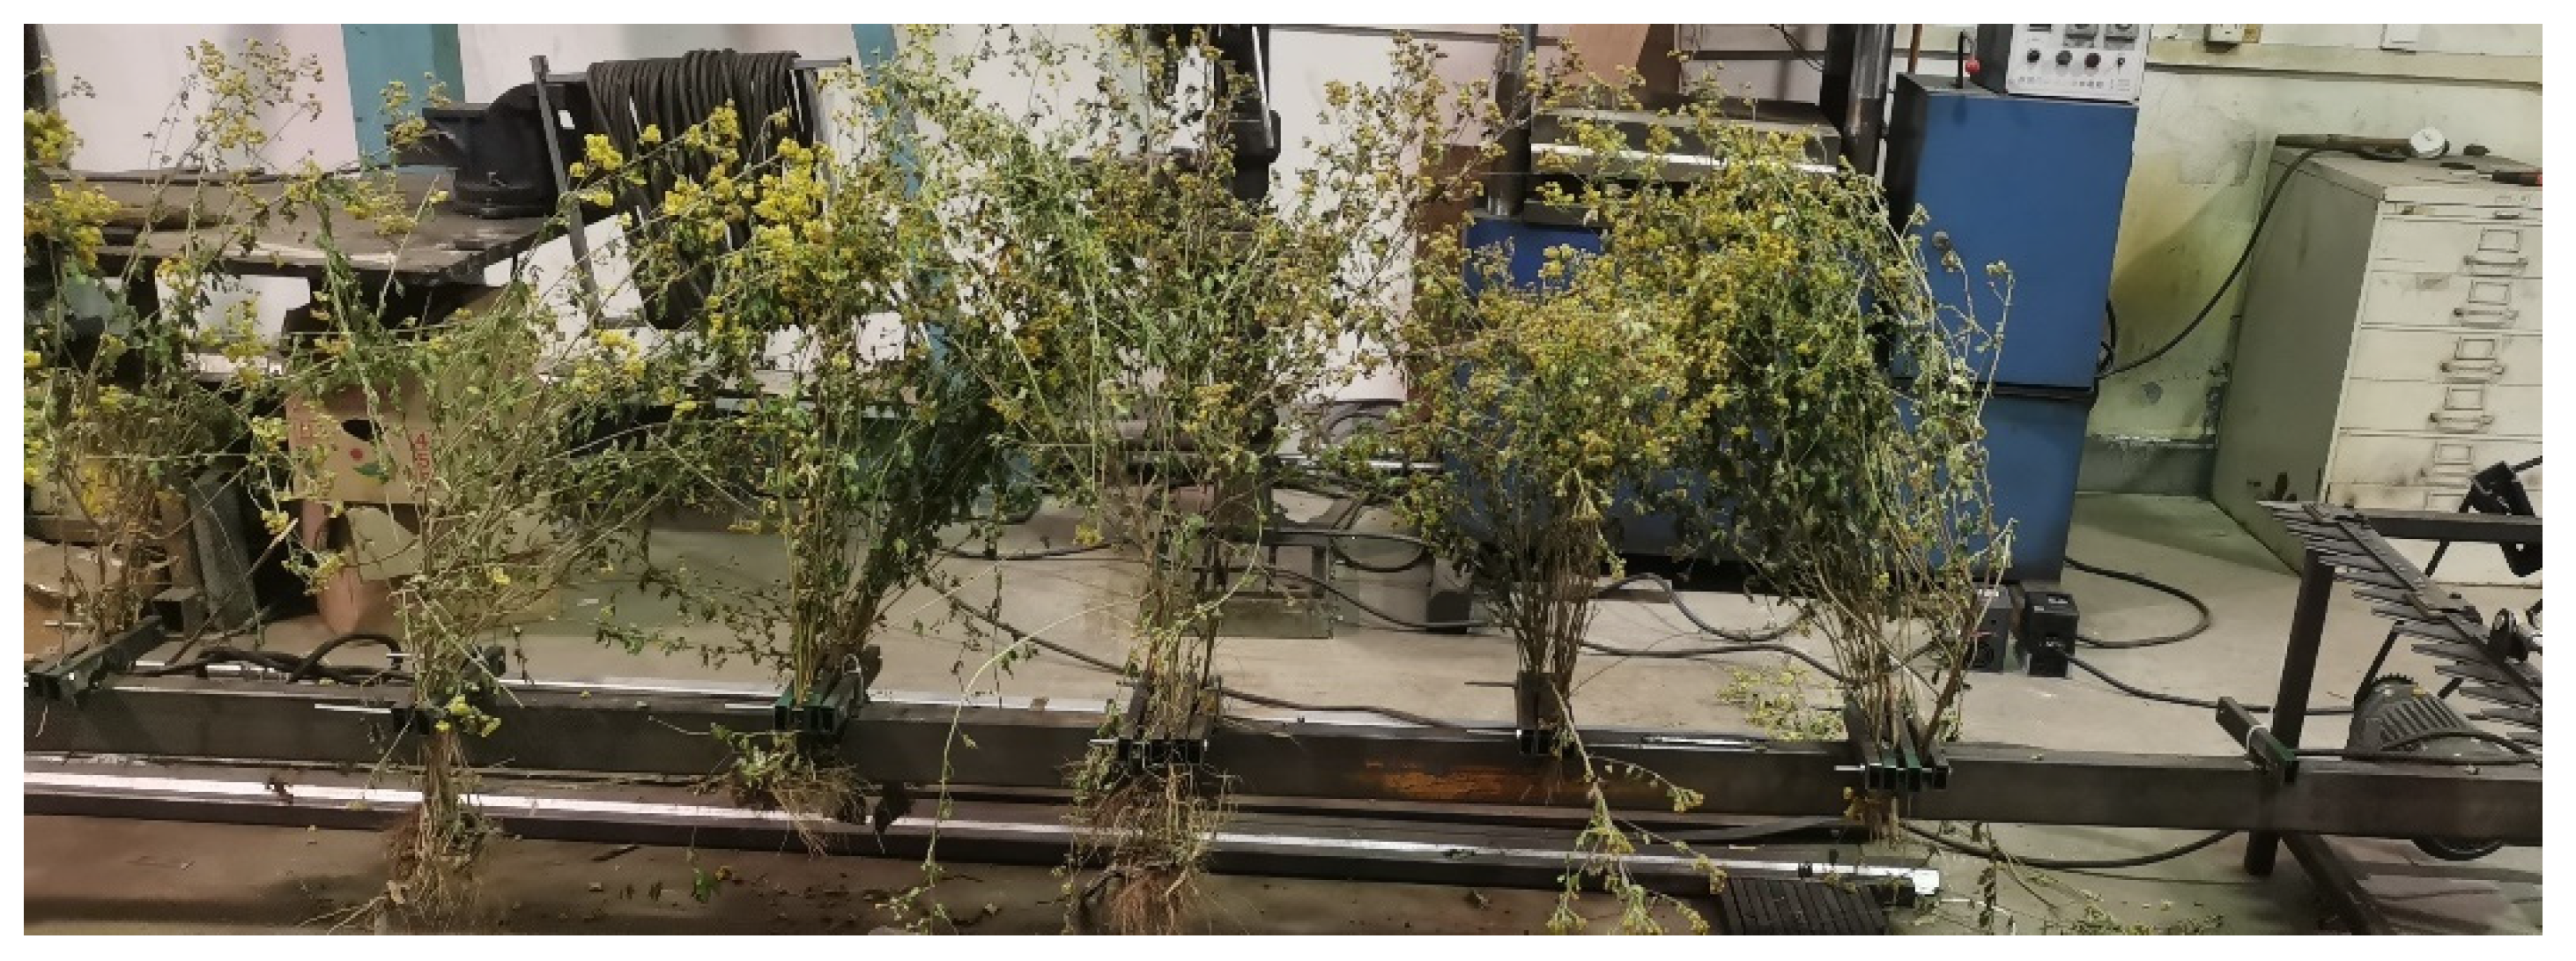
2.5. Bench Tests
2.5.1. Test Materials and Equipment
2.5.2. Operating Principle
3. Results and Discussion
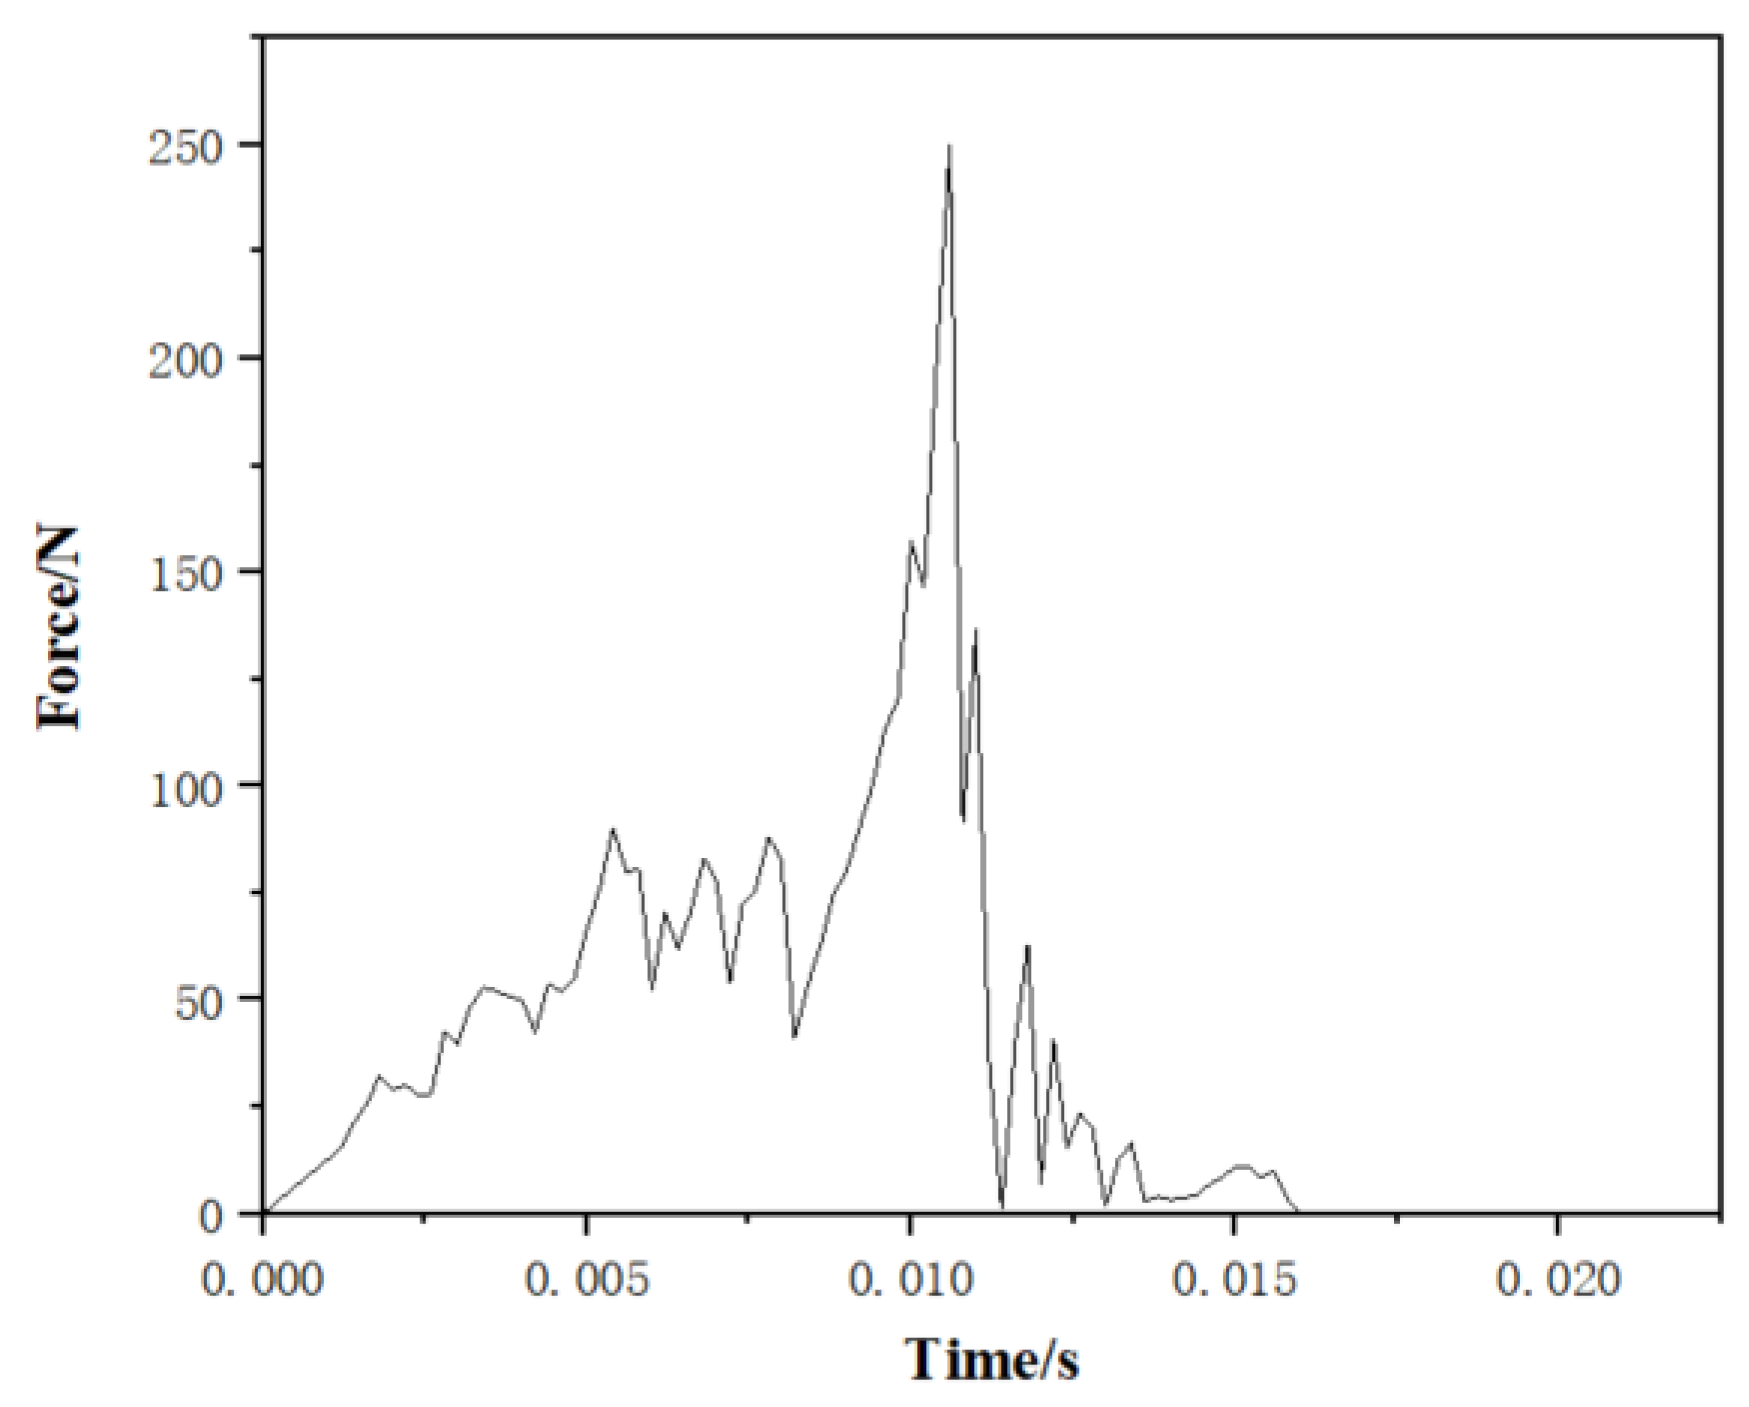
3.1. Analysis of the Simulation Process
3.2. Central Composite Design Experiment
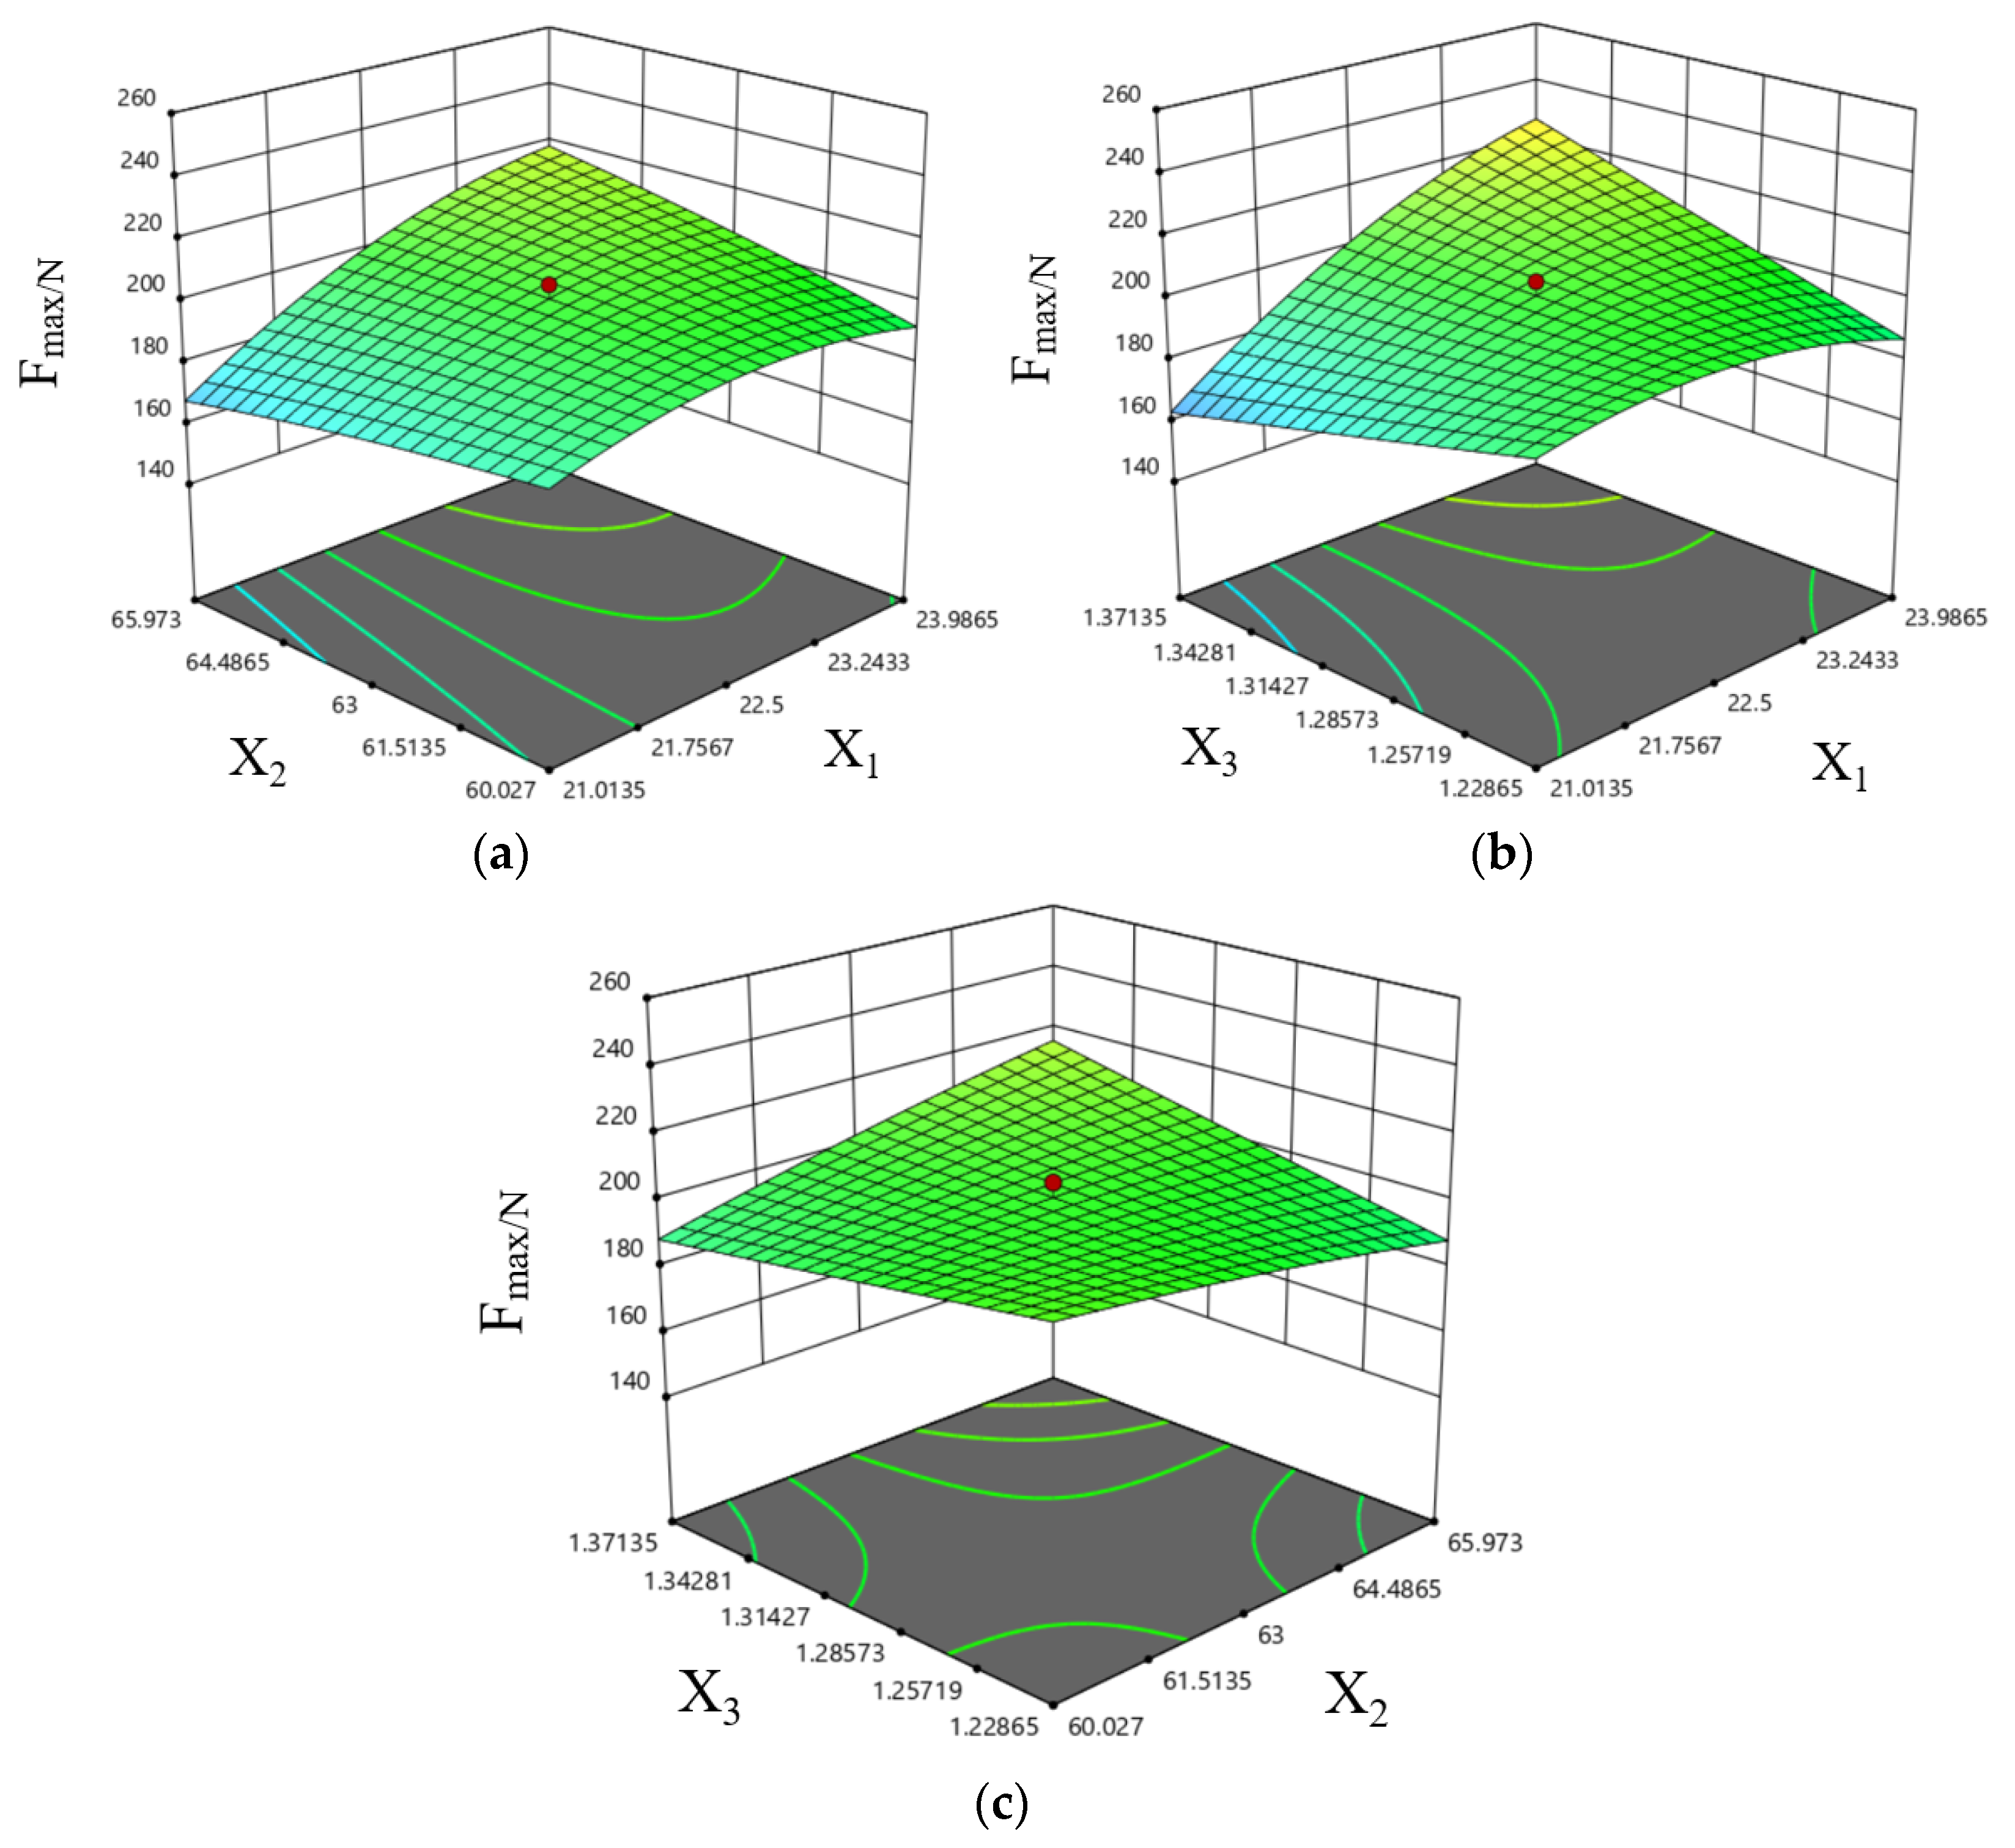
3.3. Response Surface Interaction Analysis
3.3.1. Maximum Shear Force
3.3.2. Power Consumption
3.4. Parameter Optimization
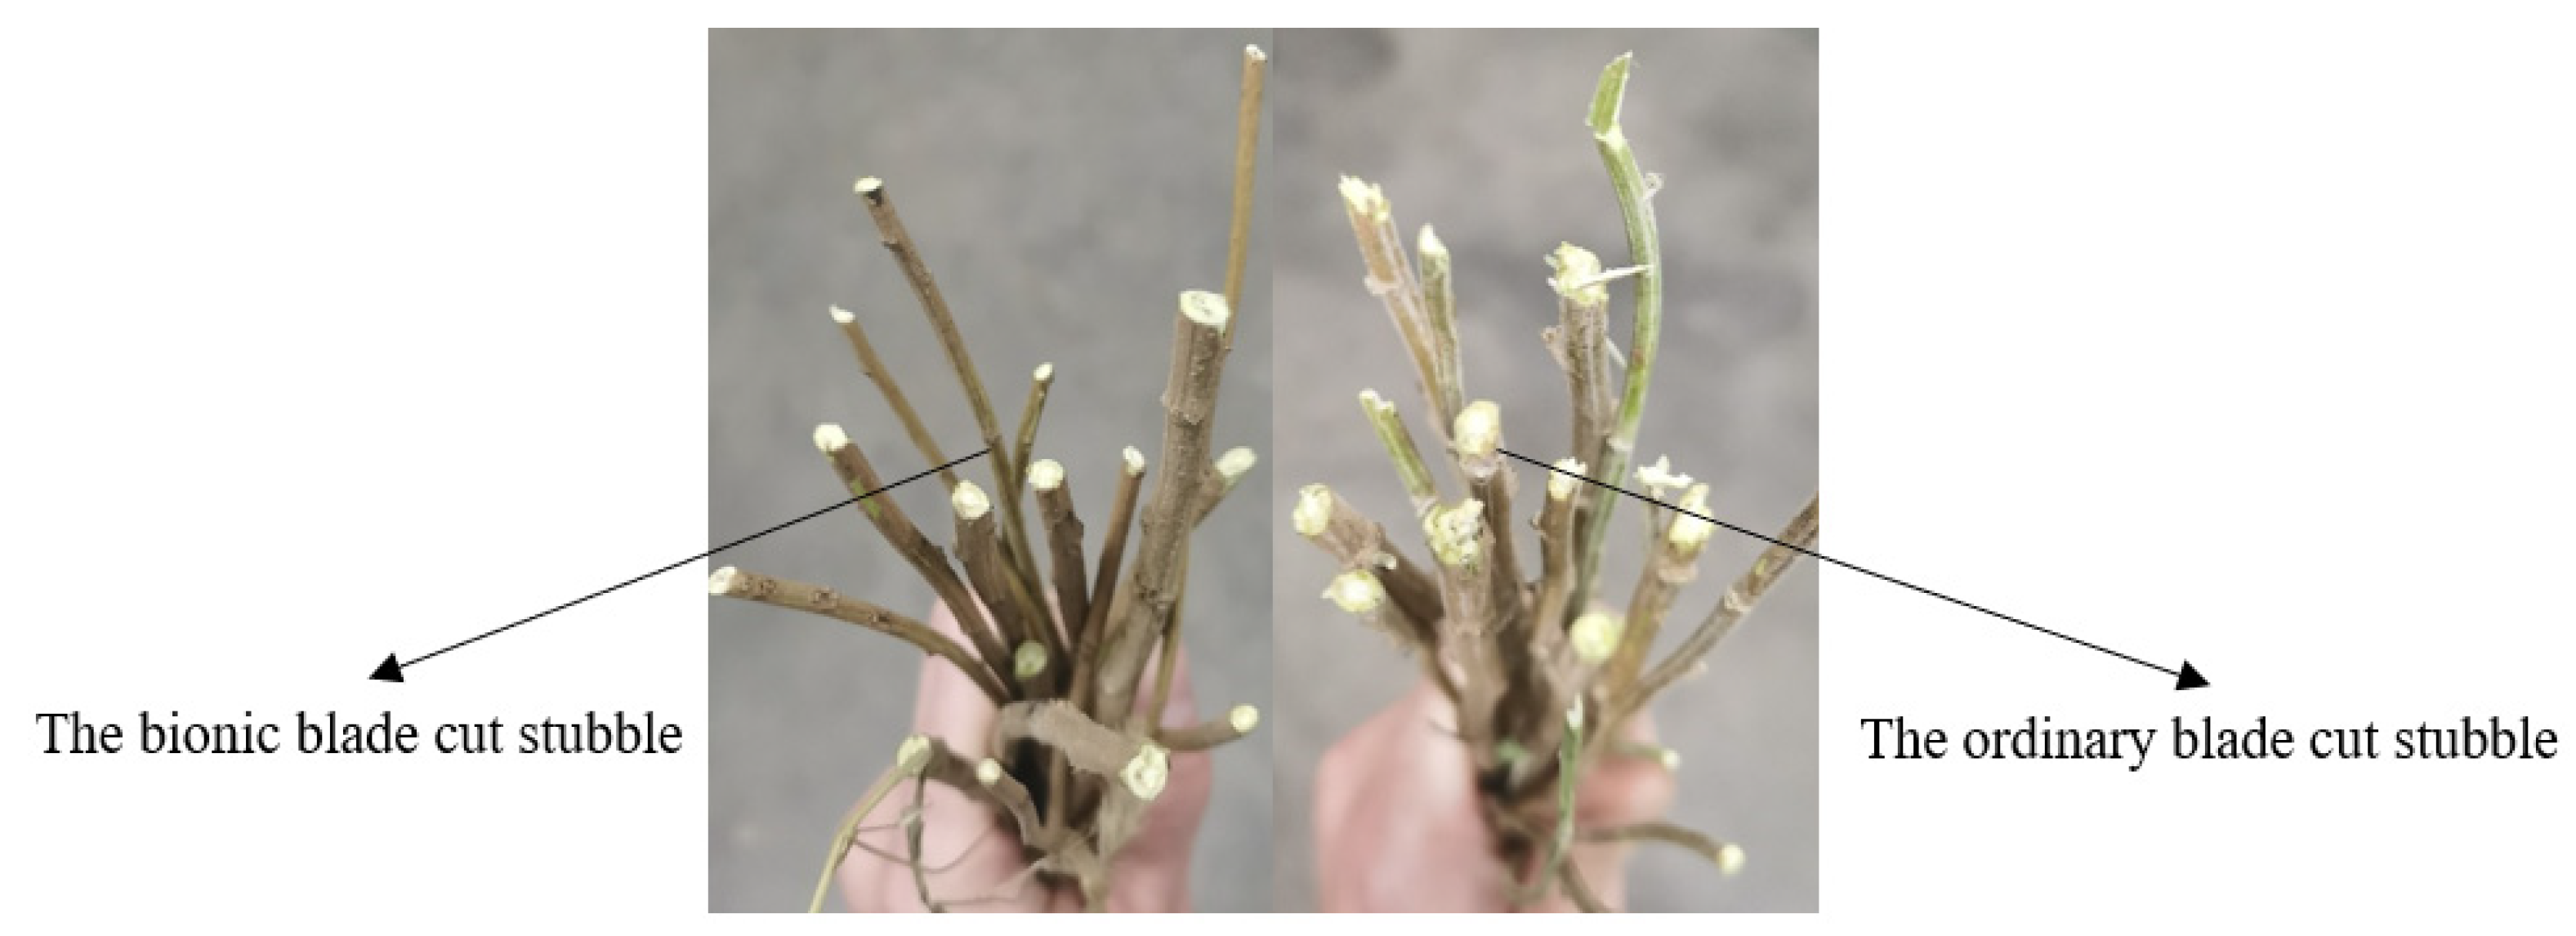
3.5. Contrast Test
3.6. Analysis of Bench Test Results
4. Conclusions
- (1)
- Combined with bionics, the bionic cutting blade was designed by replacing the sharp triangular teeth of the ordinary harvester blade with the contour of the cricket’s upper jaw incisor lobe. The cutting-edge angle, cutting angle, and reciprocating speed were used as test factors by employing the finite element method. The maximum shear force and power consumption were used as evaluation indexes. The bionic body was optimized, and optimal cutting speed was determined by employing the center combination simulation test. The maximum shear force and power consumption were minimized when the cutting-edge angle was 21°, the cutting angle was 66°, and the reciprocating speed was 1.29 m/s;
- (2)
- A comparison test was conducted between the ordinary blade and the bionic blade to cut the stems of the wild chrysanthemum and validate the cutting performance of the bionic blade. The results showed that the bionic blade had a stronger cutting performance, the maximum shear force was reduced by 18%, and the cutting power consumption was reduced by 15.8%;
- (3)
- A cutting bench was set up to verify the performance of the bionic cutting blade for wild chrysanthemum stems. Contrary to the simulation test, an entire plant of wild chrysanthemum was cut in the bench test. The results showed that the maximum shear force and power consumption of the bionic cutting blade for the stems of wild chrysanthemums were reduced by 10.5% and 10.8%, respectively. The results can provide a reference for the mechanical harvesting of chrysanthemum stems;
- (4)
- This paper only optimized the cutter through simulation and bench experiment, and field experiments should be carried out in the later research on this basis, so that the results obtained will be more reliable.
Author Contributions
Funding
Institutional Review Board Statement
Data Availability Statement
Conflicts of Interest
References
- Li, G.; Chen, Y.; Wang, P.; Guan, R.; Ye, Y.; Zhao, J.; You, A.; Bi, Y. Protection of terpenes and flavonoids from Chrysanthemi Indici Flos on immunological liver injury. Chin. Tradit. Herb. Drugs 2013, 44, 3510–3514. [Google Scholar]
- Jiang, Z.; Li, X.; Luo, B. Anti-inflammatory and Analgesic Effects of Essential Oil from Chrysanthemi Indici Flos. Chin. J. Exp. Tradit. Med. Formulae 2015, 21, 124–127. [Google Scholar]
- Lu, Y. Significance and progress of bionics. J. Bionic Eng. 2004, 1, 1–3. [Google Scholar]
- Jia, H.; Li, C.; Zhang, Z.; Wang, G. Design of bionic saw blade for corn stalk cutting. J. Bionic Eng. 2013, 10, 497–505. [Google Scholar] [CrossRef]
- Soni, P.; Salokhe, V. Influence of dimensions of UHMW-PE protuberances on sliding resistance and normal adhesion of bangkok clay soil to biomimetic plates. J. Bionic Eng. 2006, 3, 63–71. [Google Scholar] [CrossRef]
- Soni, P.; Salokhe, V.; Nakashima, H. Modification of a mouldboard plough surface using arrays of polyethylene protuberances. J. Terramechanics 2007, 44, 411–422. [Google Scholar] [CrossRef]
- Qaisrani, A.; Chen, B.; Ren, L. Modified and unsmoothed plow surfaces-a means to reduce plowing resistance. Int. Agric. Eng. J. 1992, 1, 115–124. [Google Scholar]
- Qaisrani, A.; Tong, J.; Ren, L. The effects of unsmoothed surfaces on soil adhesion and draft of bulldozing plates. Trans. Chin. Soc. Agric. Eng. 1993, 9, 7–13. [Google Scholar]
- Meyers, M.; Lin, A.; Lin, Y. The cutting edge: Sharp biological materials. JOM 2008, 60, 19–24. [Google Scholar] [CrossRef]
- Chang, Z.; Liu, W.; Tong, J.; Li, G.; Xie, H.; Yang, X.; Mu, H.; Chen, D. Design and Experiments of Biomimetic Stubble Cutter. J. Bionic Eng. 2016, 13, 335–343. [Google Scholar] [CrossRef]
- Tian, K.; Li, X.; Shen, C.; Zhang, B.; Huang, J.; Wang, J.; Zhou, Y. Design and test of cutting blade of cannabis harvester based on longicorn bionic principle. Trans. Chin. Soc. Agric. Eng. 2017, 33, 56–61. [Google Scholar]
- You, C.; Zhao, G.; Chu, X.; Zhou, W.; Long, Y.; Lian, Y. Design, preparation and cutting performance of bionic cutting tools based on head microstructures of dung beetle. J. Manuf. Process. 2020, 58, 129–135. [Google Scholar] [CrossRef]
- Zhao, L.; Ma, J.; Chen, W.; Guo, H. Lightweight Design and Verification of Gantry Machining Center Crossbeam Based on Structural Bionics. J. Bionic Eng. 2011, 8, 201–206. [Google Scholar] [CrossRef]
- Abo-Elnor, M.; Hamilton, R.; Boyle, J. Simulation of soil–blade interaction for sandy soil using advanced 3D finite element analysis. Soil Tillage Res. 2004, 75, 61–73. [Google Scholar] [CrossRef]
- Bentaher, H.; Ibrahmi, A.; Hamza, E.; Hbaieb, M.; Kantchev, G.; Maalej, A.; Arnold, W. Finite element simulation of moldboard–soil interaction. Soil Tillage Res. 2013, 134, 11–16. [Google Scholar] [CrossRef]
- Wang, T.; Liu, Z.; Yan, X.; Mi, G.; Liu, S.; Chen, K.; Zhang, S.; Wang, X.; Zhang, S.; Wu, X. Finite Element Model Construction and Cutting Parameter Calibration of Wild Chrysanthemum Stem. Agriculture 2022, 12, 894. [Google Scholar] [CrossRef]
- Mou, J.; Xu, H.; Rong, X. General Entomology; China Agriculture Press: Beijing, China, 1996. [Google Scholar]
- Shu, C.; Tang, J. Practical Data Manual for Insects; China Agriculture Press: Beijing, China, 2009. [Google Scholar]
- Du, Z. Research on Biomimetic Design of Cutting Blade for Tea Stem and Its Cutting Performance. Ph.D. Thesis, Jiangsu University, Zhenjiang, China, 2020. [Google Scholar]
- Zhang, X.; Jia, X.; Kang, M. Agricultural Machinery Design Manual; China Agricultural Science and Technology Press: Beijing, China, 2007. [Google Scholar]
- Yuan, J. The Design and Simulation Analysis on Reciprocating Sugarcane Harvester. Ph.D. Thesis, Kunming University of Science and Technology, Kunming, China, 2017. [Google Scholar]
- Tong, J.; Xun, S.; Chen, D.; Li, M. Design of a Bionic Blade for Vegetable Chopper. J. Bionic Eng. 2017, 14, 163–171. [Google Scholar] [CrossRef]
- Durczak, K.; Selech, J.; Ekielski, A.; Żelaziński, T.; Waleński, M.; Witaszek, K. Using the Kaplan–Meier Estimator to Assess the Reliability of Agricultural Machinery. Agronomy 2022, 12, 1364. [Google Scholar] [CrossRef]
- Durczak, K.; Rybacki, P.; Sujak, A. Application of a Selected Pseudorandom Number Generator for the Reliability of Farm Tractors. Appl. Sci. 2022, 12, 12452. [Google Scholar] [CrossRef]


| Physical Characteristics | Parameters | Values | Units | Source |
|---|---|---|---|---|
| a | Bottom length | 76 | mm | Standard cutter |
| e | Upper sole length | 13 | mm | [20] |
| β | Cutting angle | 58~68 | ° | [20] |
| α | Cutting edge angle | 20~25 | ° | [20] |
| δ | Thickness | 2 | mm | comparative maturity |
| Parameters | Units | Value |
|---|---|---|
| Density | kg/m3 | 1100 |
| Elastic modulus | MPa | 1000 |
| Poisson’s ratio | - | 0.3 |
| Yield stress | MPa | 17.96 |
| Shear modulus | MPa | 0.5 |
| Hardening parameter | - | 0.05 |
| Strain rate (C) | - | 87.27 |
| Strain rate (P) | - | 8 |
| Failure strain | - | 0.0387 |
| Parameters | Units | Value |
|---|---|---|
| Density | kg/m3 | 7800 |
| Elasticity modulus | GPa | 2.07 × 10⁵ |
| Poisson’s ratio | - | 0.3 |
| Factor Level | Cutting Edge Angle X1 | Cutting Angle X2 | Reciprocating Speed X3 |
|---|---|---|---|
| −1.68 | 20 | 58 | 1.18 |
| −1 | 21 | 60 | 1.23 |
| 0 | 22.5 | 63 | 1.3 |
| 1 | 24 | 66 | 1.37 |
| 1.68 | 25 | 68 | 1.42 |
| No. | X1 | X2 | X3 | Maximum Shear Force/N | Power Dissipation (J) | |
|---|---|---|---|---|---|---|
| 1 | 22.5 | 63 | 1.3 | 205.9 | 0.97 | |
| 2 | 23.9865 | 65.973 | 1.37135 | 249.3 | 1 | |
| 3 | 22.5 | 63 | 1.3 | 201.1 | 0.92 | |
| 4 | 20 | 63 | 1.3 | 150.8 | 0.92 | |
| 5 | 21.0135 | 65.973 | 1.22865 | 170.5 | 0.85 | |
| 6 | 22.5 | 68 | 1.3 | 202.6 | 0.9 | |
| 7 | 21.0135 | 60.027 | 1.22865 | 213.2 | 1.12 | |
| 8 | 25 | 63 | 1.3 | 201.1 | 0.89 | |
| 9 | 23.9865 | 60.027 | 1.22865 | 183.7 | 0.84 | |
| 10 | 21.0135 | 65.973 | 1.37135 | 165.1 | 0.89 | |
| 11 | 21.0135 | 60.027 | 1.37135 | 160.8 | 1.02 | |
| 12 | 23.9865 | 60.027 | 1.37135 | 202.3 | 0.96 | |
| 13 | 22.5 | 63 | 1.3 | 200.9 | 0.97 | |
| 14 | 23.9865 | 65.973 | 1.22865 | 185.8 | 0.8 | |
| 15 | 22.5 | 63 | 1.3 | 200.6 | 0.89 | |
| 16 | 22.5 | 63 | 1.18 | 199.3 | 0.93 | |
| 17 | 22.5 | 63 | 1.3 | 198.3 | 0.97 | |
| 18 | 22.5 | 58 | 1.3 | 191.2 | 1 | |
| 19 | 22.5 | 63 | 1.42 | 204 | 1.05 | |
| Source | Sum of Squares | df | Mean Square | F-Value | p-Value |
|---|---|---|---|---|---|
| Model | 8528.58/0.0986 | 9 | 947.62/0.0110 | 146.34/9.66 | <0.0001 **/0.0012 ** |
| X1 | 2815.65/0.0080 | 1 | 2815.65/0.0080 | 434.82/7.05 | <0.0001 **/0.0263 ** |
| X2 | 65.34/0.0236 | 1 | 65.34/0.0236 | 10.09/20.84 | 0.0112 */0.0014 ** |
| X3 | 75.94/0.0156 | 1 | 75.94/0.0156 | 11.73/13.77 | 0.0076 **/0.0048 ** |
| X1X2 | 957.03/0.0200 | 1 | 957.03/0.0200 | 147.79/17.63 | <0.0001 **/0.0023 ** |
| X1X3 | 2446.50/0.0181 | 1 | 2446.50/0.0181 | 377.81/15.91 | <0.0001 **/0.0032 ** |
| X2X3 | 1055.70/0.0061 | 1 | 1055.70/0.0061 | 163.03/5.33 | <0.0001 **/0.0463 * |
| X12 | 1079.02/0.0038 | 1 | 1079.02/0.0038 | 166.63/3.35 | <0.0001 **/0.1004 |
| X22 | 30.06/8.251 × 10−6 | 1 | 30.06/8.25 × 10−6 | 4.64/0.0073 | 0.0596/0.9339 |
| X32 | 0.5211/0.0024 | 1 | 0.5211/0.0024 | 0.0805/2.15 | 0.7831/0.1767 |
| Residual | 58.28/0.0102 | 9 | 6.48/0.0011 | ||
| Lack of fit | 27.45/0.0047 | 5 | 5.49/0.0009 | 0.7122/0.6796 | 0.6465/0.6638 |
| Pure error | 30.83/0.0055 | 4 | 7.71/0.0014 | ||
| Core total | 8586.86/0.1089 | 18 |
| Blade Type | Condition | Maximum Shear Force/N | Power Dissipation (J) |
|---|---|---|---|
| Ordinary blade | ordinary tooth | 205 | 1.01 |
| Bionic blade | bionic tooth | 168.1 | 0.85 |
| Rate of performance improvement | 18% | 15.8% |
| No. | Maximum Shear Force/N | Power Dissipation (J) | ||
|---|---|---|---|---|
| Bionic Blade | Ordinary Blade | Bionic Blade | Ordinary Blade | |
| 1 | 380 | 413 | 20.2 | 23.3 |
| 2 | 383 | 422 | 21.1 | 24.1 |
| 3 | 351 | 388 | 16.9 | 18.3 |
| 4 | 399 | 467 | 23.3 | 25.8 |
| 5 | 321 | 359 | 18.2 | 20.1 |
| average | 366.8 | 409.8 | 19.9 | 22.3 |
Disclaimer/Publisher’s Note: The statements, opinions and data contained in all publications are solely those of the individual author(s) and contributor(s) and not of MDPI and/or the editor(s). MDPI and/or the editor(s) disclaim responsibility for any injury to people or property resulting from any ideas, methods, instructions or products referred to in the content. |
© 2023 by the authors. Licensee MDPI, Basel, Switzerland. This article is an open access article distributed under the terms and conditions of the Creative Commons Attribution (CC BY) license (https://creativecommons.org/licenses/by/4.0/).
Share and Cite
Liu, Z.; Wang, T.; Liu, S.; Yan, X.; Zhao, H.; Wu, X.; Zhang, S. Design and Experimental Study of a Bionic Blade for Harvesting the Wild Chrysanthemum Stem. Agriculture 2023, 13, 190. https://doi.org/10.3390/agriculture13010190
Liu Z, Wang T, Liu S, Yan X, Zhao H, Wu X, Zhang S. Design and Experimental Study of a Bionic Blade for Harvesting the Wild Chrysanthemum Stem. Agriculture. 2023; 13(1):190. https://doi.org/10.3390/agriculture13010190
Chicago/Turabian StyleLiu, Zhengdao, Tao Wang, Suyuan Liu, Xiaoli Yan, Hongbo Zhao, Xiaopeng Wu, and Shuo Zhang. 2023. "Design and Experimental Study of a Bionic Blade for Harvesting the Wild Chrysanthemum Stem" Agriculture 13, no. 1: 190. https://doi.org/10.3390/agriculture13010190
APA StyleLiu, Z., Wang, T., Liu, S., Yan, X., Zhao, H., Wu, X., & Zhang, S. (2023). Design and Experimental Study of a Bionic Blade for Harvesting the Wild Chrysanthemum Stem. Agriculture, 13(1), 190. https://doi.org/10.3390/agriculture13010190