Abstract
Wheat is one of the most important crops in the world. Mapping QTLs for root traits is essential for the selection of wheat roots desirable for the efficient acquisition of nutrients. Here, a QTL analysis for wheat root traits was performed using 142 recombinant inbred lines derived from two wheat varieties Xiaoyan 54 and Jing 411 in a soil column culture trial. The genetic map used in this study contained 470 SSR markers and covered 3438.4 cM of wheat genome. A total of 25 QTLs for root and shoot traits were detected, located at 16 marker intervals of 13 chromosomes. The percentage of phenotypic variation explained by individual QTLs varied from 6.1% to 22.0%. The QTLs regulating RDW and root distribution on chromosomes 1A, 3A, 4A, and 5B are important for root growth in both the top- and subsoils. For qRDW-1A, qRDW-3A, and qRDW-5B, the nearest markers to the QTLs were much closer than that of qRDW-4A, with the genetic distances ranging from 0.01 to 1.18 cM. Combining these three QTLs not only increased RDW and nutrient uptake, but also increased GW, SDW, and BDW under low nitrogen conditions in the field trial. Therefore, these QTLs are valuable for marker-assisted selection of wheat root traits.
1. Introduction
Wheat (Triticum aestivum L.) is one of the most important cereal crops and is now the most widely grown crop in the world. The grain yield of wheat has been greatly improved since the first revolution and accounts for about 20% of total calorie consumption globally in recent years (http://faostat.fao.org/, accessed on 16 June 2022). However, the increase in crop production in many parts of the world still relies on the use of excessive amounts of fertilizer [1,2]. Undoubtedly, excessive fertilization is costly and unsustainable. Therefore, in future crop breeding programs, priority should be given to improving nutrient use efficiency to achieve reduced fertilizer demand for optimal yields and increased yields under suboptimal nutrient availability [3,4]. Roots are the main organs for plants to uptake nutrients from soils. Genetic improvement of root traits is very important for improving crop nutrient use efficiencies [5,6,7]. However, the selection of crop breeding so far is mainly based on shoot traits, and genetic improvement for root traits is very limited, mainly because it is difficult to be directly selected by crop breeders [8,9]. Therefore, identification quantitative trait loci (QTLs) for root traits and development of marker-assisted selection (MAS) will greatly help breeders to select crop root traits desirable for efficient acquisition of nutrients.
Previous studies showed that early vigorous growth of shoots and roots improves nitrogen and phosphate uptake in wheat [10,11,12,13]. Vigor is an important target in wheat breeding because it is related to both nutrient capture and utilization [6]. Therefore, further identifying QTLs towards marker-assisted breeding for wheat seedling root and shoot traits will benefit nutrient management and optimal yields in wheat production. In the past ten years, numerous QTLs for wheat root biomass and morphological parameters have been reported and some of them may have major effects on wheat root growth and development [13,14,15,16,17,18,19,20,21,22,23,24]. For example, qTaLRO-B1, a major QTL on chromosome 2B has been reported controlling seminal root length [16]. Moreover, this QTL was also detected under varying nitrogen and phosphorus supply levels [13], indicating that qTaLRO-B1 is very stable and plays an important role in regulating wheat root growth. In another study, three important QTL clusters (C2B, C6D, and C7B) for root system architecture-related traits were identified, in which C2B and C7B contributed to the optimal root system, and C6D mainly affected the plasticity of roots in response to nitrogen deficiency [22]. Interestingly, C2B was collocated with qTaLRO-B1, and all three QTL clusters were collocated with loci for nitrogen use efficiency (NUE)-related traits [16,22]. Atkinson et al. identified a major locus for seedling root traits on chromosome 6D. Of the 29 root QTLs identified in the study, 11 were found to colocalize on this locus, with four of them achieving highly significant logarithm of odds scores [19]. In addition, the SNP marker interval between AX-109955164 and AX-109445593 on chromosome 7A may harbor a pleiotropic gene that plays key roles in regulating root length, root tips number, and root surface area under low P conditions [24]. These studies have increased the understanding of the genetic control of root traits. However, those QTLs were mainly detected with hydroponic culture, due to the difficulty of accurate root phenotypic measurement under field conditions, especially when analyzing hundreds of genotypes in QTL analysis. In recent years, some wheat root QTLs were also detected under pot culture conditions or using a high-throughput root phenotyping platform [25,26,27,28,29,30]. For example, a genome-wide association study (GWAS) on wheat root traits was performed under indoor hydroponic culture, outdoor hydroponic culture, and outdoor pot culture conditions. A stable expressed QTL for total root length was identified on chromosome 4A under all three growing environments [26]. Recently, Colombo et al. identified 100 QTLs for root traits in bread wheat and 34 in durum wheat using a high-throughput phenotyping platform. Most of them colocalized with QTLs of traits measured in field conditions [30]. These studies have increased the accuracy and reliability of root phenotyping to a certain extent, but they also have shortcomings. For example, in pot trials, the downward growth of plant roots is restricted, and the roots cannot sense the nutrient and water status of the deeper soil, thereby changing the rate of root growth and root phenotype. Moreover, it is difficult to investigate the root distribution of different soil profiles.
In this paper, a soil column culture trial was conducted to map QTLs for root distribution and shoot traits at the wheat seedling stage in a 90 cm depth soil profile by using a recombinant inbred line (RIL) population derived from two Chinese wheat varieties, Xiaoyan 54 and Jing 411. Furthermore, the combined effects of favorable alleles of QTLs for root biomass on nutrients uptake and yield performance were also investigated, aiming to examine the application potential of these detected QTLs for root traits.
2. Materials and Methods
2.1. Plant Materials
A RIL population comprising 142 lines and their parents, Xiaoyan 54 and Jing 411, were used in this study to map QTLs for root distribution and shoot traits at wheat seedling stage. Xiaoyan 54 and Jing 411 are two elite Chinese winter wheat varieties and the character of these two varieties has been documented in previous studies [16,31].
2.2. Wheat Seedling Traits Evaluation
A soil column culture (SC) trial was conducted to phenotype wheat root dry weight (RDW), root distribution of different soil layers, tiller number (TN), shoot dry weight (SDW), nitrogen uptake (NUP), and phosphorus uptake (PUP). The SC trial was conducted as described by Ren et al. (2017) [13]. Briefly, 87.8 mg of potassium dihydrogen phosphate (KH2PO4), 107.14 mg urea (CO(NH2)2), and 4.4 mg zinc sulfate heptahydrate (ZnSO4·7H2O) were well mixed with every 1 kg of soil. Then, the mixed soil was packed into 450 PVC tubes measuring 90 cm in height and 11 cm in diameter. Then, the seeds were germinated for 24 h at 20 °C, and then 5 germinated seeds were sowed in each PVC soil column. The PVC soil columns were randomly placed with three replications for each RIL line. The seedlings were thinned to three plants per tube at the two-leaf stage. Wheat seedling traits were evaluated 35 days after germination. The lowest temperature varied from 5 to 12 °C, and the highest temperature ranged from 15 to 27 °C of each day during the period of the SC trial. The roots were washed free of visible soil to evaluate root traits. The RDW and root dry weight distribution in the soil profiles 0–30 cm (RDW1), 30–60 cm (RDW2), >60 cm (RDW3), TN, and SDW were investigated. Total nitrogen and phosphorus concentration in root and shoot tissues were measured according to previously reported literature [32,33]. The nitrogen and phosphorus uptake was calculated as the sum of nitrogen or phosphorus accumulated in root and shoot.
2.3. QTL Detection
The genetic map of the “Xiaoyan 54 × Jing 411” RIL population comprised 470 simple sequence repeat (SSR) markers in 25 linkage groups. It covered 3438.4 cM of the wheat genome [16]. WinQTLCart 2.5 software was employed to perform QTL analyses [34]. Composite interval mapping was applied to determine QTL location, additive effect, and 95% confidence intervals of QTLs [35]. In the forward regression analysis, the walk speed and window size were set as 2 cM and 10 cM, respectively, with 5 control markers (default setting). The LOD cutoff was set as 2.5.
2.4. Effect Analysis of Root QTL
The effects of different root QTL combinations on nutrient uptake and yield performance were evaluated. For each root QTL combination (or single QTL), the RILs simultaneously harboring favorable or unfavorable alleles of RDW were grouped respectively. The effects of these QTL combinations on wheat RDW, NUP, and PUP in the SC trial and growth performance in a field trial (FT) were analyzed. In the FT, three treatments were applied: low nitrogen (LN), low phosphorus (LP), and normal fertilized control (CK). The method of fertilization was carried out according to the description of Xu et al., 2014 [31]. At the maturing stage, plant height (PH), grain weight (GW), shoot dry weight (SDW), and biomass dry weight (BDW) of the RILs were evaluated according to Xu et al., 2014 [31].
2.5. Statistical Analysis
SPSS 21.0 software was employed to calculate correlation efficiencies between different traits. Excel 2017 and SPSS 21.0 software were used to calculate the means, standard deviations, standard errors, ranges of each measured morphological traits, and correlations between different traits. The statistical significance of differences for all the traits was analyzed by using the SPSS 21.0 software (p < 0.05 and p < 0.01 level, respectively).
3. Results
3.1. Phenotypic Variation and Correlation Analysis
In the SC trial, we investigated total RDW and root distribution in a soil profile of 90 cm depth under nitrogen and phosphorus sufficient conditions. Xiaoyan 54 had lower RDW and RDW1 than Jing 411, but had similar RDW2 and RDW3 with Jing 411, indicating that the lower RDW of Xiaoyan 54 was mainly due to the lower root distribution in the topsoil than Jing 411 (Table 1). The RIL lines showed large variations in all the investigated traits. Among all the evaluated traits, there existed RILs with values that were higher or lower than both parents (Table 1). This result indicated that both parents (Xiaoyan 54 and Jing 411) of the RIL population harbor favorable and unfavorable alleles of these traits, and potential transgressive variations exist in the recombinant lines (Table 1).

Table 1.
Mean values and ranges for the investigated traits in the RIL population and their parents at the seedling stage.
Phenotypic values of RDW, SDW, TN, NUP, and PUP were used to analyze the correlation coefficients between them (Table S1). There were significant and positive correlations between SDW, RDW, NUP, and PUP, however, no correlation was observed between SDW and TN. Both NUP and PUP were more closely correlated with SDW and RDW than with TN, although they were also significantly correlated with TN at the 5% level, indicating that SDW and RDW are more suitable as indirect indicators of nitrogen and phosphorus absorption efficiencies than TN.
3.2. Identification of QTLs for Root and Shoot Traits
For the root traits, we detected four QTLs for RDW and four for RDW1, two QTLs for RDW2, and two for RDW3. For the above-ground traits, we detected four QTLs for TN and two for SDW. We also detected four QTLs for NUP and three for PUP (Table 2). These 25 QTLs located at 16 marker intervals were distributed on 13 chromosomes, and the percentage of phenotypic variation explained by individual QTLs varied from 6.1% to 22.0% (Figure 1; Table 2). Four QTLs for RDW accounted for 53.6% of the phenotypic variation collectively. The most significant one on chromosome 4A, qRDW-4A, explained 20.1% of phenotypic variation in RDW. The other three QTLs on chromosome 1A, 3A, and 5B explained 6.5%, 13.6%, and 13.4% of RDW variations, respectively. Both parents offered favorable alleles for RDW. The additive effects of qRDW-4A and qRDW-5B came from the parent Xiaoyan 54, while qRDW-3A and qRDW-1A came from the other parent Jing 411. The genetic distances of the nearest marker to qRDW-1A, qRDW-3A, and qRDW-5B were 0.01 cM, 0.29 cM, and 1.18 cM, respectively, which were much closer than that of qRDW-4A. The four QTLs for RDW1 were located in the same marker intervals with QTLs for RDW and explained phenotypic variations varying from 6.1% to 15.0%, of which qRDW1-5B was the most significant one. They collectively explained 46.7% of the RDW1 variation. A total of 2 QTLs for RDW2 were detected (qRDW2-1D and qRDW2-2A) and explained 10.1% and 12.8% of RDW2 phenotypic variations, respectively. The additive effects of both QTLs came from Jing 411. The two QTLs for RDW3, qRDW3-3A, and qRDW3-4A explained 13.3% and 17.7% of RDW3 phenotypic variations, respectively. The additive effect of qRDW3-4A came from Xiaoyan 54, while qRDW3-3A came from Jing 411.
Table 2.
Detected QTLs for wheat seedling traits in relation to nutrient uptake.
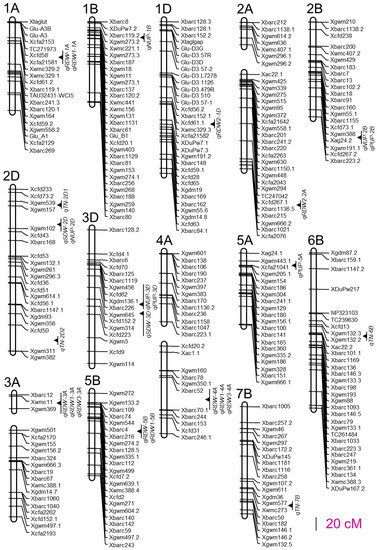
Figure 1.
Chromosomal positions of QTLs detected in the soil column culture trial.
The four QTLs for TN explained phenotypic variations varying from 6.7% to 22.0%. Among them, qTN-2D2 was the most significant one, accounting for 22.0% of TN variation. The remaining QTLs collectively explained 31.3% of TN variation. For the two QTLs for SDW, qSDW-2D and qSDW-3D explained 10.4% and 8.4% of SDW phenotypic variations, respectively. We also detected four QTLs for NUP, of which the additive effects of qNUP-2D and qNUP-3D came from Xiaoyan 54, while qNUP-1B and qNUP-2B came from Jing 411. They collectively accounted for 40.9% of NUP variation. The most significant QTLs for NUP (qNUP-3D) were located on chromosome 3D and explained 17.0% of phenotypic variation. Three QTLs for PUP (qPUP-2B, qPUP-3D, and qPUP-5A) were detected and explained 7.1%, 14.5%, and 9.0% of PUP phenotypic variations, respectively. The favorable alleles of qPUP-3D and qPUP-5A came from Xiaoyan 54, while the favorable allele of qPUP-2B came from Jing 411.
We analyzed the QTL distribution on wheat chromosomes and four QTL clusters were detected. The first QTL cluster was located between SSR markers Xwmc11 and Xgwm369 on chromosome 3A and harbored three QTLs (qRDW-3A, qRDW1-3A, and qRDW3-3A) for root dry-weight-related traits (Table 2; Figure 1); the second one was tightly linked with SSR marker Xgwm157 on chromosome 2D and contained three QTLs (qSDW-2D, qNUP-2D, and qTN-2D1) for SDW, NUP, and TN, respectively (Table 2; Figure 1); the third QTL cluster was located between SSR markers Xgdm136.1 and Xgwm645 on chromosome 3D (Figure 1) and harbored three QTLs (qSDW-3D, qNUP-3D, and qPUP-3D) for SDW, NUP, and PUP, respectively (Table 2; Figure 1); the fourth one was located between SSR markers Xbarc52 and Xbarc70.1 on chromosome 4A, containing three QTLs (qRDW-4A, qRDW1-4A, and qRDW3-4A) for root dry-weight-related traits (Table 2; Figure 1). Besides these four QTL clusters, the marker interval between Xcfd58 and Xcfa21581 on chromosome 1A was mapped to control RDW and RDW1, the interval between Xgwm388 and Xag24.2 on chromosome 2B was detected to control NUP and PUP, and the interval between Xbarc4 and Xbarc216 on chromosome 5B was detected to control RDW and RDW1, respectively.
3.3. Effects of Root QTLs on Nutrient Uptake and Yield Performance
We detected four QTLs for RDW in the SC trial, qRDW-1A, qRDW-3A, qRDW-4A, and qRDW-5B. Different lines of the RIL population may possess different favorable allelic combinations of the four QTLs. To assess the combined effects of root QTLs on root biomass and nutrient uptake, the RDW, NUP, and PUP of RILs with varying combinations of QTLs from each of the donor parents were compared (Figure 2). Results showed that the combination of QTLs showed a significant additive effect on RDW (Figure 2A). The group of RILs bearing two favorable alleles of QTLs (qRDW-1A and qRDW-3A) had a significant higher RDW than those possessing one or no favorable alleles of RDW QTLs. Combining three favorable alleles resulted in the mean RDW increasing by 27.7% in the qRDW-1A, qRDW-3A, and qRDW-4A combination, and 44.3% in the qRDW-1A, qRDW-3A, and qRDW-5B combination, respectively (Figure 2A). Moreover, the RDW QTLs had noticeable stacking effects of multiple favorable alleles on NUP and PUP. Lines either bearing the favorable allele of qRDW-1A, qRDW-3A, and qRDW-5B, or all four RDW QTLs had significantly higher NUP than those possessing no favorable alleles (Figure 2B). For PUP, combining three favorable alleles led to the mean PUP being increased by 20.0% in the qRDW-1A, qRDW-3A, and qRDW-4A combination, and 37.0% in the qRDW-1A, qRDW-3A, and qRDW-5B combination, respectively (Figure 2C).
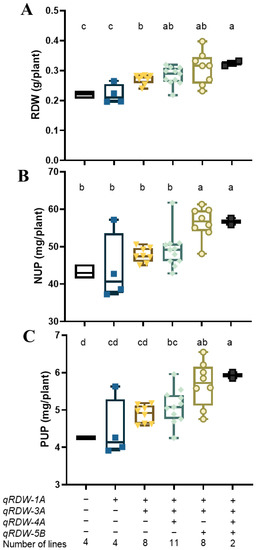
Figure 2.
The RDW (A), NUP (B), and PUP (C) of lines with varying combinations of RDW QTLs in the “Xiaoyan 54 × Jing 411” RIL population. The values of six groups of lines were compared, each group harbors null, one, two, three, or four favorable alleles of RDW QTLs. “+” represents a favorable allele, while “−” represents an unfavorable allele. The median is indicated by the solid horizontal line. Vertical lines represent the range. Statistical differences are indicated by different letters above the boxes. Boxes that do not possess the same letter(s) mean significance at p < 0.05 level (Duncan’s multiple range test).
To assess the effectiveness of the pyramiding strategy on yield performance, a field trail was conducted to verify whether combining QTLs for RDW could improve plant growth at different nutrient supply levels. As the QTL combination of qRDW-1A, qRDW-3A, and qRDW-5B could enhance root growth and promote nitrogen and phosphorus uptake (Figure 2), lines with or without all the three favorable alleles from qRDW-1A, qRDW-3A, and qRDW-5B were selected as materials to conduct the field trial under control, LN, and LP conditions. Results showed that the favorable allelic group had significant higher SDW, GW, and BDW under low nitrogen conditions, but had no obvious difference under LP and control conditions (Table 3). Compared with the unfavorable allelic group, the SDW, GW, and BDW of the favorable allelic group increased by 19.5%, 16.6%, and 18.2%, respectively. However, the combination of RDW QTLs had no obvious effect on plant height (Table 3).
Table 3.
Effects of the combination of qRDW-1A, qRDW-3A, and qRDW-5B on wheat yield performance in the field trial.
4. Discussion
Efficient acquisition of nutrients is the basis for high yield of wheat. Early vigorous growth of roots and shoots can improve nitrogen and phosphate uptake in wheat [10,11,12,13]. To provide candidate QTLs for developing MAS for breeding wheat with improved shoot and root performance, the “Xiaoyan 54 × Jing 411” RIL population was used in this study to detect QTLs for root and shoot traits in an SC trial. The two parents had similar RDW (Table 1), which is consistent with our previous data under hydroponic conditions [13]. Our study observed large differences among the RILs in all the investigated traits (Table 1). The RDW and SDW showed positive and significant correlations with NUP and PUP (Table S1). These results demonstrated the importance of enhancing root and shoot growth performance in improving nitrogen and phosphorus use efficiencies, further confirming the previously reported results in wheat [10,11,12,13,32,36,37]. It has been reported that wheat plants with a large and deep root system can reduce the fraction of supplied nitrogen leached than those with small and shallow root systems [11]. In this study, the RILs exhibited large variation in root distribution in both the topsoil (RDW1) and subsoil (RDW2 and RDW3) (Table 1); this might result in differences between wheat genotypes in accessing nutrients in the top- and subsoils.
In total, we detected 25 QTLs for the investigated root and shoot traits located at 16 marker intervals on 13 chromosomes (Figure 1). The percentage of phenotypic variation explained by individual QTLs varied from 6.1% to 22.0% (Table 2). In this study, four QTLs for RDW were detected (Table 2; Figure 1). All of them coincided with QTLs for RDW1 and two of them coincided with QTLs for RDW3, indicating that these loci regulate root distribution and are very important for root growth in both the top- and subsoils. The marker interval between Xbarc52 and Xbarc70.1 on chromosome 4A contained three QTLs for RDW, RDW1, and RDW3 (Figure 1), explaining 20.1%, 13.2%, and 17.7% of total RDW, RDW1, and RDW3 phenotypic variations, respectively (Figure 1; Table 2). Previous studies have shown that many QTLs for root traits coincide with those for nutrient uptake and productivity in wheat [13,37,38,39,40]. The marker interval between Xwmc11 and Xgwm369 on chromosome 3A contained QTLs for RDW, RDW1, and RDW3, respectively (Figure 1). All three QTLs explained more than 10% of the phenotypic variations (Table 2). Interestingly, this chromosome region coincides with a previously reported mata-QTL MQTL3A.1 that is associated with nitrogen use efficiency and root system architecture [41]. The marker interval between Xbarc4 and Xbarc216 on chromosome 5B clustered two QTLs for RDW and RDW1 (Figure 1) and showed a major effect on RDW and RDW1 (Table 2). This chromosome region also coincided with a previously reported meta-QTL (MQTL20) for root morphological traits [21,42] and a nitrogen use efficient meta-QTL (MQTL-8) [43]. Moreover, qRDW-5B and qRDW1-5B also linked with another previously reported QTL for wheat post anthesis dry matter accumulation [33]. In addition, qNUP-1B, a QTL for NUP on chromosome 1B detected in this study, also tightly linked with previously reported QTLs for total root length, total root surface area, total root volume, and a meta-QTL (MQTL1) for root morphological traits [17,20,21]. These results indicate that the selection of root traits is important for improving crop nutrient use efficiency and yield.
Wheat has a dense fibrous root system which is difficult to be quantified and selected directly by breeders. Therefore, developing MAS will help breeders to select root traits desirable for efficient acquisition of nutrients from soils by wheat. Plant roots and their distribution play important roles in nutrient uptake. As analyzed above, the QTLs for RDW also regulate root distribution in different soil profiles. We therefore evaluated the combined effects of root QTLs on nutrient uptake and yield performance to examine the pyramiding effects of these QTLs. Excitingly, the combination of RDW QTLs showed a significant stacking effect on RDW, NUP, and PUP. For example, compared with the null favorable allelic group, the favorable allelic group of qRDW-1A, qRDW-3A, and qRDW-5B increased RDW, NUP, and PUP by 44.3%, 34%, and 37%, respectively (Figure 2), indicating that pyramiding these QTLs may significantly promote nitrogen and phosphorus absorption. As a matter of fact, in the field trial, combining the favorable alleles of qRDW-1A, qRDW-3A, and qRDW-5B increased GW, SDW, and BDW significantly under LN conditions, but not under LP and control conditions (Table 3). The possible reason is that nitrogen is highly mobile in soils and readily leached into deep soil compared with phosphate. Under LN conditions, the increase in RDW in the subsoil is favorable for nitrogen uptake and improves plant growth performance [44,45]. Therefore, combining QTLs on RDW can increase RDW in both the top- and subsoils, and consequently enhance wheat yield and growth performance under LN conditions, but not under LP conditions. The QTLs for RDW had a noticeable positive effect on NUP and PUP in the SC trial and yield performance in the field trial under low nitrogen conditions, suggesting that they have potential application value and are valuable for MAS of wheat root traits and nitrogen use efficiency in future wheat breeding.
5. Conclusions
This work detected 25 QTLs for root and shoot traits located at 16 loci and distributed on 13 chromosomes. These QTLs included four QTLs for RDW and RDW1, respectively, two QTLs for RDW2 and RDW3, respectively, four QTLs for TN, two QTLs for SDW, four QTLs for NUP, and three QTLs for PUP. The percentage of phenotypic variation explained by individual QTLs varied from 6.1% to 22.0%. Combining QTLs for RDW on 1A, 3A, and 5B not only increased RDW in both the top- and subsoils and nutrient uptake in the SC trial, but also increased GW, SDW, and BDW under low nitrogen conditions in the field trial. Our results provided valuable loci for the MAS of wheat root traits, and showed that it is feasible to improve wheat nutrient use efficiency and yield by pyramiding QTLs on RDW.
Supplementary Materials
The following supporting information can be downloaded at: https://www.mdpi.com/article/10.3390/agriculture13010210/s1, Table S1: Correlation between wheat seedling traits in relation to nutrient uptake.
Author Contributions
Conceptualization, Y.R.; methodology, Y.X., Y.R. and D.L.; software, Y.X. and D.L.; validation, Y.X.; formal analysis, Y.X.; investigation, Y.X. and Y.R.; resources, Y.R.; data curation, Y.X. and Y.R.; writing—original draft preparation, Y.X. and Y.R.; writing—review and editing, D.L., Y.Y. and S.W.; visualization, Y.X.; supervision, Y.R.; project administration, Y.R.; funding acquisition, Y.X. and Y.R. All authors have read and agreed to the published version of the manuscript.
Funding
This research was funded by the Program for Core Young Teacher of the Higher Educational Institution of Henan province (2020GGJS042) and the Scientific Research Starting Foundation of Zhengzhou Normal University (702386).
Institutional Review Board Statement
Not applicable.
Data Availability Statement
All data are reported in this manuscript.
Acknowledgments
We thank Yiping Tong (Institute of Genetics and Developmental Biology, Chinese Academy of Sciences) for providing us with the plant materials and giving us many constructive suggestions in this study.
Conflicts of Interest
The authors declare no conflict of interest.
References
- Good, A.; Beatty, P.H. Fertilizing Nature: A Tragedy of Excess in the Commons. PLOS Biol. 2011, 9, e1001124. [Google Scholar] [CrossRef] [PubMed]
- White, P.J.; George, T.S.; Gregory, P.J.; Bengough, A.G.; Hallett, P.D.; Blair, M.; McKenzie, B.M. Matching Roots to Their Environment. Ann. Bot. 2013, 112, 207–222. [Google Scholar] [CrossRef]
- Jiao, X.; Lyu, Y.; Wu, X.B.; Li, H.G.; Cheng, L.Y.; Zhang, C.C.; Yuan, L.X.; Jiang, R.F.; Jiang, B.W.; Rengel, Z.; et al. Grain Production Versus Resource and Environmental Costs: Towards Increasing Sustainability of Nutrient Use in China. J. Exp. Bot. 2016, 67, 4935–4949. [Google Scholar] [CrossRef] [PubMed]
- Lynch, J.P. Rightsizing Root Phenotypes for Drought Resistance. J. Exp. Bot. 2018, 69, 3279–3292. [Google Scholar] [CrossRef] [PubMed]
- Herder, G.D.; Van Isterdael, G.; Beeckman, T.; De Smet, I. The roots of a new green revolution. Trends Plant Sci. 2010, 15, 600–607. [Google Scholar] [CrossRef]
- Lynch, J.P. Roots of the Second Green Revolution. Aust. J. Bot. 2007, 55, 493–512. [Google Scholar] [CrossRef]
- Yu, P.; Li, X.; White, P.; Li, C. A Large and Deep Root System Underlies High Nitrogen-Use Efficiency in Maize Production. PLoS ONE 2015, 10, e0126293. [Google Scholar] [CrossRef]
- Hochholdinger, F. Untapping root system architecture for crop improvement. J. Exp. Bot. 2016, 67, 4431–4433. [Google Scholar] [CrossRef]
- Wachsman, G.; Sparks, E.E.; Benfey, P.N. Genes and networks regulating root anatomy and architecture. New Phytol. 2015, 208, 26–38. [Google Scholar] [CrossRef]
- Liao, M.T.; Fillery, I.R.P.; Palta, J.A. Early vigorous growth is a major factor influencing nitrogen uptake in wheat. Funct. Plant Biol. 2004, 31, 121–129. [Google Scholar] [CrossRef]
- Ehdaie, B.; Merhaut, D.J.; Ahmadian, S.; Hoops, A.C.; Khuong, T.; Layne, A.P.; Waines, J.G. Root System Size Influences Water-Nutrient Uptake and Nitrate Leaching Potential in Wheat. J. Agron. Crop Sci. 2010, 196, 455–466. [Google Scholar] [CrossRef]
- Ryan, P.R.; Liao, M.; Delhaize, E.; Rebetzke, G.J.; Weligama, C.; Spielmeyer, W.; James, R.A. Early vigour improves phosphate uptake in wheat. J. Exp. Bot. 2015, 66, 7089–7100. [Google Scholar] [CrossRef] [PubMed]
- Ren, Y.; Qian, Y.; Xu, Y.; Zou, C.; Liu, D.; Zhao, X.; Zhang, A.; Tong, Y. Characterization of QTLs for Root Traits of Wheat Grown under Different Nitrogen and Phosphorus Supply Levels. Front. Plant Sci. 2017, 8, 2096. [Google Scholar] [CrossRef]
- Laperche, A.; Devienne-Barret, F.; Maury, O.; Le Gouis, J.; Ney, B. A simplified conceptual model of carbon/nitrogen functioning for QTL analysis of winter wheat adaptation to nitrogen deficiency. Theor. Appl. Genet. 2006, 113, 1131–1146. [Google Scholar] [CrossRef] [PubMed]
- Sanguineti, M.C.; Li, S.; Maccaferri, M.; Corneti, S.; Rotondo, F.; Chiari, T.; Tuberosa, R. Genetic dissection of seminal root architecture in elite durum wheat germplasm. Ann. Appl. Biol. 2007, 151, 291–305. [Google Scholar] [CrossRef]
- Ren, Y.; He, X.; Liu, D.; Li, J.; Zhao, X.; Li, B.; Tong, Y.; Zhang, A.; Li, Z. Major quantitative trait loci for seminal root morphology of wheat seedlings. Mol. Breed. 2012, 30, 139–148. [Google Scholar] [CrossRef]
- Liu, X.; Li, R.; Chang, X.; Jing, R. Mapping QTLs for seedling root traits in a doubled haploid wheat population under different water regimes. Euphytica 2012, 189, 51–66. [Google Scholar] [CrossRef]
- Canè, M.A.; Maccaferri, M.; Nazemi, J.; Salvi, S.; Francia, R.; Chiara, C.; Tuberosa, R. Association Mapping for Root Archi-tectural Traits in Durum Wheat Seedlings as Related to Agronomic Performance. Mol. Breed. 2014, 34, 1629–1645. [Google Scholar] [CrossRef]
- Atkinson, J.A.; Wingen, L.U.; Griffiths, M.; Pound, M.P.; Gaju, O.; Foulkes, M.J.; Le Gouis, J.; Griffiths, S.; Bennett, M.J.; King, J.; et al. Phenotyping pipeline reveals major seedling root growth QTL in hexaploid wheat. J. Exp. Bot. 2015, 66, 2283–2292. [Google Scholar] [CrossRef]
- Maccaferri, M.; Sanguineti, M.C.; Corneti, S.; Ortega, J.L.; Salem, M.B.; Bort, J.; DeAmbrogio, E.; del Moral, L.F.; Demontis, A.; El-Ahmed, A.; et al. Quantitative Trait Loci for Grain Yield and Adaptation of Durum Wheat (Triticum durum Desf.) across a Wide Range of Water Availability. Genetics 2008, 178, 489–511. [Google Scholar] [CrossRef]
- Iannucci, A.; Marone, D.; Russo, M.A.; Vita, P.D.; Miullo, V.; Ferragonio, P.; Blanco, A.; Gadaleta, A.; Mastrangelo, A.M. Mapping QTL for Root and Shoot Morphological Traits in a Durum Wheat × T. dicoccum Segregating Population at Seedling Stage. Int. J. Genom. 2017, 2017, 6876393. [Google Scholar]
- Fan, X.; Zhang, W.; Zhang, N.; Chen, M.; Zheng, S.; Zhao, C.; Han, J.; Liu, J.; Zhang, X.; Song, L.; et al. Identification of QTL regions for seedling root traits and their effect on nitrogen use efficiency in wheat (Triticum aestivum L.). Theor. Appl. Genet. 2018, 131, 2677–2698. [Google Scholar] [CrossRef] [PubMed]
- Yang, X.; Liu, Y.; Wu, F.; Jiang, X.; Lin, Y.; Wang, Z.; Zhang, Z.; Ma, J.; Chen, G.; Wei, Y.; et al. Quantitative trait loci analysis of root traits under phosphorus deficiency at the seedling stage in wheat. Genome 2018, 61, 209–215. [Google Scholar] [CrossRef] [PubMed]
- Yang, M.; Wang, C.; Hassan, M.A.; Li, F.; Xia, X.; Shi, S.; Xiao, Y.; He, Z. QTL Mapping of Root Traits in Wheat under Different Phosphorus Levels Using Hydroponic Culture. BMC Genom. 2021, 22, 174. [Google Scholar] [CrossRef]
- Xu, F.; Chen, S.; Yang, X.; Zhou, S.; Chen, X.; Li, J.; Zhan, K.; He, D. Genome-Wide Association Study on Seminal and Nodal Roots of Wheat Under Different Growth Environments. Front. Plant Sci. 2021, 11, 602399. [Google Scholar] [CrossRef] [PubMed]
- Xu, F.; Chen, S.; Yang, X.; Zhou, S.; Wang, J.; Zhang, Z.; Huang, Y.; Song, M.; Zhang, J.; Zhan, K.; et al. Genome-wide Association Study on Root Traits under Different Growing Environments in Wheat (Triticum aestivum L.). Front. Genet. 2021, 12, 646712. [Google Scholar] [CrossRef]
- Ma, J.; Zhao, D.; Tang, X.; Yuan, M.; Zhang, D.; Xu, M.; Duan, Y.; Ren, H.; Zeng, Q.; Wu, J.; et al. Genome-Wide Association Study on Root System Architecture and Identification of Candidate Genes in Wheat (Triticum aestivum L.). Int. J. Mol. Sci. 2022, 23, 1843. [Google Scholar] [CrossRef]
- Beyer, S.; Daba, S.; Tyagi, P.; Bockelman, H.; Brown-Guedira, G.; IWGSC; Mohammadi, M. Loci and Candidate Genes Con-trolling Root Traits in Wheat Seedlings-a Wheat Root GWAS. Funct. Integr. Genom. 2019, 19, 91–107. [Google Scholar] [CrossRef]
- Alemu, A.; Feyissa, T.; Maccaferri, M.; Sciara, G.; Tuberosa, R.; Ammar, K.; Badebo, A.; Acevedo, M.; Letta, T.; Abeyo, B. Ge-nome-wide Association Analysis Unveils Novel QTLs for Seminal Root System Architecture Traits in Ethiopian Durum Wheat. BMC Genom. 2021, 22, 20. [Google Scholar] [CrossRef]
- Colombo, M.; Roumet, P.; Salon, C.; Jeudy, C.; Lamboeuf, M.; Lafarge, S.; Dumas, A.-V.; Dubreuil, P.; Ngo, W.; Derepas, B.; et al. Genetic Analysis of Platform-Phenotyped Root System Architecture of Bread and Durum Wheat in Relation to Agronomic Traits. Front. Plant Sci. 2022, 13, 853601. [Google Scholar] [CrossRef] [PubMed]
- Xu, Y.; Wang, R.; Tong, Y.; Zhao, H.; Xie, Q.; Liu, D.; Zhang, A.; Li, B.; Xu, H.; An, D. Mapping QTLs for yield and nitrogen-related traits in wheat: Influence of nitrogen and phosphorus fertilization on QTL expression. Theor. Appl. Genet. 2014, 127, 59–72. [Google Scholar] [CrossRef] [PubMed]
- An, D.; Su, J.; Liu, Q.; Zhu, Y.-G.; Tong, Y.; Li, J.; Jing, R.; Li, B.; Li, Z. Mapping QTLs for nitrogen uptake in relation to the early growth of wheat (Triticum aestivum L.). Plant Soil 2006, 284, 73–84. [Google Scholar] [CrossRef]
- Su, J.; Xiao, Y.; Li, M.; Liu, Q.; Li, B.; Tong, Y.; Jia, J.; Li, Z. Mapping QTLs for Phosphorus-Deficiency Tolerance at Wheat Seedling Stage. Plant Soil 2006, 281, 25–36. [Google Scholar] [CrossRef]
- Zeng, Z.B. Precision mapping of quantitative trait loci. Genetics 1994, 136, 1457–1468. [Google Scholar] [CrossRef]
- Basten, C.J.; Weir, B.S.; Zeng, Z.B. QTL CARTOGRAPHER, Version 1.15; Department of Statistics, North Carolina State University: Raleigh, NC, USA, 2001. [Google Scholar]
- Su, J.-Y.; Zheng, Q.; Li, H.-W.; Li, B.; Jing, R.-L.; Tong, Y.-P.; Li, Z.-S. Detection of QTLs for phosphorus use efficiency in relation to agronomic performance of wheat grown under phosphorus sufficient and limited conditions. Plant Sci. 2009, 176, 824–836. [Google Scholar] [CrossRef]
- Liu, J.; Zhang, Q.; Meng, D.; Ren, X.; Li, H.; Su, Z.; Zhang, N.; Zhi, L.; Ji, J.; Li, J.; et al. QMrl-7B Enhances Root System, Biomass, Nitrogen Accumulation and Yield in Bread Wheat. Plants 2021, 10, 764. [Google Scholar] [CrossRef] [PubMed]
- Sharma, S.; Xu, S.; Ehdaie, B.; Hoops, A.; Close, T.J.; Lukaszewski, A.J.; Waines, J.G. Dissection of QTL effects for root traits using a chromosome arm-specific mapping population in bread wheat. Theor. Appl. Genet. 2011, 122, 759–769. [Google Scholar] [CrossRef]
- Xie, Q.; Fernando, K.M.C.; Mayes, S.; Sparkes, D.L. Identifying seedling root architectural traits associated with yield and yield components in wheat. Ann. Bot. 2017, 119, 1115–1129. [Google Scholar] [CrossRef] [PubMed]
- Yuan, Y.; Gao, M.; Zhang, M.; Zheng, H.; Zhou, X.; Guo, Y.; Zhao, Y.; Kong, F.; Li, S. QTL Mapping for Phosphorus Efficiency and Morphological Traits at Seedling and Maturity Stages in Wheat. Front. Plant Sci. 2017, 8, 614. [Google Scholar] [CrossRef]
- Saini, D.K.; Chopra, Y.; Pal, N.; Chahal, A.; Srivastava, P.; Gupta, P.K. Meta-QTLs, ortho-MQTLs and candidate genes for nitrogen use efficiency and root system architecture in bread wheat (Triticum aestivum L.). Physiol. Mol. Biol. Plants 2021, 27, 2245–2267. [Google Scholar] [CrossRef]
- Bai, C.; Liang, Y.; Hawkesford, M.J. Identification of QTLs associated with seedling root traits and their correlation with plant height in wheat. J. Exp. Bot. 2013, 64, 1745–1753. [Google Scholar] [CrossRef] [PubMed]
- Quraishi, U.M.; Abrouk, M.; Murat, F.; Pont, C.; Foucrier, S.; Desmaizieres, G.; Confolent, C.; Rivière, N.; Charmet, G.; Paux, E.; et al. Cross-genome Map Based Dissection of a Nitrogen Use Efficiency Ortho-metaQTL in Bread Wheat Unravels Concerted Cereal Genome Evolution. Plant J. 2011, 65, 745–756. [Google Scholar] [CrossRef] [PubMed]
- Gruber, B.D.; Giehl, R.F.; Friedel, S.; von Wirén, N. Plasticity of the Arabidopsis Root System under Nutrient Deficiencies. Plant Physiol. 2013, 163, 161–179. [Google Scholar] [CrossRef] [PubMed]
- Lynch, J.P. Steep, cheap and deep: An ideotype to optimize water and N acquisition by maize root systems. Ann. Bot. 2013, 112, 347–357. [Google Scholar] [CrossRef]


Disclaimer/Publisher’s Note: The statements, opinions and data contained in all publications are solely those of the individual author(s) and contributor(s) and not of MDPI and/or the editor(s). MDPI and/or the editor(s) disclaim responsibility for any injury to people or property resulting from any ideas, methods, instructions or products referred to in the content. |
© 2023 by the authors. Licensee MDPI, Basel, Switzerland. This article is an open access article distributed under the terms and conditions of the Creative Commons Attribution (CC BY) license (https://creativecommons.org/licenses/by/4.0/).