1. Introduction
China is a large agricultural country in the world, and for promoting higher agricultural productivity, the agricultural mechanization level needs to be vigorously developed [
1]. The Action program for Agricultural Machinery Development (2016–2025) points out that the agricultural machinery manufacturing technology needs to be combined with digitalization and intelligence, strengthen key technologies to overcome difficulties, and improve the efficient supply capacity in China [
2]. In agricultural production, traditional tractors are driven by diesel engines, which produce a large amount of carbon dioxide, accounting for almost 20% of the global emissions. The indicators of pollution emissions and fuel consumption are more stringent [
3], requiring tractors to have more urgent needs for less emissions, zero emissions, less pollution, no pollution, and low noise. Therefore, the electric tractor came into being. In China, electric tractors are still in the primary research and development stage [
4], and facing the unique working environment of tractors, researchers are continuously concerned with the power performance of pure electric tractors. It is of great significance to select a reasonable driving mode and study its driving performance [
5].
Scholars and enterprises in relevant fields at home and abroad have conducted relevant research on electric tractors. In the 1970s, the General Electric Company in the United States developed an Elec-Trak series electric tractor [
6], which is driven by a permanent magnet brushless DC motor and uses six groups of lead-acid batteries as the power source. Its power range is 5.9~11 kW and the speed is 4.8~14.4 km/h [
7]. In the 1990s, the automobile industry underwent a dramatic transformation due to the development of new electronic and battery technologies, so these technologies are applied to the field of agricultural machinery, and tractors are being electronically and intelligently developed. Just under such a background, Electric tracker in Canada developed Ox series electric tractors, innovatively designed a gear box structure suitable for vehicle drive, and adopted an advanced electronic differential device to realize braking energy regeneration [
8].
In April 2017, an agricultural exhibition was held in Paris, France. John Deere showed an electric tractor named SESAM [
9], with a power of about 260 kW, a speed range of 4 km/h to 80.47 km/h, a cruising range of about 55 km, and full charging in about 3 h. In the same year, German agricultural machinery manufacturer Fendt developed a small electric tractor-e100 Vario, with a power of 50 kW, a fast charge technology, a battery life of about 5 h, and a remote network control function, which was fully launched in 2019 [
10].
In China, Yituo and General Electric Company from the United States jointly developed an electric tractor in 2012. Because of its energy conservation and environmental protection, it plays a major role in lawn pruning and yard maintenance and can complete some farmland operations, which is widely used. South China Agricultural University developed a stepping two-row rice transplanter [
10], which is powered by a lithium battery and driven by a 135 W DC permanent magnet motor.
At the 10th Jiangsu International Agricultural Machinery Exhibition in 2019, a FISON 01 electric tractor was displayed, which can realize electric remote control, small body, strong horsepower, zero emission, and zero pollution. China Yituo Group Corporation developed the Dongfanghong ET1400 electric tractor, which adopts a dual-motor structure and the rated power of the drive motor and PTO motor is 5.5 kW. Moreover, in 2021, the ET1004-W wheel-side concept electric tractor developed by China Yitong was unveiled at the Agricultural Machinery Exhibition held in Nanjing. The prototype vehicle adopts a wheel-side motor as the driving form, electrically driven independent PTO technology, can set a variety of working modes, and can realize unmanned driving function, with high flexibility, safety, adaptability, and intelligence.
Jiangsu University designed the tractor mechanical electronic hydraulic power system according to the characteristics of hydraulic mechanical composite transmission and an electromechanical hybrid power system, which is suitable for the driving requirements of complex working conditions and frequent operations [
11].
According to the Introduction, research on real electric tractors is generally based on enterprises. Most of these electric tractors are driven by a single motor or double motor and only a few used wheel-side drive, which is a prototype tractor.
However, more researchers used the bench test to study the drive system of electric tractors. In 2020, Xie Bin’s team at China Agricultural University designed a dual-input coupled power transmission system (DICPS) [
12] and proposed an energy management strategy for optimal system efficiency in order to study its energy utilization rate. The overall efficiency increased by 9.8%. Then, the team continued to deepen research on this transmission system and proposed a two-layer collaborative parameter optimization method based on particle swarm optimization and dynamic programming algorithms [
13]. The drive efficiency increased by 12.19%, the power consumption per kilometer was reduced, and the operating mileage was increased. Moreover, the team established a mathematical model of the drive system and designed an electric tractor drive system composed of double motors and a coupling transmission system and conducted hardware in the loop experiments. The results show that the drive system can improve the efficiency of tillage and rotary tillage by about 10% [
14].
Northwest Agriculture and Forestry University designed a hydraulic drive system for hillside crawler tractors and built a test bed for a transmission system performance test. The results show that the system has sufficient power reserve and can meet the requirements of a large workload [
15]. Pengjun Mao and Shanshan Yin from Henan University of science and technology transformed the traditional tractor, replaced the engine with eight 12 V batteries and a brushless DC motor drive, and built a new electric tractor test bench [
16].
Moreover, Liyou Xu built a comprehensive test system platform to complete the performance test for a power system motor and energy system battery pack. The test results meet the main performance characteristics of the whole machine [
17]. Mengnan Liu designed a two-way coupling device for electric tractors, which can realize the two-way coupling flow of power and smooth power transmission and can meet the requirements of tractor multi-working conditions [
18].
In 2022, the National Pingtung University of science and technology in Taiwan developed an electric tractor platform, which uses two 7.5 kW induction motors driven by lithium batteries, the working time is 3.5 h, and carried out finite element optimization design on its bending, torsion, and negative braking strength through ABAQUS [
19].
The Matache M.G team used a 28.8 kW electric tractor experimental platform to design a two-factor three-level experiment on the plowing depth and driving speed for the optimal working point of the electric tractor under the plowing state and, at the same time, analyzed the slippage of the tractor under the operating state. The results showed that the autonomous performance of the electric tractor is closely related to the power and slipping efficiency of the electric tractor, both of which directly affect the power consumption of the electric tractor [
20].
Krzysztof Plizga’s team at the University of Life Sciences in Lublin is analyzed here. Based on the analysis of the power model of the electric tractor, the energy consumption law of the battery pack under different ambient temperature, driving distance, and load conditions are obtained. Relatively speaking, driving distance and energy consumption have the greatest significance, followed by ambient temperature and load [
21].
Seung Yun Baek’s team at Chungnam National University in South Korea designed an 80 kW four-wheel-drive electric tractor. Using Simulation X to analyze the tractor’s plow operation load data through the operation load and road experiments, the plow rake was carried out for 120 s, including straight running and rotation, the maximum torque of the plow rake is 5167 Nm, and the maximum torque of the axle is 3731 Nm. According to the asphalt road experiment, the maximum torque of the axle is 2311 Nm [
22].
Zhenzhen Wang designed a reconfigurable and innovative test bench for electric tractors and chose a series of hybrid electric powertrains to conduct the rotary tillage experiment on this test bench in terms of pure electric configuration and series hybrid electric configuration. The experimental results validate the feasibility of the reconfigurable test platform [
23]. In 2022, at Henan University of Science and Technology, China, Xu Liyou’s team took the YTO-500 tractor as the research object and designed and calculated the overall scheme and parameters of the drive system. The energy system, motor system, and mechanical part models were established by using Modelica, and a simulation test of traction and transportation conditions was carried out. Under the simulation of traction conditions and 400 s transportation conditions, the simulation results were consistent with the experimental results [
24].
At present, various new technologies have been gradually applied to tractors and various tractor products with new structures have been emerging. The technical content has been continuously improved, and the performance of the whole vehicle has been continuously enhanced [
25]. However, at present, the tractors developed by major enterprises at home and abroad are high-power farming tractors. Most of the research in colleges and universities is based on the test bench. There are few real vehicle prototypes of small- and medium-sized electric tractors used for working in paddy and dry fields. Therefore, based on this, this paper develops a small distributed drive electric tractor and examines its dynamic performance under the working conditions of paddy and dry fields. It provides a test and method reference for the development of new intelligent electric tractor products.
2. Materials and Methods
2.1. Determination of Drive System Scheme for Electric Tractor
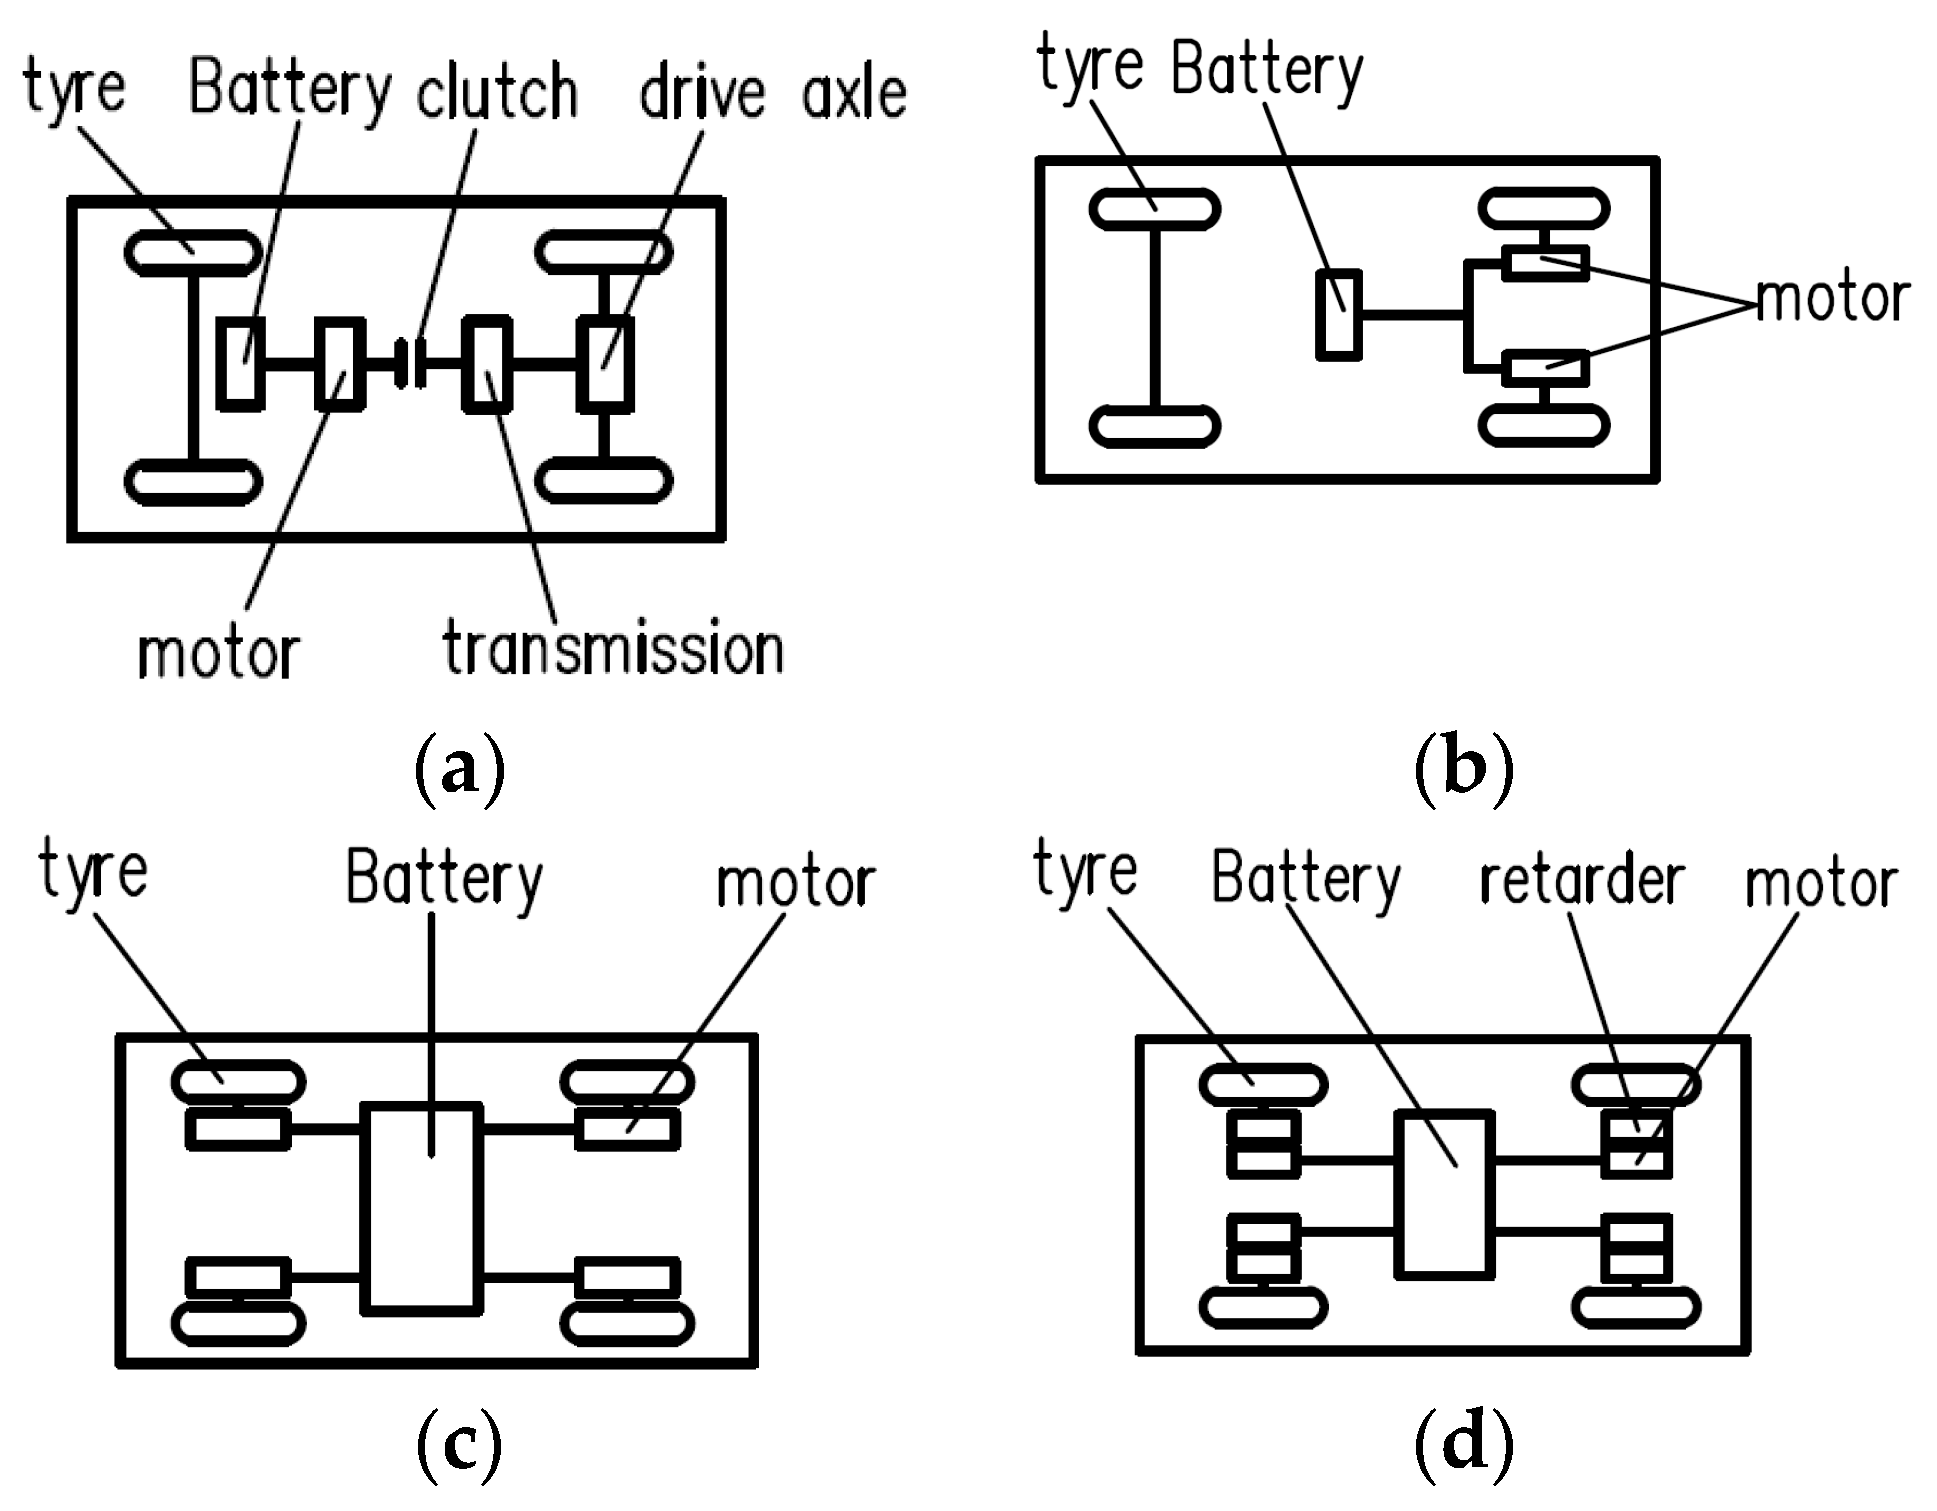
Electric vehicle drive system can be divided into single-motor drive, double-motor drive, or four-motor drive. Adopting different driving modes according to different working forms of different vehicles can effectively improve the driving efficiency and energy utilization of the whole vehicle, so as to extend the mileage. At present, the electric vehicle drive system mainly has several layout forms, as shown in
Figure 1 [
26].
According to the structure of several different driving modes shown above, their advantages and disadvantages are listed, as shown in
Table 1.
The wheel tractor in paddy and dry fields needs a large driving torque when facing potholes. At the same time, in order to improve the land utilization rate and reduce repetitive work, the turning radius of the tractor should be as small as possible. In order to meet its performance requirements, this paper finally adopts scheme (d) as the driving scheme of the distributed drive electric tractor. In order to verify the basic performance of the designed electric tractor, various sensors are arranged on the body to monitor the real-time working state of the tractor. A structural diagram of the driving system, working system, and sensor arrangement of the DDET is shown in
Figure 2.
2.2. Dynamic Performance Evaluation Index of the DDET
A force diagram of the DDET is shown in
Figure 3.
In the figure, is the fuselage load, N; is the distance from front axle to rear axle, m; , are, respectively, the distance from the center of mass to the front and rear axles, m; is the traction resistance of the hook, N; is the horizontal component of hook traction resistance; , are, respectively, the rolling resistance of the ground to the front and rear-drive wheels, N; , are, respectively, the vertical reaction force of the ground to the front and rear wheels, N; is the centroid height, m; is the height of the hook traction point from the ground, m; is the wheel radius, m; is the distance from the traction point to the center of the rear wheel, m.
When the electric tractor is towing on a horizontal road, the driving speed is generally low, so the ramp resistance , acceleration resistance , and air resistance can be ignored, which are mainly affected by the rolling resistance and traction resistance . The traction resistance is unique to the electric tractor during traction operation. At this time, the traction performance is an important index to measure the dynamic performance of the DDET during traction operation.
The force balance equation of the electric tractor under traction conditions is as follows:
where
is the driving force, N;
is rolling resistance, N;
is traction resistance (also ploughing resistance), N.
Rolling resistance
can be expressed by the following formula:
where
is the rolling resistance coefficient of the tractor.
The electric tractor designed in this paper adopts a distributed wheel drive system. In order to evaluate the advantages and disadvantages of this drive mode, it is necessary to evaluate its various performance indicators. At present, the most commonly used vehicle dynamic performance evaluation indicators mainly include traction performance, climbing performance, acceleration time, and driving speed. The electric tractor mainly works in the field. Due to its poor working environment, its working condition is more complex than when running on ordinary roads. Referring to the performance indicators of electric vehicles, this paper will select the following indicators to analyze the distributed drive system, in order to verify the rationality of parameter matching.
2.3. Dynamic Performance Evaluation Index
The most important function in the drive system is to provide driving force for the whole vehicle so that it can better complete the operation. Therefore, the power performance is the most important indicator in evaluating the overall performance. Tractors working in the field need to tow farm tools and drive at a low speed, so they need a large traction force. They also need climbing ability when encountering sloping ground, so the traction performance, the maximum climbing gradient, and traction efficiency are used to evaluate the dynamic performance of the DDET.
The DDET can achieve the maximum traction force as far as possible on various agricultural grounds. Due to the low operating speed of the tractor, the influence of the air resistance and acceleration resistance is definitely small and can be ignored, so it is mainly affected by rolling resistance and traction resistance .
The formula for calculating the traction resistance produced by farm implements during ploughing operations is as follows:
where
is the number of plowshares;
is the specific resistance of soil, N/cm
2;
is the width of a single plowshare, cm;
is the tillage depth, cm.
Due to the complex and changeable working conditions of the DDET, it has the characteristics of fluctuating working load, which requires 10%~20% of the reserve traction force to be reserved. Therefore, the final rated traction force is as follows:
- (2)
Maximum climbing gradient
The maximum climbing gradient is another index to evaluate the dynamic performance. When the tractor is working, the road surface will be uneven and climbing. However, there is no mountain with large gradient and the gradient is generally relatively small. If the tractor is driven on the slope with gradient angle
, its weight will produce a component force that always points to the downhill direction, which is usually called climbing resistance. The climbing resistance of the trailer and goods as a whole can be expressed as follows:
where
is the total weight of the trailer and cargo.
At the same time, there is rolling resistance when the tractor goes uphill and its direction is the same as the climbing resistance. The expression is as follows:
Therefore, the traction force required by the DDET containing the trailer and cargo when climbing the slope is as follows:
Finally, the total traction balance equation of the tractor during climbing is as follows:
In the formula, is the slope angle.
In addition, the transmission route of the DDET is as follows. The torque generated by the motor is first transmitted to the wheel drive system and then transmitted to the drive wheel after reducing the speed and increasing torque. Therefore, the calculation of driving force generated by the DDET is as follows:
where
is the output torque of the single motor, N · m;
is the total transmission ratio of transmission line;
is the total traction efficiency;
is the radius of driving wheel, m.
From Equations (8) and (9), the formula of slope angle
is as follows:
The climbing slope is a tangent function of the slope angle, so the climbing slope
can be expressed as follows:
The third index for evaluating the dynamic performance of the DDET is the proportion of the traction power generated by the driving wheel of the tractor in the effective power of the motor, that is, the traction efficiency, which is expressed as follows:
where
is the rated traction force of the tractor, N;
is the motor driving voltage, V;
is the internal current of the motor, A;
is the tractor speed, km/h.
It can be further expressed as follows:
where:
is the efficiency of the drive motor, ŋ
m is the total efficiency of the power train,
is the slip efficiency,
,
is the slip rate of the driving wheel,
is the rolling efficiency of the driving wheel,
,
is the battery discharge efficiency, and
is the efficiency of the motor controller.
Since the electric tractor adopts four-wheel independent drive, the efficiency of each drive motor is different. The total traction efficiency of the electric tractor is obtained by averaging the four-wheel traction efficiency.
2.4. Parameter Matching of the DDET
According to the driving scheme and design goal of the DDET prototype test platform, the selection of various parts and parameters is completed. A permanent magnet brushless DC motor is used as the motor, lithium iron phosphate battery is used as the battery, planetary gear wheel reducer is used as the reducer, and the tractor parts and their parameters are shown in
Table 2.
2.5. Analysis of Influence Factors on Dynamic Performances of the DDET
The dynamic performances of the DDET are closely related to the driving motor, so the working characteristics of the motor are studied experimentally.
- (1)
Hub motor characteristics
A hub motor test bed was built in a laboratory, shown in
Figure 4, which has a permanent magnet brushless DC motor, a lithium iron phosphate battery, a torque and speed sensor, a magnetic powder brake, and measuring and control equipment. During the test, the sensor receives signals and transmits them to the upper computer. Finally, the data are exported for the analysis of experimental results.
When the motor signal is given, the motor rotates. Then, the magnetic powder brake is used to load the motor by means of equal loading. At this time, the sensor collects the speed and torque signal to the control platform, which can monitor the motor running status in real time and record the data.
The motor characteristics are tested on the built hub motor test platform, and the relationship between motor speed and torque is shown in
Figure 5.
It can be concluded that the motor characteristic fitting curve formula is as follows:
where:
is the motor speed, r/min and
is the motor output torque, N · m. It can be seen from the figure that the motor has the external characteristics of low speed and high torque, and the maximum torque can reach about 100 N · m.
After the test, the relationship between motor speed, torque, and efficiency is shown in
Figure 6. It can be seen from the figure that the maximum efficiency of the motor can reach about 90%, and the hub motor has the advantage of high efficiency.
The relationship between tractor running speed, motor speed, and reduction ratio is shown in Equation (15).
where:
is the motor speed;
is the tire radius;
is the transmission ratio of wheel reducer.
It can be seen that the main factors affecting the driving speed of the DDET are motor speed, tire radius, and wheel reducer. According to the parameters in
Table 2, the relationship between the motor speed and the tractor running speed is shown in
Figure 7.
It can be seen from
Figure 7 and the calculation results of theoretical data that the vehicle speed of the DDET designed in this paper is 18 km/h at the rated motor speed and about 29 km/h at the maximum motor speed. At the same time, the signal when stepping on the accelerator pedal is transmitted to the motor controller to control the motor speed. The relationship between the depth of stepping on the accelerator pedal and the tractor running speed is shown in
Figure 8.
- (3)
The traction performance analysis
The traction force of the DDET mainly comes from the output torque of the motor and the torque-increasing function of the reducer. According to the motor characteristic curve in
Figure 5, the driving torque of a single motor is about 100 N · m, as in Equation (9), where the traction force
generated by the DDET is about 4680 N. Because of the motor overload coefficient of about 20%, the maximum traction force that the tractor can generate is about 5600 N. The relationship curve between the vehicle speed and the traction force is shown in
Figure 9.
The relationship between the driving speed and the traction power is shown in
Figure 10. It can be seen from the figure that the maximum traction power is about 32 kW, which is consistent with the maximum power provided by the four motors, according to the data in
Table 2.
The traction efficiency of the DDET is closely related to the motor. The relationship between the motor speed, motor power, and efficiency was measured on the hub motor characteristic test bench. Through the performance analysis of the whole vehicle, it can be concluded that the relationship between the tractor driving speed, the total power of the four motors, and the traction efficiency of the whole vehicle meets the relationship shown in
Figure 11.
It can be seen from
Figure 11 that the maximum total traction efficiency is about 80%, and the range of the efficiency point above 60% is large. At this time, the total driving power of the motor is between 20 kW and 30 kW (that is, the power of a single motor is between 5 kW and 7.5 kW), and the traction efficiency increases with the increase in the electric power. Simultaneously, the driving speed of the tractor is about 25 km/h, which corresponds to the maximum speed of the motor.
By analyzing the tractive force, tractive power, and total tractive efficiency of the tractor, it can be concluded that the overall tractive performance of the tractor is good.
- (4)
The climbing slope analysis
According to Formula (11) for calculating the climbing gradient, the climbing gradient is not only related to the body mass, tire radius, traction efficiency, rolling resistance coefficient, and other factors, but also related to the torque and driving speed provided by the motor. When the basic parameters of the DDET are determined, the driving speed and climbing gradient of the tractor meet the curve relationship shown in
Figure 12.
It can be seen from
Figure 12 that when the resistance coefficient of a certain road surface is determined, the DDET can achieve a maximum climbing gradient of about 40% under the conditions of single-motor maximum output torque of 100 N · m and four-motor total output torque of 400 N · m.
2.6. Dynamic Performance Design Objectives
According to the indicators listed above, we could query and compare the parameters of 25 HP and 30 HP electric tractors on the market and determine the power performance design objectives of the DDET, as shown in
Table 3.
2.7. The Simulation of the DDET’s Dynamic Performances Based on Advisor
We used Advisor software to simulate the dynamic performances of the DDET for verifying the theoretical analysis. The whole tractor simulation model is shown in
Figure 13.
According to the actual tractor parameter values designed in this paper, as shown in
Table 2, we simulated and set the tractor’s parameters of the simulation model in Advisor. The simulation operation interface of the DDET after setting is shown in
Figure 14.
- (1)
The working condition setting
According to the DDET’s dynamic performances, we designed two working conditions. One is the transportation condition and the other is the ploughing condition.
On the basis of the calculation of the tractor’s parameters, the DDET’s driving speed at the rated speed of the motor (i.e., the transportation speed) is about 18 km/h. Therefore, the tractor transportation operation conditions are compiled, as shown in
Figure 15.
The time of the single transportation condition is set as 300 s. It can be seen from
Figure 15 that the maximum speed is 18 km/h, the average speed is 14.1 km/h, and the running mileage is 1.19 km. Further, 10 working cycles are set during simulation.
When the tractor is plowing, the speed is about 6 km/h. Therefore, the tractor plowing operation conditions are compiled, as shown in
Figure 16.
The time of the single ploughing condition is set as 300 s. It can be seen from
Figure 16 that the maximum speed is 7.64 km/h, the average speed is 5.75 km/h, and the running mileage is 0.48 km. Further, 10 working cycles are set during simulation.
To conduct the experimental simulation, click the “run” icon in the lower-right corner of the condition-setting page. The simulation results of the transportation condition are shown in
Figure 17a and the simulation results of the ploughing condition are shown in
Figure 17b.
The simulation results of driving speed, traction force and four-motor output torque during the transportation situation are shown in
Figure 17a. According to the curve and data results, the DDET’s traction force is stable at about 2700 N and the maximum value is about 3500 N. Meanwhile, the maximum driving speed of the DDET can reach 28.5 km/h and the acceleration time of 0~18 km/h is 1.2 s. At the same time, the four-motor total output torque is stable at about 260 N · m and the maximum value is 370 N · m, that is, a single motor’s output torque is 65 N · m and the maximum is 92.5 N · m. Further, the maximum climbing gradient simulated under this transportation condition is 43.1%. Therefore, in summary, the DDET can meet the set working conditions during transportation.
It is assumed that the road surface ploughed by the DDET is level land, so it is unnecessary to obtain slope information. The simulation results of driving speed, traction force, and four-motor output torque during the ploughing condition are shown in
Figure 17b. According to the curve and data, the DDET’s traction force is stable at about 4500 N, the maximum value can reach about 5500 N, and the tractor’s acceleration time of 0~6 km/h is 0.4 s. At the same time, the four-motor total output torque is about 460 N · m, that is, a single motor’s output torque is 115 N · m (within the range of overload coefficient), which can complete the plowing operation condition.
The simulation results are consistent with the dynamic performance analysis curve in
Section 2.6. Therefore, the designed electric tractor can meet the requirements of dynamic performances.
3. Results and Discussion
- (1)
Traction Performance Test
The electric tractor designed in this paper is a distributed drive system. In order to verify the advantages of distributed drive and the dynamic performance of the DDET, a traction test of the DDET is carried out.
According to the parameter matching and layout of the components of the DDET, as shown in
Table 2, the prototype of the whole vehicle test platform is designed and built, as shown in
Figure 18.
The test was carried out in open space in the Science and Technology Industrial Park of Nanjing Tech University. A tension-pressure sensor with a range of 0~5 t was used to measure the hook traction force of the DDET, with both ends connected by lifting rings, as shown in
Figure 19.
In order to read data in time, this test is equipped with a tension-pressure sensor display instrument for data acquisition and recording, as shown in
Figure 20. It tows an iron block weighing 3 tons, as shown in
Figure 21.
Specific test process: the selected iron block provides load for the tractor. Before the experiment, keep a proper distance between the DDET and the iron block. The tension-pressure sensor is located between the prototype and the iron block. After the instrument is powered on, place it on the tractor to observe the reading. The lifting ring at one end of the sensor is connected to the rear of the frame with a rope, and the lifting ring at the other end is connected to the front end of the towed weight with a rope. At the beginning of the test, the tractor driver uses the accelerator pedal. At this time, read and record the instrument data from the tension-pressure sensor. The test process is shown in
Figure 22.
During the test, read the data from the display instrument after the data are stable. Since the data obtained by the sensor are a quality attribute, they need to be multiplied by a gravitational acceleration of 9.8 m/s
2 when converting them into a tensile force. At the same time, for the accuracy of the test, the test is repeated five times, and the average value is taken for five times. The recorded data are shown in
Table 4.
It can be concluded from the table that the designed traction force of the DDET is about 5400 N, reaching the design goal of traction force in
Table 3, so the test results are reasonable.
- (2)
Maximum speed and acceleration performance test
The DDET uses the hub motor to drive the reducer to transmit power to the tires. According to the characteristics of the hub motor and the speed calculation formula, the rated driving speed of the tractor is 18 km/h and the maximum speed is 29 km/h. The test determines the shortest time required to accelerate the tractor from the initial speed to the maximum speed measurement to verify the acceleration performance of the whole vehicle. At the same time, the maximum speed can be obtained through the built-in sensor display of the prototype.
On a road where no one can walk at will, the driver drives the tractor to step on the accelerator pedal when it is stationary, and the data collected by the wheel speed sensor are transmitted to the LabVIEW data acquisition unit; that is, the running speed of the tractor is completely recorded, analyzed, and obtained after the test. The speed performance test process is shown in
Figure 23.
In order to avoid measurement error, this test is completed five times in the same way as above and the data are recorded, respectively. Find the time node corresponding to 0 km/h and the time node corresponding to the maximum speed in the collected data. The difference between two times is the acceleration time (the time point of LabVIEW data collection is accurate to four decimal places). The data recorded in the five tests are shown in
Table 5.
It can be seen from the table that the average value of the tractor accelerating to the maximum speed is 28.15 km/h, which is similar to the theoretical curve of dynamic performance and the simulation results. The time to accelerate to maximum speed is about 5.5279 s, which is slightly longer than the simulation time. The possible reasons for the error may be as follows: ① the rolling resistance coefficient of the actual road surface is different from the simulation setting; ② the test is not conducted when the battery is fully charged; ③ the driver has a poor reaction when stepping on the pedal. However, the speed of the tractor is slow, but there is no excessive requirement for the acceleration time. On the whole, the speed performance of theDDET meets the requirements.


