


Feature Extraction on the Difference of Plant Stem Structure Based on Ultrasound Energy

Abstract
:1. Introduction
2. Methods
2.1. Common Energy Features of Ultrasound in Plant Stems
2.1.1. Mean and Variance of Ultrasound Echo Signals
2.1.2. Spectral Features
2.2. Improvement of Ultrasound Features
2.3. The Evaluttion of the Contribution of the Feature
2.3.1. Information Gain
2.3.2. Evaluation of Correlation
3. Results
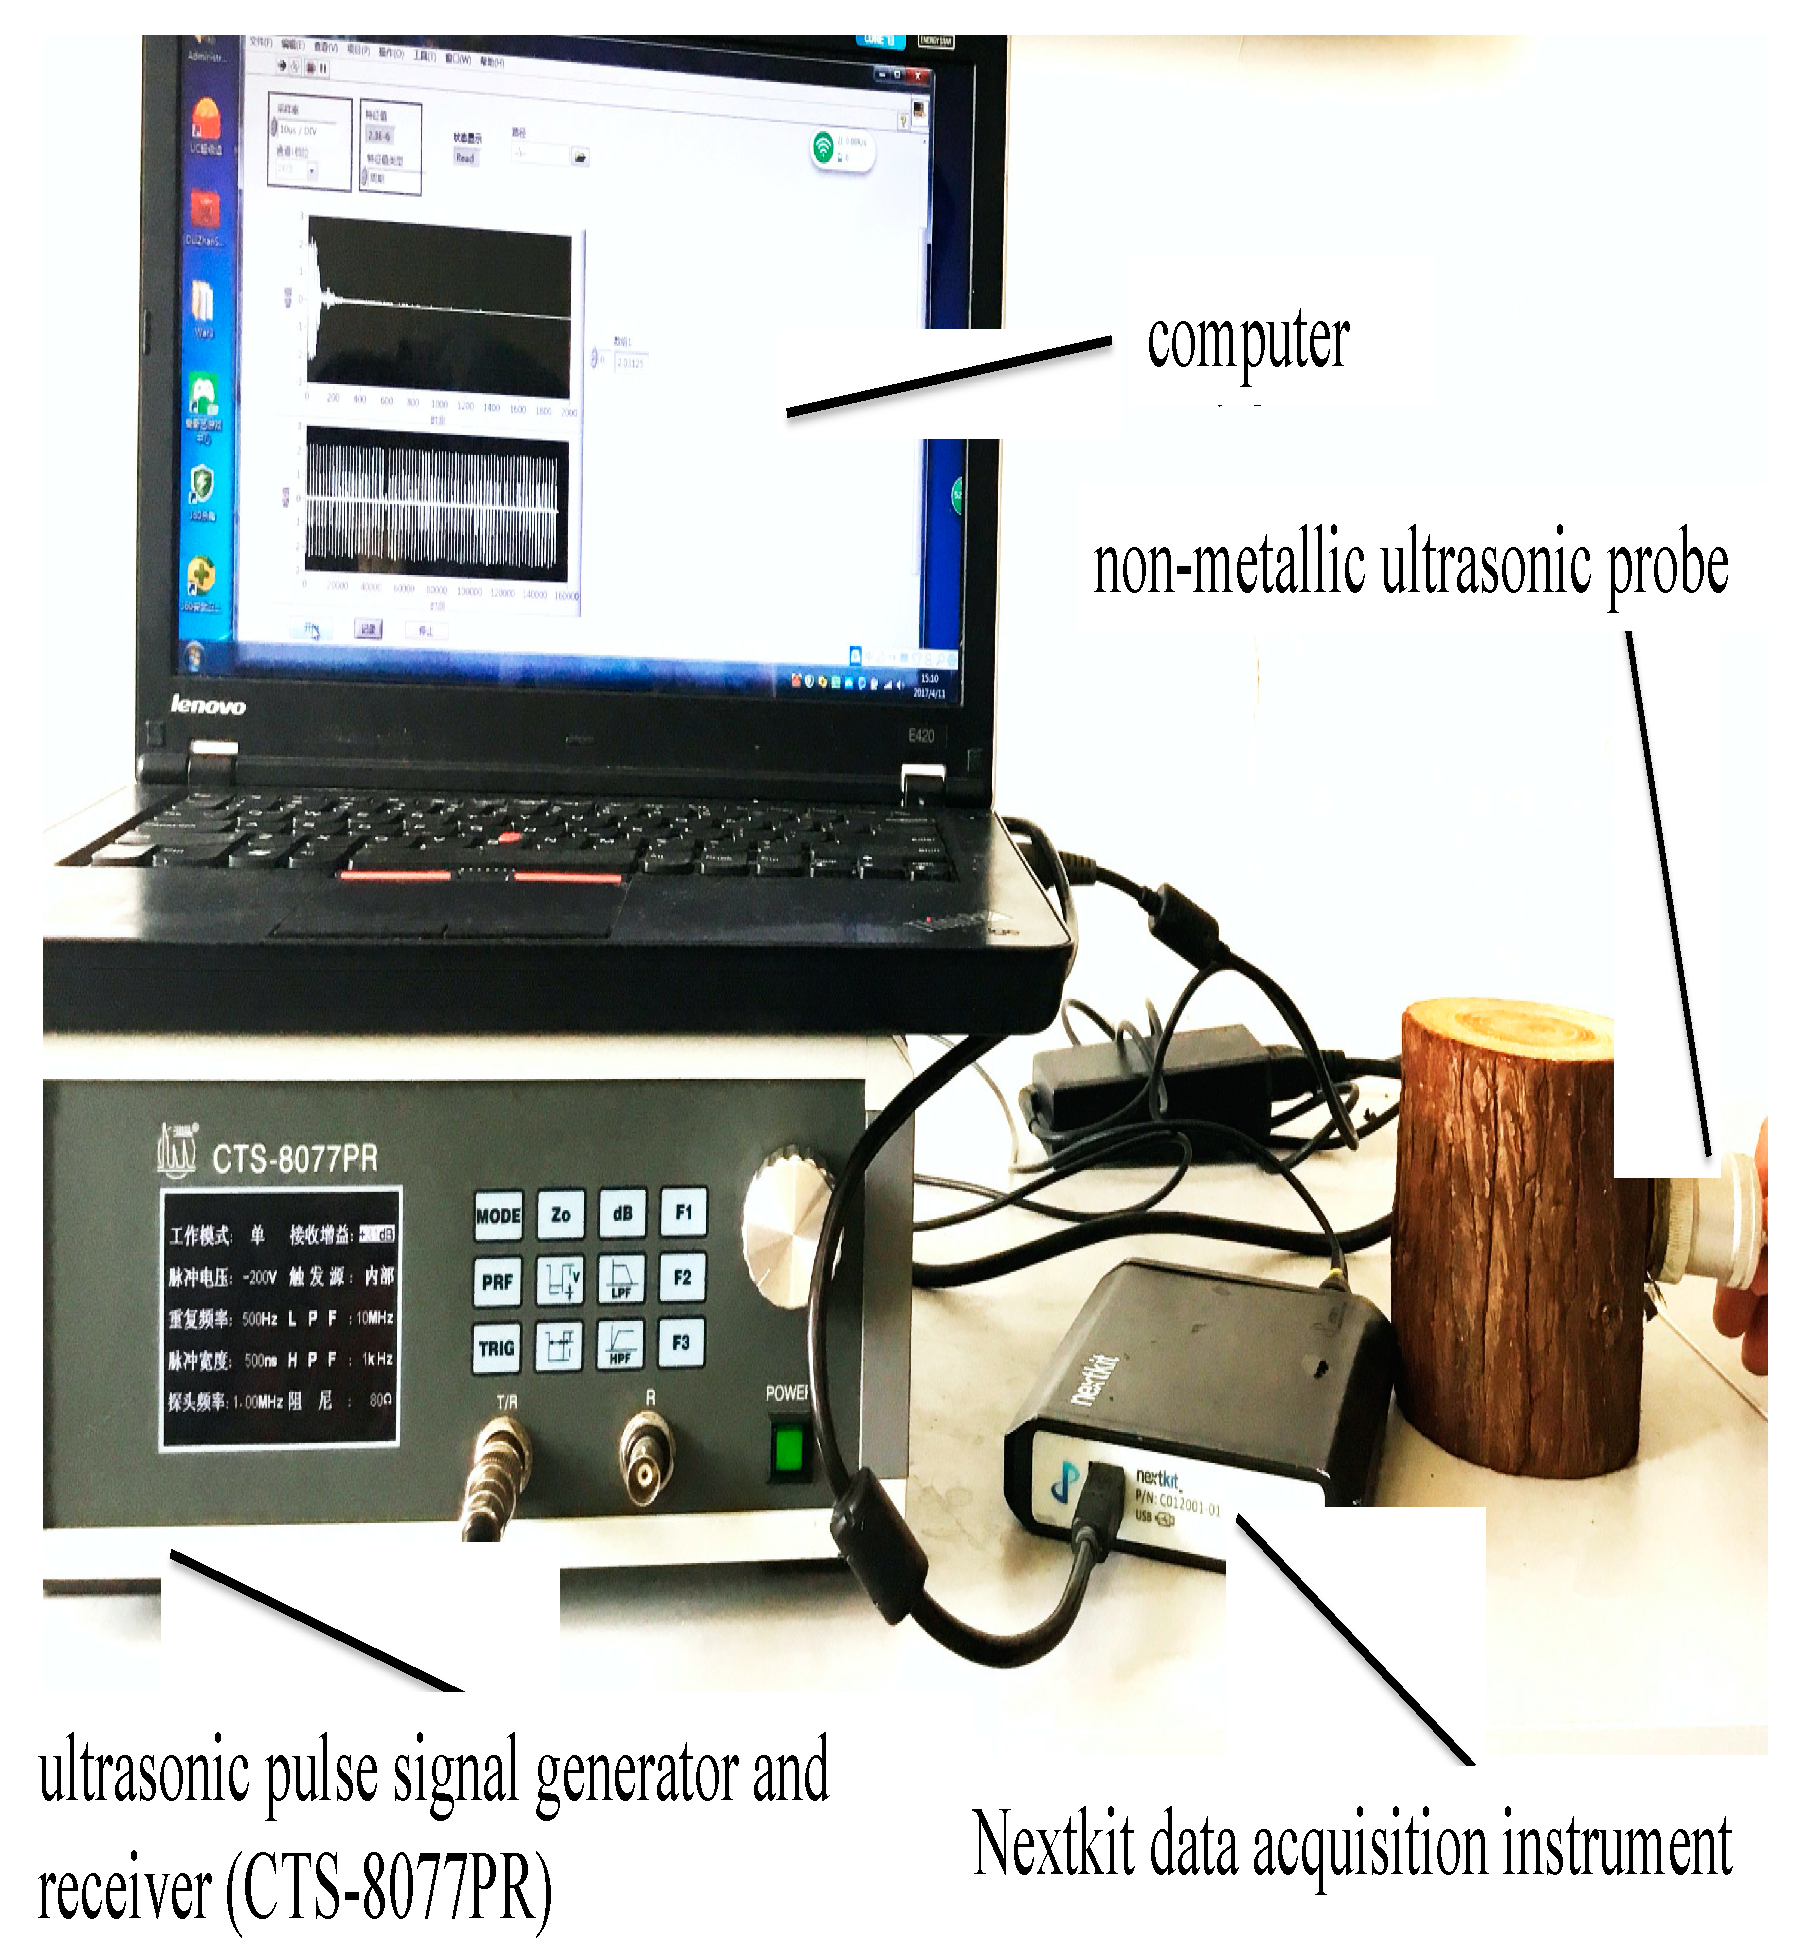
3.1. Simulation Experiment
3.2. Different Ultrasonic Manifestations of Stem and Body Structure of Different Tree Species
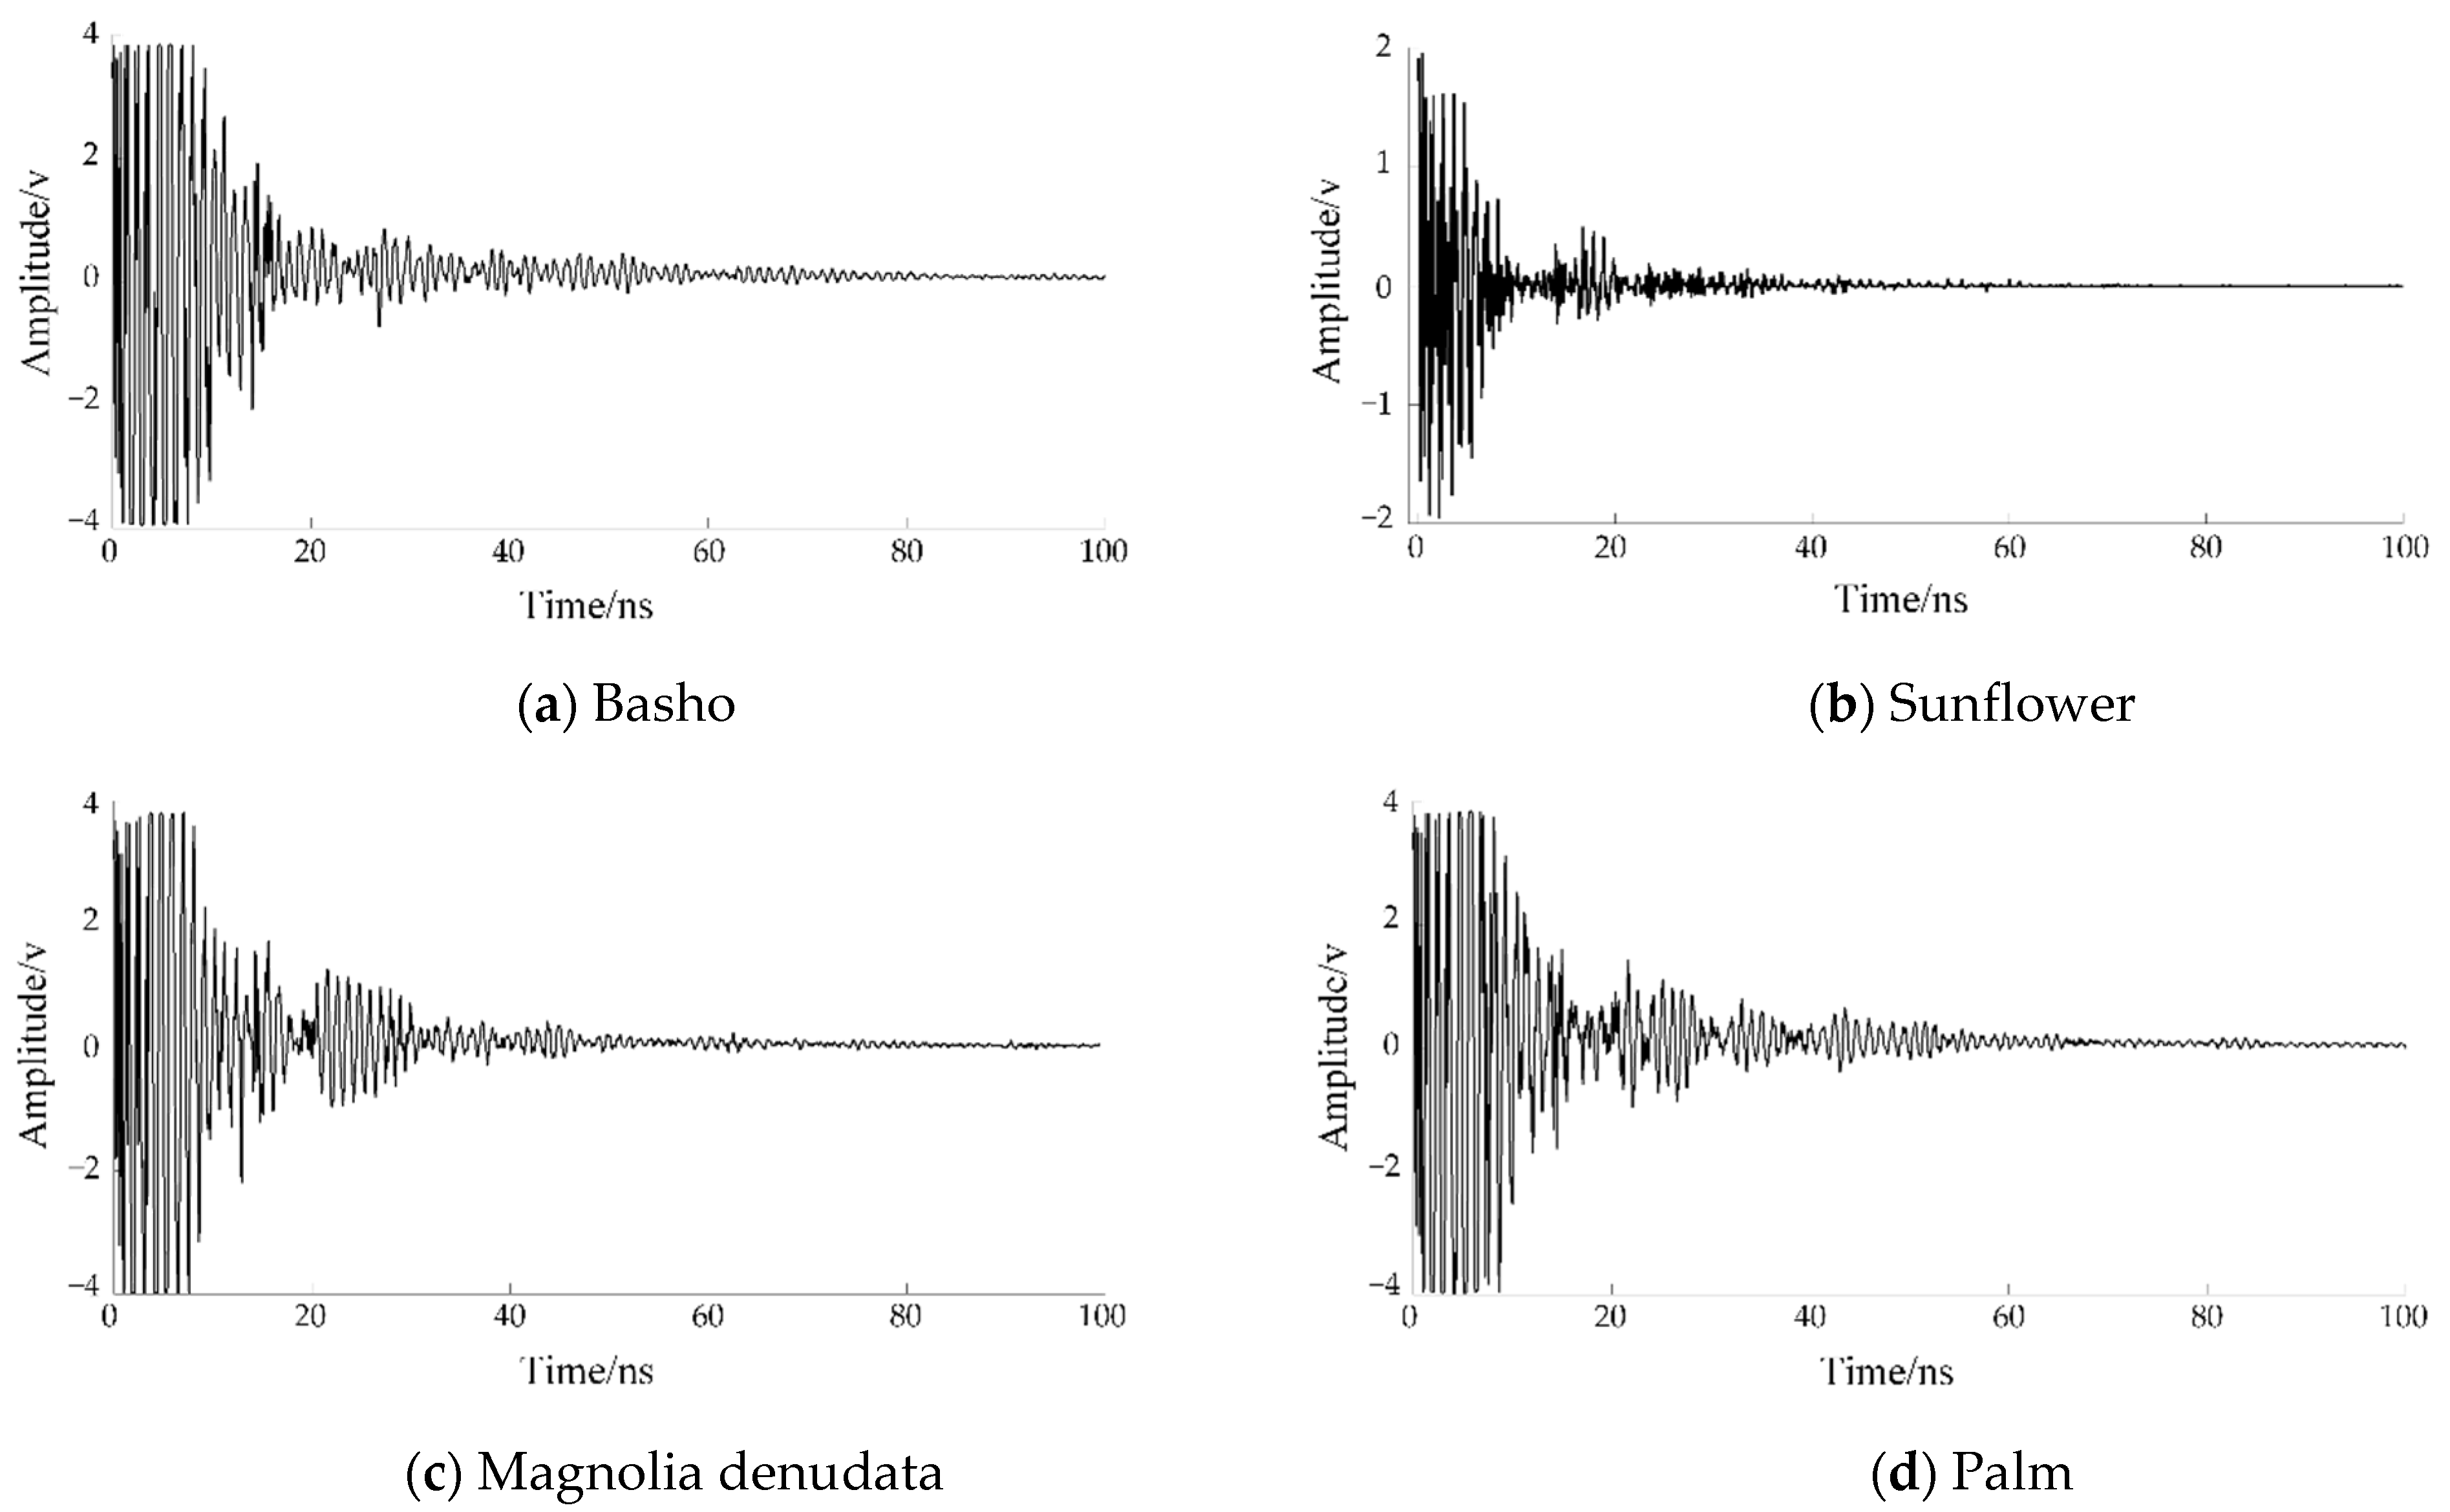
3.2.1. Ultrasonic Signals of Plant Stems in Time and Frequency Domain
Ultrasound Signal in Time Domain
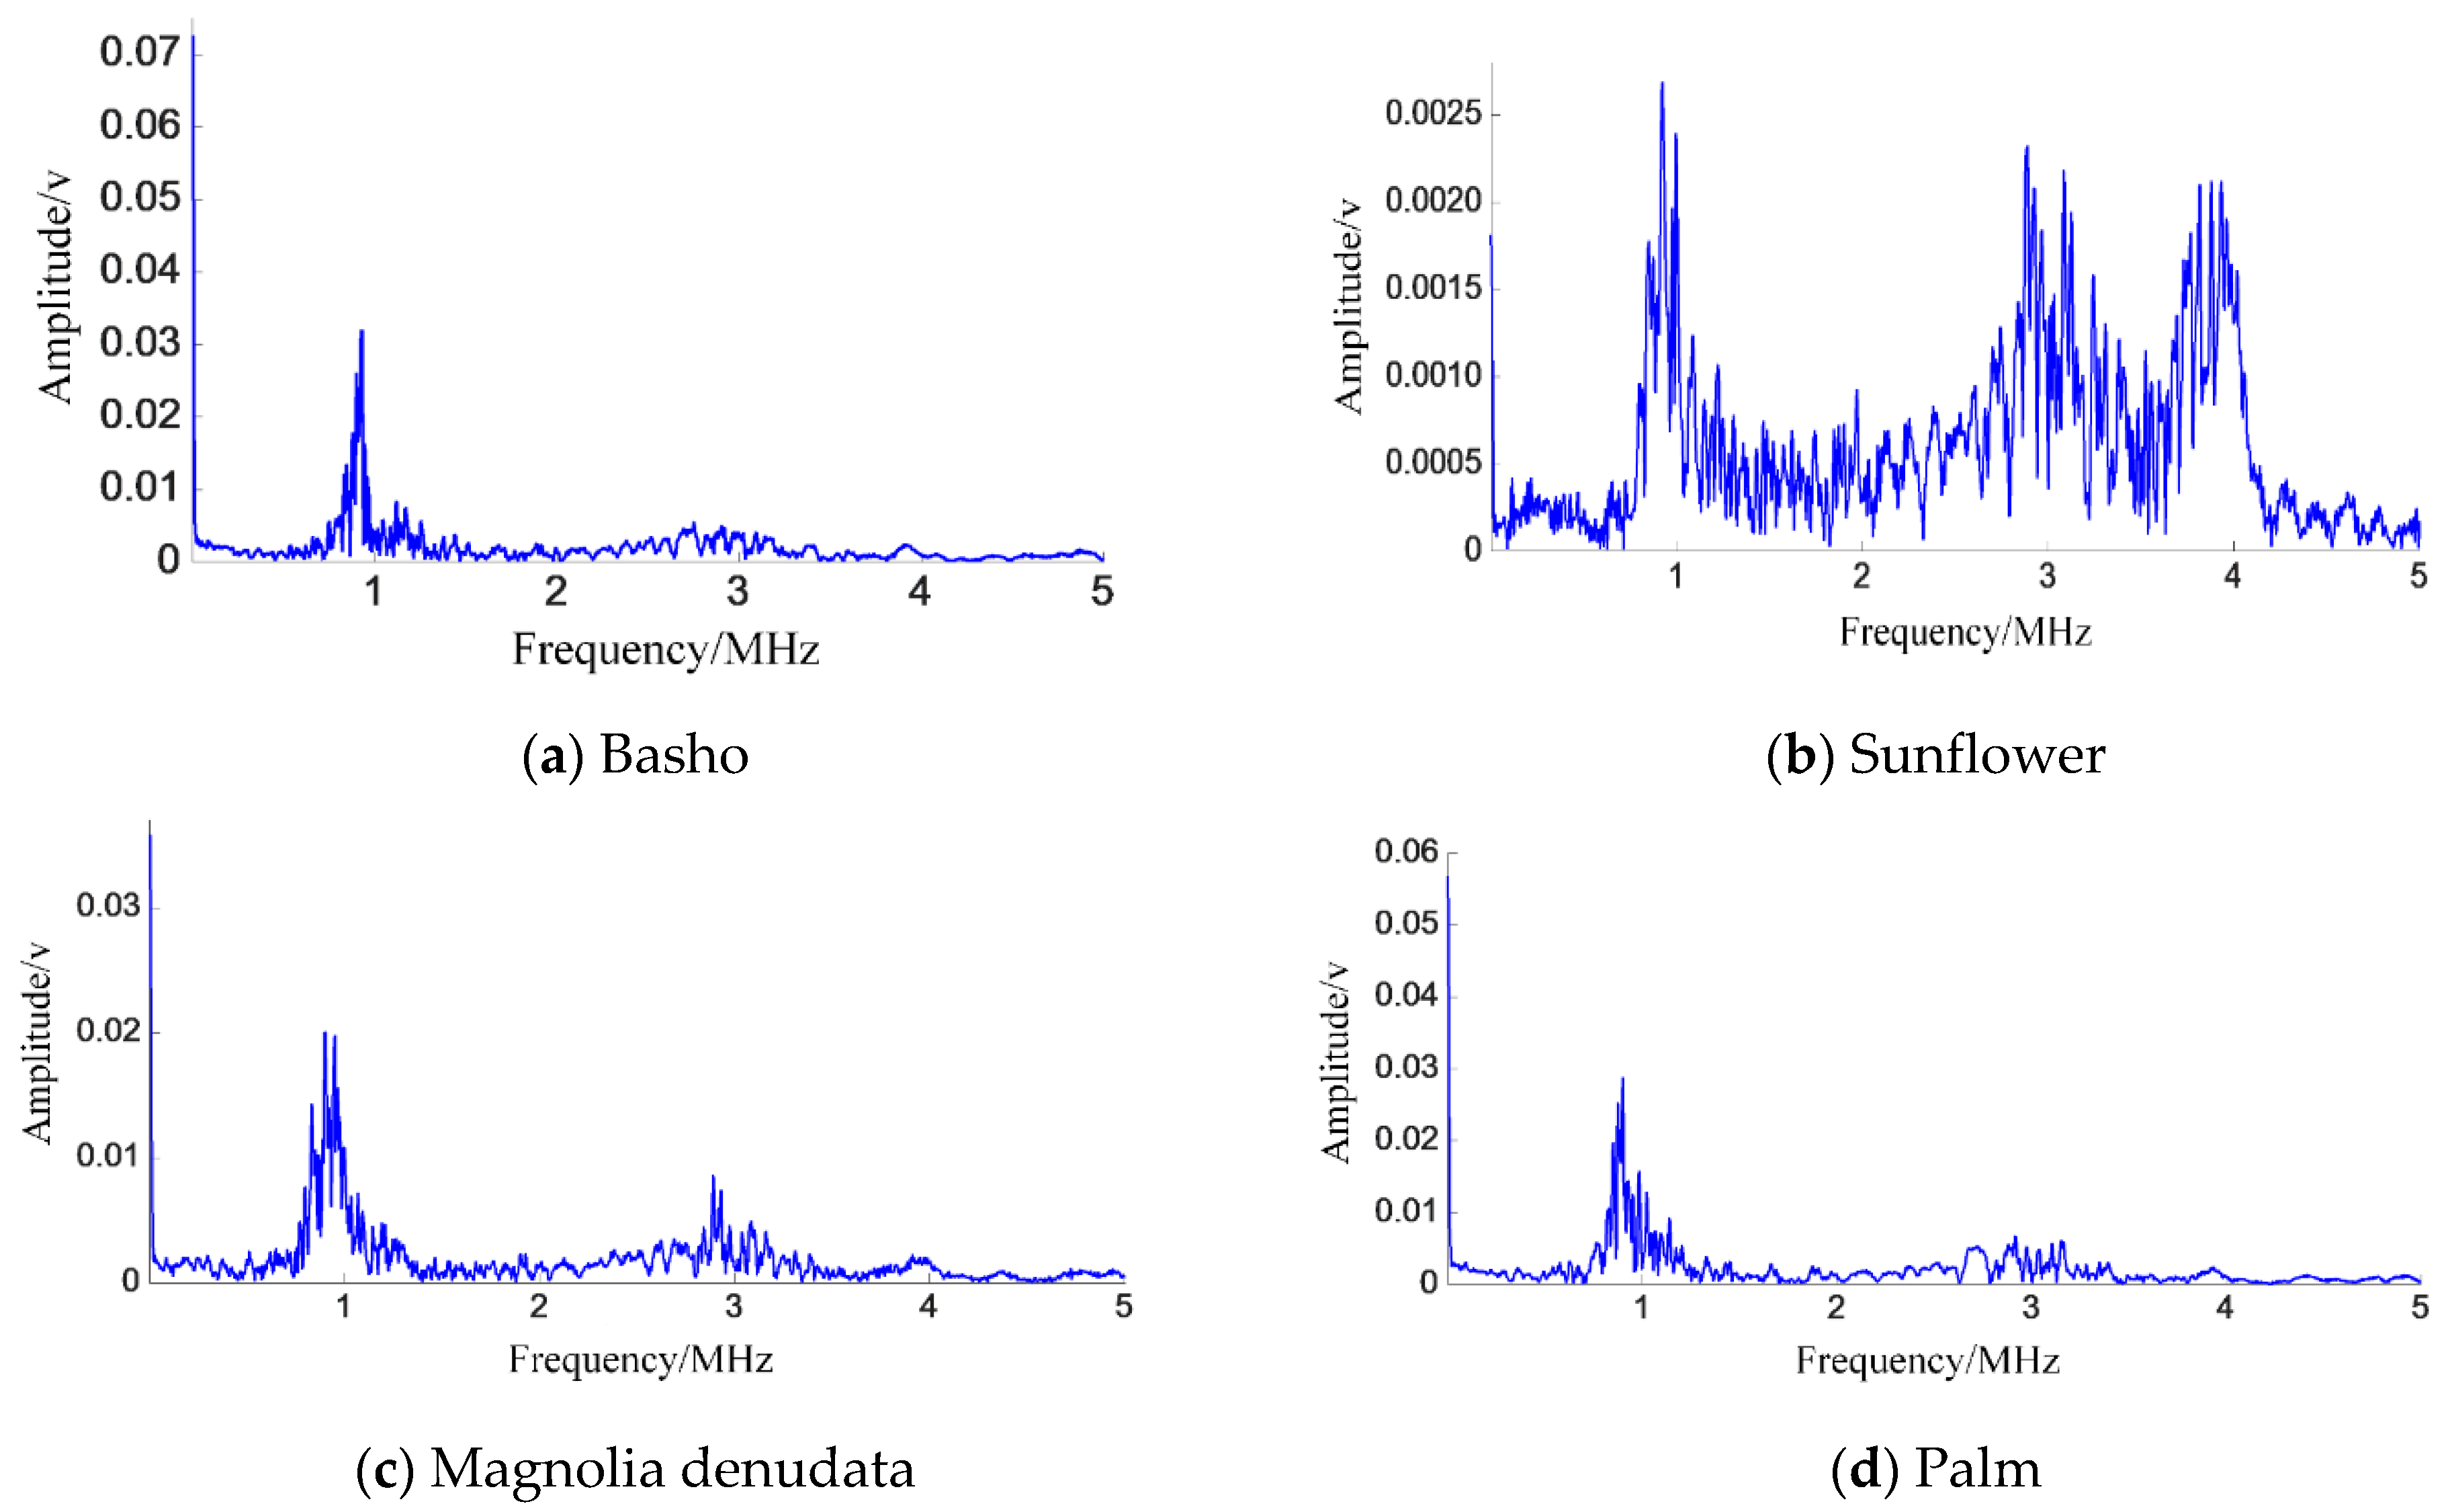
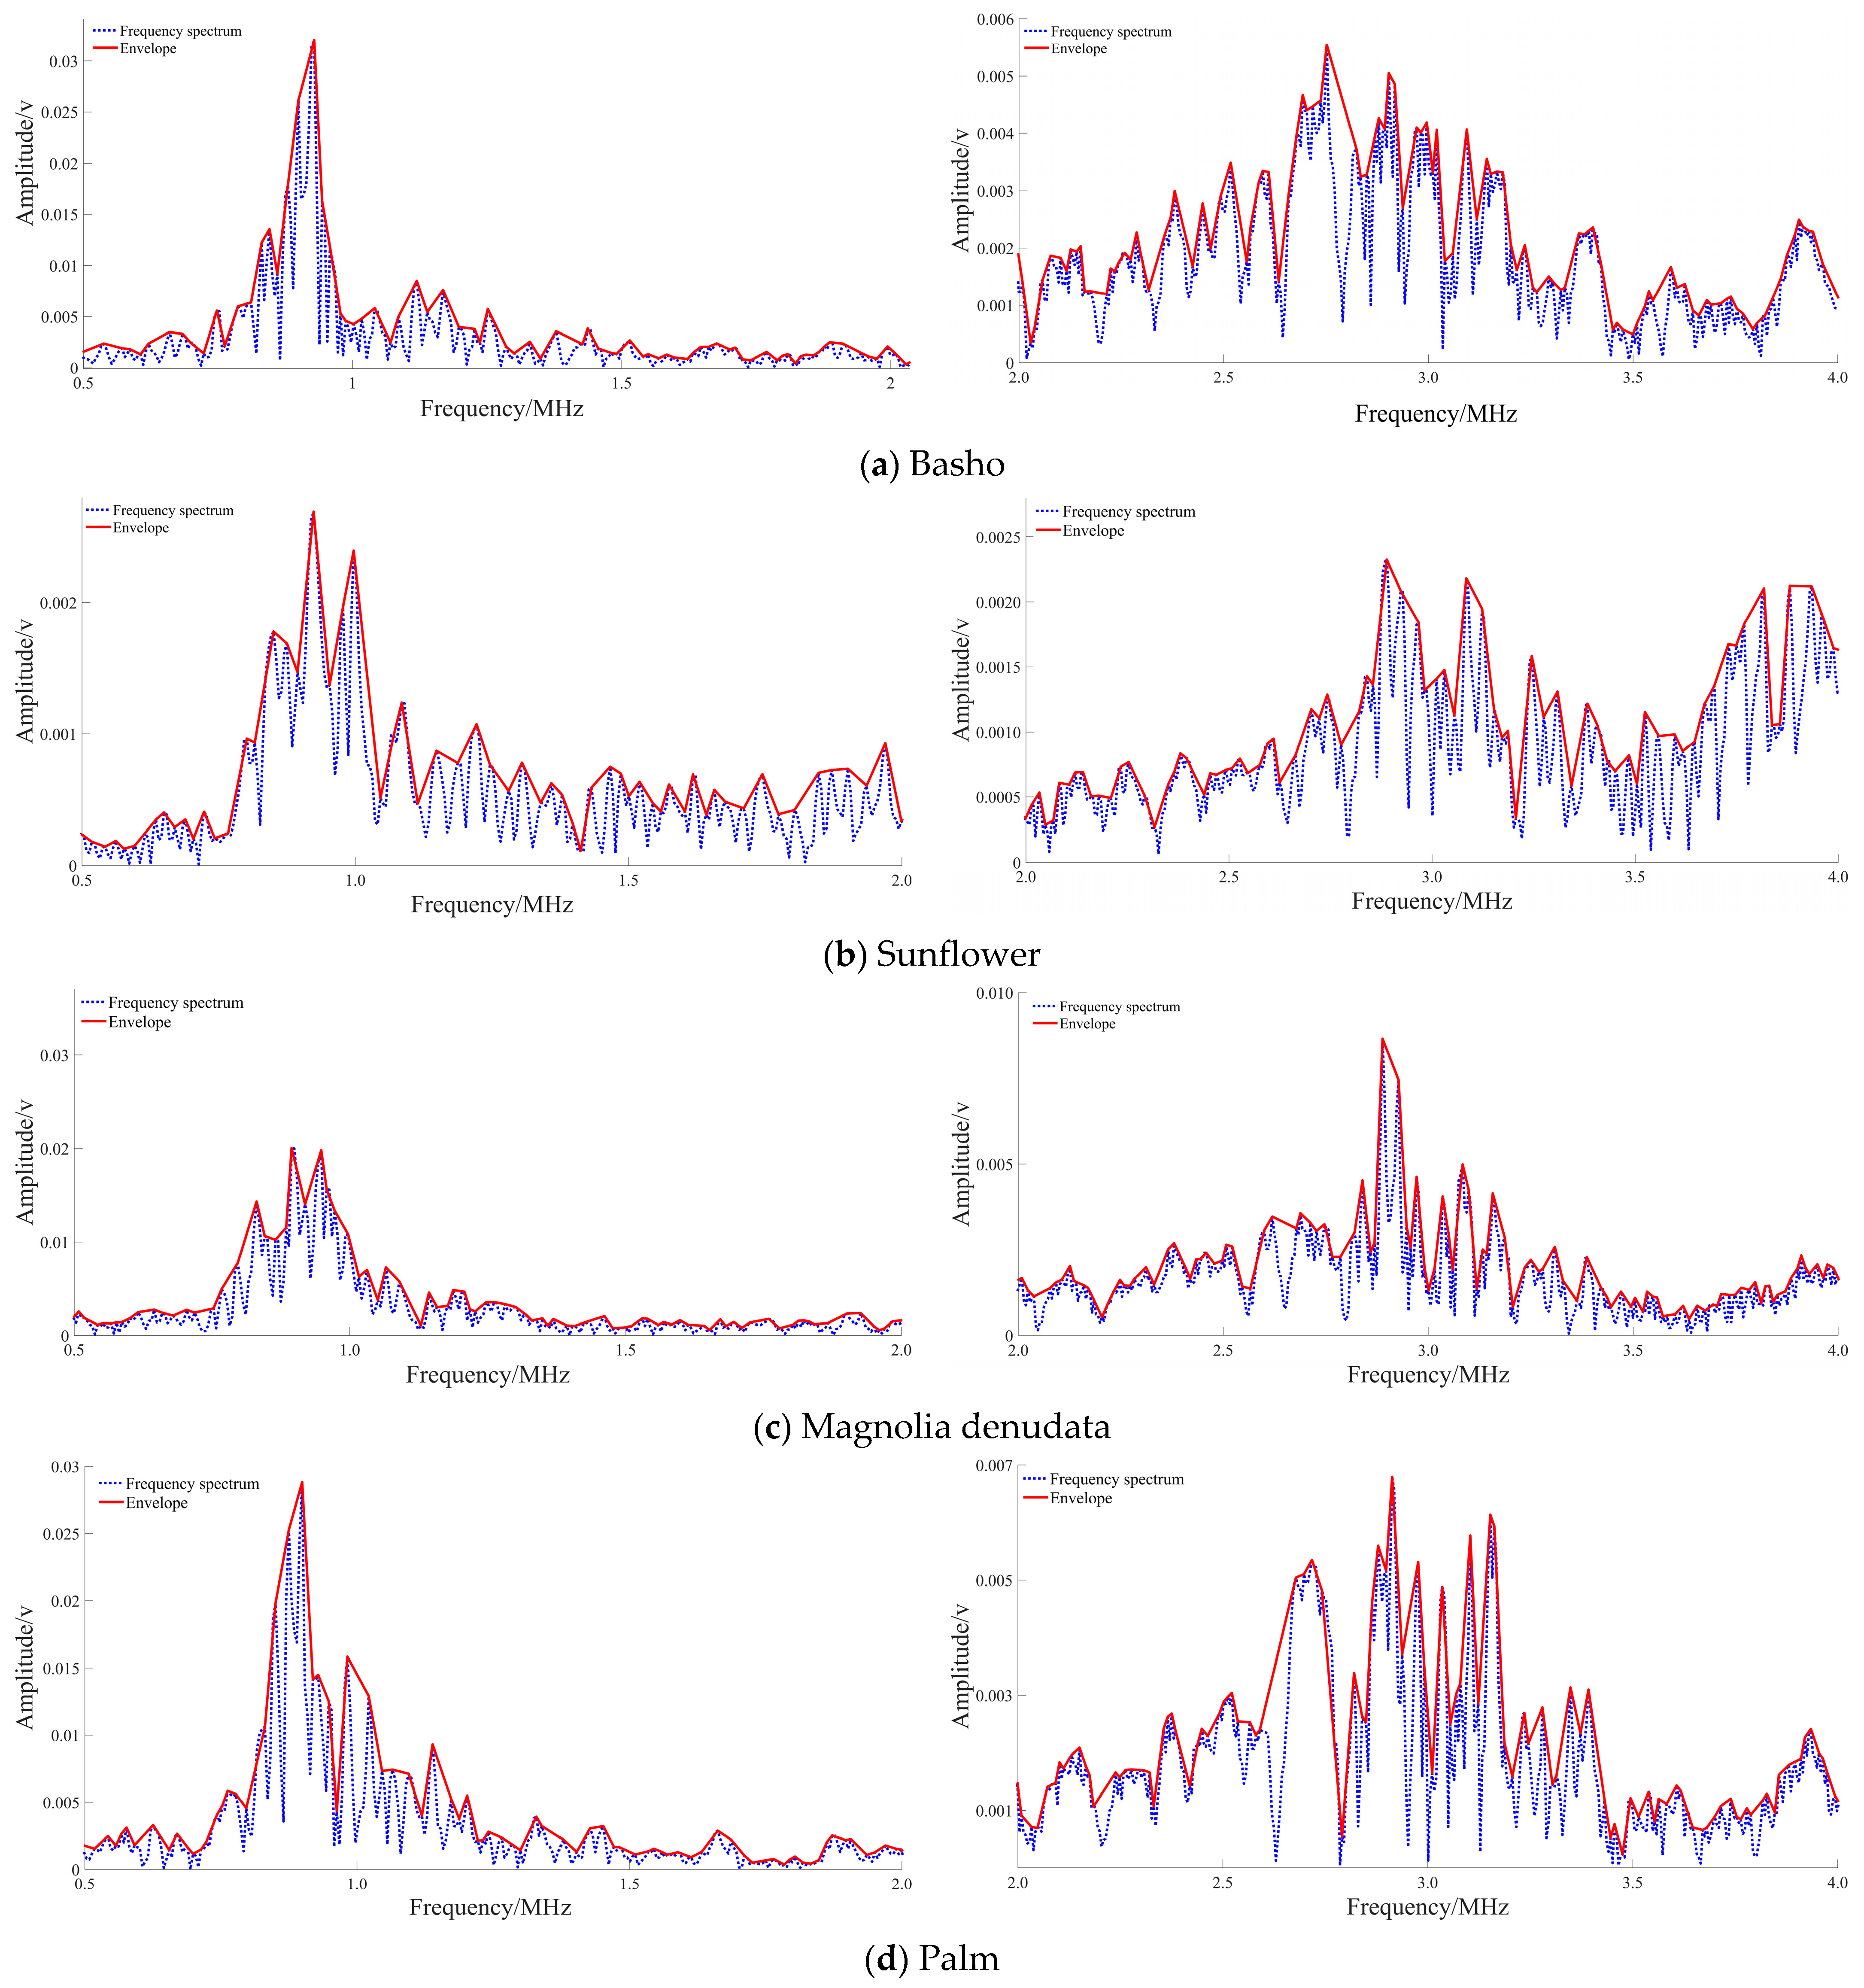
Frequency Domain Ultrasound Echo Amplitude and Frequency Signals
3.2.2. Ultrasonic Energy Features and Feature Contribution of Plant Stems
- (1)
- Energy features in the time domain
- (2)
- Energy features in the time domain
- (3)
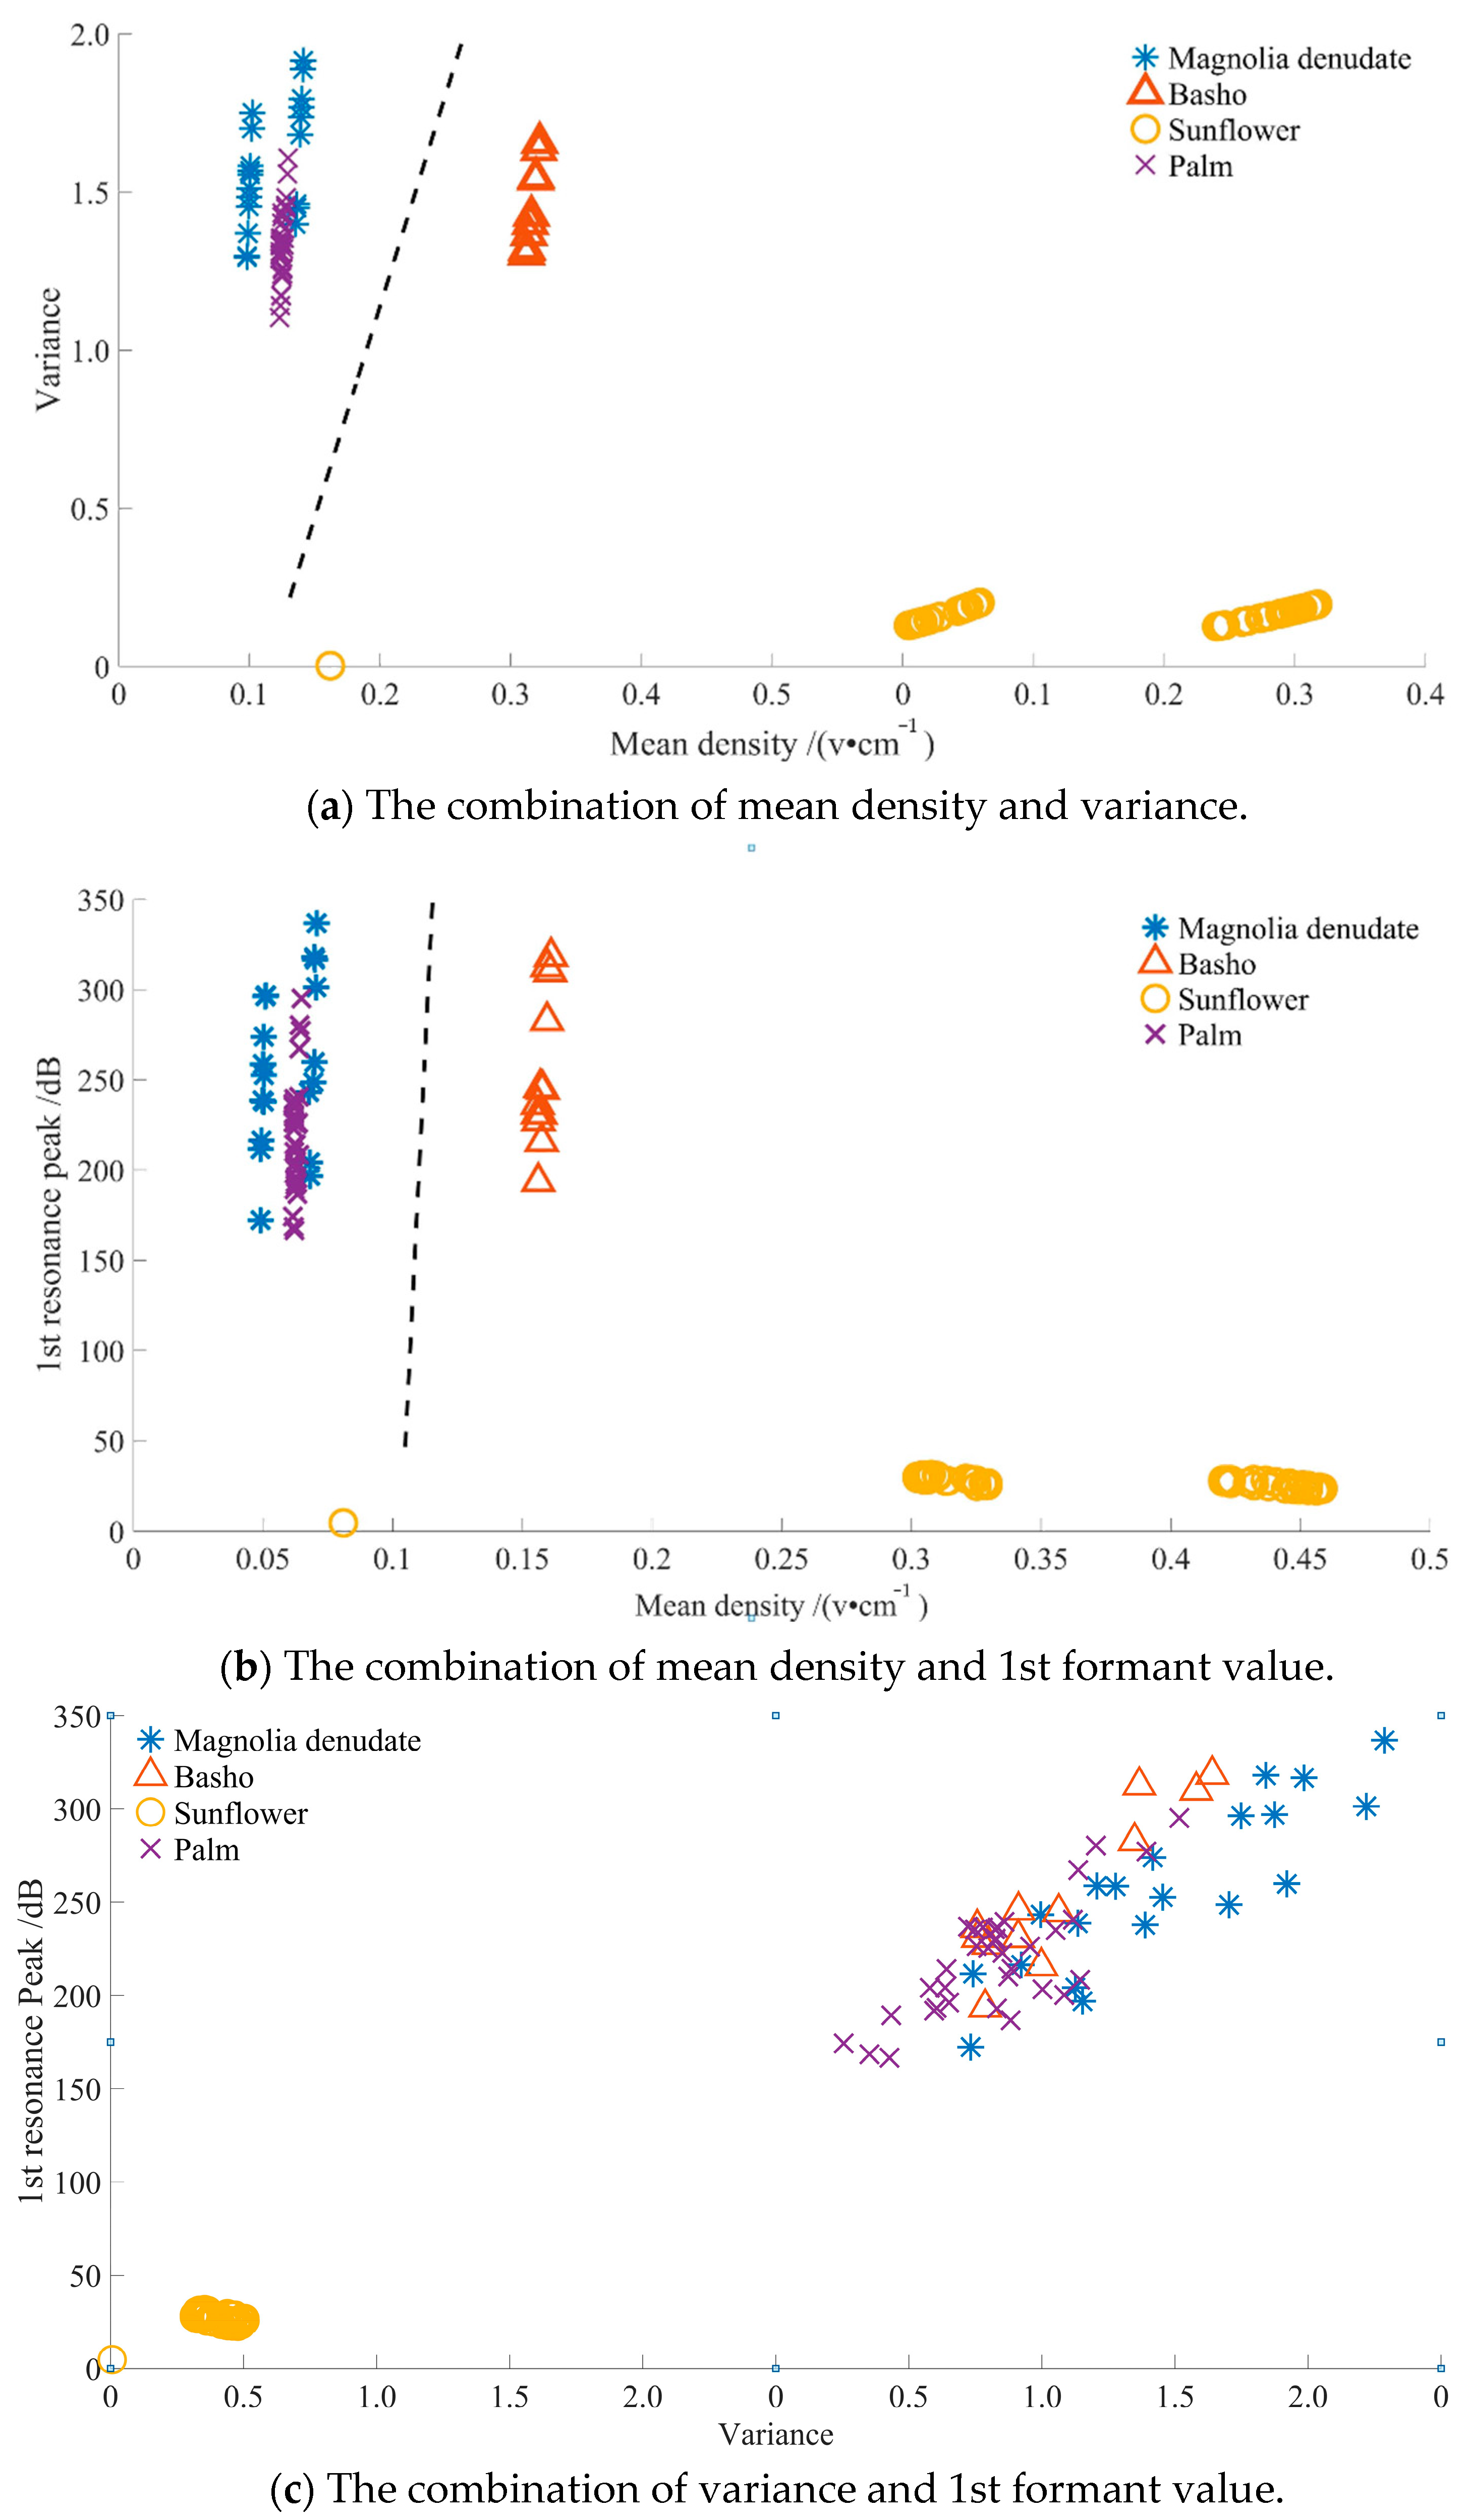
- Feature combination
- (4)
- Results of feature contributions
4. Discussion and Conclusions
Author Contributions
Funding
Institutional Review Board Statement
Informed Consent Statement
Data Availability Statement
Conflicts of Interest
References
- Li, R.; Jiang, Z.; Zhang, S.; Cai, J. A review of new research progress on the vulnerability of xylem embolism of woody plants. Chin. J. Plant Ecol. 2015, 39, 838–848. [Google Scholar]
- Sun, L.; Tang, B.; Gao, R. Response and Adaptability of Anatomical Structure of Plant Stem to the Arid Environment. For. Explor. Des. 2016, 2, 43–46. [Google Scholar]
- Zhao, Y.; Gao, C.; Zhang, X.; Xu, Q. Non-destructive measurement of plant stem water content based on standing wave ratio. Trans. Chin. Soc. Agric. Mach. 2016, 47, 310–316. [Google Scholar]
- Ji, H. The Sap Flow Measurement Based on the Heat Ratio Method (HRM) and Environment Factor Correction Research. Master’s Thesis, Northeast Forestry University, Harbin, China, 2012. [Google Scholar]
- Hultine, K.R.; Nagler, P.L.; Morino, K.; Bush, S.E.; Burtch, K.G.; Dennison, P.E.; Glenn, E.P.; Ehleringer, J.R. Sap Flux-Scaled Transpiration by Tamarisk (Tamarix Spp.) before, during and after Episodic Defoliation by the Saltcedar Leaf Beetle (Diorhabda Carinulata). Agric. For. Meteorol. 2010, 150, 1467–1475. [Google Scholar] [CrossRef]
- Choat, B.; Jansen, S.; Brodribb, T.J.; Cochard, H.; Delzon, S.; Bhaskar, R.; Bucci, S.J.; Feild, T.S.; Gleason, S.M.; Hacke, U.G.; et al. Global Convergence in the Vulnerability of Forests to Drought. Nature 2012, 491, 752–755. [Google Scholar] [CrossRef] [PubMed] [Green Version]
- Edwards, W.R.N.; Jarvis, P.G. A Method for Measuring Radial Differences in Water Content of Intact Tree Stems by Attenuation of Gamma Radiation. Plant Cell Environ. 1983, 6, 255–260. [Google Scholar] [CrossRef]
- Byrne, G.F.; Fenn, M.D.; Burgar, M.I. Nuclear Magnetic Resonance Studies of Water in Tree Sections. Agric. For. Meteorol. 1986, 38, 307–317. [Google Scholar] [CrossRef]
- Borisjuk, L.; Rolletschek, H.; Neuberger, T. Surveying the Plant’s World by Magnetic Resonance Imaging. Plant J. 2012, 70, 129–146. [Google Scholar] [CrossRef] [PubMed]
- Windt, C.W.; Blümler, P. A Portable NMR Sensor to Measure Dynamic Changes in the Amount of Water in Living Stems or Fruit and Its Potential to Measure Sap Flow. Tree Physiol. 2015, 35, 366–375. [Google Scholar] [CrossRef] [Green Version]
- Raschi, A.; Tognetti, R.; Ridder, H.-W.; Béres, C. Water in the Stems of Sessile Oak (Quercus Petraea) Assessed by Computer Tomography with Concurrent Measurements of Sap Velocity and Ultrasound Emission. Plant Cell Environ. 1995, 18, 545–554. [Google Scholar] [CrossRef]
- Song, Z.; Lin, Y.; Gu, G. The influence of wood cell activity on moisture content measurement by electric resistance. J. Northeast For. Univ. 1994, 22, 113–116. [Google Scholar]
- Sparks, J.P.; Campbell, G.S.; Black, A.R. Water Content, Hydraulic Conductivity, and Ice Formation in Winter Stems of Pinus Contorta: A TDR Case Study. Oecologia 2001, 127, 468–475. [Google Scholar] [CrossRef]
- Hao, G.-Y.; Wheeler, J.K.; Holbrook, N.M.; Goldstein, G. Investigating Xylem Embolism Formation, Refilling and Water Storage in Tree Trunks Using Frequency Domain Reflectometry. J. Exp. Bot. 2013, 64, 2321–2332. [Google Scholar] [CrossRef] [PubMed] [Green Version]
- Zhou, H.; Sun, Y.; Tyree, M.T.; Sheng, W.; Cheng, Q.; Xue, X.; Schumann, H.; Schulze Lammers, P. An Improved Sensor for Precision Detection of in Situ Stem Water Content Using a Frequency Domain Fringing Capacitor. New Phytol. 2015, 206, 471–481. [Google Scholar] [CrossRef] [PubMed]
- Arciniegas, A.; Brancheriau, L.; Lasaygues, P. Tomography in Standing Trees: Revisiting the Determination of Acoustic Wave Velocity. Ann. For. Sci. 2015, 72, 685–691. [Google Scholar] [CrossRef]
- Ou, M.; Hu, T.; Hu, M.; Yang, S.; Jia, W.; Wang, M.; Jiang, L.; Wang, X.; Dong, X. Experiment of Canopy Leaf Area Density Estimation Method Based on Ultrasonic Echo Signal. Agriculture 2022, 12, 1569. [Google Scholar] [CrossRef]
- Gómez, M.; Aguado, F.; Menéndez, J.M.; Revilla, M.; Villa, L.F.; Cortés, J.; Rico, H. Influence of Soft Tissue (Fat and Fat-Free Mass) on Ultrasound Bone Velocity: An In Vivo Study. Investig. Radiol. 1997, 32, 609–612. [Google Scholar] [CrossRef] [PubMed]
- Abdul Halim, M.H.; Buniyamin, N.; Mohamad, Z. Improving Intramuscular Fat Measurement by Considering the Thickness of Protective Layer in Ultrasonic Transducer. In Proceedings of the 2014 2nd International Conference on Electrical, Electronics and System Engineering (ICEESE), Kuala Lumpur, Malaysia, 9–10 December 2014; pp. 101–107. [Google Scholar]
- Nagaoka, R.; Iwasaki, R.; Arakawa, M.; Kobayashi, K.; Yoshizawa, S.; Umemura, S.; Saijo, Y. Basic Study of Intrinsic Elastography: Relationship between Tissue Stiffness and Propagation Velocity of Deformation Induced by Pulsatile Flow. Jpn. J. Appl. Phys. 2015, 54, 07HF08. [Google Scholar] [CrossRef]
- Bolla, D.; In-Albon, S.; Papadia, A.; Di Naro, E.; Gasparri, M.L.; Mueller, M.M.; Raio, L. Doppler Ultrasound Flow Evaluation of the Uterine Arteries Significantly Correlates with Tumor Size in Cervical Cancer Patients. Ann. Surg. Oncol. 2015, 22, 959–963. [Google Scholar] [CrossRef]
- Aaslid, R.; Markwalder, T.M.; Nornes, H. Noninvasive Transcranial Doppler Ultrasound Recording of Flow Velocity in Basal Cerebral Arteries. J. Neurosurg. 1982, 57, 769–774. [Google Scholar] [CrossRef] [Green Version]
- Jambrik, Z.; Gargani, L.; Adamicza, A.; Kaszaki, J.; Varga, A.; Forster, T.; Boros, M.; Picano, E. B-Lines Quantify the Lung Water Content: A Lung Ultrasound versus Lung Gravimetry Study in Acute Lung Injury. Ultrasound Med. Biol. 2010, 36, 2004–2010. [Google Scholar] [CrossRef] [PubMed]
- Sandoz, J.L. Moisture Content and Temperature Effect on Ultrasound Timber Grading. Wood Sci. Technol. 1993, 27, 373–380. [Google Scholar] [CrossRef]
- de Oliveira, F.G.R.; Candian, M.; Lucchette, F.F.; Luis Salgon, J.; Sales, A. A Technical Note on the Relationship between Ultrasonic Velocity and Moisture Content of Brazilian Hardwood (Goupia Glabra). Build. Environ. 2005, 40, 297–300. [Google Scholar] [CrossRef]
- Yang, H.; Yu, L.; Wang, L. Effect of Moisture Content on the Ultrasonic Acoustic Properties of Wood. J. For. Res. 2015, 26, 753–757. [Google Scholar] [CrossRef]
- Dikrallah, A.; Kabouchi, B.; Hakam, A.; Brancheriau, L.; Bailleres, H.; Famiri, A.; Ziani, M. Study of Acoustic Wave Propagation through the Cross Section of Green Wood. Comptes Rendus Mécanique 2010, 338, 107–112. [Google Scholar] [CrossRef]
- Tomppo, L. Novel Applications of Electrical Impedance and Ultrasound Methods for Wood Quality Assessment. Ph.D. Thesis, Itä-Suomen Yliopisto, Itä-Suomi, Suomi, 2013. [Google Scholar]
- Hasegawa, M.; Takata, M.; Matsumura, J.; Oda, K. Effect of Wood Properties on within-Tree Variation in Ultrasonic Wave Velocity in Softwood. Ultrasonics 2011, 51, 296–302. [Google Scholar] [CrossRef]
- Guillaume, C.; Katline, C.-V.; Benoit, L.; Thierry, A.; Stefan, M. Changes in Ultrasound Velocity and Attenuation Indicate Freezing of Xylem Sap. Agric. For. Meteorol. 2014, 185, 20–25. [Google Scholar] [CrossRef]
- Lv, D.; Shi, X.; Dong, Y.; Wang, Y.; Wang, X.; Wang, C. Non-destructive measurement of plant stem water content based on Ultrasonic Radio frequency. Trans. Chin. Soc. Agric. Mach. 2017, 48, 195–201. [Google Scholar]
- Arciniegas, A.; Prieto, F.; Brancheriau, L.; Lasaygues, P. Literature Review of Acoustic and Ultrasonic Tomography in Standing Trees. Trees 2014, 28, 1559–1567. [Google Scholar] [CrossRef]
- Mao, Y.; Cao, H.; Ping, P.; Li, X. Feature selection based on maximum conditional and joint mutual information. J. Comput. Appl. 2019, 39, 734–741. [Google Scholar]
- Zhan, L. Research on Evaluation and Selection of Feature in Pattern Recognition. Master’s Thesis, Tianjin University of Science and Technology, Tianjin, China, 2012. [Google Scholar]

| No. | Feature Name | Equation |
|---|---|---|
| 1 | Energy | |
| 2 | Energy density | |
| 3 | Mean value | |
| 4 | Mean density | |
| 5 | Variance | |
| 6 | peak-to-peak value | |
| 7 | Spectrum DC | |
| 8 | Spectral DC density | |
| 9 | 1st formant value | |
| 10 | 1st formant density | |
| 11 | 1st formant frequency | |
| 12 | 2nd formant value | |
| 13 | 2nd formant density | |
| 14 | 2nd formant frequency | |
| 15 | 3rd formant value | |
| 16 | 3rd formant frequency | |
| 17 | removed DC energy | |
| 18 | removed DC variance | |
| 19 | removed DC 1st formant value | |
| 20 | removed DC 1st formant frequency | |
| 21 | removed DC 2nd formant value | |
| 22 | De-rectified 2nd formant frequency | |
| 23 | removed DC 3rd formant value | |
| 24 | removed DC 3rd formant frequency |
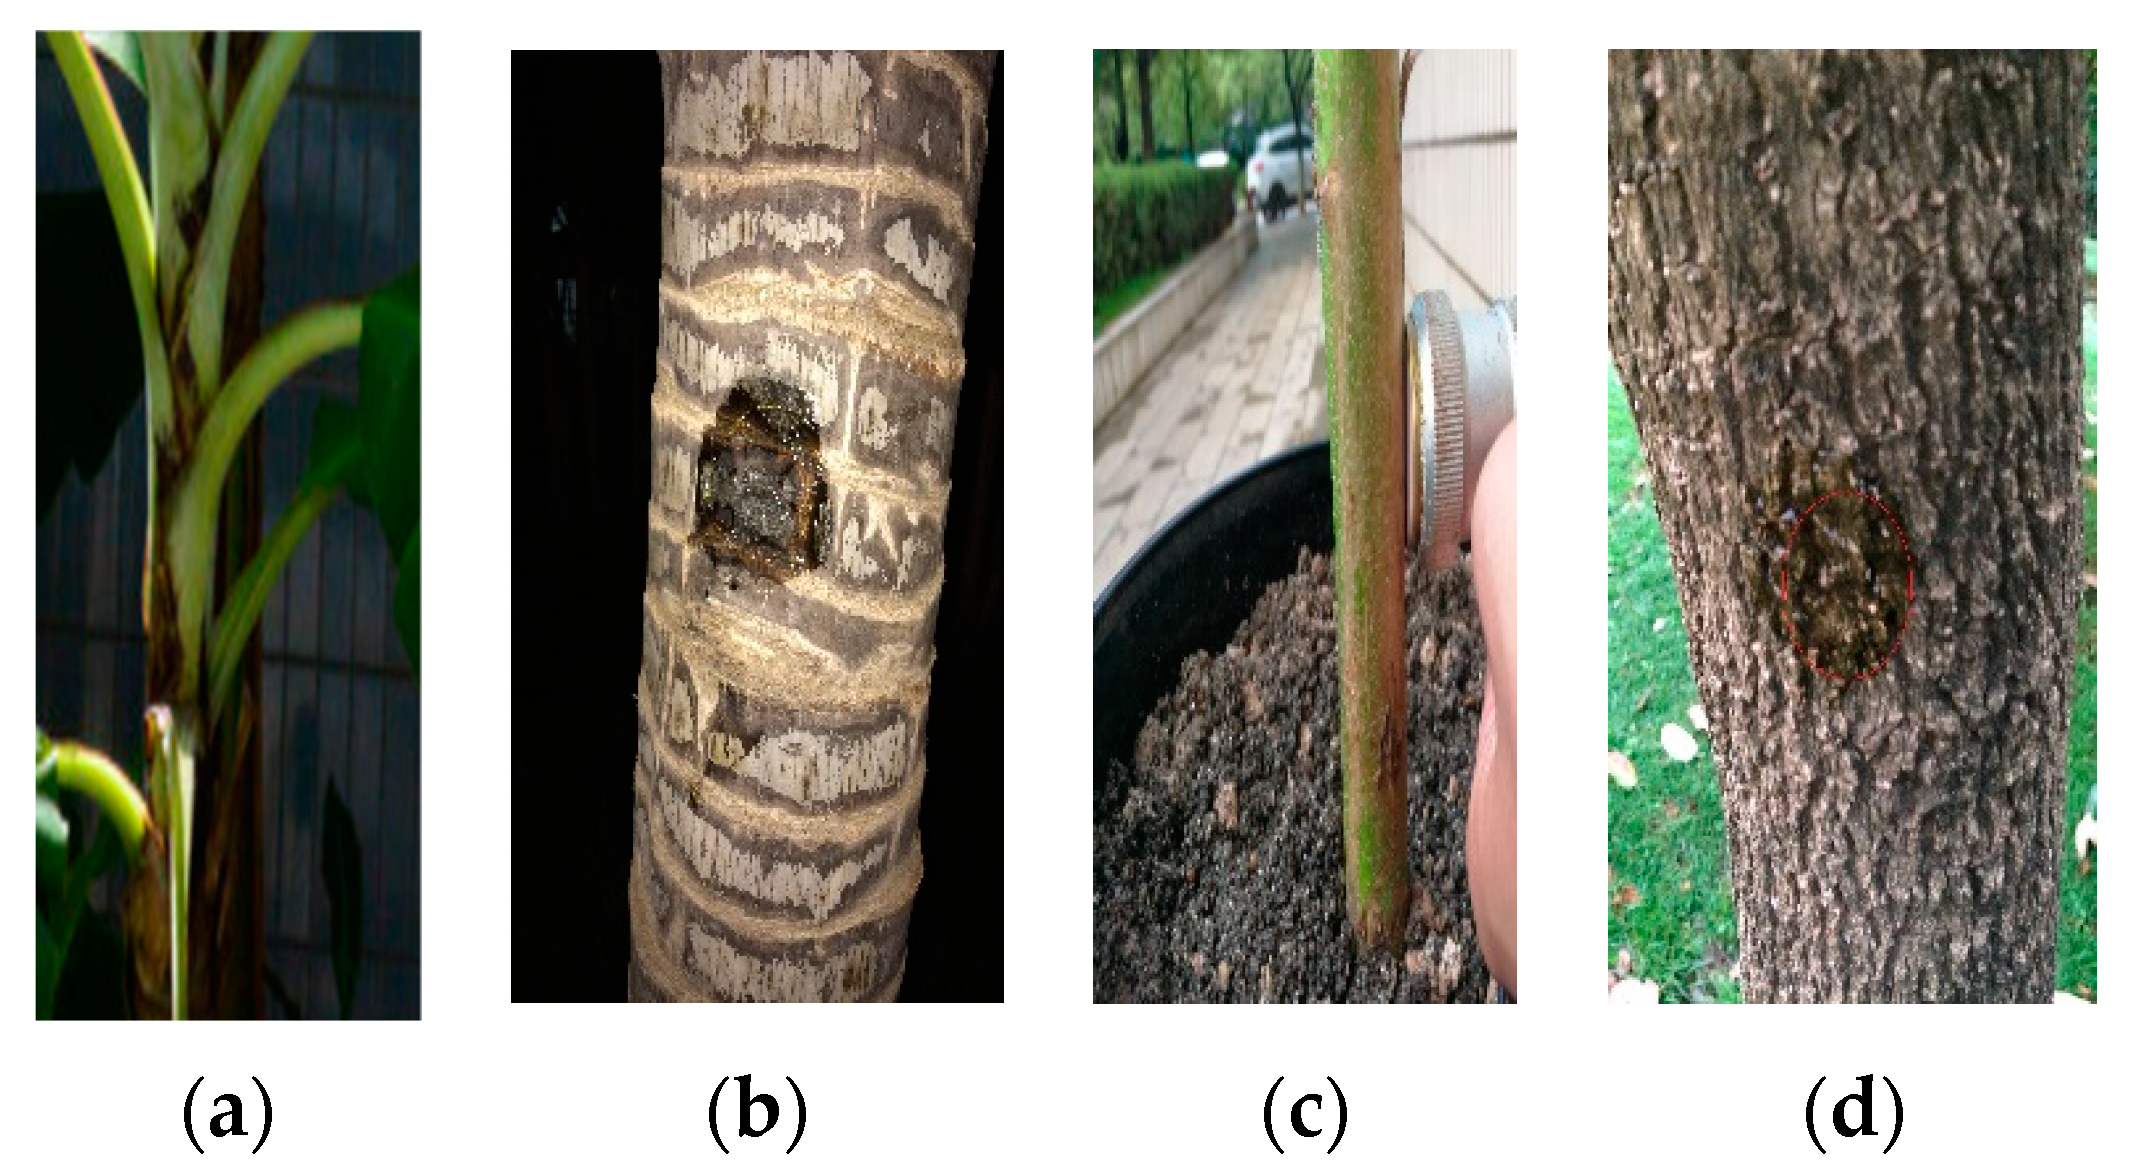
| Varieties of Trees | Stem Texture | Growth Characteristics | Plant Category | Vascular Properties |
|---|---|---|---|---|
| Basho | Herbaceous stems | Perennial | Monocotyledon | Vascular bundles dispersed within the stem, no formative layer within bundles |
| Sunflower | Herbaceous stems | Annual | Dicotyledon | Vascular bundles forming a circular shape, without a forming layer within the bundle. |
| Magnolia denudata | Woody stem | Deciduous plant | Dicotyledon | Vascular bundles forming a circular shape, with a formative layer within the bundle. |
| palm | Woody stem | Casuarina | Monocotyledon | Vascular bundles scattered within stem, with forming layer within bundle. |
| Samples | Basho 1 | Sunflower 1 | Sunflower 2 | Palm 1 | Palm 2 | Magnolia Denudata 1 | Magnolia Denudata 2 |
|---|---|---|---|---|---|---|---|
| Height of the test point from the ground (cm) | 48.00 | 20.00 | 20.00 | 57.00 | 79.00 | 75.00 | 80.00 |
| Test circumference (cm) | 20.00 | 5.00 | 7.00 | 49.00 | 50.00 | 46.30 | 63.20 |
| Samples of ultrasound pulse echoes (pcs) | 57 | 33 | 42 | 61 | 53 | 60 | 48 |
| Name of Tree | Envelope around 1 M. | Envelope around 3 M. | P1: Peak Value around 1 M (mv). | P3: Peak Value around 3 M (mv). | Times of P1/P3 |
|---|---|---|---|---|---|
| Basho | Single peak | Multi-peak | 32.00 | 4.20 | 8.00 |
| Sunflower | Multi-peak | Twin peaks | 2.60 | 2.30 | 1.00 |
| Magnolia denudata | Multi-peak | Single peak | 20.10 | 8.70 | 2.00 |
| Palm | Single peak | Multi-peak | 28.80 | 6.80 | 4.00 |
| Name of Sample | Circumference (cm) | Energy (v) | Energy Density (v/cm·10−4) | Average Value (v) | Average Density (v/cm) | Variance | Peak-to-Peak Value (v) | Removed DC Energy (v) | Removed DC Variance |
|---|---|---|---|---|---|---|---|---|---|
| Basho 1 | 20.00 | 31.57 | 5.44 | 0.11 | 0.16 | 1.43 | 7.86 | 31.54 | 1.43 |
| Sunflower 1 | 5.00 | 21.64 | 1.75 | 0.01 | 0.43 | 0.16 | 5.41 | 21.63 | 0.16 |
| Sunflower 2 | 7.00 | 21.90 | 3.61 | 0.03 | 0.31 | 0.16 | 5.56 | 21.88 | 0.16 |
| Magnolia denudata 1 | 63.50 | 31.76 | 0.74 | 0.05 | 0.05 | 1.51 | 7.84 | 31.76 | 1.51 |
| Magnolia denudata 2 | 46.50 | 32.23 | 1.50 | 0.07 | 0.07 | 1.68 | 7.82 | 32.22 | 1.68 |
| Palm 1 | 49.50 | 31.22 | 1.97 | 0.10 | 0.06 | 1.32 | 7.83 | 31.19 | 1.32 |
| Palm 2 | 50.50 | 31.31 | 1.89 | 0.10 | 0.06 | 1.34 | 7.83 | 31.29 | 1.34 |
| Name of Sample | Basho 1 | Sunflower 1 | Sunflower 2 | Magnolia Denudata 1 | Magnolia Denudata 2 | Palm 1 | Palm 2 |
|---|---|---|---|---|---|---|---|
| Average (dB) | 125.65 | 8.78 | 27.08 | 28.73 | 29.95 | 70.37 | 109.92 |
| Average density (dB/cm) | 0.63 | 0.18 | 0.39 | 0.04 | 0.05 | 0.15 | 0.22 |
| 1st formant value (dB) | 254.02 | 24.86 | 28.94 | 243.92 | 246.71 | 269.51 | 215.13 |
| 1st formant value density (dB/cm) | 1.27 | 0.50 | 0.41 | 0.36 | 0.39 | 0.58 | 0.43 |
| sampling position of 1st formant | 184.00 | 186.00 | 191.00 | 184.00 | 185.00 | 183.00 | 183.00 |
| 1st formant frequency (MHz) | 0.92 | 0.93 | 0.95 | 0.92 | 0.92 | 0.92 | 0.91 |
| 2nd formant value (dB) | 83.52 | 25.82 | 34.43 | 83.52 | 84.99 | 97.19 | 75.24 |
| 2nd formant density (dB/cm) | 0.42 | 0.52 | 0.49 | 0.11 | 0.13 | 0.21 | 0.15 |
| sampling position of 2nd formant | 579.00 | 583.00 | 585.00 | 585.00 | 584.00 | 595.00 | 574.00 |
| 2nd formant frequency (MHz) | 2.90 | 2.91 | 2.92 | 2.92 | 2.92 | 2.97 | 2.87 |
| 3rd formant value (dB) | 33.97 | 49.72 | 43.38 | 38.53 | 36.71 | 32.88 | 35.18 |
| 3rd formant density (dB/cm) | 0.17 | 0.99 | 0.62 | 0.08 | 0.06 | 0.07 | 0.07 |
| sampling position of 3rd formant | 826.00 | 782.00 | 777.00 | 845.00 | 845.00 | 801.00 | 822.00 |
| 3rd formant frequency (MHz) | 4.13 | 3.91 | 3.88 | 4.23 | 4.23 | 4.00 | 4.11 |
| Circumference | 20.00 | 5.00 | 7.00 | 63.50 | 46.50 | 49.50 | 50.50 |
| Feature No. | Feature Name | Feature No. | Feature Name |
|---|---|---|---|
| 1 | Energy | 13 | 2nd formant density |
| 2 | Energy density | 14 | 2nd formant frequency |
| 3 | Mean value | 15 | 3rd formant value |
| 4 | Mean density | 16 | 3rd formant frequency |
| 5 | Variance | 17 | removed DC energy |
| 6 | peak-to-peak value | 18 | removed DC variance |
| 7 | Spectrum DC | 19 | removed DC 1st formant value |
| 8 | Spectral DC density | 20 | removed DC 1st formant frequency |
| 9 | 1st formant value | 21 | removed DC 2nd formant value |
| 10 | 1st formant density | 22 | De-rectified 2nd formant frequency |
| 11 | 1st formant frequency | 23 | removed DC 3rd formant value |
| 12 | 2nd formant value | 24 | removed DC 3rd formant frequency |
| Detecting Tree Species | Basho | Sunflower | Palm | Magnolia Denudata | Total Number of Samples (pcs) |
|---|---|---|---|---|---|
| Ultrasound samples (pcs) | 52 | 62 | 35 | 40 | 189 |
| Feature Sorting | Feature No. | Information Gain | Feature No. | Correlation Values | Feature No. | Mean Value of Contributions |
|---|---|---|---|---|---|---|
| 1 | 4 | 1.71 | 18 | 0.71 | 4 | 1.20 |
| 2 | 3 | 1.55 | 5 | 0.71 | 3 | 1.11 |
| 3 | 7 | 1.29 | 9 | 0.70 | 7 | 0.96 |
| 4 | 5 | 1.14 | 19 | 0.70 | 5 | 0.92 |
| 5 | 18 | 1.14 | 4 | 0.69 | 18 | 0.92 |
| 6 | 17 | 1.12 | 1 | 0.69 | 17 | 0.90 |
| 7 | 1 | 1.10 | 17 | 0.69 | 1 | 0.89 |
| 8 | 2 | 1.10 | 6 | 0.69 | 9 | 0.85 |
| 9 | 8 | 1.07 | 12 | 0.68 | 19 | 0.85 |
| 10 | 13 | 1.00 | 21 | 0.68 | 6 | 0.84 |
| 11 | 9 | 1.00 | 13 | 0.67 | 12 | 0.84 |
| 12 | 12 | 1.00 | 3 | 0.67 | 21 | 0.84 |
| 13 | 19 | 1.00 | 7 | 0.64 | 13 | 0.83 |
| 14 | 21 | 1.00 | 20 | 0.41 | 2 | 0.66 |
| 15 | 6 | 1.00 | 11 | 0.41 | 8 | 0.63 |
| 16 | 20 | 0.83 | 23 | 0.34 | 11 | 0.62 |
| 17 | 11 | 0.83 | 15 | 0.34 | 20 | 0.62 |
| 18 | 10 | 0.45 | 10 | 0.29 | 10 | 0.37 |
| 19 | 22 | 0.35 | 2 | 0.23 | 15 | 0.33 |
| 20 | 14 | 0.35 | 24 | 0.23 | 23 | 0.33 |
| 21 | 23 | 0.32 | 16 | 0.23 | 14 | 0.25 |
| 22 | 15 | 0.32 | 8 | 0.20 | 22 | 0.25 |
| 23 | 16 | 0.13 | 14 | 0.16 | 16 | 0.18 |
| 24 | 24 | 0.13 | 22 | 0.16 | 24 | 0.18 |
Disclaimer/Publisher’s Note: The statements, opinions and data contained in all publications are solely those of the individual author(s) and contributor(s) and not of MDPI and/or the editor(s). MDPI and/or the editor(s) disclaim responsibility for any injury to people or property resulting from any ideas, methods, instructions or products referred to in the content. |
© 2022 by the authors. Licensee MDPI, Basel, Switzerland. This article is an open access article distributed under the terms and conditions of the Creative Commons Attribution (CC BY) license (https://creativecommons.org/licenses/by/4.0/).
Share and Cite
Lv, D.; Zi, J.; Huang, X.; Gao, M.; Xi, R.; Li, W.; Wang, Z. Feature Extraction on the Difference of Plant Stem Structure Based on Ultrasound Energy. Agriculture 2023, 13, 52. https://doi.org/10.3390/agriculture13010052
Lv D, Zi J, Huang X, Gao M, Xi R, Li W, Wang Z. Feature Extraction on the Difference of Plant Stem Structure Based on Ultrasound Energy. Agriculture. 2023; 13(1):52. https://doi.org/10.3390/agriculture13010052
Chicago/Turabian StyleLv, Danju, Jiali Zi, Xin Huang, Mingyuan Gao, Rui Xi, Wei Li, and Ziqian Wang. 2023. "Feature Extraction on the Difference of Plant Stem Structure Based on Ultrasound Energy" Agriculture 13, no. 1: 52. https://doi.org/10.3390/agriculture13010052
APA StyleLv, D., Zi, J., Huang, X., Gao, M., Xi, R., Li, W., & Wang, Z. (2023). Feature Extraction on the Difference of Plant Stem Structure Based on Ultrasound Energy. Agriculture, 13(1), 52. https://doi.org/10.3390/agriculture13010052