Abstract
Plant phenotyping has been widely studied as an effective and powerful tool for analyzing crop status and growth. However, the traditional phenotyping (i.e., manual) is time-consuming and laborious, and the various types of growing structures and limited room for systems hinder phenotyping on a large and high-throughput scale. In this study, a low-cost high-throughput phenotyping system that can be flexibly applied to diverse structures of growing beds with reliable spatial–temporal continuities was developed. The phenotyping system was composed of a low-cost phenotype sensor network with an integrated Raspberry Pi board and camera module. With the distributed camera sensors, the system can provide crop imagery information over the entire growing bed in real time. Furthermore, the modularized image-processing architecture supports the investigation of several phenotypic indices. The feasibility of the system was evaluated for Batavia lettuce grown under different light periods in a container-type plant factory. For the growing lettuces under different light periods, crop characteristics such as fresh weight, leaf length, leaf width, and leaf number were manually measured and compared with the phenotypic indices from the system. From the results, the system showed varying phenotypic features of lettuce for the entire growing period. In addition, the varied growth curves according to the different positions and light conditions confirmed that the developed system has potential to achieve many plant phenotypic scenarios at low cost and with spatial versatility. As such, it serves as a valuable development tool for researchers and cultivators interested in phenotyping.
1. Introduction
Stressful situations cause morphological, physiological, and biochemical changes in crops. Thus, research on crop phenomics has been conducted to measure and utilize these changes in order to increase productivity, improve quality, and reduce energy and resource consumption through optimal control [1]. In the early stage, a specific stimulus was provided in a controlled environment, such as a smart farm, and response analysis and growth modeling were performed. In particular, to obtain characteristic information about crops, direct measurement, observation, or destructive methods are used. However, although these methods are generally simple and reliable, they require considerable time and labor because of the small number of activities that can be performed at one time [2,3]. In addition, when destructive methods are applied, the sample is damaged, and subsequent analysis is difficult.
To overcome these difficulties, various analyses using non-destructive methods have been conducted. Data available for analysis include images, environmental (temperature, humidity, light intensity, and nutrients) values, and physical (length and weight) values to quantify the genotype and phenotype [4]. Among them, image-based methods are used to analyze the external characteristics or growth of crops using two- (2D) or three-dimensional (3D) images or to indirectly explain internal phenomena through spectral images [5]. As several samples can be easily and automatically obtained using a camera, the time and cost required to acquire feature information can be reduced [6]. In addition, a large amount of information can be obtained using several images, broadening the scope of the analysis. This development coincides with the creation of integrated and mass crop production facilities; moreover, with the development of information communication technology (ICT) convergence technology, high-throughput analysis has been developed into a high-speed, mass-phenotypic method with high efficiency [7]. A high-throughput phenotyping platform refers to a system that integrates the storage of crop data, data analysis, robotics, and decision making. Growing demand, along with the development of numerous types of applicable data and technologies, has led to the requirement of several research studies for this platform and improvement of standardization, experimental methods, and analysis [8,9,10].
The process of stably collecting and analyzing images is important for analyzing the overall growth of crops through images. The process of acquiring the image should place no additional stress on the crop, and there should be no other influences such as noise or color distribution changes on the image. Several cameras can be utilized to acquire images. In addition, automatically moving and saving the images according to the conditions in a specific storage space can be advantageous because shooting is conducted over several days depending on the growth process. A system with continuity in which the characteristics of crops are automatically analyzed using various image processing and machine learning algorithms for each image and where model development and updates are performed is considered ideal. Thus, the entire process from image acquisition to analysis must be organically connected to enable high-speed mass-phenotypic analysis. However, most of the previously developed systems are very expensive and use algorithms applicable only to a specific environment, hindering their broad application. For example, in a previous study, when examining the number and area of leaves in the growth chamber to investigate the development of Arabidopsis, there were differences in the absence of various application; in addition, the study was soil-based [11]. Similarly to this study, in a 2D-based phenotyping system using a fixed camera, automatic water supply adjustment and area and color characteristics were analyzed. This study was conducted in a soil environment and applied to relatively small crops [12]. In some studies, 3D images and spectroscopy were applied by performing growth monitoring through individual moving ports. However, a limited number of parameters were used, and there were difficulties in system configuration using built-in software [13,14].
A plant factory is a mass crop production facility that can provide a more uniform growth environment than the open field through artificial lighting and complex environmental control in an enclosed space for the year-round production of crops [15]. However, even within these plant factories, spatial variations exist in micro-environmental conditions, such as light, temperature, and humidity, resulting in growth differences [3,16]. Moreover, it is necessary to capture and analyze at minimum hundreds of plant images per day to follow the rapid and intensive progression of growth in plant factories [4,17]. If the analysis is not accomplished in a real-time manner, the data will be accumulated and delay the response to the crop status. In the context, high-speed mass phenotyping approach can be a practical solution to provide location-specific information on crops growing in the cultivation bed, thereby allowing precise environmental control and growth management in plant factories such as yield estimation, crop harvest, or disease treatment.
Methods for acquiring image information according to location include acquiring multiple images while moving one camera and acquiring multiple data at a time by arranging multiple cameras at a certain location. When using a single mobile camera system, it is possible to use a high-cost camera with good performance rather than purchasing several cameras. Good performance provides high resolution and facilitates obtaining images of depth sensors or other wavelength bands rather than simple colors. Because the image is acquired with one device, there is no need to consider the error of the hardware itself. However, this method is relatively expensive and has limitations in repeatability, data acquisition time, and movement section restrictions because the camera position must be moved manually unless an additional automation device is employed in a situation where multiple crops need to be photographed. For example, Jiang et al. [18] developed an on-the-go monitoring platform to measure crop-growth variation according to the location; however, this system could only be moved for the first applied bed structure, and the configuration of the system became more complicated as the cultivation area increased. Yeh et al. [19] created a moving-image monitoring system using a moving arm. Its effectiveness was verified only on a small vertical bed, and rapid analysis was difficult because the growth information was confirmed via image processing through post-processing. Rossi et al. [20] reported a low-cost sliding platform for high-resolution plant phenotyping, but the processing time of more than 1 h would limit the application of the system to the level of laboratory analysis. A greenhouse-based low-cost phenotyping platform reported by Yassue et al. [21] is noteworthy since it proved its effectiveness in a greenhouse-level environment. However, it would not be applicable for vertical plant factories due to height problems. Bari et al. [22] applied a moving-cart embedded camera to the rails for monitoring growing peas in greenhouse, but the large area of the greenhouse meant that it was necessary to analyze the image via post-processing after the collection of images.
By contrast, as the method using several inexpensive cameras can secure a large amount of simultaneous image data, it is easy to analyze changes in the same location without additional correction processes. In addition, it can be flexibly configured for plant factories with relatively large and diverse production structures. However, there is a non-uniformity of information depending on the type and quality of images and the use of various hardware; therefore, it is necessary to develop an image processing technique to overcome this problem. Although An et al. [23] adopted the calibration of multiple-camera array and utilized it for plant phenotyping, the post-data collection and -processing made it difficult to access and analyze data in real time. Thrash et al. [24] also proposed a low-cost wireless phenotyping system, but it was only developed for a single index and a horizontal space. Gang et al. [25] developed a novel convolutional neural network-based model that can estimate various morphologic indices for plants grown in greenhouses, but its feasibility was not validated in an integrated phenotyping platform.
Considering the aforementioned limitations, it is necessary to develop a low-cost phenotyping system capable of collecting and processing data in real time while being structurally more flexible for crop monitoring in vertical plant factories. Furthermore, for phenotyping modeling aimed at analyzing the behaviors of various crops, it is necessary to simplify the determination of new indices or code modifications for correlation analysis.
For the purpose, in this study, a multi-camera network using an inexpensive image sensor and processor was developed. It was designed to have flexible space applicability through a wireless, miniaturized camera node configuration, and to make it easy to collect and analyze various phenotypic indices through a modularized image processing algorithm structure. Based on this, a system capable of performing high-speed mass-phenotypic analysis was constructed. Specifically, the developed system continuously and stably collected crop growth images from camera devices installed at different locations, classified them according to location and time, and stored them in an independent space of the computer server. The stored images were configured to analyze diverse crop characteristics through various image processing algorithms and to output the results. Additionally, the analyzed crop characteristics were used as data for a growth model for a specific situation, and the model was updated according to the data generation. The feasibility of the developed system was evaluated by collecting 2D images of lettuces for the entire growth cycle at various locations. To verify the applicability of the obtained phenotypic indices, growth information of lettuces growing under two different photo-environmental conditions within the plant factory were analyzed and compared.
2. Materials and Methods
2.1. Plant Growth Conditions
The camera system could be applied to any leafy vegetables with low heights, which are usually cultivated in the commercial plant factories [26]. In this study, Batavia lettuce (Lactuca sativa L.) was cultivated for the growth experiment, which is a type of lettuce that originated in Europe. Lettuce is one of the most important leafy vegetables in plant factories because of its popularity, with the highest consumption and economic importance throughout the world [27,28]. Individuals with similar weight, size, and shape were selected by direct sowing, and a monitoring experiment was conducted on the growth of the entire cycle from the second day after planting.
Cultivation was conducted in a container environment system located in Yongin, Gyeonggi-do, Republic of Korea (Figure 1). This container, a system that has an environment independent of the outside environment, is suitable for conducting reaction experiments of crops to a target factor. Crops were grown independently in a sponge medium serving as artificial soil, and the necessary nutrients were provided through a closed nutrient film technique system where the electrical conductivity and pH values without a separate nutrient solution supply device. Generally, EC and pH values below or above the optimal range can impede water and nutrient uptake in crops, thereby inhibiting growth and potentially inducing diseases [29]. Therefore, the nutrient solution was manually managed to maintain an appropriate concentration by measuring the EC and pH values at 2-day intervals through standard sampling. During cultivation, the temperature inside the container plant factory was maintained at an average of 22.1 °C in the range of 21–23 °C, and the humidity was maintained at an average of 65% in the range of 50% to 80%. CO2 was maintained at 400–700 ppm as a factor relating to plant respiration.
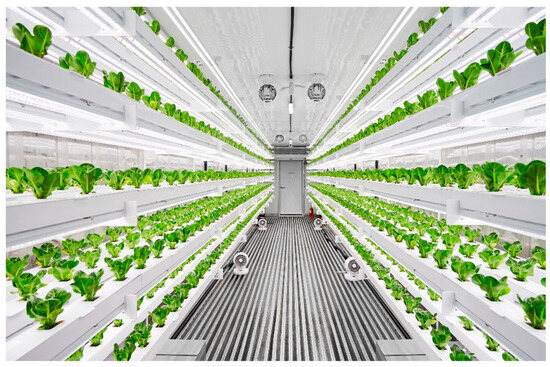
Figure 1.
Crop-growth container system with controlled environment.
2.2. Photoperiod Condition
Photoperiod is one of the most important variables affecting the plants’ growth process, thereby inspiring researchers or industries to explore the effective light/dark cycle for leafy vegetable productivity [30,31]. Specifically, it was reported that differing pulse width modulation of light would be an important factor in the photosynthesis. Chen and Yang [32] reported that intermittent light irradiation could enhance the biomass and taste of lettuces. Therefore, not only to evaluate the applicability of the developed system but also to confirm the effect of different light/dark cycles on the growth of lettuces, an experiment was conducted to establish a camera network for two cultivation beds and to check the growth difference by varying the photoperiod conditions for each zone. The control (con) group was irradiated with light for 16 h and maintained in the dark for 8 h; for the pulse (pul) group, light–dark conditions were set at intervals of 2 h and 1 h, respectively. Accordingly, the daily light irradiation time of the two groups was 16 h, and the total irradiation time and the total incident light amount were the same under the two photoperiod conditions. However, it was expected that improved growth would appear for pul group due to the different light/dark cycles. A total of 14 Batavia lettuces were cultivated for each group, and 4 lettuces were used for acquiring destructive test data (Figure 2). Specifically, 12 camera systems were installed for each control and experimental group to acquire images, while each camera was installed to be located in the center of each target crop. With regard to the extra two cameras for each group, they were used to validate the phenotypic analysis during the cultivation. Growth characteristics such as fresh weights of shoots, leaf length, leaf width, and leaf numbers were measured for four samples every week. Fresh weights of shoots of lettuces were measured using a digital scale (Si-234, Denver Instrument, Denver, CO, USA), and the length and the width of leaves were measured using a ruler. The measured values were used to analyze the differences in data and to compare means among the treatments, respectively.
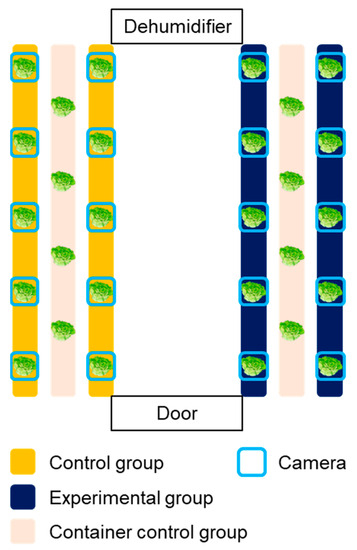
Figure 2.
Experimental layout of growing bed and camera network installation.
2.3. Low-Cost Camera Network
For high-speed, mass-phenotypic analysis targeting plant factories, the narrow cultivation interval between crops and the restriction of height should be considered. Accordingly, the proposed system was configured in the form of a multi-point camera network that could freely attach and detach small camera modules and provide integrated access to information on each image collection node through a web connection. Moreover, the building cost of the camera network system is about 5% level compared to the on-the-go monitoring system by Jiang, Kim, and Cho [18] (Table 1). Although the cost will be increased as the number of camera nodes increases, it is still more reasonable than the on-the-go monitoring system when considering the scan area.

Table 1.
Comparison of the camera network system with the on-the-go monitoring system by Jiang, Kim, and Cho [18].
A Raspberry Pi 3B+ (Raspberry Pi Foundation, Cambridge, UK) was used as a low-cost microprocessor that can acquire images of crops for the experiment and transmit them to the server. It was selected because it is small, light, and inexpensive, has good compatibility with various equipment, and has good accessibility compared to other commercial products.
Various cameras, including a USB webcam, can be connected to the Raspberry Pi to take pictures. The Raspberry Pi Camera v2 (Raspberry Pi Foundation, UK) was selected and used to compare the stability, convenience, and image quality. This camera is composed of a module with a resolution of 3280 × 2464 and a performance of approximately eight megapixels. For the stability of data collection, the board and camera modules were configured in a one-to-one connection. The Raspberry Pi and camera module used in this study are not essential parts and can be replaced with other products depending on the experimental environment conditions.
Because the monitoring of crops is conducted remotely, the information obtained on the local Raspberry Pi has to be grasped remotely. Moreover, as mentioned above, an external system is needed to solve the problems associated with the use of multiple processors and limited local capacity. To this end, a computer acting as a server and multiple Raspberry Pi devices were connected to form a system to automatically import data. The computer acting as a server played an overall role in storing and analyzing data. The computer was configured with a Linux operating system environment of core i7-7700k CPU @4.2 GHz (Intel Corp., Santa Clara, CA, USA) and 32 GB RAM for continuity with Raspberry Pi.
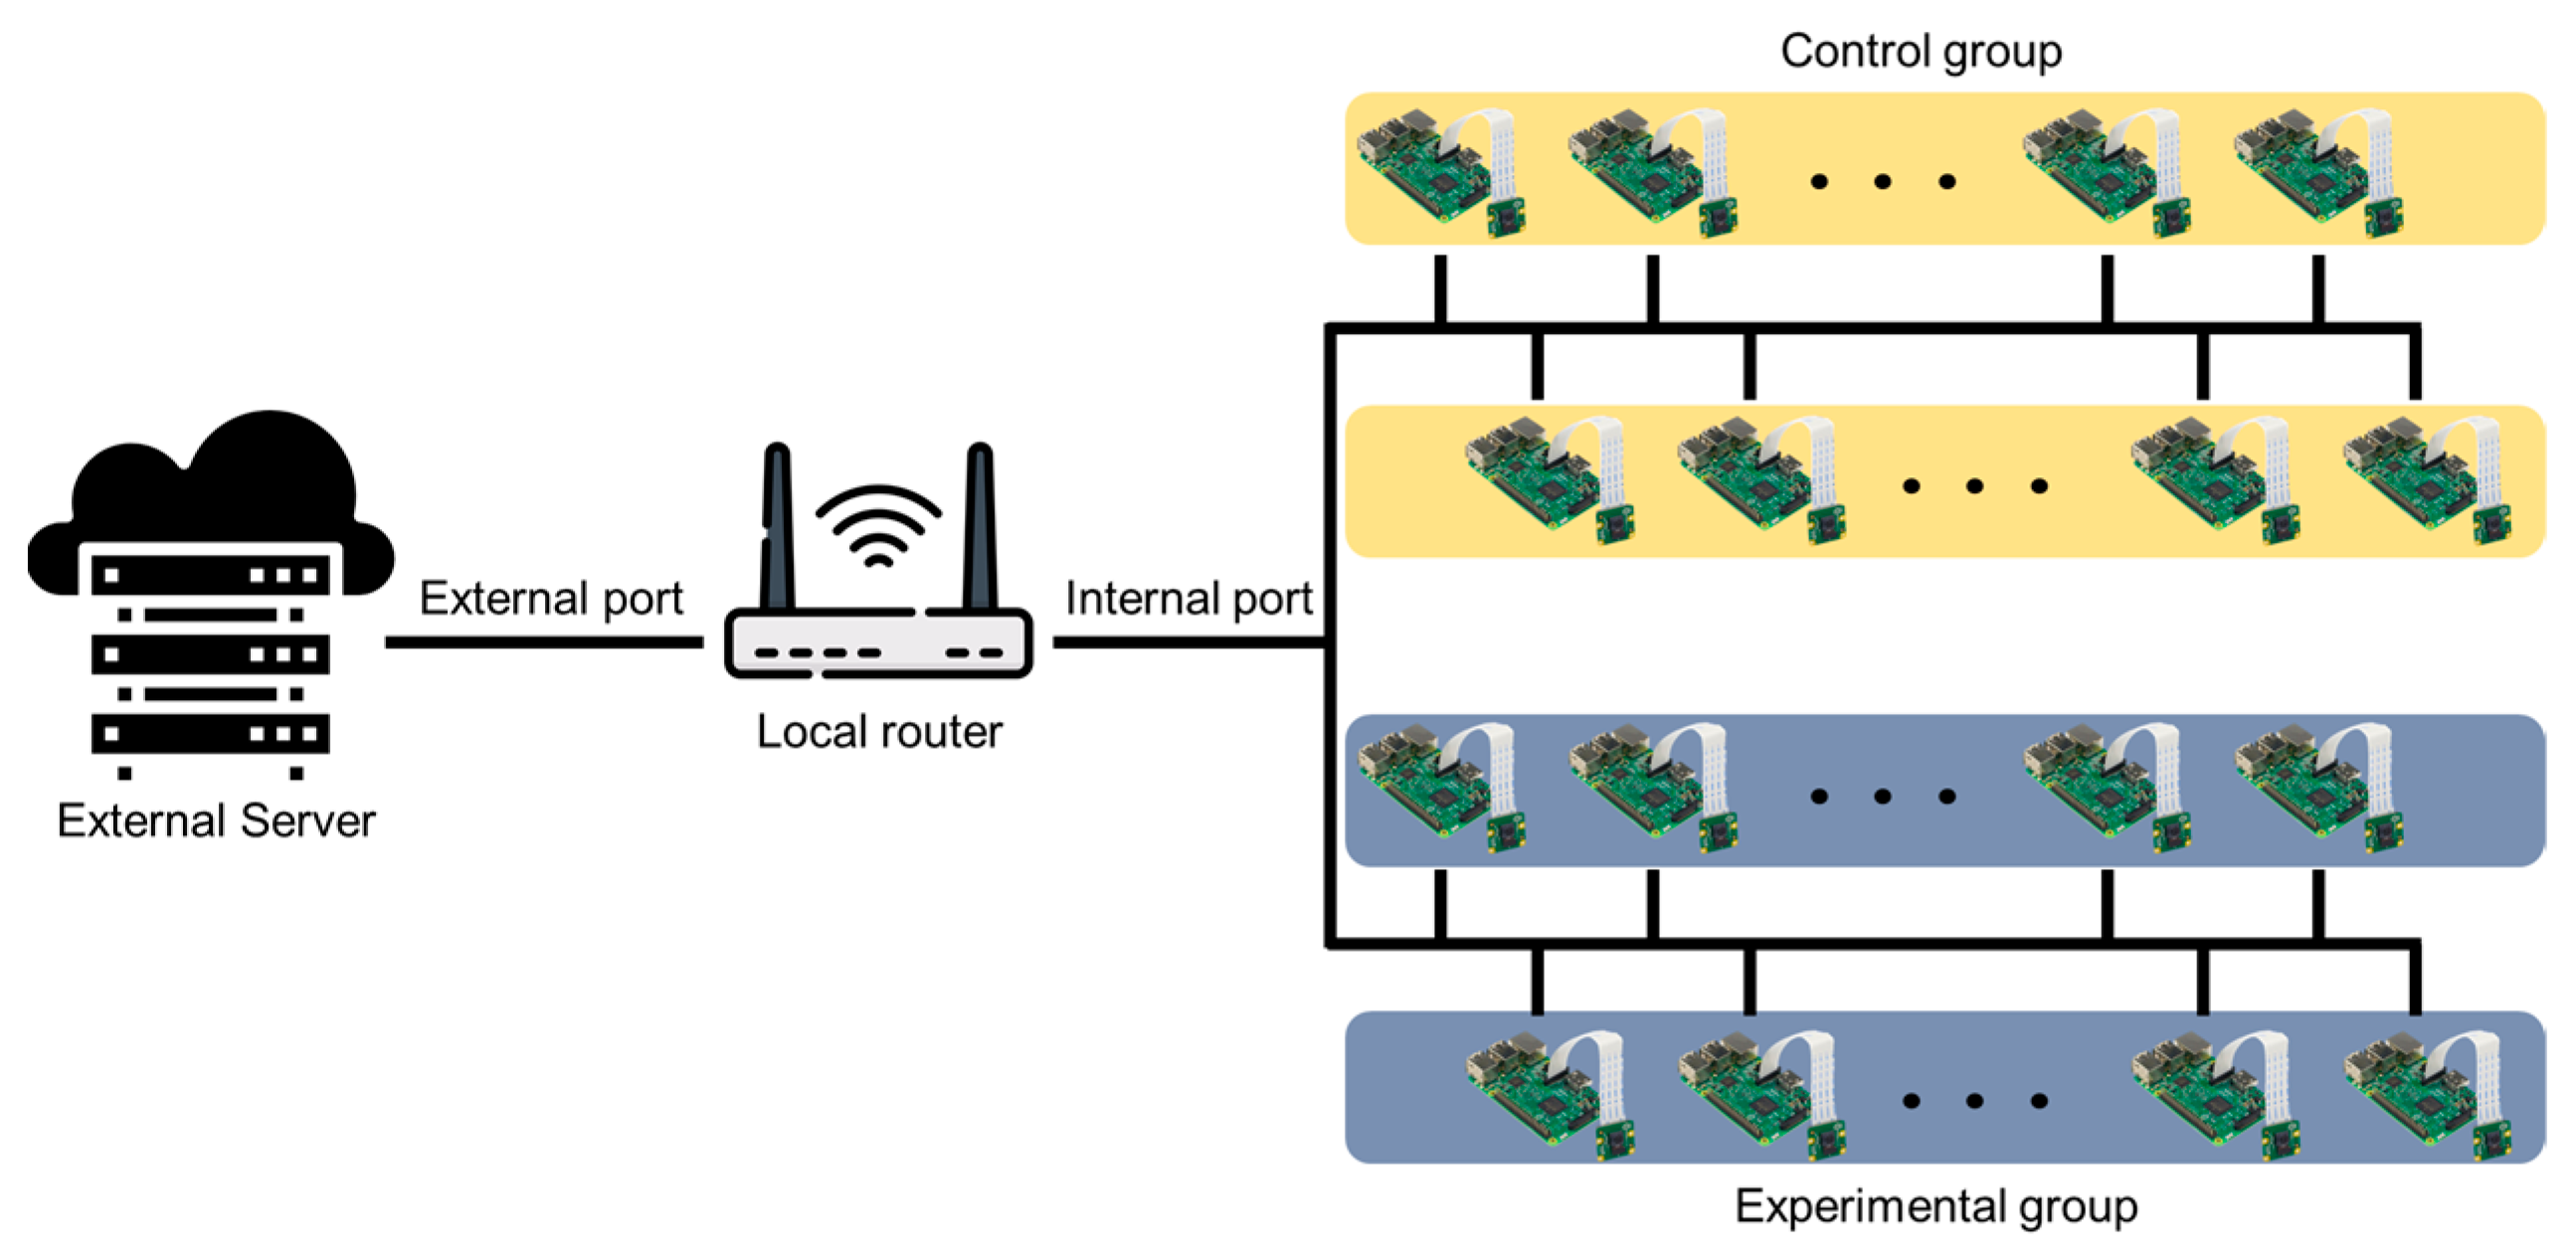
Figure 3 shows the network diagram for system setup. This network diagram is an example for the photoperiod experiment of this study, and it is possible to add or remove a server, router, Raspberry Pi, etc., depending on the researcher’s experimental environment. Several Raspberry Pi devices for shooting were connected to a single local router via Wi-Fi. A port forwarding method replaces the internal IP between the local router and the Raspberry Pi connected to the lower internal network and creates a new address that can be accessed remotely. Therefore, it was possible to remotely access the Raspberry Pi containing the image information for each location and transmit and receive real-time monitoring and image information. The external server was connected to several Raspberry Pi devices through the local router and used the secure shell (SSH) protocol to access and issue remote commands. Thus, the SSH class was implemented, and the image data were transmitted to the server at a specific period after creating a session using the port forwarding access address. In the server, there were folders designated for each Raspberry Pi, and images were saved in each folder with a name set using date and time information.

Figure 3.
Diagram of network structure of the system.
2.4. Crop Image Collection
As described in the following passages, image data taken according to time conditions were saved in the Raspberry Pi and configured to be transmitted to the server at a specific point in time to enable continuous image shooting. When an image acquisition signal was transmitted to the Raspberry Pi according to the time condition (20 min intervals), a process for stabilizing the image sensor was performed, and the image shooting was performed after acquiring the local time required for phenotypic analysis. To stably acquire image data, the data transmission operation was interrupted during the acquisition process. Since it did not take much time to transmit one image, the data were transmitted when a certain number of images were accumulated in consideration of the system load in the transmission process. Accordingly, data collection to the server was performed once daily. The code for image acquisition was written using Python, and camera control was performed with a Python library called “PiCamera.” The use of crontab provided a reduction in the system load, as the system was run only when necessary, rather than continuously.
As the images acquired have high resolution, one file has a size of approximately 4 MB. This is not a problem in short-term monitoring, but in the case of long-term experiments, there may be a problem of insufficient capacity inside the processor. Accordingly, flags for the number of consecutive shooting days, or the number of stored files can be configured to enable continuous monitoring by deleting previous files when the limit is exceeded. In addition, in the process of transmitting the image to the server, it was implemented to record and display logs such as connection errors, image errors, and transmission completion of the local Raspberry Pi to promptly respond to users.
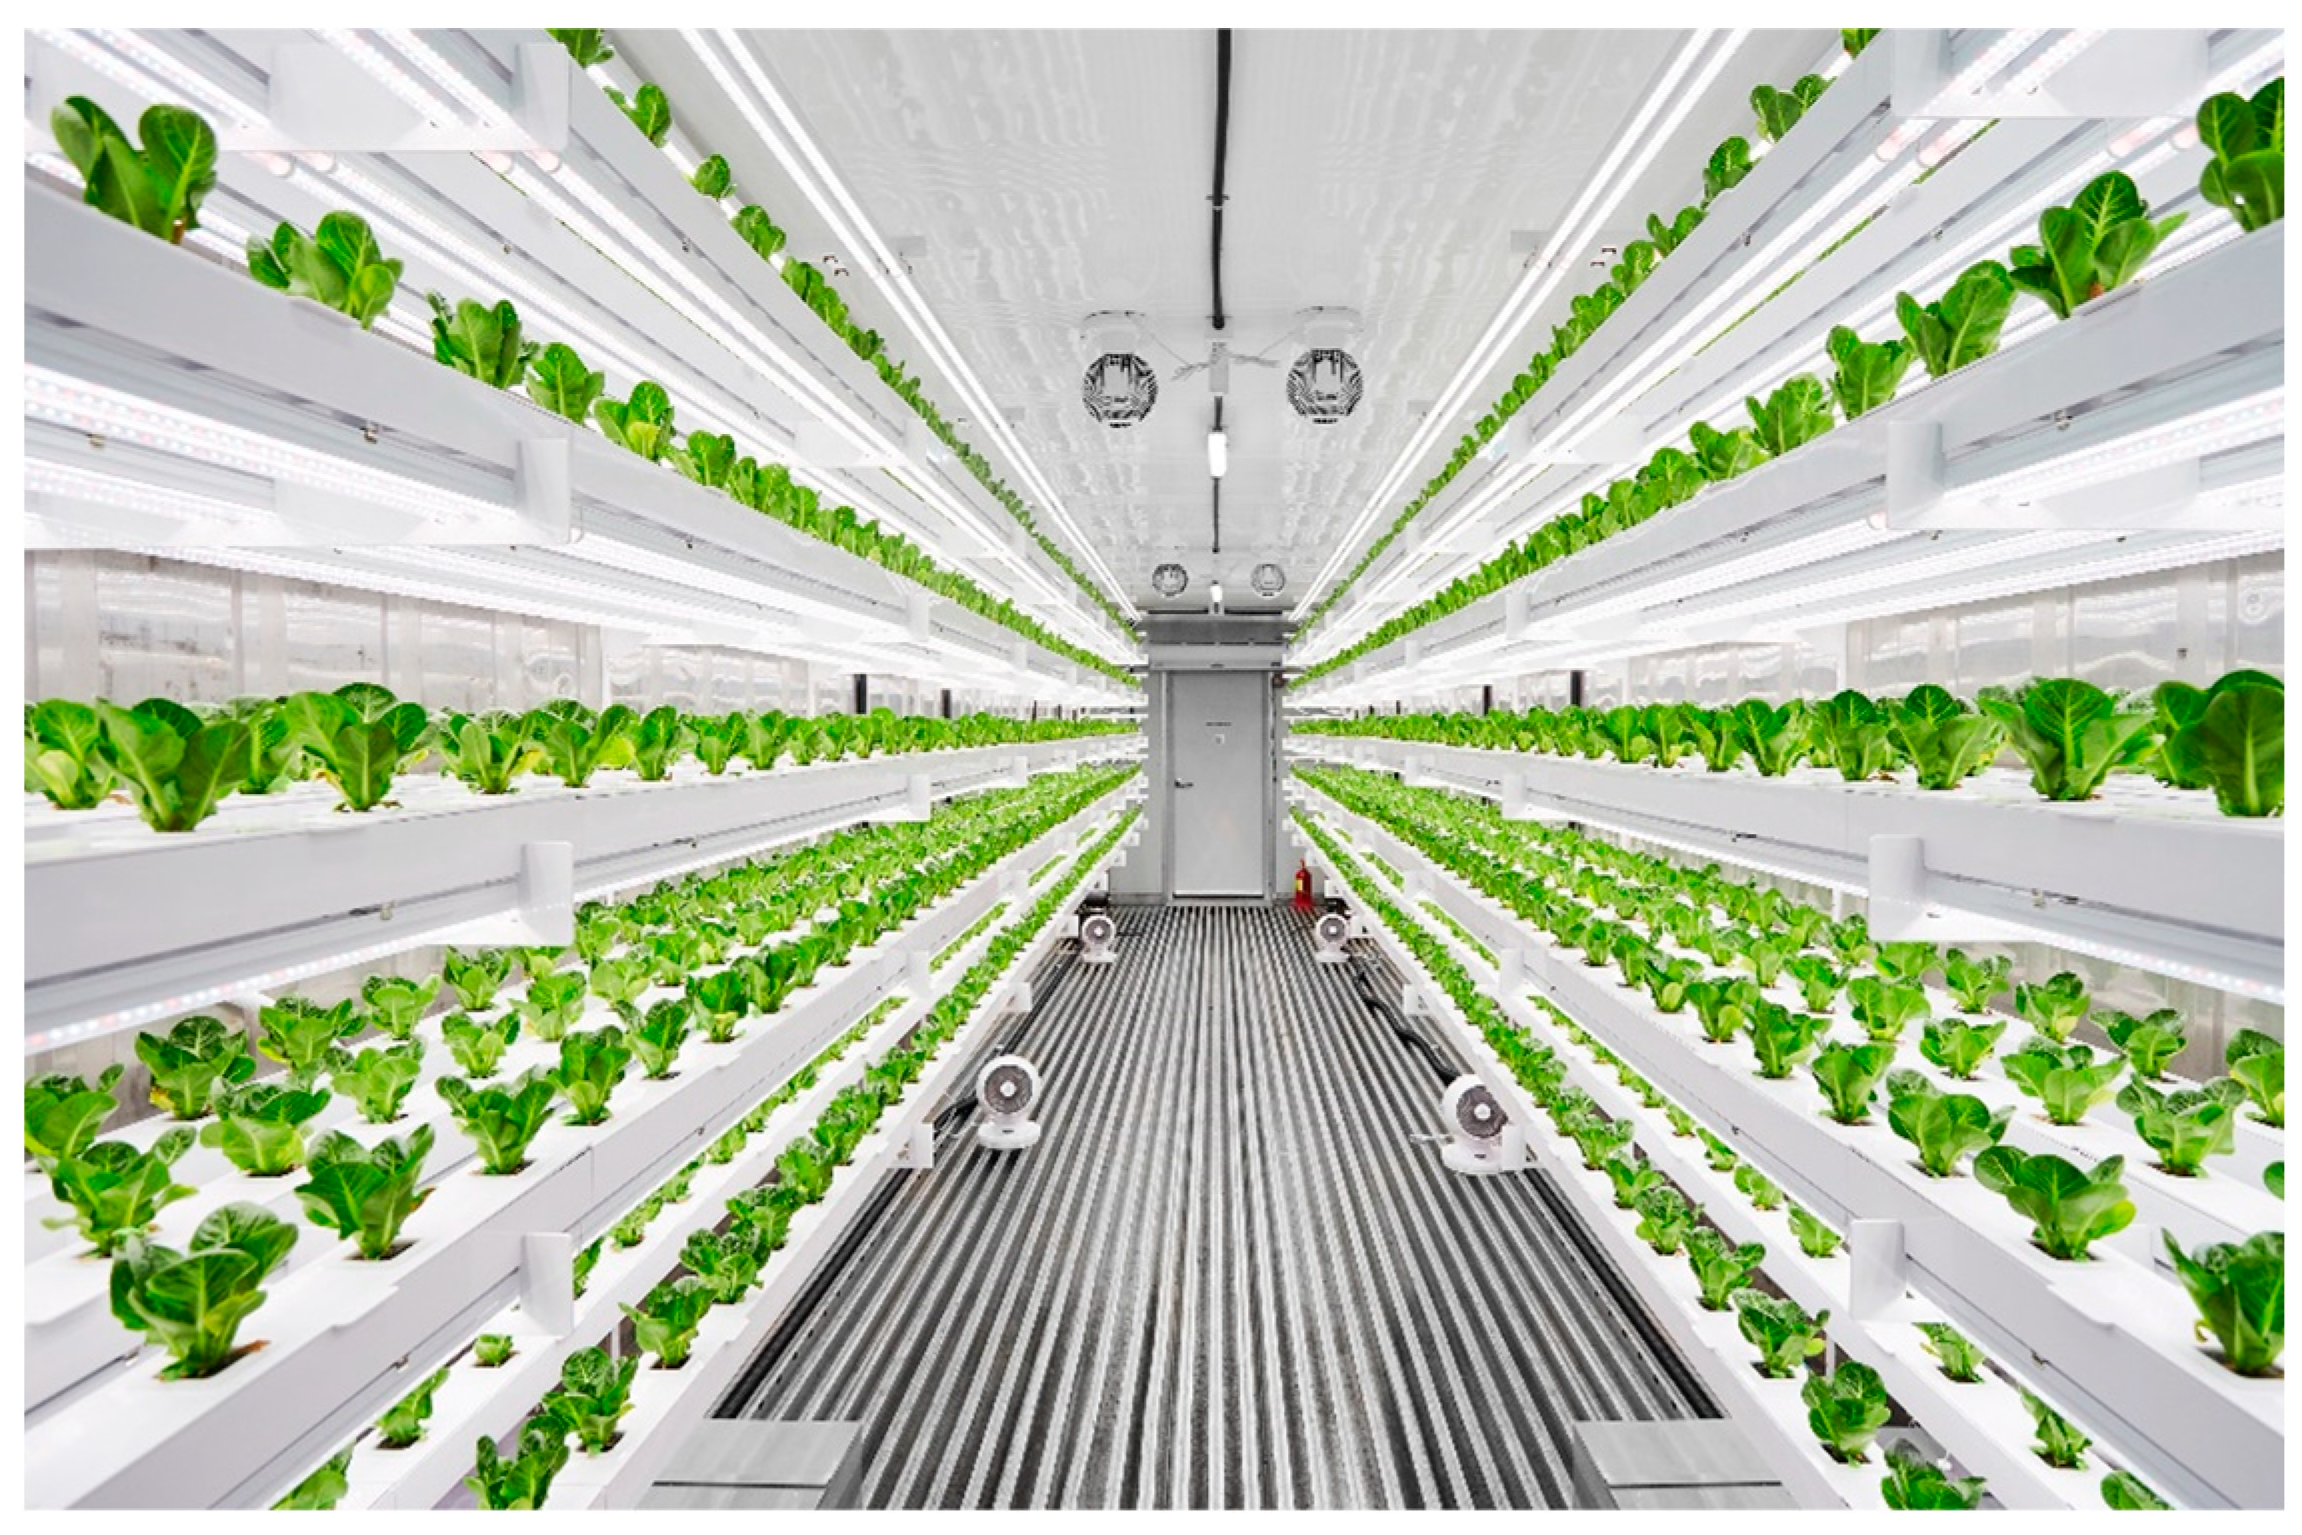
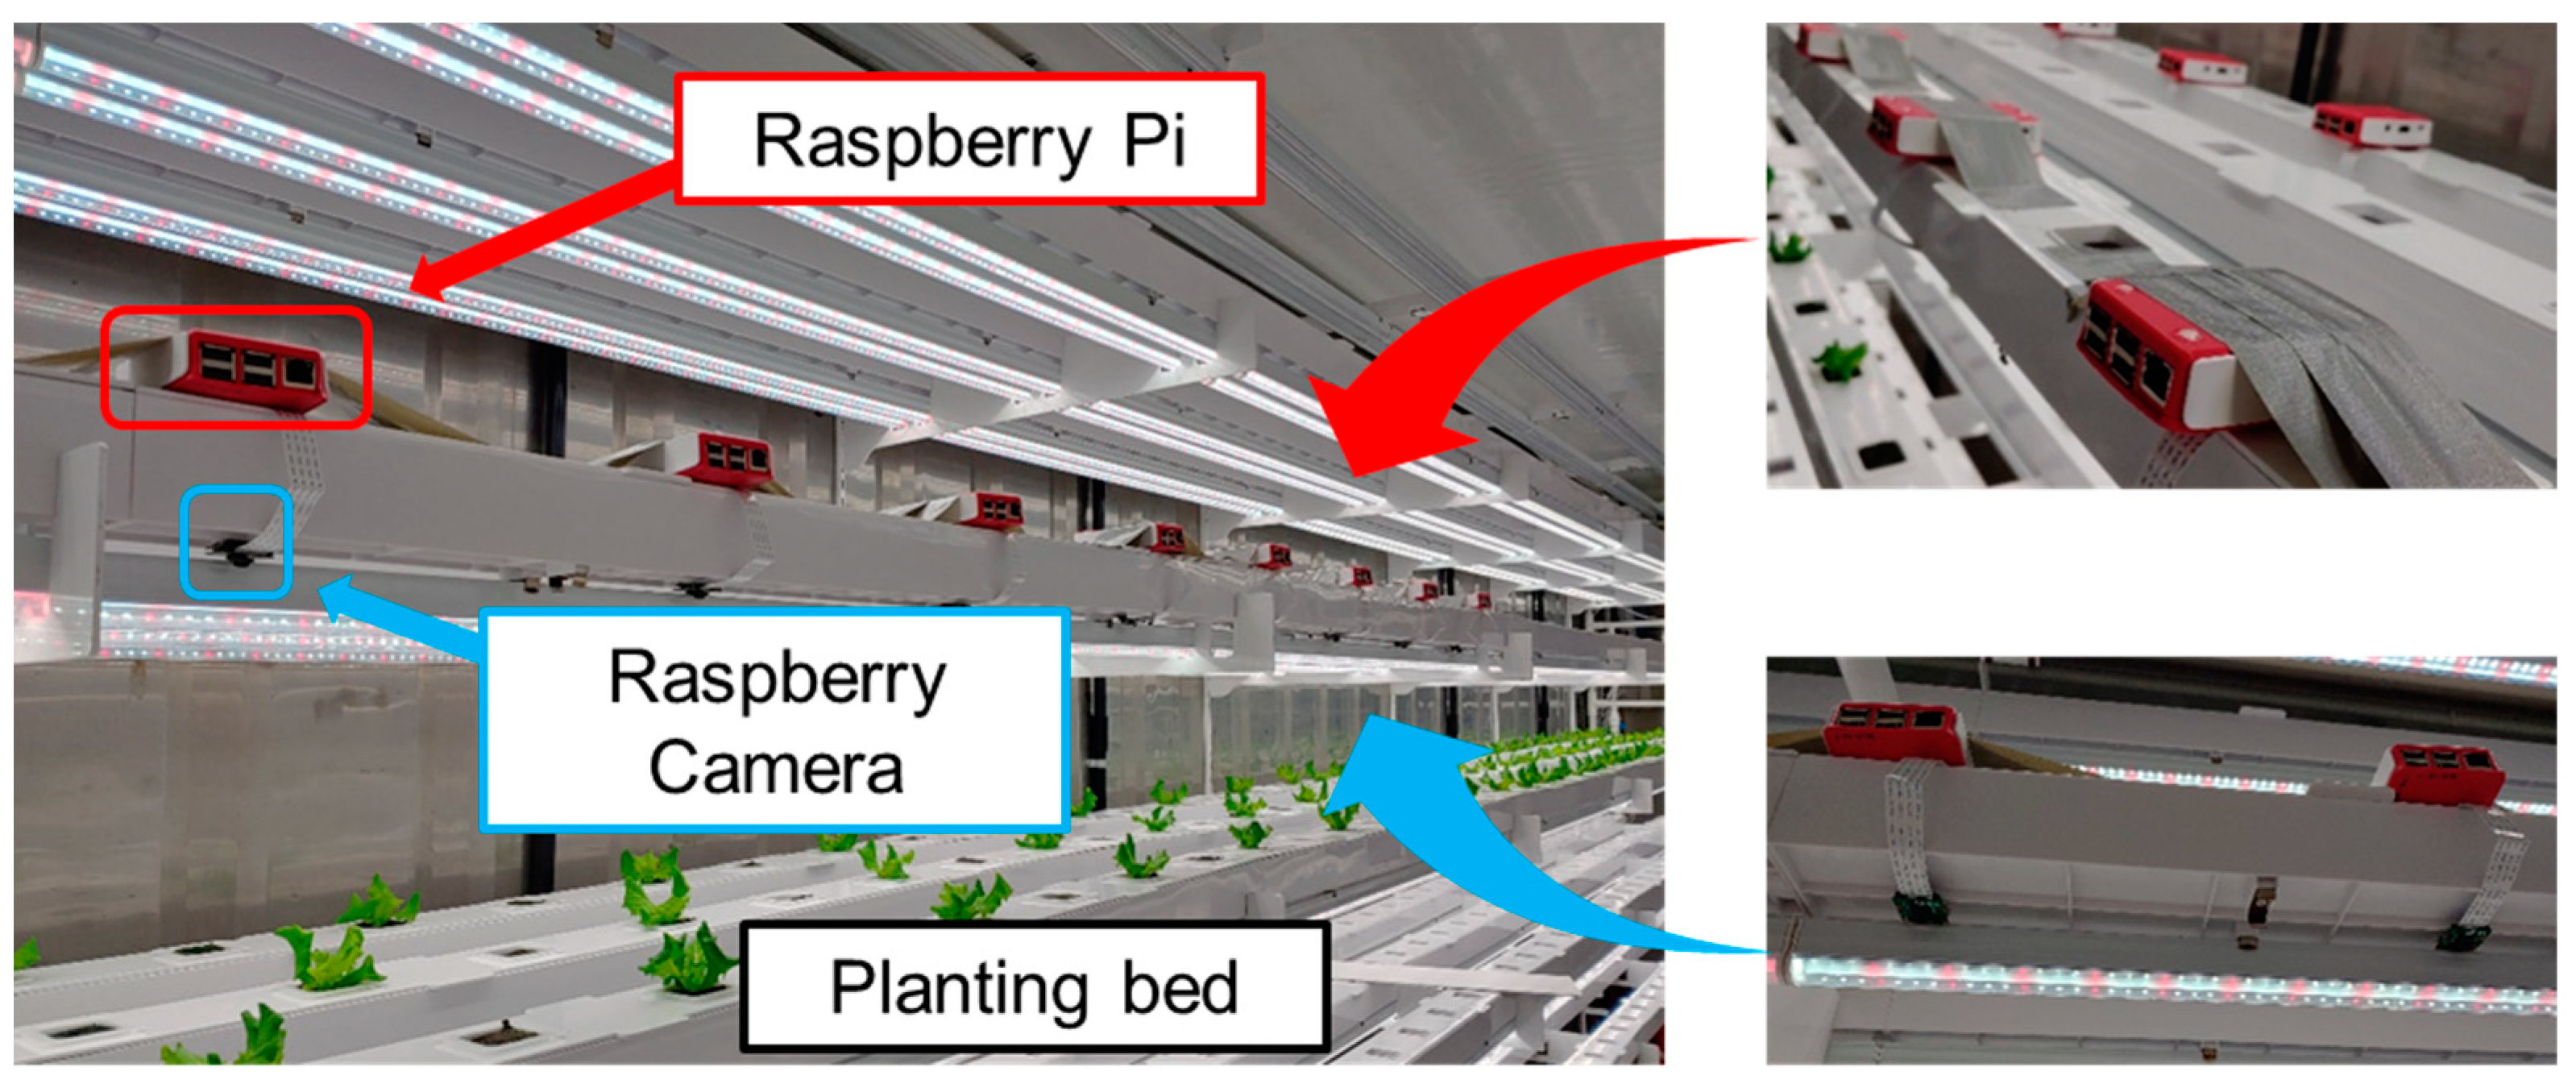
The imaging system consisted of a top-view image acquisition system that could secure crop-growth images in container environmental conditions. The system was configured so that only one crop was placed in the center of one image. Camera modules were installed in the space between the LED lamps to obtain an accurate top-view image and to prevent light intensity interference. Each camera module was calibrated using a classic color checker (X-Rite, Grand Rapids, MI, USA) to compensate the spatial variability. Image acquisition was performed for additional 10 s to stabilize the shooting. Figure 4 shows the multi-camera network installed for multi-point growth image monitoring.
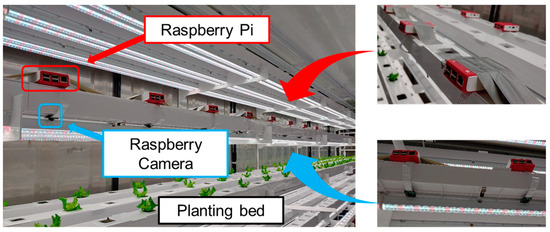
Figure 4.
Views of multi-camera network-based high-throughput phenotyping system.
2.5. Phenotypic Index Processing Algorithms
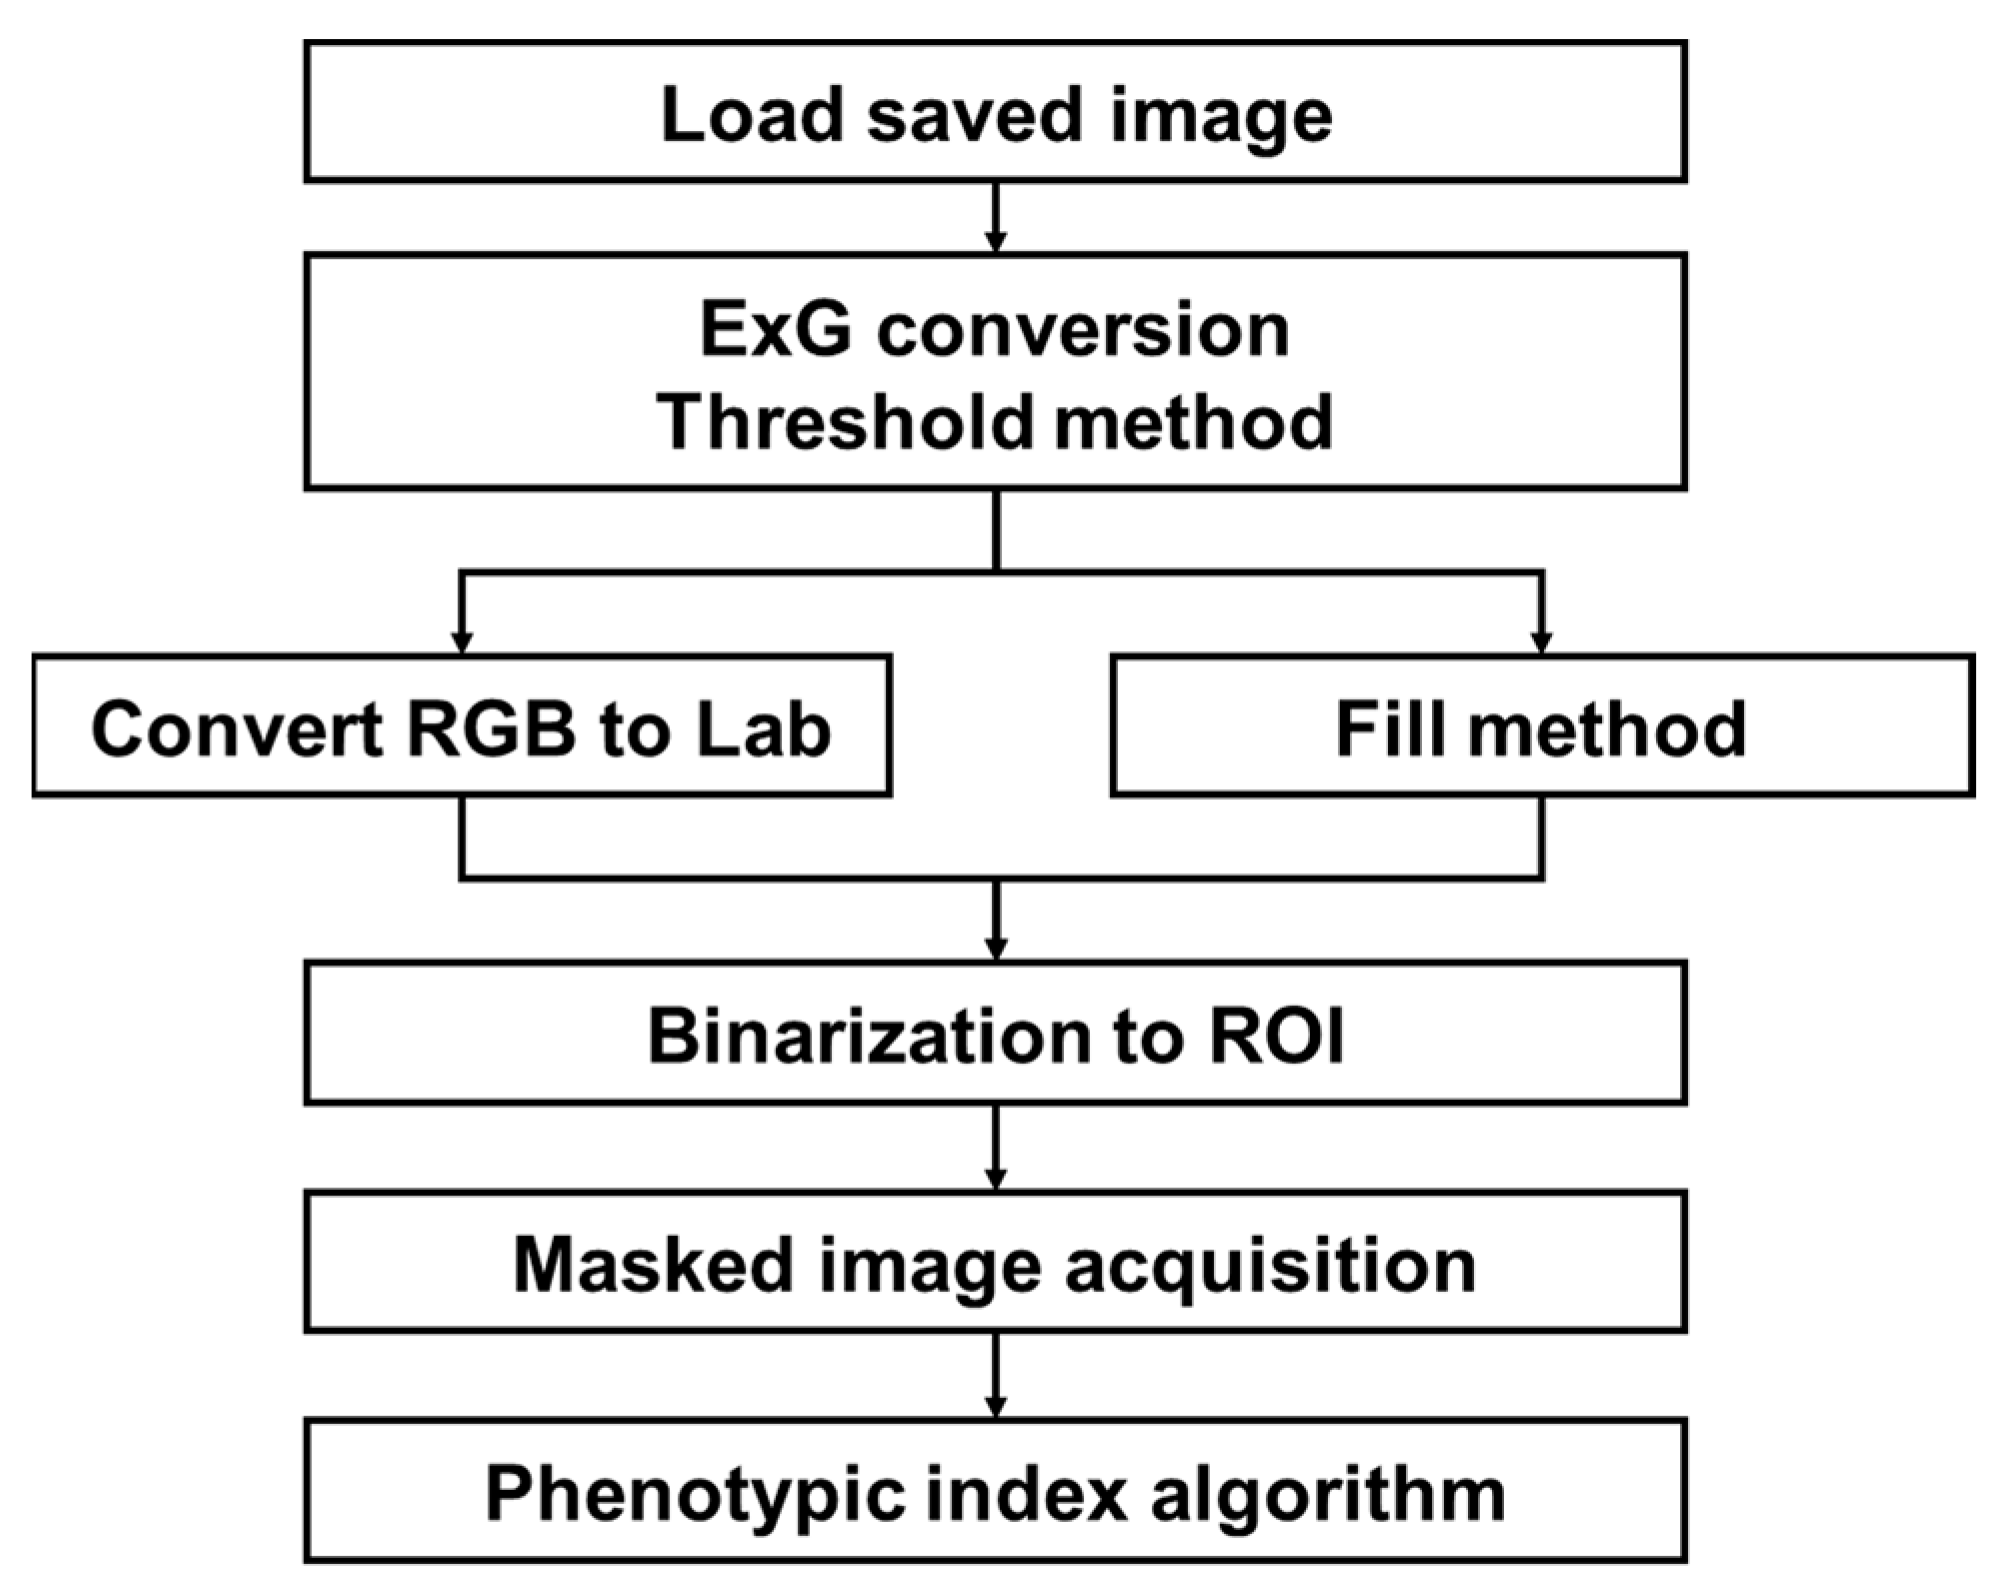
An automatic extraction process of the phenotypic index required for analysis was performed on crop images stored in each folder of the server. Crop images acquired by our system consisting of a camera network contain various noises depending on the environmental conditions of the plant factory. Depending on the system configuration conditions, an image contains only one crop, but the image also includes several types of surrounding environments, such as planting bed, media, and other modules, as noise. The image processing steps to counter these issues are shown in Figure 5. Several algorithms were combined to extract the region of interest (ROI) corresponding to the crop parts required for analysis. ROI are initially extracted from the acquired images using the vegetation index and Otsu threshold method. Because small errors appear in these results, the final binary ROI was extracted through the intersection of colorimetric changes and small space filling methods. For the extracted ROI, the contour and pixel area were obtained, the center was found, the shortest and longest lengths were measured, and the average color information was identified. The extracted index formed a data frame with the structure of the crop, date, time, index 1, index 2,…, index n, which was stored in a comma-separated values (csv) format. It was also possible to check the image for specific results. The image processing was configured to be performed on the entire folder when a certain number of image data were added, including files that were not analyzed. The default value was set at daily intervals; thus, when the daily data transmission was completed, index extraction was performed only on new data. The newly created indicator data were stored cumulatively in the previously saved csv file to enable continuous analysis. For the storage and management of data, it is possible to consider a method of using a database rather than a simple csv format storage. In this study, a database was not considered because a simple configuration was sufficient. However, if the system grows in size, the use of a database would be necessary. OpenCV and PlantCV libraries were mainly used in the image processing.
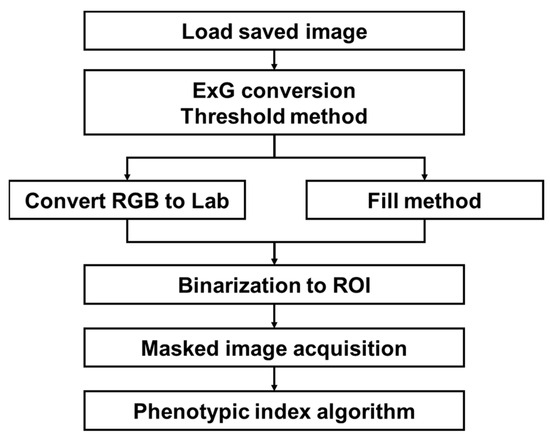
Figure 5.
Overall flowchart for crop ROI extraction and phenotypic index.
For accurate analysis of crop image phenotypic indices, some aspects were considered on the images obtained. First, image distortion was considered [33]. Usually, in the case of an image containing several crops, errors occur in the center and edges of the image owing to the hardware characteristics of the camera lens. This phenomenon is called distortion. In the case of the configured system, only one crop was placed in the center of one camera to avoid distortion. Second, even by precisely positioning the camera and crop, physical skew occurs [34]. This can cause problems in image tracking because movement may occur as the crop grows; in addition, it depends on the characteristics of hydroponics. In this regard, an analysis method not affected by skew was used. Specifically, two methods were applied to avoid the effect of skew: first, one camera was placed for each crop so that the crop was located in the center of the image, thereby minimizing the effects of skew, which typically occurs in the corners of the image. Second, the projected area viewed from the top instead of the actual leaf area to extract phenotyping features because it could reduce skew interference caused by leaves growing in various directions. Lastly, because multiple cameras were used, the colors appeared slightly different for each camera, even when shooting the same subject. This was solved by performing a calibration process using a separate color panel as a hardware characteristic.
The first step of the analysis of crops is the extraction of a ROI through background separation. If ROI extraction is not performed adequately, values calculated in the subsequent process become useless. Accordingly, several algorithms were combined and utilized. The target part was a crop, and the image to be analyzed was in the form of 2D red–green–blue (RGB). Thus, Excess Green (ExG), an image extraction method [35], was applied among the available vegetation indices [36]. As shown in Equation (1), R, G, and B color channels were used, normalized values divided by the maximum values (, , ) of each channel were employed, and the equation was derived by assigning weights to the green part.
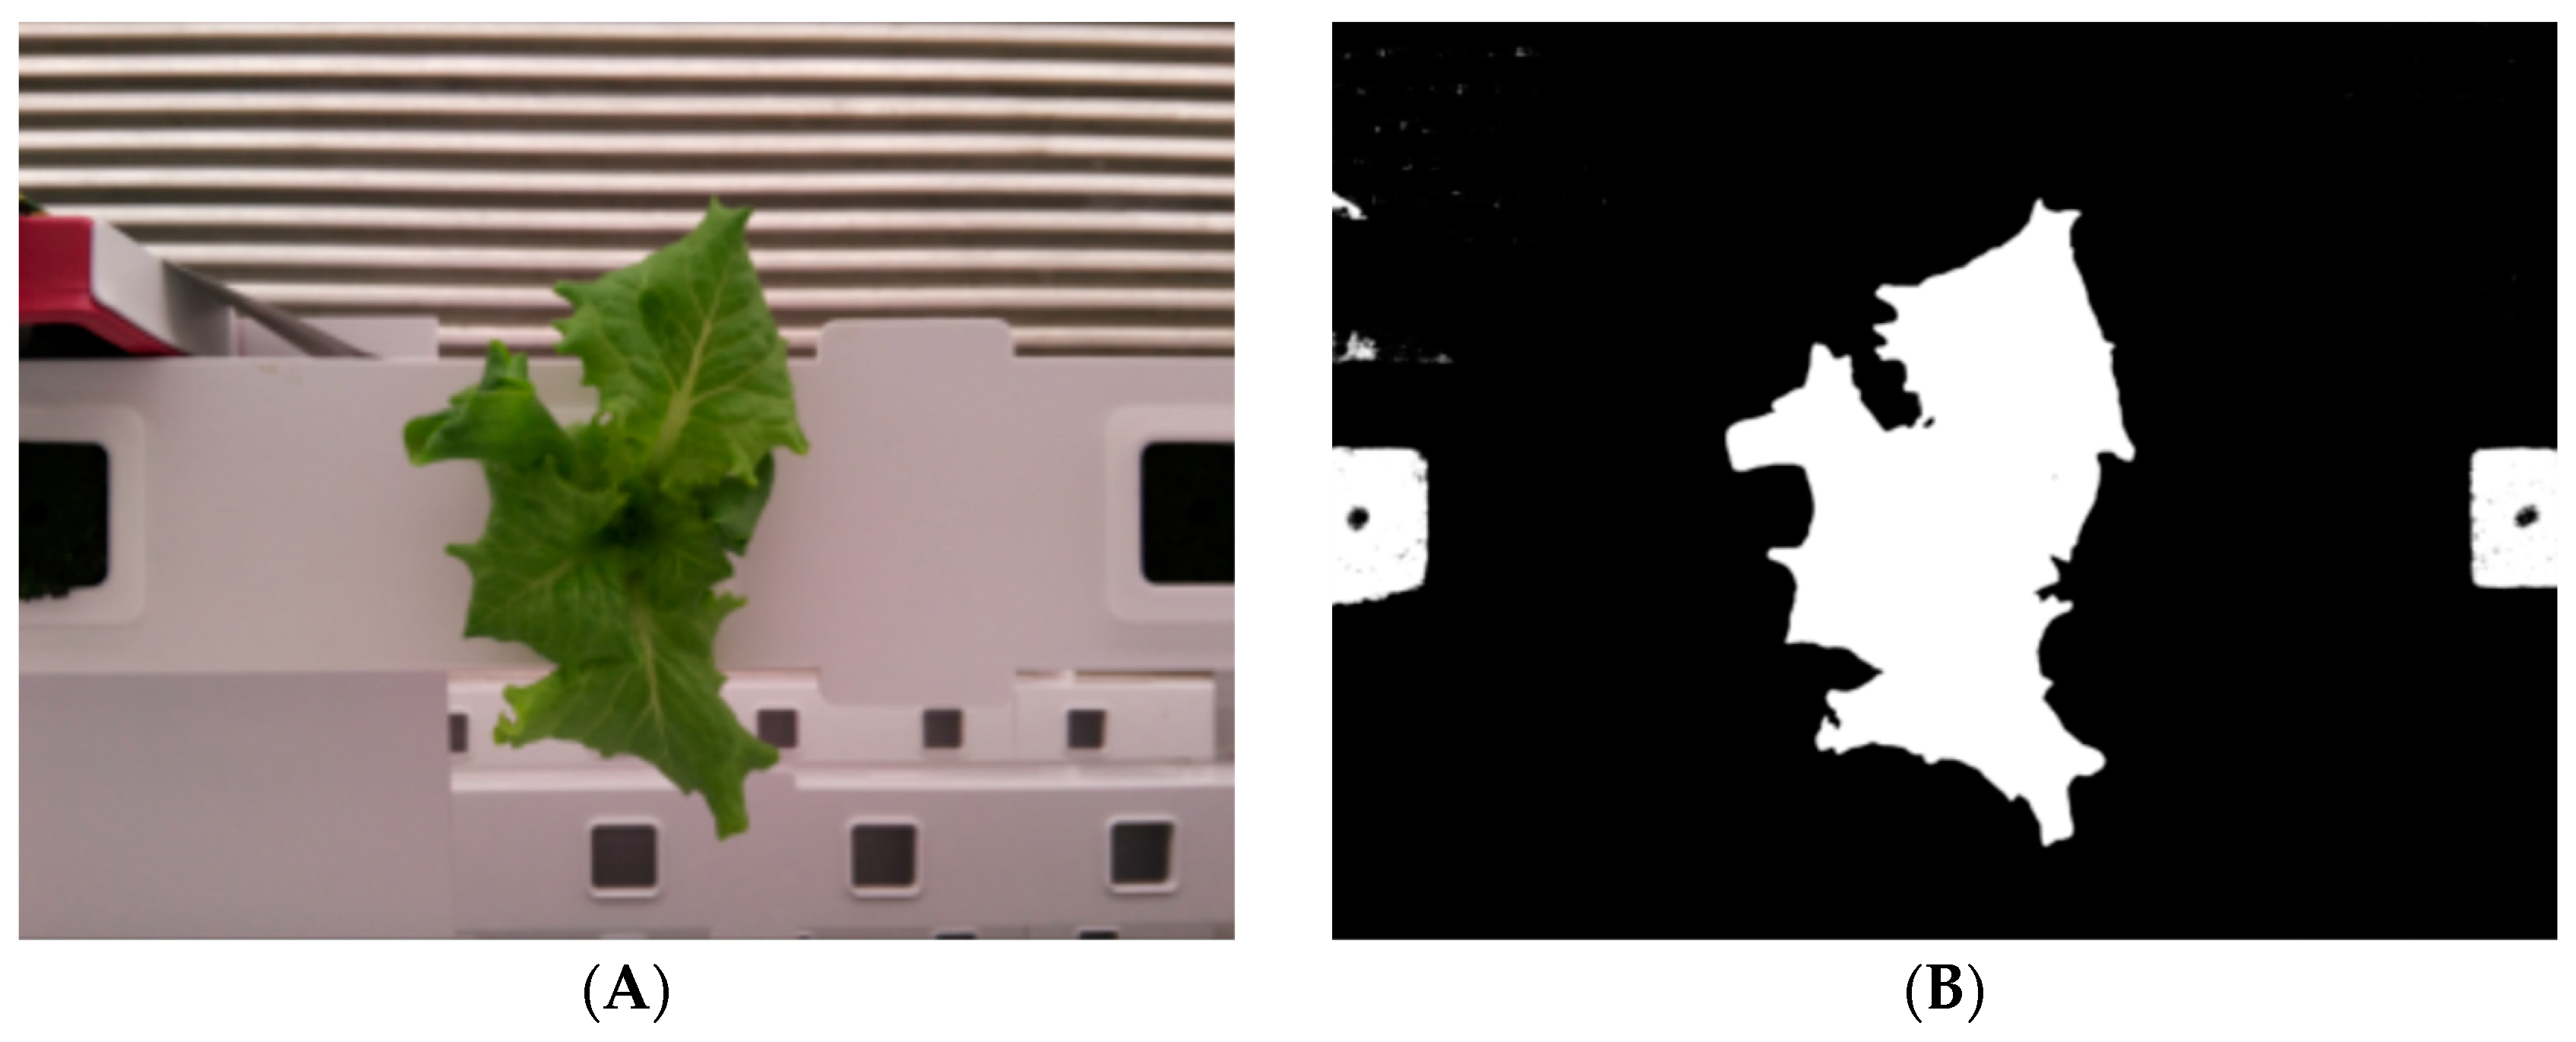
ExG uses only RGB colors and is an index affected by green; therefore, large and small noises could be included, as shown in Figure 6. Although the noise of small particles is also an issue, the artificial medium, which is usually used in plant factories, has a larger role in noises. The artificial medium is artificial soil constructed to enable crops to absorb and support the nutrient solution. In commercial plant factories, an empty artificial medium is sometimes placed to control the planting distance, but it could be recognized as a crop part in the image and included as noise. These noises cannot be distinguished by using ExG, so additional image processing is required.

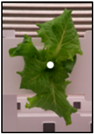
Figure 6.
Results of applying ExG conversion to crop images: (A) RGB and (B) ExG binary images.
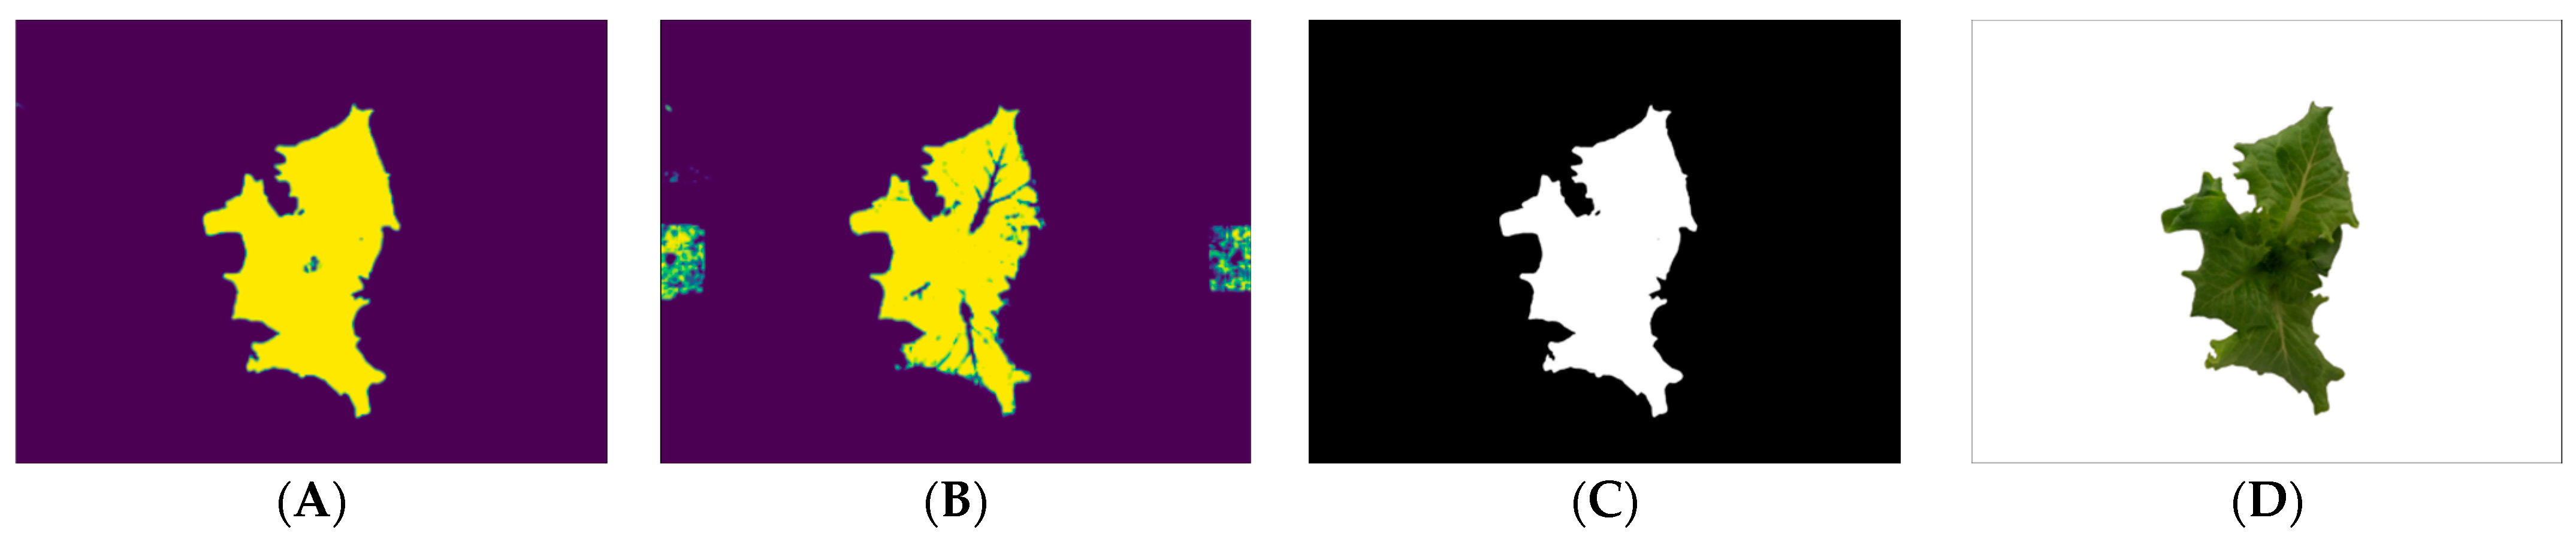
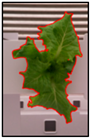
In this study, the hydroponic system in plant factory was considered as the target field. Therefore, noise filtering for plant factory condition was established to extract the crop parts, excluding noise from the image extracted through the vegetation index. After converting the image masked with ExG to the Lab color system, the green-magenta and blue-yellow channels were extracted, and a threshold value determined based on the trial-and-error method was set to remove the noise. Since the lab color space reflects the uniformity of colors, thereby allowing more robustness for the illumination effect [37,38]. Relating to binarization for crop segmentation, by combining the two methods and performing an additional fill process on a small part, a sophisticated binary image of the ROI was extracted. The final target image was obtained by masking the original image on the binary image (Figure 7).
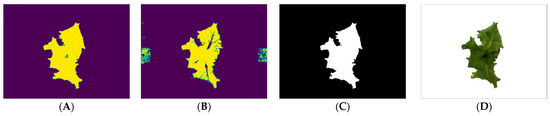
Figure 7.
Additional image processing to acquire images of the ROI: (A,B) noise removal through Lab color system, (C) binary image, and (D) mask image.
Although more sophisticated segmentation techniques such as a multilevel thresholding or combination of other color spaces such as hue–saturation–value (HSV), and hue–saturation–intensity (HSI) used for detecting the diseased leaf area could be used, the techniques require more processing time for one image, thereby inducing considerable delay for entire growing bed monitoring [37,38,39]. Therefore, in this study, the proposed image processing algorithm was simply constructed to achieve the real-time analysis of the morphological growth characteristics.
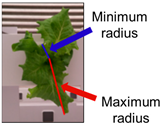
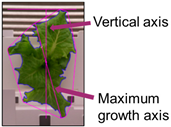
A process was performed to determine a phenotypic index that could be used for analysis with respect to the extracted ROI image. The center, contour, length, central axis, color space distribution, growth distortion, and color histogram were selected by referring to the useful phenotypic indices related to crop morphology in previous studies [19,40,41,42]. Table 2 shows a description of each indicator and the automatic acquisition algorithm.
Table 2.
Phenotypic index description and computation method.
All processes such as image acquisition, save, image processing, and phenotypic index extraction were modularized through classes and functions. Modularity facilitated the modification and addition of content. Although some parameters needed to be modified according to the experimental environment conditions, it was possible to easily change them according to the user environment through the modularization of the image processing algorithm. Since it was possible to remove only a specific part and add a sub-list of new functions and classes, it could be flexibly applied according to various experimental purposes and growing environments.
Although these various phenotypic indices can have meaning by themselves, they enable further analysis through correlation with actual crop characteristics or addition of an algorithm. To check this possibility, the manually measured values were used for analysis. In the process of conducting the experiment, crop characteristics such as fresh weight, leaf length, leaf width, and leaf number were manually measured and compared with the extracted phenotypic indices. After identifying the correlation, a trend line was drawn through a regression equation, and the coefficient of determination and root mean square error (RMSE) were obtained to verify the indices.
3. Results
3.1. Evaluation of Camera Network
It was confirmed that the developed system can easily identify and solve various problems that may occur in the process of image acquisition and processing through the log generated during the image transmission process. This detected several errors in the artificially generated data port, capturing data, and in the transmission process. Accordingly, it was possible to respond appropriately to the problems that arose, and the validity of subsequent analysis of the transmitted data could be secured.
The phenotypic index extraction algorithm was evaluated by performing the analysis on nine items, including center, contour, minimum radius, maximum radius, spatial vertical axis, maximum growth axis, color space distribution, growth distortion, and color histogram. As a result of performing automatic index extraction on a total of 35,000 image data, the total analysis time was approximately 2.43 s per image and included index values and image result output. The time required for analysis may vary depending on the number and type of indicators to be analyzed.
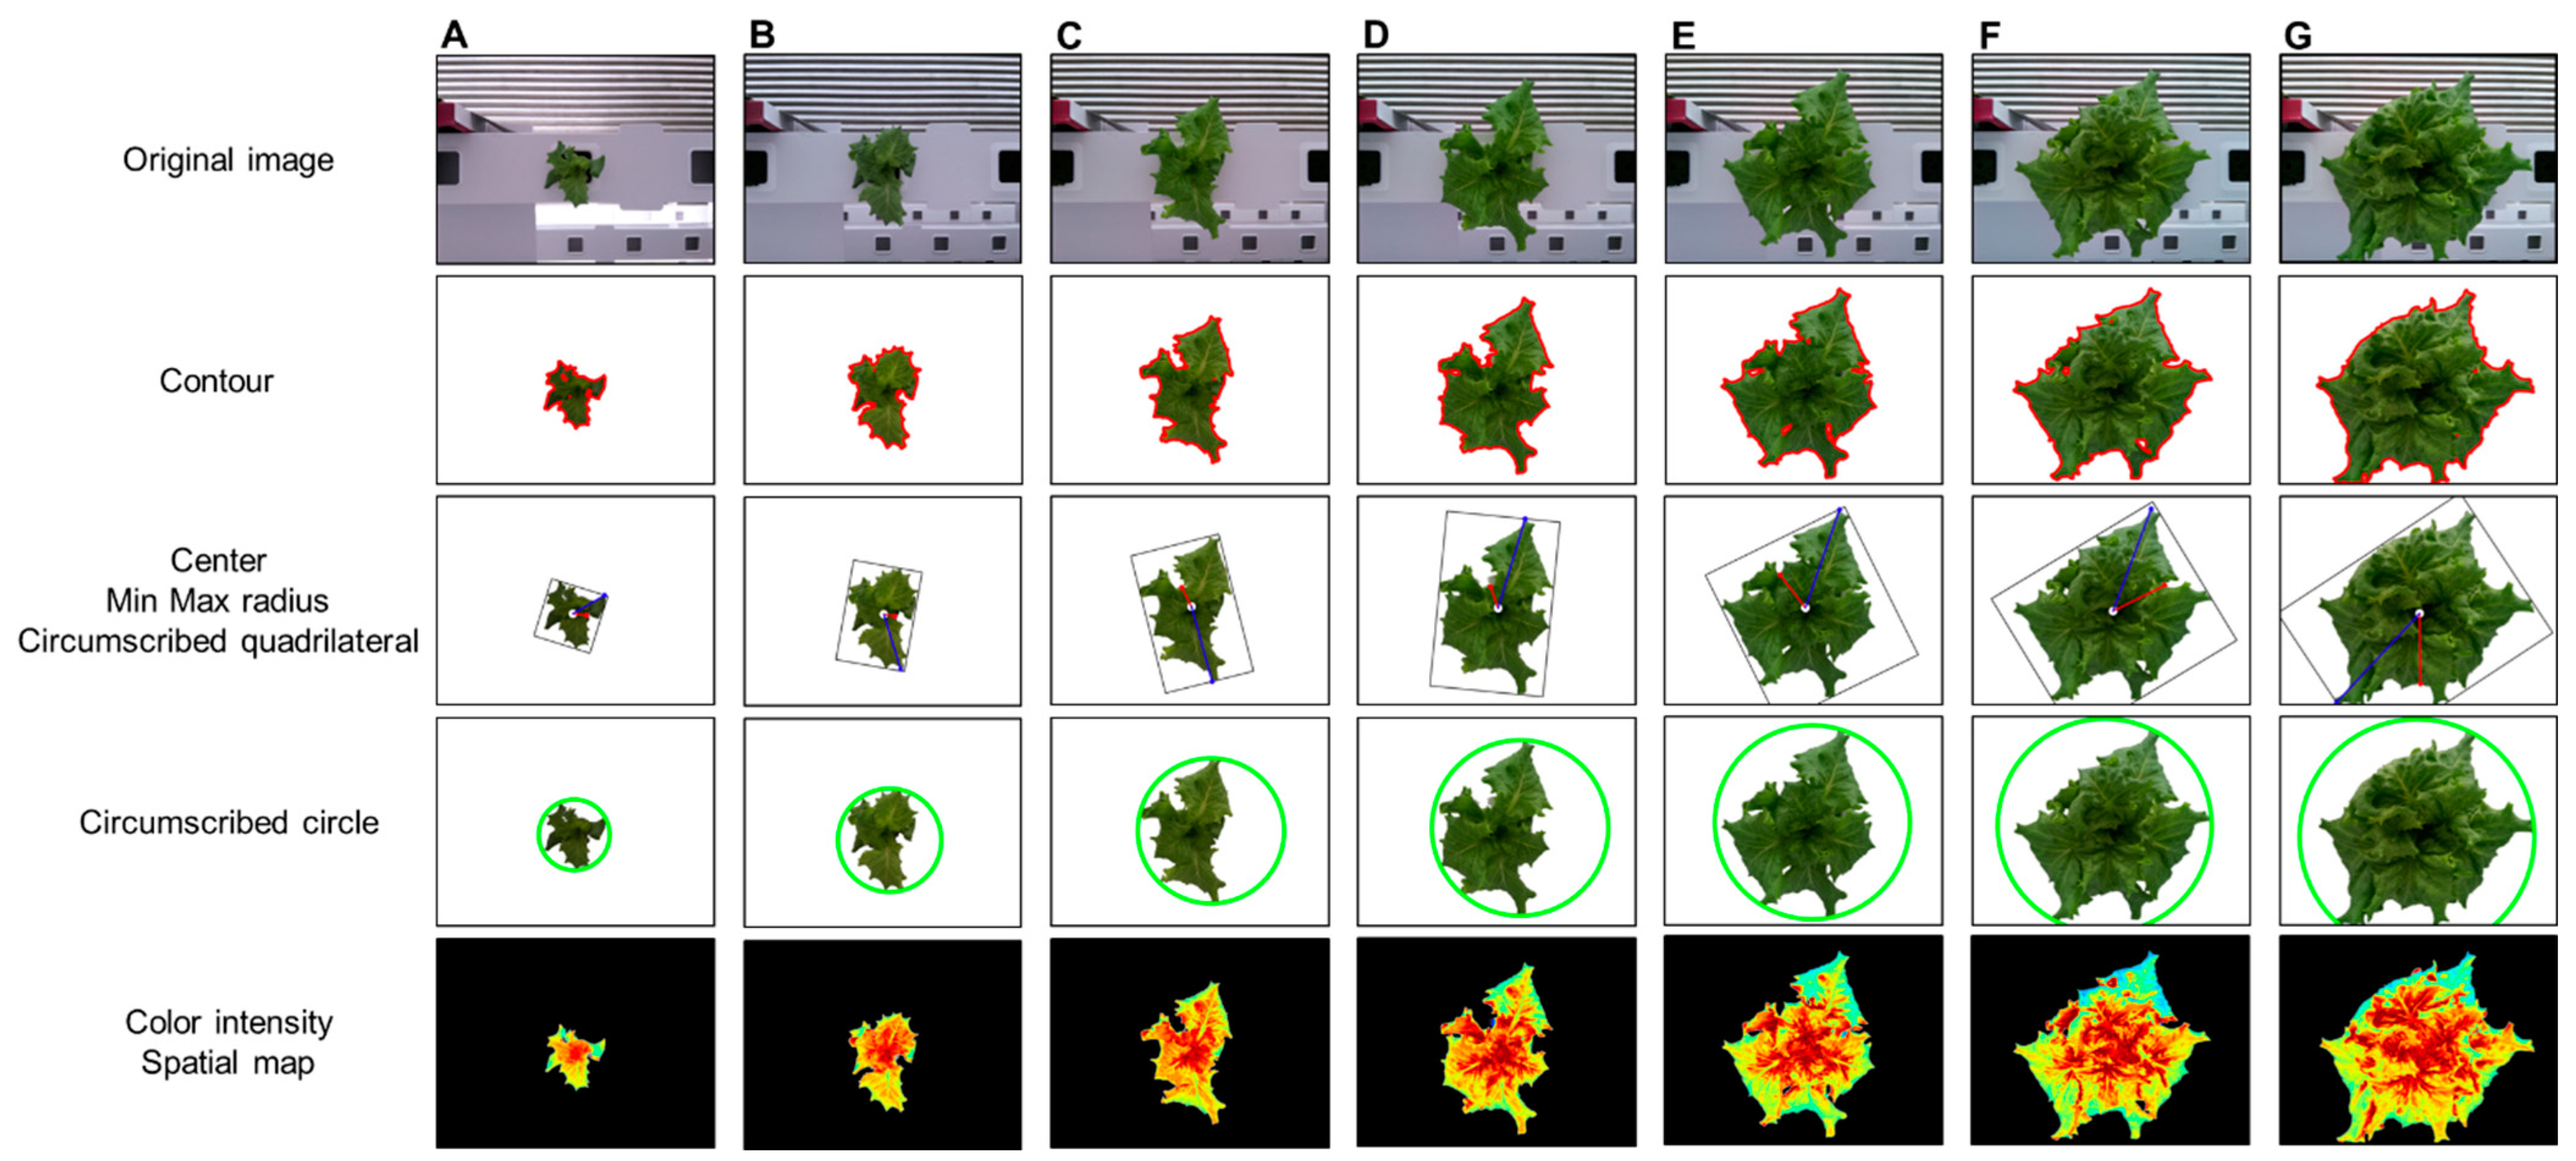
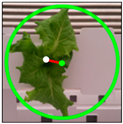
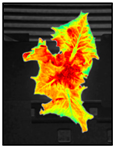
Figure 8 shows the analysis results using the phenotypic indices selected by the developed system for one crop. ROI extraction was performed through background separation, and the phenotypic index was automatically extracted according to a previously defined algorithm. The background was adequately removed using the vegetation index, color system conversion, and additional algorithms and by providing visualization information for all indices such as center, contour, and maximum/minimum radius. As a result of applying the original image and the phenotypic index, the entire growth cycle can be analyzed for approximately two weeks with an interval of two days for the image. This can provide a better understanding of the acquired information, such as the growth level of crops, growth status, and product quality. In addition, it is possible to access the saved analysis result and analyze it in the form of a data frame. In the developed system environment, the data frame can access each index value by using a “key” corresponding to the column, and it is possible to separate data for each crop by specifying a “value” condition of the key. Accordingly, it is possible to analyze individual crops to perform intensive analysis on crops of different growth by location.

Figure 8.
Changes in phenotypic indices according to crop growth: days (A) 1, (B) 3, (C) 5, (D) 7, (E) 9, (F) 11, and (G) 13.
3.2. Growth Analysis for Lettuces under Different Light Conditions
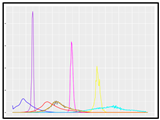
Figure 9 shows the area index changes for the pul group with a change in the photoperiod and for the “con group” with no change. In the pul group, as the light period during image acquisition and the dark period when acquisition was interrupted were short, the data appeared continuously, whereas the con group showed a step-like graph because the dark period was long. The two groups had the same duration of the entire light period; thus, the total number of images acquired in one day was the same, even though there were differences in the acquisition time. That is, the data of the two groups were compared for each day, not for the point value corresponding to the x-axis value of the graph.
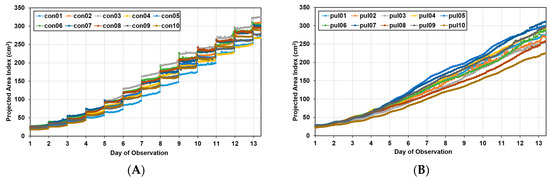
Figure 9.
Growth curves for Batavia lettuces in different light periods: (A) control group (con) and (B) pulse group (pul).
In the growth curve, the growth pattern according to the growth location was different in both groups, indicating that there was spatial variation. Approximately 13 days after transplantation, the maximum area of lettuce was approximately 18% larger than the minimum area in the control group, whereas in the pulse group, it was 38% larger, confirming that the spatial variation was larger in the pulse group.
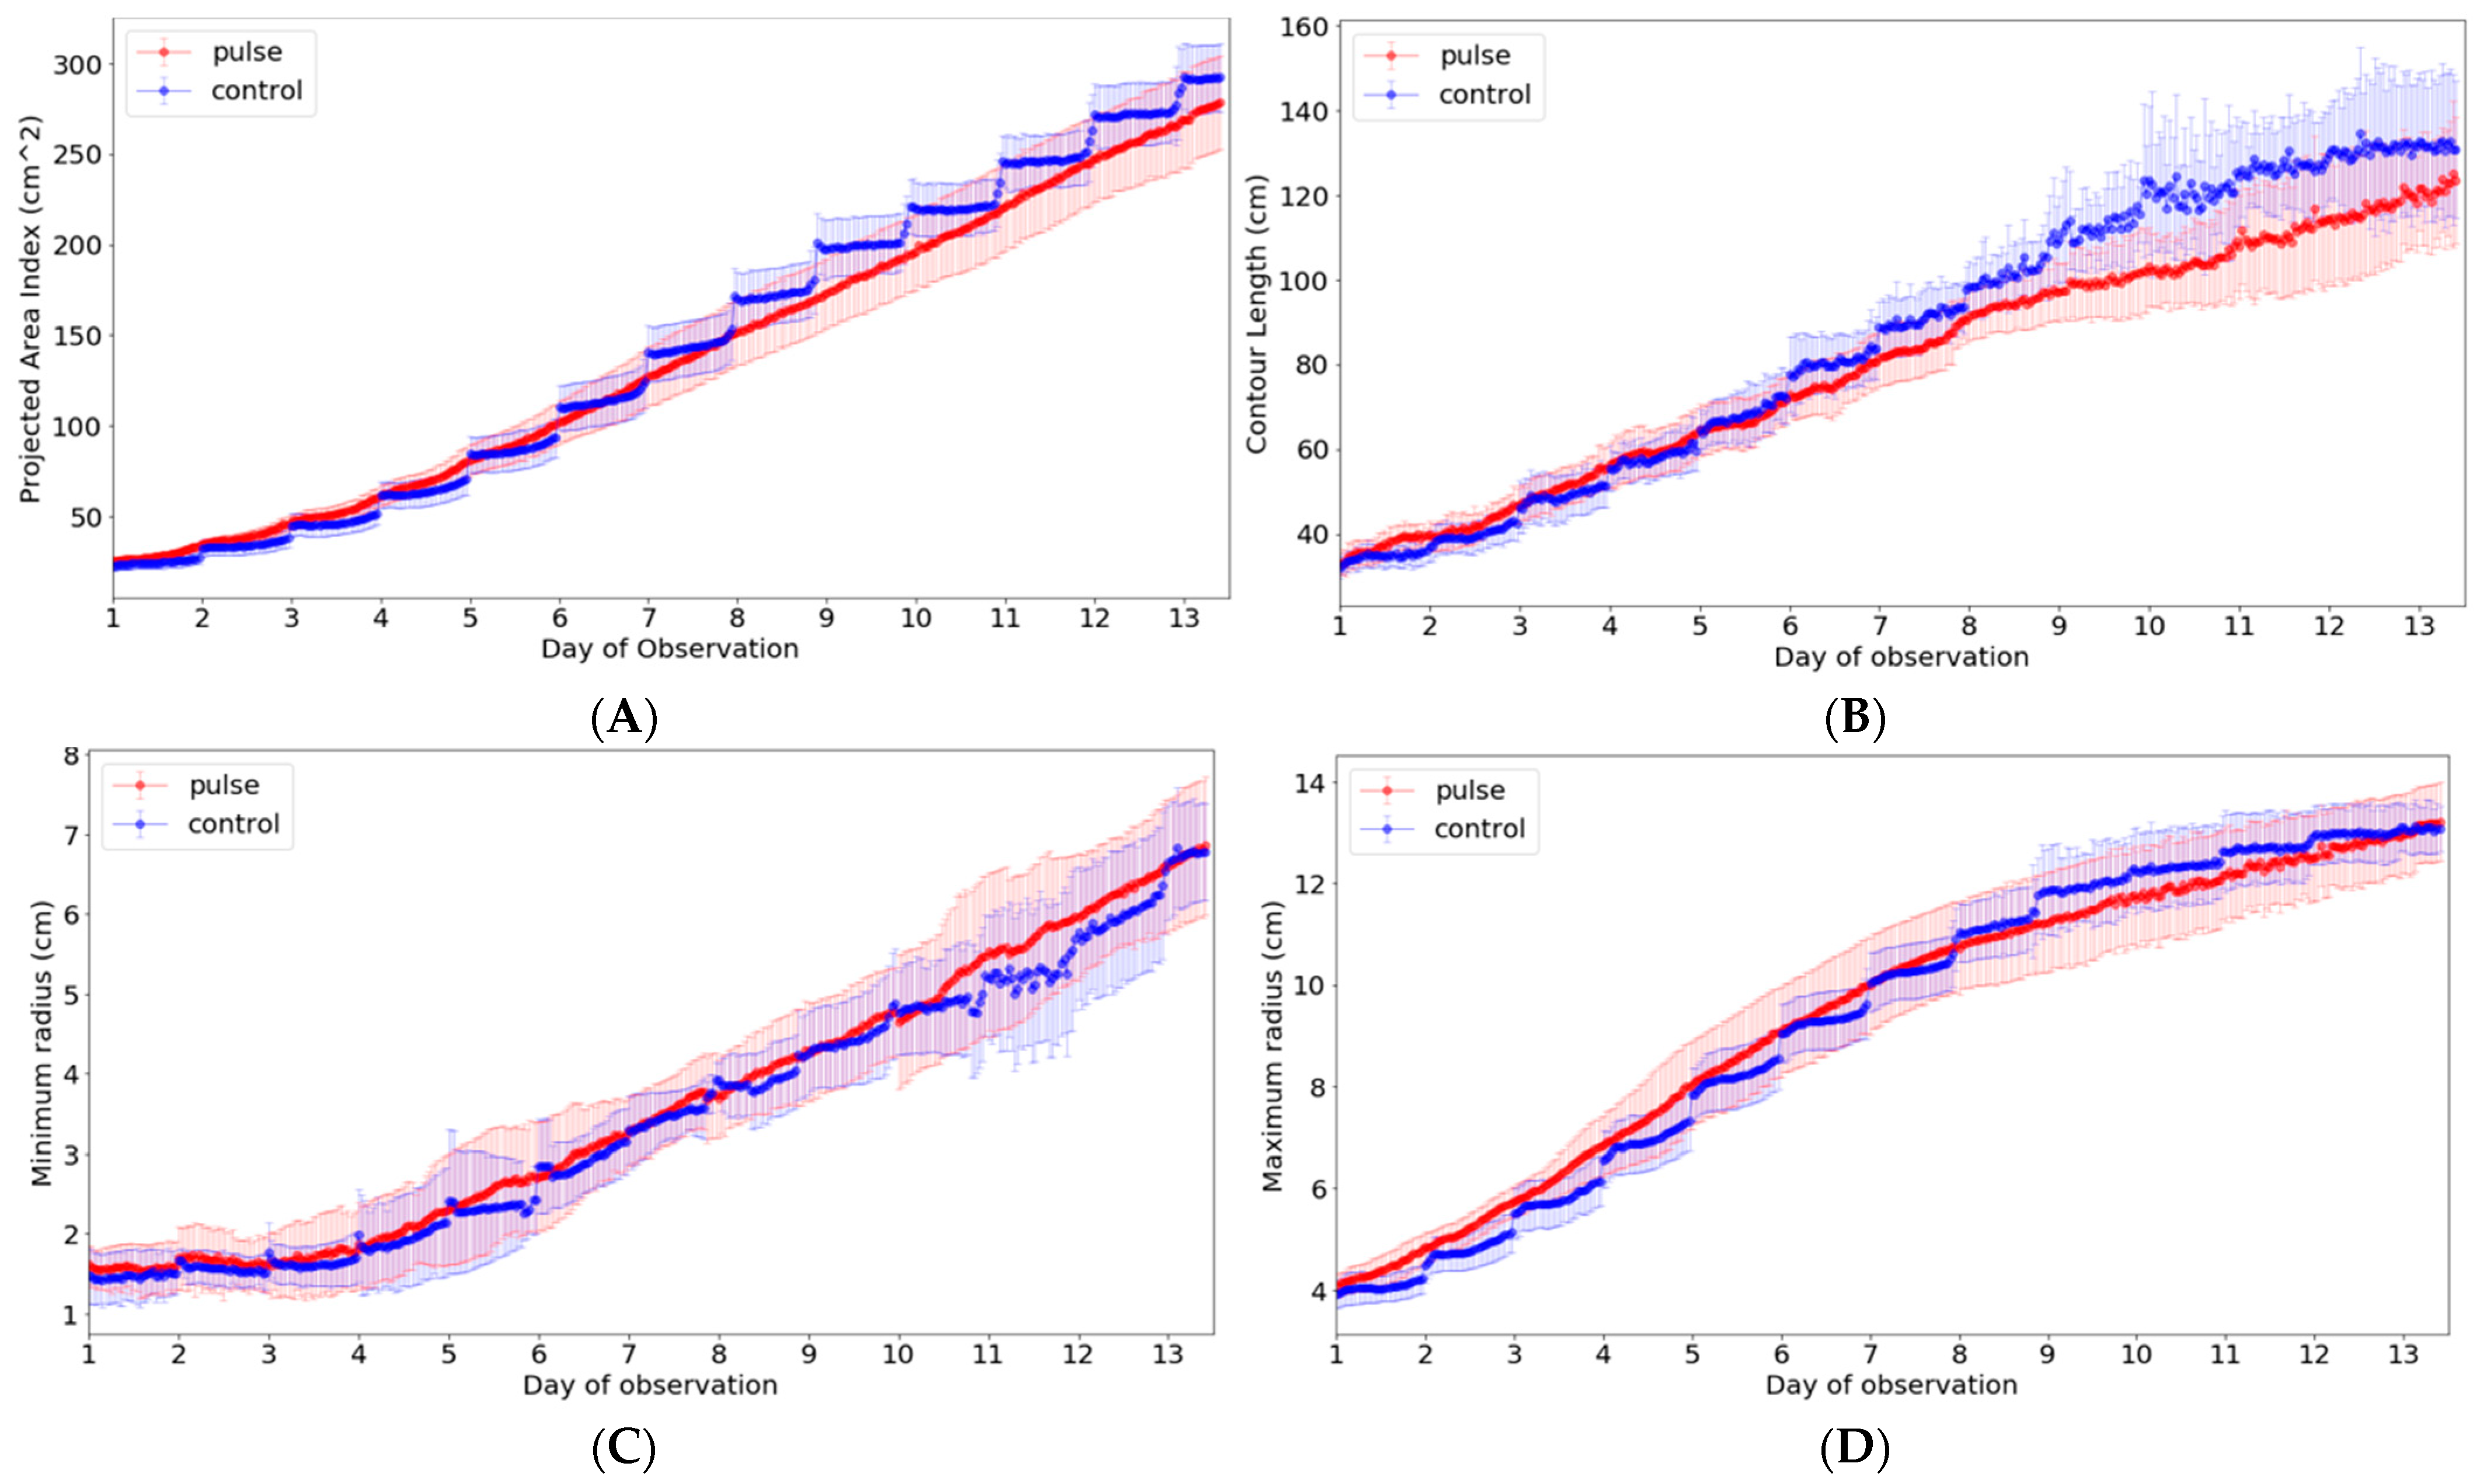
Among the ten phenotypic indices that can be extracted from our system, the indices that can be analyzed meaningfully in light condition experiments include contour, length, minimum radius, and maximum radius in addition to area. These phenotypic indices were closely analyzed to examine the growth difference according to the light period (Figure 10). Thus, a new data frame was created by calculating the average value and standard deviation of each indicator in the developed system interface, and it was expressed as a graph. In the graph, there was no significant difference in the minimum and maximum radius, but the growth was higher in the control group in both area and contour length.

Figure 10.
Analysis of phenotypic indices for Batavia lettuces in different light periods: (A) area, (B) contour length, (C) minimum radius, and (D) maximum length. The colored area indicates the standard deviations.
Figure 10 shows the index change for one crop during the experimental period. As observed, it is possible to monitor the growth status, including the phenotypic indices selected for the crop growth of the entire period, using the developed system. However, based on the indices, additional considerations were identified in the analysis. In the case of the contour, it was possible to find a part showing a difference due to the complexity expressed in the growing process of the crop or the change in the crop shape according to the light/dark period. Accordingly, the maximum length from the center was measured by moving the position according to a specific period rather than a single point according to the passage of time. Although it was shown continuously on the graph, the actual measurement position changed significantly. The minimum length was considerably affected even by slight differences in these morphological characteristics; thus, this index showed the greatest change.
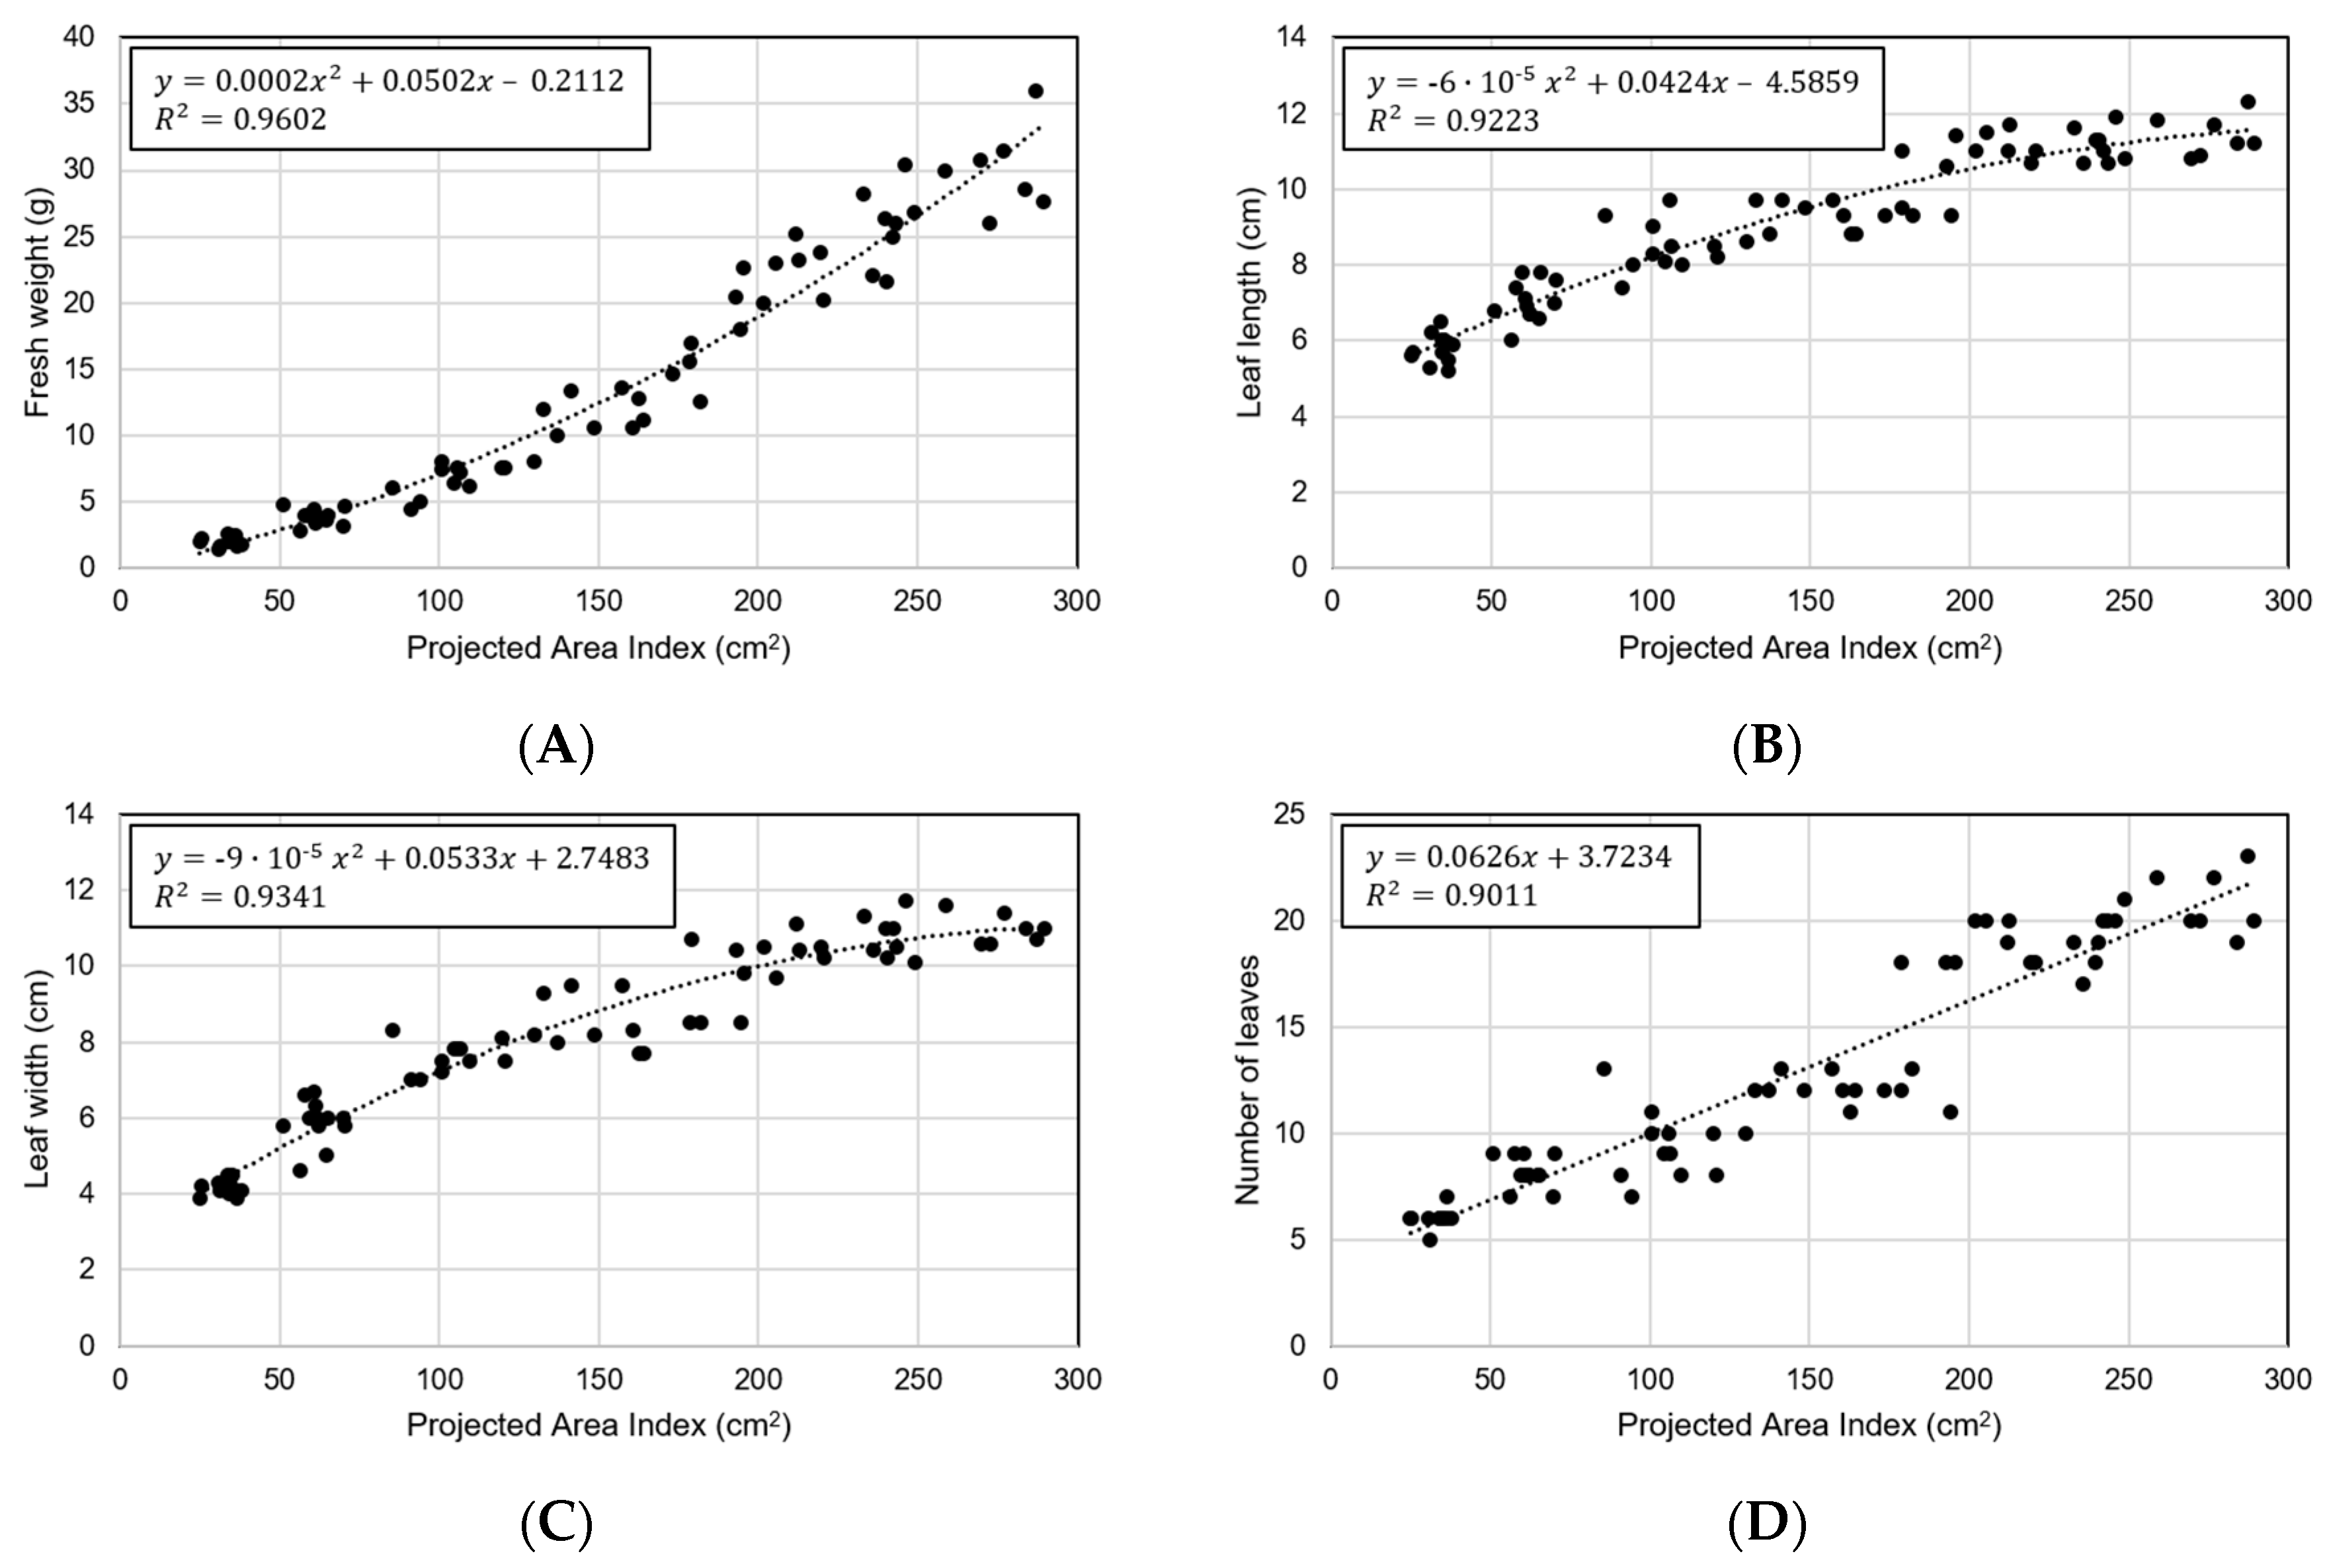
In order to verify the phenotypic index, the analysis was performed using the area index as a representative. Figure 11 shows the results of performing predictions using area index for the four characteristics of manually measured crops. Each regression formula was set to have the highest coefficient of determination. The area index showed the best correlation with fresh weight (R2 = 0.9602 and RMSE = 2.23 g) (Figure 11A). In the early stages of small size, it was small with RMSE = 0.83 g, but it was confirmed that the error also increased as the size increased (Figure 11B–D). A comparison with the other three characteristics showed a low coefficient of determination compared to the fresh weight, and no specific characteristics were found.
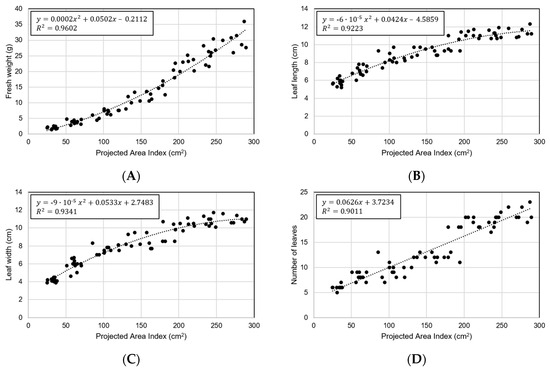
Figure 11.
Predicting crop ground truth data through area index: (A) fresh weight, (B) leaf length, (C) leaf width, and (D) number of leaves.
4. Discussion
Among the phenotypic indices, the area that was the most intuitive index for crop growth was a part of the projected pixel points obtained from the top view. Although the area index would be different from the actual area because the index was calculated based on the top projection image without considering the lateral information, it can be used to provide spatial–temporal information of growing lettuces. Specifically, the site-specific growth monitoring might be feasible for the small number of plants because the variations in growth are displayed from the images for all growth periods [19,42]. In fact, this index enabled us to clearly identify both spatial variation in growth and differences in the photoperiods (Figure 9 and Figure 10). In particular, looking at the control condition graph in Figure 10A, it can be seen that the y-axis value decreases at the beginning of the change from the dark period to the light period, and then it gradually increases thereafter. This is considered to be a phenomenon that occurs because the leaf area is expanded due to the horizontal decrease in the leaf during the dark period [31,43]. It can be seen from the graph that it decreases again as the light period begins, but it gradually increases again with plant growth. Meanwhile, another analysis was possible. Under the experimental conditions, when the light period was twice that of the dark stage, and considering the length of the x-axis expressed in the graph, it can be judged that the growth of the crop mainly occurred during the dark stage (Figure 10A). At the beginning of the experiment, the difference was less than two times, but on day 7, the difference in area was slightly larger. Initially, the control group showed similar or slightly smaller values, but 7 days after planting, it showed a larger value than the pulse group. In fact, even in the destruction data, the group with a change in the photoperiod had poor growth, and the final weight showed a difference of 13.89 g when comparing the average value based on the fresh weight of the above-ground part; thus, it was interpreted that this part was revealed by the area index. The initial hypothesis was that the efficiency could be increased by changing the photoperiod, but it was judged that the efficiency was rather low due to the short light period. The length of the contour was similar to that of the area, indicating a difference between the two groups. However, unlike the area index, where the difference gradually increased, the length of the contour showed an initial large difference, which gradually decreased (Figure 10B). As the crop grew, the edge of the leaf flattened, and the curvature seemed to disappear due to overlapping. Therefore, a different tendency from the continuously increasing area index was observed. In particular, a relatively fast saturation phenomenon was observed in the control group. The minimum and maximum radii from the center were also projected values, and the minimum length index was not suitable for analysis of the photoperiod (Figure 10C,D). This was because the minimum radius showed a large change depending on the growth of new leaves and the effect of the light period. The maximum radius showed a tendency similar to that of the area at the beginning, but with saturation at a relatively early period, and the two groups reached the same value in the second half of the experiment. Unlike the area and contour length indices that could increase in various directions on the image, the maximum radius index could not be measured beyond the measurable range; therefore, this point is shown in the graph. Moreover, researchers or growers can add new phenotypic indices based on the camera network system. Then, the system could be used for building a new phenotyping model by building a new model between the phenotypic indices and plant physiological behaviors such as nutrient deficiencies, diseases, or pests.
When referring to studies relating to fresh weight, it was found that the analysis using the area index extracted from this study has explanatory power, and it can be said that the low error shows the accuracy of the measurement (Figure 11A) [3,44]. Similarly, it was confirmed that the maximum radius index and the contour index had a high coefficient of determination in each leaf length and leaf width (Figure 11B,C). The results show the usefulness of the system for monitoring and determining the phenotypic indices of growing plants.
From the index, the growth of different light/dark cycle were observed and compared. The growth of the pul group was lower than that of the con group, indicating the longer light/dark cycle would be more beneficial for vegetative growth of lettuces. Specifically, lettuce biomass did not change unidirectionally with the extension or shortening of the light/dark cycle, but only specific light/dark cycle can strengthen root growth and water absorption of lettuces [32,45]. Therefore, it is important to find the optimal cycle of the illumination on growing lettuces. The results show the developed system would provide the continuous monitoring of growing lettuces, thereby allowing more effective and rapid analysis on such variables.
Table 3 shows the comparison of the high-throughput plant phenotyping system developed in this study with other existing systems. The most expensive system using a 3D camera array showed a highly accurate measurement performance with a slope of 1.01 and R2 of 0.99 in the comparison with the actual values [46]. The automated growth measurement system using a conveyer also showed a highly linear predictability for the fresh weight, with a slope near 1.0 and R2 of 0.95 [18]. Although the predictability of the developed system is lower than those systems (Figure 11), it is comparable to other systems with R2 of 0.6–0.8 [20,21]. Considering the performance, a total cost of USD 1200 is quite reasonable. The system also can measure various phenotypic characteristics and has a high degree of freedom in analysis compared to other systems. Moreover, the use of other devices might be limited due to their high costs or spatial reasons in densely growing environment such as plant factories. In contrast, the proposed system has excellent space efficiency through a small-sized camera module and a network-based multi-connection protocol. Continuous monitoring of phenotypic indices relating to height, leaf area, volume and biomass are effective parameters that could allow farmers to conduct better fertilizer and water management as well as scheduling of their harvest [47,48]. In plant factories, leafy vegetables are usually harvested when the leaves reach full vegetative growth; thus, it is important to monitor the growth during the vegetative stage. Accordingly, in this paper, lettuce observation was continued from two days after transplantation until the end of the first harvest, and usable phenotypic indices were successfully presented.
Table 3.
Comparison of the camera network system with the on-the-go monitoring system by Jiang, Kim and Cho [18].
From the above results, it is demonstrated that the developed system can be applied to the real-time analysis of growth differences by group for various growth condition changes in plant factories, as well as spatial variation analyses according to the visualization of growth distribution. In future research, we will improve the measurement performance of the system by adding a side-view camera to collect information about crop height and areas that cannot be observed from the top view. In particular, we intend to apply a machine learning algorithm to the various phenotypic indices collected from the system to understand more complex crop-growth information and to develop a web-based interface, such that users can freely select and modify functions for each process.
5. Conclusions
In this study, we developed an analysis system for high-speed mass phenotyping based on a multi-point camera network using low-cost cameras and processor boards. To ensure its applicability to various cultivation structures and environments, a server computer was configured for several image collection modules to automatically import data from multiple points. Transmission stabilization conditions were applied for data collection stability, and a large amount of image information was transmitted from the local to the main server at daily intervals. When the transmission was completed, an ROI image was obtained through background separation, and 10 phenotypic indices were calculated using an image processing algorithm. The processing time of approximately 2.43 s per image confirmed the real-time analysis performance of the developed system. By applying the system to a commercial plant factory environment, it was possible to determine the growth distribution information and the influence of the growth environment for each individual based on various phenotypic indices through the data frame, confirming its feasible application. The projected area index-based estimation for fresh weight, leaf length, leaf width, and the number of leaves shows a high R2 over than 0.9, indicating the system would be feasible for monitoring the growth information of growing lettuces. In addition, the high scalability of easily removing or adding programming parts through modularization of the calculation and analysis structure of the phenotypic index can be useful for growers or researchers who are concerned. In future research, we intend to introduce a side-view camera for crop height analysis and strengthen the field usability by adding machine learning algorithms. Overall, the developed system is expected to effectively help crop-growth management, as it can respond to changes in the dense plant factory cultivation environment and structural changes through low-cost camera installation and network connection configuration.
Author Contributions
Conceptualization, M.Y.; methodology, M.Y. and W.-J.C.; software, M.Y. and W.-J.C.; validation, M.Y.; formal analysis, M.Y. and W.-J.C.; writing—original draft preparation, M.Y. and W.-J.C.; writing—review and editing, M.Y. and W.-J.C.; visualization, M.Y. and W.-J.C.; supervision, M.Y.; project administration, M.Y.; funding acquisition, M.Y. All authors have read and agreed to the published version of the manuscript.
Funding
This work was supported by the National Research Foundation of Korea (NRF) grant funded by the Korea government (MSIT) (No. 2022R1C1C2005959), and the Technology development Program funded by the Ministry of SMEs and Startups (G21S325921401).
Institutional Review Board Statement
Not applicable.
Data Availability Statement
The data and code used in this study are available from the corresponding author upon request.
Acknowledgments
The authors would like to thank n.thing Inc. Republic of Korea for providing a container-type vertical farm.
Conflicts of Interest
The funders had no role in the design of the study; in the collection, analyses, or interpretation of data; in the writing of the manuscript; or in the decision to publish the results.
References
- Li, L.; Zhang, Q.; Huang, D. A review of imaging techniques for plant phenotyping. Sensors 2014, 14, 20078–20111. [Google Scholar] [CrossRef] [PubMed]
- Chen, D.; Neumann, K.; Friedel, S.; Kilian, B.; Chen, M.; Altmann, T.; Klukas, C. Dissecting the Phenotypic Components of Crop Plant Growth and Drought Responses Based on High-Throughput Image Analysis. Plant Cell 2014, 26, 4636–4655. [Google Scholar] [CrossRef]
- Chen, W.-T.; Yeh, Y.-H.F.; Liu, T.-Y.; Lin, T.-T. An automated and continuous plant weight measurement system for plant factory. Front. Plant Sci. 2016, 7, 392. [Google Scholar] [CrossRef]
- Fahlgren, N.; Gehan, M.A.; Baxter, I. Lights, camera, action: High-throughput plant phenotyping is ready for a close-up. Curr. Opin. Plant Biol. 2015, 24, 93–99. [Google Scholar] [CrossRef]
- Kacira, M.; Ling, P. Design and development of an automated and Non–contact sensing system for continuous monitoring of plant health and growth. Trans. ASABE 2001, 44, 989. [Google Scholar] [CrossRef]
- Sonnentag, O.; Hufkens, K.; Teshera-Sterne, C.; Young, A.M.; Friedl, M.; Braswell, B.H.; Milliman, T.; O’Keefe, J.; Richardson, A.D. Digital repeat photography for phenological research in forest ecosystems. Agric. Meteorol. 2012, 152, 159–177. [Google Scholar] [CrossRef]
- Jiang, Y.; Li, C.; Paterson, A.H. High throughput phenotyping of cotton plant height using depth images under field conditions. Comput. Electron. Agric. 2016, 130, 57–68. [Google Scholar] [CrossRef]
- Barker III, J.; Zhang, N.; Sharon, J.; Steeves, R.; Wang, X.; Wei, Y.; Poland, J. Development of a field-based high-throughput mobile phenotyping platform. Comput. Electron. Agric. 2016, 122, 74–85. [Google Scholar] [CrossRef]
- Ge, Y.; Bai, G.; Stoerger, V.; Schnable, J.C. Temporal dynamics of maize plant growth, water use, and leaf water content using automated high throughput RGB and hyperspectral imaging. Comput. Electron. Agric. 2016, 127, 625–632. [Google Scholar] [CrossRef]
- Naik, H.S.; Zhang, J.; Lofquist, A.; Assefa, T.; Sarkar, S.; Ackerman, D.; Singh, A.; Singh, A.K.; Ganapathysubramanian, B. A real-time phenotyping framework using machine learning for plant stress severity rating in soybean. Plant Methods 2017, 13, 23. [Google Scholar] [CrossRef]
- Granier, C.; Aguirrezabal, L.; Chenu, K.; Cookson, S.J.; Dauzat, M.; Hamard, P.; Thioux, J.J.; Rolland, G.; Bouchier-Combaud, S.; Lebaudy, A. PHENOPSIS, an automated platform for reproducible phenotyping of plant responses to soil water deficit in Arabidopsis thaliana permitted the identification of an accession with low sensitivity to soil water deficit. New Phytol. 2006, 169, 623–635. [Google Scholar] [CrossRef] [PubMed]
- Tisné, S.; Serrand, Y.; Bach, L.; Gilbault, E.; Ben Ameur, R.; Balasse, H.; Voisin, R.; Bouchez, D.; Durand-Tardif, M.; Guerche, P. Phenoscope: An automated large-scale phenotyping platform offering high spatial homogeneity. Plant J. 2013, 74, 534–544. [Google Scholar] [CrossRef] [PubMed]
- Hartmann, A.; Czauderna, T.; Hoffmann, R.; Stein, N.; Schreiber, F. HTPheno: An image analysis pipeline for high-throughput plant phenotyping. BMC Bioinform. 2011, 12, 148. [Google Scholar] [CrossRef] [PubMed]
- Shankar, T.; Malik, G.C.; Banerjee, M.; Dutta, S.; Praharaj, S.; Lalichetti, S.; Mohanty, S.; Bhattacharyay, D.; Maitra, S.; Gaber, A. Prediction of the effect of nutrients on plant parameters of rice by artificial neural network. Agronomy 2022, 12, 2123. [Google Scholar] [CrossRef]
- Joo, H.-J.; Jeong, H.-Y. Growth analysis system for IT-based plant factory. Multimed. Tools Appl. 2017, 76, 17785–17799. [Google Scholar] [CrossRef]
- Kang, W.H.; Zhang, F.; Lee, J.W.; Son, J.E. Improvement of canopy light distribution, photosynthesis, and growth of lettuce (Lactuca sativa L.) in plant factory conditions by using filters to diffuse light from LEDs. Hortic. Sci. Technol. 2016, 34, 84–93. [Google Scholar] [CrossRef]
- Moriyuki, S.; Fukuda, H. High-Throughput Growth Prediction for Lactuca sativa L. Seedlings Using Chlorophyll Fluorescence in a Plant Factory with Artificial Lighting. Front. Plant Sci. 2016, 7, 394. [Google Scholar] [CrossRef]
- Jiang, J.-s.; Kim, H.-J.; Cho, W.-J. On-the-go image processing system for spatial mapping of lettuce fresh weight in plant factory. IFAC-Pap. 2018, 51, 130–134. [Google Scholar] [CrossRef]
- Yeh, Y.-H.F.; Lai, T.-C.; Liu, T.-Y.; Liu, C.-C.; Chung, W.-C.; Lin, T.-T. An automated growth measurement system for leafy vegetables. Biosyst. Eng. 2014, 117, 43–50. [Google Scholar] [CrossRef]
- Rossi, R.; Leolini, C.; Costafreda-Aumedes, S.; Leolini, L.; Bindi, M.; Zaldei, A.; Moriondo, M. Performances Evaluation of a Low-Cost Platform for High-Resolution Plant Phenotyping. Sensors 2020, 20, 3150. [Google Scholar] [CrossRef]
- Yassue, R.M.; Galli, G.; Borsato, R., Jr.; Cheng, H.; Morota, G.; Fritsche-Neto, R. A low-cost greenhouse-based high-throughput phenotyping platform for genetic studies: A case study in maize under inoculation with plant growth-promoting bacteria. Plant Phenome J. 2022, 5, e20043. [Google Scholar] [CrossRef]
- Bari, M.A.A.; Fonseka, D.; Stenger, J.; Zitnick-Anderson, K.; Atanda, S.A.; Morales, M.; Worral, H.; Piche, L.; Kim, J.; Johnson, J. A greenhouse-based high-throughput phenotyping platform for identification and genetic dissection of resistance to Aphanomyces root rot in field pea. Plant Phenome J. 2023, 6, e20063. [Google Scholar] [CrossRef]
- An, N.; Palmer, C.M.; Baker, R.L.; Markelz, R.J.C.; Ta, J.; Covington, M.F.; Maloof, J.N.; Welch, S.M.; Weinig, C. Plant high-throughput phenotyping using photogrammetry and imaging techniques to measure leaf length and rosette area. Comput. Electron. Agric. 2016, 127, 376–394. [Google Scholar] [CrossRef]
- Thrash, T.; Lee, H.; Baker, R.L. A low-cost high-throughput phenotyping system for automatically quantifying foliar area and greenness. Appl. Plant Sci. 2022, 10, e11502. [Google Scholar] [CrossRef]
- Gang, M.-S.; Kim, H.-J.; Kim, D.-W. Estimation of Greenhouse Lettuce Growth Indices Based on a Two-Stage CNN Using RGB-D Images. Sensors 2022, 22, 5499. [Google Scholar] [CrossRef]
- Kozai, T. Current status of plant factories with artificial lighting (PFALs) and smart PFALs. In Smart Plant Factory: The Next Generation Indoor Vertical Farms; Springer: Singapore, 2018; pp. 3–13. [Google Scholar]
- Coelho, A.F.S.; Gomes, É.P.; Sousa, A.d.P.; Glória, M.B.A. Effect of irrigation level on yield and bioactive amine content of American lettuce. J. Sci. Food Agric. 2005, 85, 1026–1032. [Google Scholar] [CrossRef]
- Liu, Z.; Xu, Q. An Automatic Irrigation Control System for Soilless Culture of Lettuce. Water 2018, 10, 1692. [Google Scholar] [CrossRef]
- Wortman, S.E. Crop physiological response to nutrient solution electrical conductivity and pH in an ebb-and-flow hydroponic system. Sci. Hortic. 2015, 194, 34–42. [Google Scholar] [CrossRef]
- Shao, M.; Liu, W.; Zha, L.; Zhou, C.; Zhang, Y.; Li, B. Altering light–dark cycle at pre-harvest stage regulated growth, nutritional quality, and photosynthetic pigment content of hydroponic lettuce. Acta Physiol. Plant. 2021, 43, 9. [Google Scholar] [CrossRef]
- Fricke, W. Night-time transpiration–favouring growth? Trends Plant Sci. 2019, 24, 311–317. [Google Scholar] [CrossRef]
- Chen, X.-l.; Yang, Q.-c. Effects of intermittent light exposure with red and blue light emitting diodes on growth and carbohydrate accumulation of lettuce. Sci. Hortic. 2018, 234, 220–226. [Google Scholar] [CrossRef]
- Ma, X.; Zhu, K.; Guan, H.; Feng, J.; Yu, S.; Liu, G. High-throughput phenotyping analysis of potted soybean plants using colorized depth images based on a proximal platform. Remote Sens. 2019, 11, 1085. [Google Scholar] [CrossRef]
- Sinoquet, H.; Thanisawanyangkura, S.; Mabrouk, H.; Kasemsap, P. Characterization of the light environment in canopies using 3D digitising and image processing. Ann. Bot. 1998, 82, 203–212. [Google Scholar] [CrossRef]
- Riehle, D.; Reiser, D.; Griepentrog, H.W. Robust index-based semantic plant/background segmentation for RGB-images. Comput. Electron. Agric. 2020, 169, 105201. [Google Scholar] [CrossRef]
- Woebbecke, D.M.; Meyer, G.E.; Von Bargen, K.; Mortensen, D. Color indices for weed identification under various soil, residue, and lighting conditions. Trans. ASAE 1995, 38, 259–269. [Google Scholar] [CrossRef]
- Hassanein, M.; Lari, Z.; El-Sheimy, N. A New Vegetation Segmentation Approach for Cropped Fields Based on Threshold Detection from Hue Histograms. Sensors 2018, 18, 1253. [Google Scholar] [CrossRef] [PubMed]
- Jiao, Y.; Luo, R.; Li, Q.; Deng, X.; Yin, X.; Ruan, C.; Jia, W. Detection and Localization of Overlapped Fruits Application in an Apple Harvesting Robot. Electronics 2020, 9, 1023. [Google Scholar] [CrossRef]
- Sibiya, M.; Sumbwanyambe, M. An Algorithm for Severity Estimation of Plant Leaf Diseases by the Use of Colour Threshold Image Segmentation and Fuzzy Logic Inference: A Proposed Algorithm to Update a “Leaf Doctor” Application. AgriEngineering 2019, 1, 205–219. [Google Scholar] [CrossRef]
- Upadhyaya, H.D.; Ortiz, R.; Bramel, P.J.; Singh, S. Phenotypic diversity for morphological and agronomic characteristics in chickpea core collection. Euphytica 2002, 123, 333–342. [Google Scholar] [CrossRef]
- Li, D.; Li, C.; Yao, Y.; Li, M.; Liu, L. Modern imaging techniques in plant nutrition analysis: A review. Comput. Electron. Agric. 2020, 174, 105459. [Google Scholar] [CrossRef]
- Lee, U.; Chang, S.; Putra, G.A.; Kim, H.; Kim, D.H. An automated, high-throughput plant phenotyping system using machine learning-based plant segmentation and image analysis. PLoS ONE 2018, 13, e0196615. [Google Scholar] [CrossRef]
- Zweifel, R.; Sterck, F.; Braun, S.; Buchmann, N.; Eugster, W.; Gessler, A.; Häni, M.; Peters, R.L.; Walthert, L.; Wilhelm, M.; et al. Why trees grow at night. New Phytol. 2021, 231, 2174–2185. [Google Scholar] [CrossRef]
- Jung, D.-H.; Park, S.H.; Han, X.Z.; Kim, H.-J. Image processing methods for measurement of lettuce fresh weight. J. Biosyst. Eng. 2015, 40, 89–93. [Google Scholar] [CrossRef]
- Chen, X.-l.; Li, Y.-l.; Wang, L.-c.; Yang, Q.-c.; Guo, W.-z. Responses of butter leaf lettuce to mixed red and blue light with extended light/dark cycle period. Sci. Rep. 2022, 12, 6924. [Google Scholar] [CrossRef] [PubMed]
- An, N.; Welch, S.M.; Markelz, R.J.C.; Baker, R.L.; Palmer, C.M.; Ta, J.; Maloof, J.N.; Weinig, C. Quantifying time-series of leaf morphology using 2D and 3D photogrammetry methods for high-throughput plant phenotyping. Comput. Electron. Agric. 2017, 135, 222–232. [Google Scholar] [CrossRef]
- Buelvas, R.M.; Adamchuk, V.I.; Leksono, E.; Tikasz, P.; Lefsrud, M.; Holoszkiewicz, J. Biomass estimation from canopy measurements for leafy vegetables based on ultrasonic and laser sensors. Comput. Electron. Agric. 2019, 164, 104896. [Google Scholar] [CrossRef]
- Hu, Y.; Wang, L.; Xiang, L.; Wu, Q.; Jiang, H. Automatic Non-Destructive Growth Measurement of Leafy Vegetables Based on Kinect. Sensors 2018, 18, 806. [Google Scholar] [CrossRef] [PubMed]


Disclaimer/Publisher’s Note: The statements, opinions and data contained in all publications are solely those of the individual author(s) and contributor(s) and not of MDPI and/or the editor(s). MDPI and/or the editor(s) disclaim responsibility for any injury to people or property resulting from any ideas, methods, instructions or products referred to in the content. |
© 2023 by the authors. Licensee MDPI, Basel, Switzerland. This article is an open access article distributed under the terms and conditions of the Creative Commons Attribution (CC BY) license (https://creativecommons.org/licenses/by/4.0/).