Article

Climate-Induced Risk Assessment of Rural and Urban Agroforestry Managers of Aizawl District, Northeast India

1
Department of Forestry, Mizoram University, Aizawl 796004, India
2
Faculty of Agriculture, University of Life Sciences “King Mihai I”, 300645 Timisoara, Romania
3
Department of Agronomy, Faculty of Agriculture and Biotechnology, Bydgoszcz University of Science and Technology, Al. Prof. S. Kaliskiego 7, 85-796 Bydgoszcz, Poland
*
Authors to whom correspondence should be addressed.
Agriculture 2023, 13(10), 2013; https://doi.org/10.3390/agriculture13102013
Submission received: 2 September 2023 / Revised: 13 October 2023 / Accepted: 16 October 2023 / Published: 17 October 2023

Abstract

:
Climate change exerts a substantial influence on global livelihood security. This research aims to elucidate the risk faced by agroforestry managers of urban and rural areas. Adhering to the IPCC risk framework, we structured the experimental design and adopted an indicator-based methodology to delineate the risk dimensions. Altogether, 105 households from 7 villages in Aizawl district, Mizoram, India, were considered for the study. For indicator identification, we conducted a comprehensive literature review and subsequently employed principal component analysis to select relevant indicators. Finally, risk was determined using the index value of hazard, exposure, and vulnerability. Additionally, we also developed a regression model and integrated it into ArcGIS to generate a spatial risk map. Out of 69 indicators identified, 52 were selected for final assessment after PCA analysis. Our findings underscore the higher susceptibility of urban agroforestry managers to climate change which was in agreement to our hypothesis that the risk index of agroforestry households increases with altitude while it decreases with the distance from Aizawl headquarter. Furthermore, we observed that households residing at higher altitudes exhibit greater vulnerability. Key determinants contributing to elevated risk in the region encompass land ownership constraints, diminished yields, traditional farming practices with no institutional help, and a dearth of available labour resources. The study advocates the implementation of climate smart agroforestry practices integrated with agricultural credit schemes and an educational policy designed to enrol dropout youths.

1. Introduction

Climate change is one of the most significant environmental and social challenges that humanity faces today. Climate change parameters such as, changing weather patterns, an increased frequency of extreme weather events, and rising temperatures, have led to reduced crop yields, crop failures, a loss of livestock, and increased soil erosion [1,2,3,4]. In Northeast India (NEI), this change in climate poses a significant risk to the agriculture and agroforestry sectors, which form the backbone of the region’s economy [5]. This part of the country is also home to a large number of both urban and rural farmers who are highly dependent on agroforestry land use for their livelihoods. Climate change, along with the increasing frequency and intensity of abnormal weather events, exacerbates the vulnerabilities faced by the farmers as it has significant implications for food security, poverty, and overall sustainable development in the region [6,7,8].
The Intergovernmental Panel on Climate Change (IPCC) emphasizes the importance of understanding and assessing climate risks to develop appropriate adaptation and mitigation strategies. This paper followed the present IPCC [9] risk concept by segregating exposure from vulnerability estimation. Climate risk is a function of three dimensions: hazard, exposure, and vulnerability. It is the outcome of the interplay between climate-related hazards with the exposure and vulnerability of both human and natural systems. According to the Fifth Assessment Report of the IPCC (AR5), hazard refers to ‘the potential occurrence of a natural or human-induced physical event or trend or physical impact that may cause loss of life, injury, or other health impacts, as well as damage and loss of property, infrastructure, livelihoods, service provision, ecosystem and environmental resources. Exposure is ‘the presence of people, livelihoods, species or ecosystems, environmental functions, services and resources, infrastructure, or economic, social, or cultural assets in places and settings that could be adversely affected’ while, vulnerability is ‘the propensity or predisposition to be adversely affected’. It depends on both the sensitivity and the capacity of the system to adapt to climate variability and change [10]. Data of these three dimensions can be a mixture of spatial and socio-economic indicators or of socioeconomic indicators alone [11,12].
Not all indicators are equally important in determining vulnerability, and some may be more relevant to certain regions or communities than others [13]. For instance, the variations in capacity serve as a contributing factor to why communities facing similar levels of exposure may experience different impacts from a particular hazard [14]. And therefore, indicators are selected based on either theoretical understandings of their association to vulnerability or based on statistical relationships [15]. This paper utilizes the Shannon entropy method (SEM) for determining the weights of each indicator for every component. Other weighing methods used in vulnerability and risk assessment studies are the equal weight method [16], spatial principal component analysis [17], and the analytical hierarchy process [18]. However, SEM has the advantage of being feasible [19] and ensures that the weights assigned are proportional to the degree of diversity or variability among the criteria, which help prevents biases or inconsistencies in the decision-making process.
Climate change poses multiple threats to rural and urban agroforestry farmers. Rural farmers are often exposed to natural disasters and less accessible to resources and infrastructure [20,21]. Urban areas, while generally better equipped, still face challenges such as heatwaves and rapid urbanization [22]. It is crucial to understand the association between urban and rural areas with altitude and agglomeration for comprehending the geographical distribution of human settlements and their vulnerability to climate change impacts. Communities inhabiting high-altitude areas are deemed susceptible to climate change due to their exposure to early signs of climate change, the sensitivity of local resources, and limited access to adaptive measures [23]. Additionally, the Aizawl District Management Plan [24] identified high incidents of hazards such as landslide, earthquake, wind and cyclones, and flood to be decreasing from Aizawl headquarter further south towards Aibawk block.
The study of climate-induced risks in agroforestry is of paramount importance in the face of a changing climate. While traditionally, rural agroforestry farmers have been at the forefront of climate vulnerability and risk assessments [25,26,27], it is equally imperative to extend this scrutiny to urban agroforestry managers. Climate change affects both rural and urban environments, and understanding the unique challenges faced by the agroforestry managers in these areas is essential for effective mitigation and adaptation strategies [28]. Furthermore, it is also necessary to address if change in the altitude and distance of agroforestry households from Aizawl headquarter is associated with their risk index, based on which we hypothesised that the risk index of agroforestry households increases with altitude while it decreases with the distance from Aizawl headquarter. The current research is essential for a holistic understanding of climate-induced risks to ensure comprehensive resilience strategies that address the diverse needs of urban and rural agroforestry, knowledge sharing for more effective and climate-resilient agroforestry practices, and inclusive policies that can better equip managers to adapt to the challenges posed by the changing climate [29,30,31]. Therefore, the objective of this study is to investigate the influence of distance from Aizawl headquarter on the climate-induced risk of agroforestry households in Aizawl district.

2. Materials and Methods

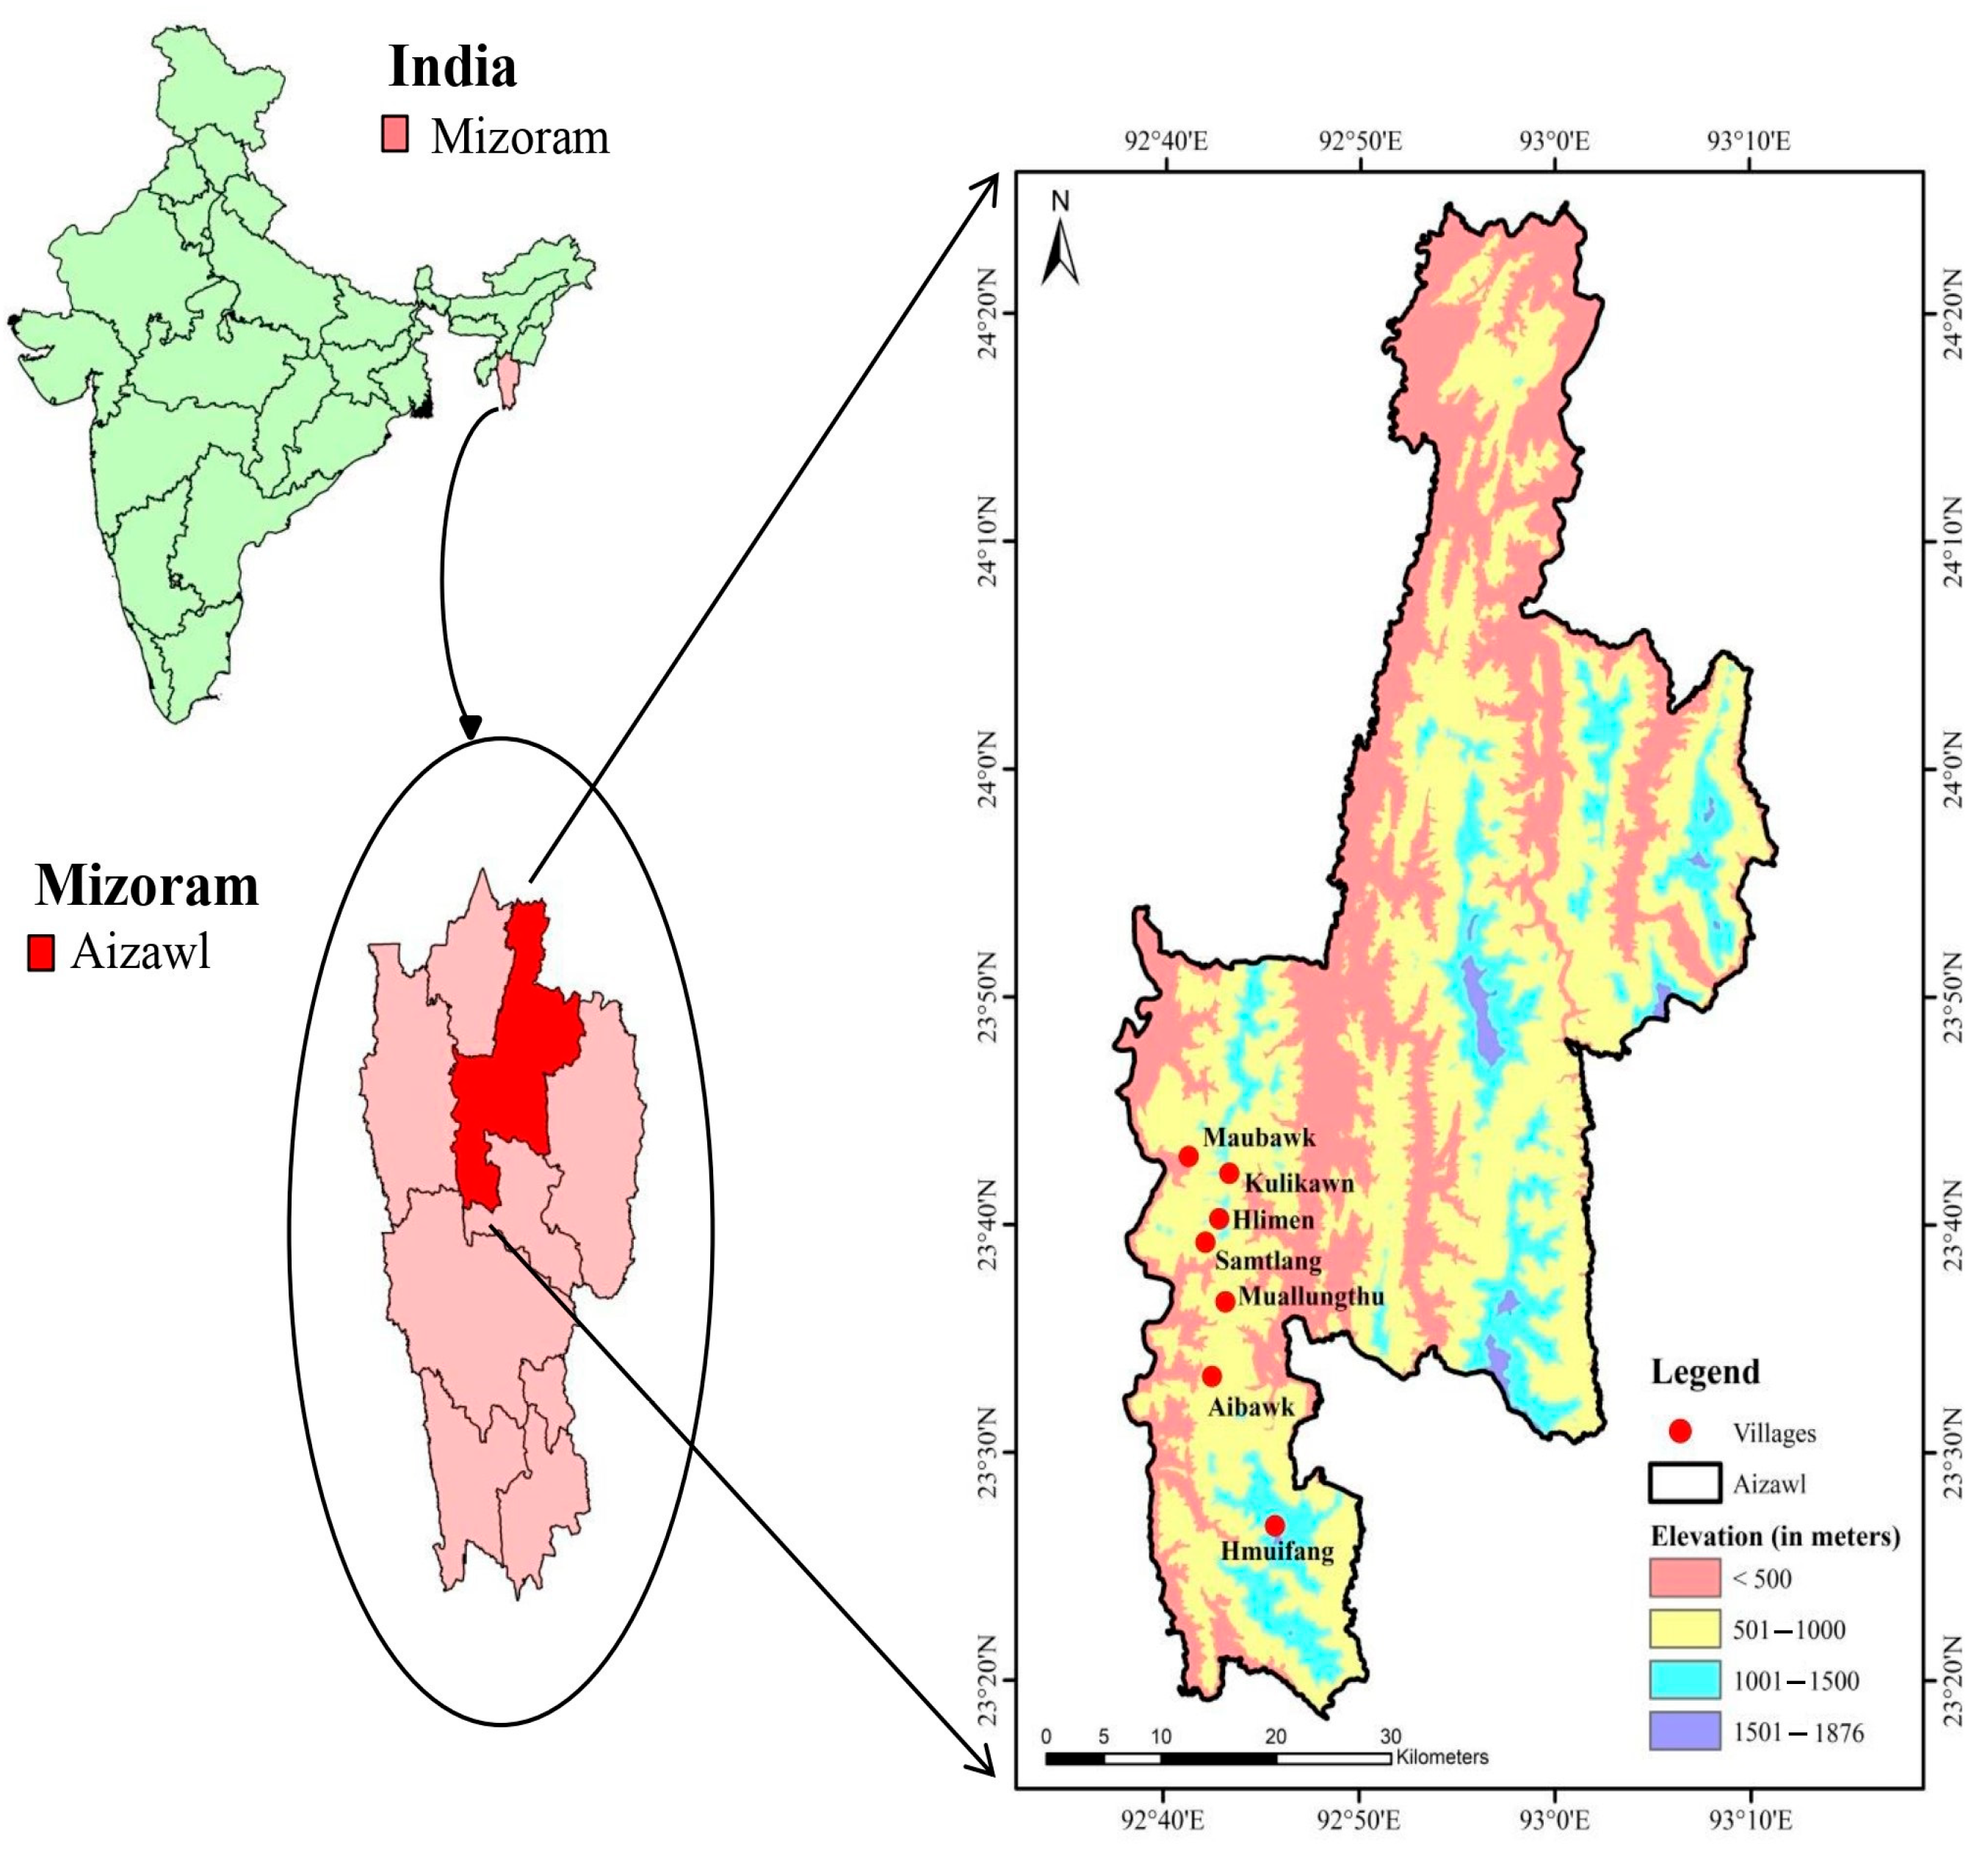
2.1. Study Site Profile

The study was conducted in seven villages of Aizawl district, Mizoram, NEI (Figure 1). These villages were selected based on the proximity to the urban hub (Aizawl headquarter) and the availability of agroforestry systems to meet the objective. Kulikawn, maubawk and Hlimen represented the urban area under Aizawl Town while Samtlang, Muallungthu, Aibawk, and Hmuifang villages constituted the rural area under Tlangnuam and Aibawk Rural Development Blocks [32]. The district is characterised by a large urban population (78.63%), low population density (112 persons per sq. km), and a large percentage of indigenous tribal communities (93.31%). Per the Forest Survey of India Report 2021 [33], the forest cover of Aizawl is about 85.71% of its total geographical area dominated by tropical semi evergreen and sub-montane-type 0forests. The district is classified as a subtropical highland climate under the Köppen climate classification. A time series study (2002–2021) of the district climatic variables depicted an increase in the maximum average temperature while the minimum average temperature and annual rainfall declined over the past 20 years [34]. The future climate projection (SSP2 4.5. 2040–2059) of Aizawl district is presented in the Supplementary Materials (Figure S1 and Figure S2).

2.2. Data Collection

In total, 105 households (HHs) (15 HHs × 7 villages) were selected and interviewed for the vulnerability and risk analysis. Representatives of the local Village Council in each village were first consulted and a list of target HHs with agroforestry as a primary source of income was prepared. Stratified random sampling was then followed to select 15 HHs per village from the identified list, after which the process of data collection was initiated. Data were collected using a tested closed-ended questionnaire, and a Likert scale [35] was used for the extraction of qualitative information to be converted into quantitative form. The survey gathered data on demography, HH characteristics, land-use and ownership, the occurrence of climate hazards, exposure, sensitivity to hazards, and a HH’s adaptive capacity.
Sixty nine indicators were used for preliminary data collection (hazard = 11, exposure = 10, sensitivity = 20, and adaptive capacity = 28) (Table S1). Not all indicators have equal scales and units. Therefore, to make the comparison feasible, normalisation was performed using the following formula given by UNDP [36]:
S s i = S i S m i n S m a x S m i n
where Ssi is the indicator index score; Si is the value of the ith respondent; Smax and Smin are maximum and minimum indicator values at respondent level.

2.3. Indicator Contribution and Selection

Statistical Package of Social Science (SPSS version 20.0, IBM Corp. Armonk, NY, USA) [37] was used to compute a principal component analysis (PCA) of the normalised indicator scores. PCAs screen out insignificant indicators whose contribution to the risk component is minimal to none. Thus, we used PCA for factor extraction and the Varimax method for factor rotation. An eigen value greater than 1 was applied for component grouping, and a communality or factor loading greater than 0.6 was considered for indicator selection [38] (Table S1).

2.4. Weight Assignment

Not all indicators or factors may have the same level of importance in a risk assessment process. Assigning weights based on relative importance can help ensure that high critical factors have more significant impact on the final decision. We used the Shannon entropy weighing method to assign weights to different indicators in a component dataset based on their relative importance. This method is based on the concept of entropy, which is a measure of the amount of uncertainty or randomness in a system. Entropy was calculated using the following formula:
E i = j = 1 n P i j × l n P i j l n n
where Ei is the entropy value of the ith indicator, n in the total number of HHs sampled, and Pij is the normalised value of the ith indicator in the jth sample. Pij was calculated as follows:
P i j = x i j j = 1 n x i j
where xij is the indicator value for the ith indicator and jth sample. Finally, weight of the ith indicator was calculated as follows:
W i = 1 E i i = 1 m 1 E i

2.5. Risk Assessment

The IPCC Special Report 2012 [22] emphasised considering the notions of hazard, exposure, and vulnerability to better under the concept of risk. This report focuses on the relationship between climate change and extreme weather and climate events, the impacts of such events, and the strategies to manage the associated risks. Risk is derived from the interaction of social and environmental processes, from the combination of physical hazards and the vulnerabilities of exposed elements. Hazard assessment involves analysing historical climate data, as well as projections from climate models, to estimate the frequency, intensity, and duration of these events. Coupled Model Inter-comparison Projects 6 (CMIP6) was employed to determine the prediction of the Shared Socio-Economic Pathway 4.5 (SSP2 4.5) for the period of 2040–2059. The projection data are represented at a 1.0° × 1.0° (100 km × 100 km) resolution (Figures S1 and S2). However, since all the villages fall under a single girth, the projected data were identical, which resulted in not considering the future climate projection for hazard assessment.
Hazard, exposure, sensitivity, and adaptive capacity were calculated using the following equation:
H a z a r d i = h = 1 2 C I S h 2
E x p o s u r e i = k = 1 4 C I S k 4
S e n s i t i v i t y i = l = 1 7 C I S l 7
A d a p t i v e   c a p a c i t y i = m = 1 4 C I S m 4
where, i is the value of the ith village or HH; h, k, l, and m are individual components of each dimension. The CIS is the component index score and was calculated as follows:
C I S = j = 1 n ( W I S ) j j = 1 n ( W e i g h t ) j
W e i g h t e d   I n d i c a t o r   S c o r e   ( W I S ) j = ( I n d i c a t o r   I n d e x   S c o r e ) j × ( W e i g h t ) j
where j indicates the indicator within each component.
The source and rationale for selection of the risk components are given in Table 1.
Table 1. Risk component, their source, and the rationale for their adoption for the study.
DimensionComponentSourceRationale
HazardClimate change trend[10]Anomaly in climate increase hazard risk
Climate change intensity[10]Greater intensity of droughts, landslides, floods, cloudburst, disease, and pests, etc., cause higher risks to a farmer’s livelihood
ExposureSoil and climate on productivity[39]Nutrient depletion and climate variation decrease crop productivity leading to households’ livelihood insecurity
Disease and pest on productivity[40]The more exposure to disease and pests there is, the less productivity there will be, and vice versa
Wildlife led depreciation on productivity[16]Urban expansion causes forest food inefficiency and leads to human wildlife conflict
Climate change towards crop variety[16,39]Greater the crop variety, higher is the tolerance to climate exposure
SensitivityPrimary AF produce and productivity[41]Lower the production and productivity of rice, vegetables, fruits, etc., greater is the livelihood vulnerability of farmers
Vegetable produce and productivity[41]
Fruit produce and productivity[41]
Production system in the last 10 years[16,42]Higher sensitivity is associated with a decrease in important production systems such as water availability, soil fertility, and increases in weed infestation
Land holding and soil nutrition[43,44]Individually owned land with a practice of using manures and fertilizers is more resilient to climate-related hazards
Food and water availability[42]Rainfed cultivation without proper storage facilities results in periodic food and water deficiencies, and causes higher sensitivity
HH members involved in cultivation[45]The more the merrier for livelihood sustenance
Adaptive capacityHealth, banking and training facility[16,39]Providing important amenities and training facilities to farmers enhances the coping capacity against hazards and exposure components
Change in cultivation schedule[46]Flexibility in cultivation schedules increases resilience to climate change
Issues to land resource utilization[16,47]The less issues there are, the higher adaptive capacity there is
Change in cultivation practice[44]The adoption of new cultivation practices suitable to the changing climate decreases the region’s vulnerability
Resultant dimensions (hazardi, exposurei, sensitivityi and adaptive capacityi) were rescaled (RS) between 1 and 3 using the following equation to finally fit into the risk scale.
D i m e n t i o n R S = D i m e n t i o n i a × z y b a + y
where, b = 1, a = 0, z = 3 and y = 1; RS is the rescaled value of the dimensions of risk for each village.
Based on IPCC AR5, risk of agroforestry farmers was calculated using the equation given below:
R i s k i = H a z a r d R S × E x p o s u r e R S × V u l n e r a b i l i t y R S
Vulnerability was derived from the dimension score by dividing the rescaled value of sensitivity by adaptive capacity [10].
During the risk assessment procedure, dimension scores were computed twice. Equations (5)–(8) yielded first dimension scores, which ranged from 0 to 1. By rescaling the values of the first dimension score in Equation (11), the second dimension score was produced, with an output value that varied from 1 to 3. The rescaled values were then employed in the final risk calculation and spatial interpretation of risk areas.
Final risk values were categorised into 5 groups based on the criterion given in Table 2.

2.6. Risk Modelling and Mapping

We used the multiple regression method to develop an equation comprising risk, elevation (from the mean sea level), and distance from Aizawl headquarter. The final model was then integrated into the raster calculator tool of ArcGIS 10.8 (Environmental Systems Research Institure, Inc.; Redlands, CA, USA) [48] to generate a risk map of Aizawl district, the methodology of which is represented in Figure 2.

3. Results

3.1. Demographic Differences

Table 3 provides a comprehensive overview of the demographic and socio-economic factors in the seven villages.

3.1.1. Gender, Age, Education, and Occupation of the Head of the Family (HoF)

The gender distribution among the heads of the families across these villages showed that Kulikawn, Maubawk, Muallungthu, and Aibawk had an equal representation of 80% male and 20% female HoFs. Samtlang and Hmuifang represented the highest number of female-headed households at 40% each. The age and educational qualifications of the HoFs vary across villages. Samtlang also displayed the highest number of educated HoFs (86.67%), while Hmuifang’s HoFs were the least literate (33.33%). The percentage of respondents (HoF) practicing agriculture as their primary occupation varied from 40% (Maubawk) to 86.67% in Samtlang.

3.1.2. Household Gender Distribution and Literacy Rates

The gender distribution within families and literacy rates are essential indicators of social development. The male–female ratio in the hamlet was found to be 100:106, which also corresponds to a higher female literary rate of 98.14%. It was observed that Kulikawn, Hlimen, and Aibawk villages had 100% literacy rates for both genders, implying successful educational initiatives in these villages.

3.1.3. Household Size and Food Availability

Food production from agroforestry farms sustains HHs for more than 10 months a year. Kulikawn represented the highest average household size of 6.2 and harvested products year-round. Regardless of the average household size being 5.4, Muallungthu showed the lowest food sufficiency (9.4 months).

3.1.4. Agroforestry Contribution to Income

On average, agroforestry practices contributed about 51.33% to the total income of the HHs. Aibawk depicted a strong reliance on agroforestry systems for livelihoods (58%) while the agroforestry managers in Hmuifang generated only 45% of their income from their farms.

3.2. Land Resources

Each village has unique strengths and areas for improvement, providing valuable insights for future development planning and resource allocation (Table 4).

3.2.1. Land Availability

The largest land holding size of 3.19 hectares was observed in Hlimen, which provided more opportunities for diverse land use practices and potentially higher agricultural productivity. In contrast, Kulikawn had the smallest land area of 0.86 hectares.

3.2.2. Leased Land and Irrigation

Land ownership and irrigation capacity plays a vital role in resource prioritization, yield, and, finally, livelihood security. The highest percentage of irrigated area in leased land was found in Samtlang (100%), and the lowest was found in Aibawk (29.55%). However, the absence of leased land in Hlimen and Muallungthu implies that the villagers rely entirely on their own land for agriculture and agroforestry activities.

3.2.3. Home Gardens

Home gardens are an essential component of food security and income generation. Most of the surveyed home gardens, except Kulikawn, were found to have sufficient (100%) irrigation facilities. On the other hand, larger home gardens were present in Kulikawn (0.29 ha), and the least were in Maubawk (0.05 ha), and Hmuifang (0.08 ha). Muallungthu’s home gardens have the most diverse land use components, which included agri-horticulture, agri-silvi-horticulture, and tea plantations.

3.2.4. Other Land Use

Kulikawn showed the highest percentage of irrigated area under the other land use category (96.08%), which corresponds to smaller land holdings (0.34 ha), thereby enabling the better utilisation of the limited water resource. It was also noticed that many traditional land-use practiced in both rural and urban areas were gradually shifting towards high-economic plantations such as Areca, teak, sandalwood, orange, rubber, etc.

3.3. Factor Analysis and Indicator Reduction

The factor analysis (PCA) table for screening indicators is given in Supplementary Tables S1–S5. These tables also indicate the variance explained by each principal component. Initially, 69 indicators were used for the survey; However, after removing those with a loading factor of less than 0.60, only 52 indicators were retained (hazard = 10, exposure = 9, sensitivity = 14, and adaptive capacity = 19). The loading factor determines the correlation of each indicator to the respective principal component. The 17 indicators that were removed had very little to no variability in their response data, and thus they gave no significant insights into the risk analysis of the seven villages.

3.4. Risk Dimensions

This study identified 17 components under four risk dimensions, namely hazard, exposure, sensitivity, and adaptive capacity.

3.4.1. Climate Change and Hazard

Each hazard is characterised by its probability, location, magnitude, and frequency. Supplementary Figures S1 and S2 show the future climate projections while the trends and intensity of climate change threshold indicators are represented in Table 5. The highest climate-induced hazard impact was found in Samtlang village (0.55) and the lowest was found in Muallungthu (0.26). The farmers of Samtlang also reported the change in temperature as the primary concern for their decrease in productivity.

3.4.2. Climate Change and Exposure

Exposure denotes the existence of people, property, and ecosystems in places where climatic hazards may have a negative impact. The highest value for overall exposure to climate change was recorded in Kulikawn (0.53) and the lowest value was recorded in Aibawk (0.33). It was found that exposure to abnormal weather and unfertile soil highly affected the agricultural output in Kulikawn and Samtlang (0.74) while Hlimen experienced the highest impact from diseases and pests on productivity (0.72). In addition, climate change has also led to a decline in crop diversity particularly in Muallungthu (0.37) followed by Hlimen (0.23).

3.4.3. Climate Change and Sensitivity

Hmuifang village was found to be most sensitive in multiple components (0.42), while Samtlang, Kulikawn, and Aibawk villages showed the least levels of sensitivity across components (0.31).
Table 5 provides valuable insight into the sensitivity of different villages to climate change, considering several indicators and components. Firstly, the production system over the past ten years has the highest weight (0.38) among all components, signifying its importance in determining climate change sensitivity. In this component, Muallungthu village obtains the lowest score (0.74) while Hmuifang village has the greatest value (0.77). Secondly, land holding and soil nutrition with a weight of 0.31 are another crucial factor in determining climate change sensitivity wherein Hmuiphang village exhibits the highest component sensitivity score (0.63), while Muallungthu village has the lowest score (0.33). Furthermore, the food and water availability component (weight 0.13) was also found to be essential, in which Hmuifang, once again, had the highest score (0.24) and Kulikawn and Samtlang villages had the lowest score (0.01).
Table 5. Component’s effect on risk and its index score for the seven villages of Aizawl, Northeast India.
ComponentEffect WeightKulikawnMaubawkHlimenSamtlangMuallungthuAibawkHmuifang
Climate change trend+0.550.480.450.510.530.430.530.52
Climate change intensity+0.450.490.460.260.560.080.250.30
Soil and climate on productivity+0.260.740.640.320.740.320.380.50
Disease and pest on productivity+0.050.620.470.720.630.470.500.55
Wildlife-led depreciation of productivity+0.080.610.570.550.520.300.360.50
Climate change towards crop variety-0.070.130.030.230.200.370.070.10
Primary AF production and productivity-0.070.430.430.330.170.300.270.30
Vegetable production and productivity-0.020.080.020.010.040.010.010.04
Fruit production and productivity-0.040.500.470.470.370.470.500.47
Production system in the last 10 years-0.380.740.640.560.740.390.600.77
Land holding and soil nutrition-0.310.390.610.550.400.330.420.63
Food and water availability-0.130.010.110.130.010.230.040.24
HH members involved in cultivation-0.050.470.450.410.460.440.360.52
Health, banking, and training facilities-0.130.520.400.470.650.390.740.36
Change in cultivation schedule-0.161.000.710.850.880.720.820.72
Issues in land resource utilization-0.030.550.520.470.450.480.620.30
Change in cultivation practice-0.690.250.340.320.460.440.360.43

3.4.4. Climate Change and Adaptive Capacity
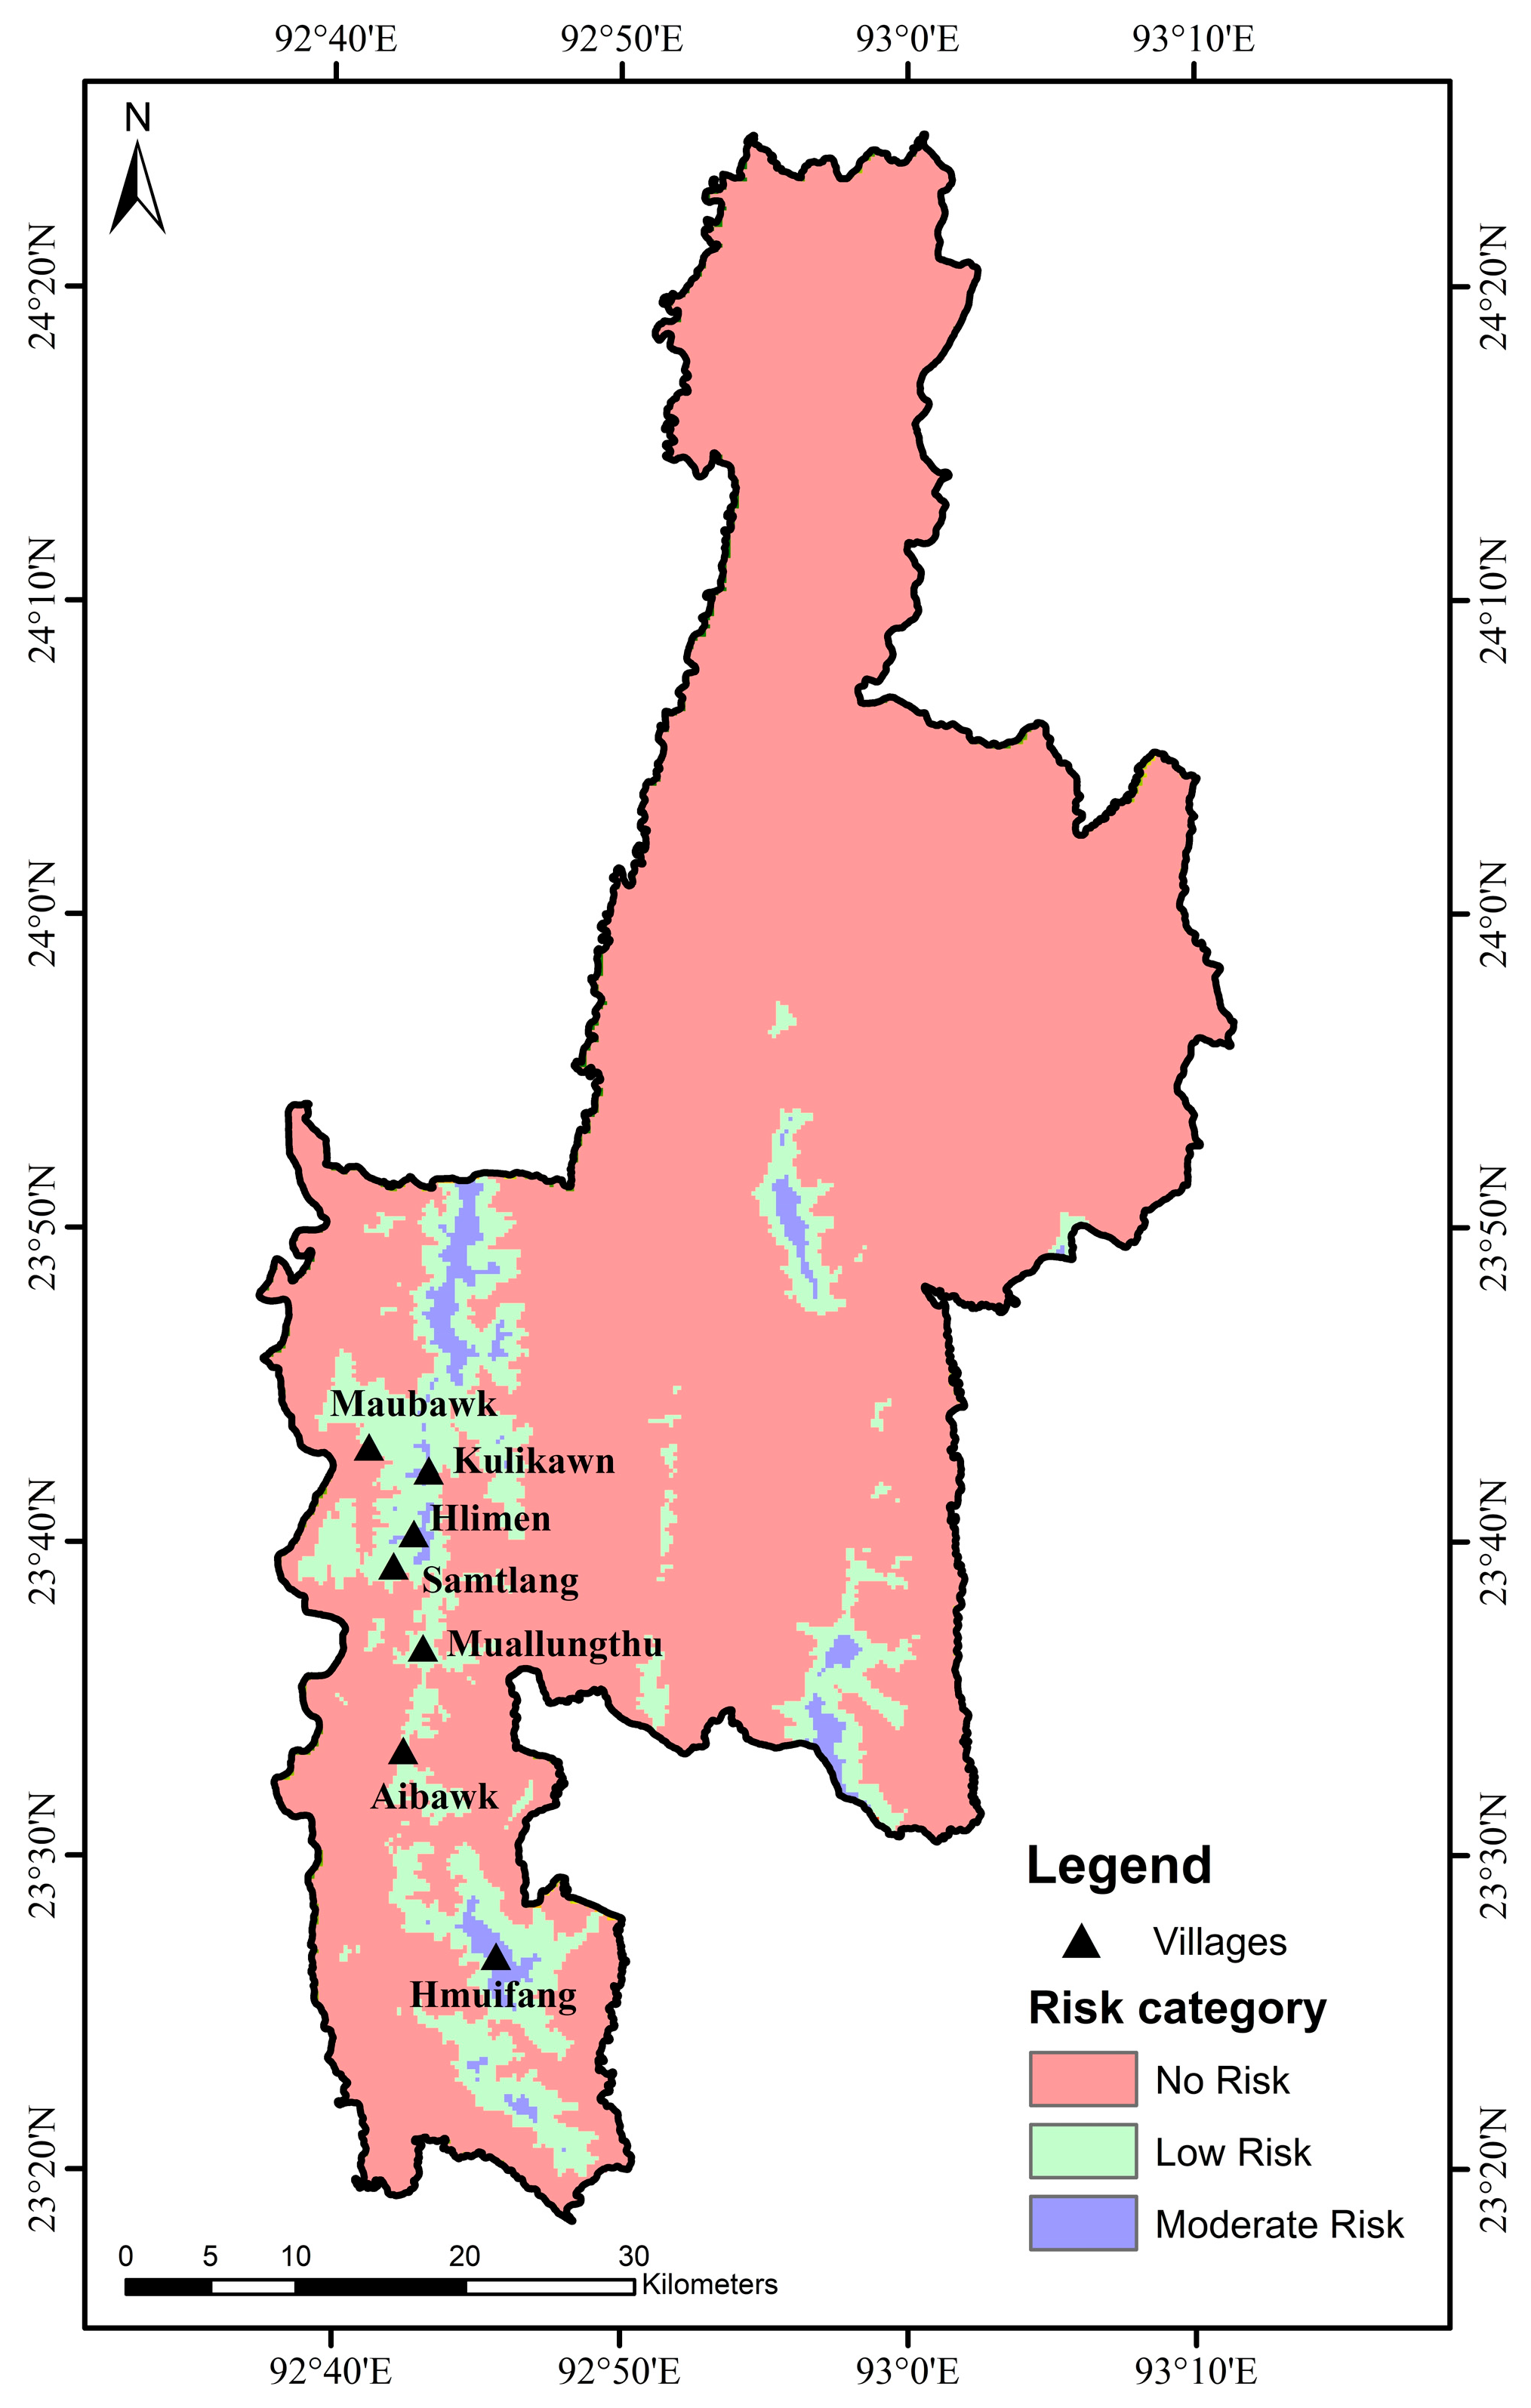
The adaptive capacity to climate change varies across the seven villages in Aizawl, Mizoram (Table 5). The highest score for overall adaptability was found in Aibawk (0.64) and the lowest score was found in Hmuifang (0.45). Aibawk village, yet again, acquired the highest score for the availability of amenities for training, banking, health care (0.74), and other form of land resource utilization (0.62). Hmuifang, on the other hand, showed the lowest score (0.36 and 0.3) in both the components, demonstrating the need for improvement in these areas.
Samtlang village (0.88) followed Kulikawn village (1) in terms of farmers’ responsiveness to changes in the agricultural schedule. However, Maubawk scored the lowest (0.71) suggesting a poor farming schedule due to shifting climatic circumstances. The adoption of new cultivation practices is important to adapt to climate change and Samtlang village has been successfully adapting to change (0.46) while Kulikawn adopted new practices the least (0.25).

3.5. Final Risk

The result (Figure 3) indicated that the majority of the villages face a moderate-risk climate, with only one village in the low-risk category. The highest climate risk score was found in the Hmuifang village with a value of 3.97 while Aibawk showed the lowest climate risk with a score of 1.87.

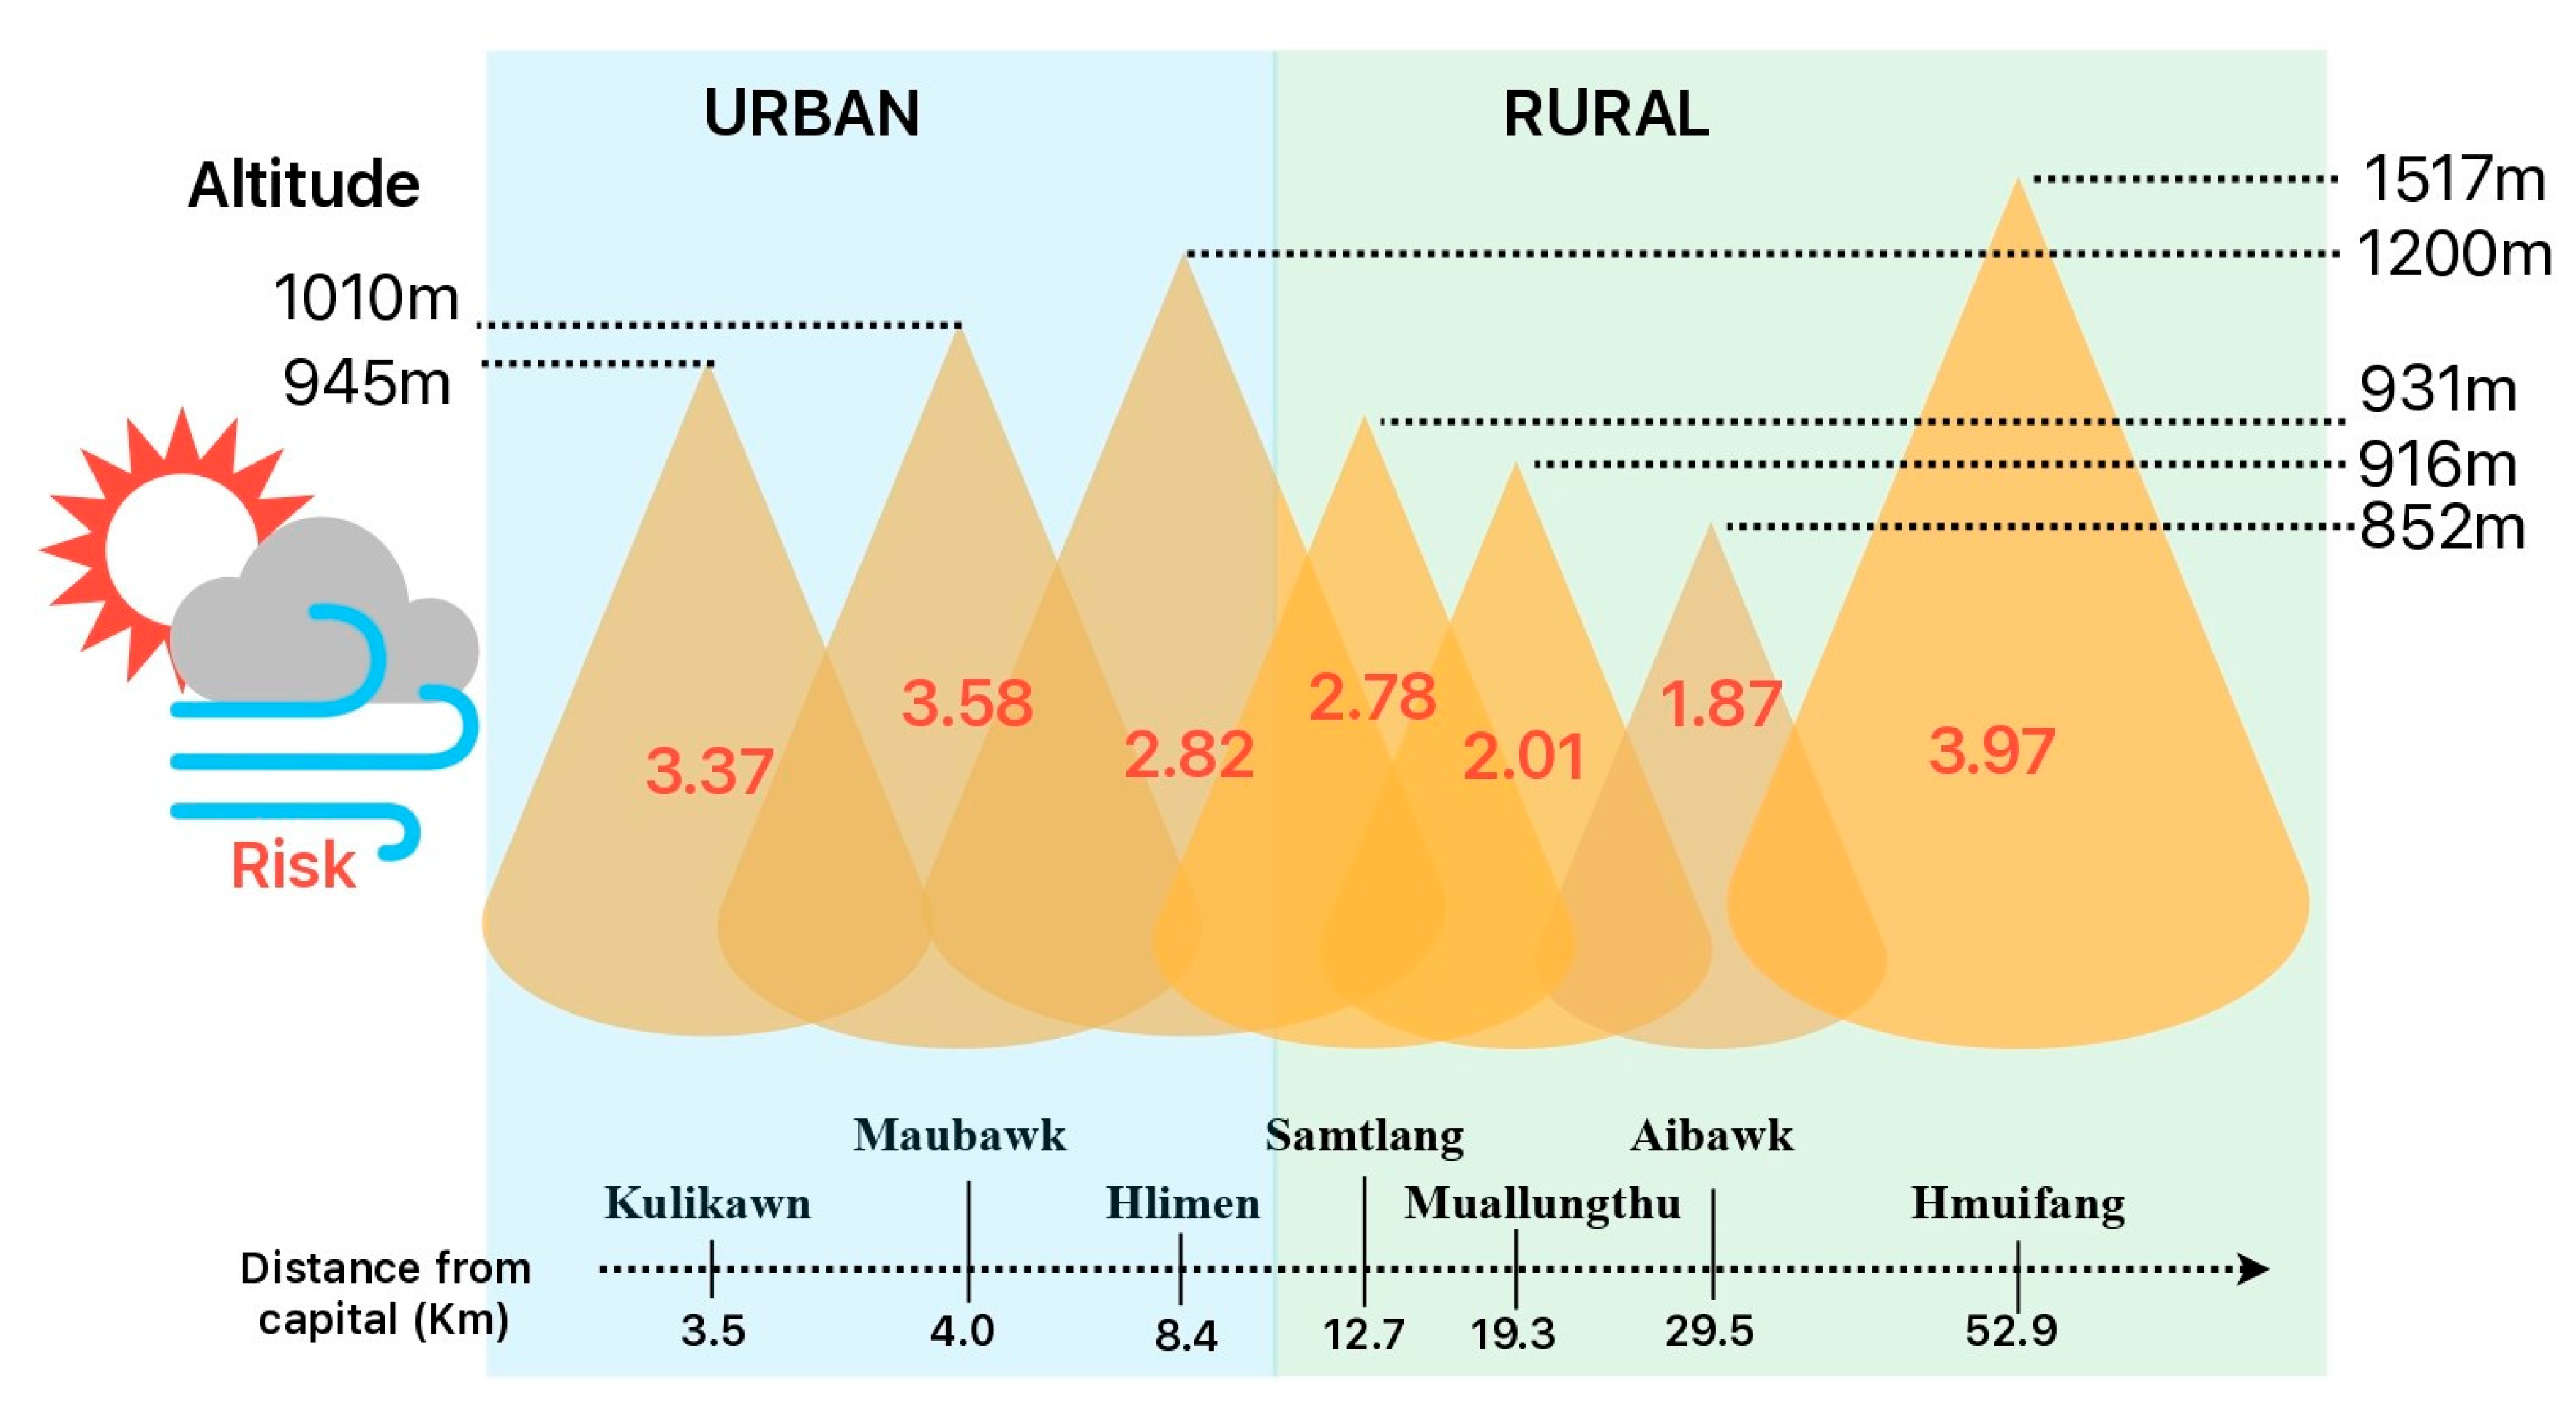
3.6. Risk to Urban and Rural Households

This study has shown urban villages to be more vulnerable to climate change than rural villages are (Figure 3). However, Hmuifang village, though situated farthest from Aizawl headquarter, demonstrated a high climate risk.
The derived model or equation and its coefficients are given in Table 6. The model displayed a correlation (R) value of 0.4 and a significance of p < 0.001. Finally, a risk map of Aizawl district was developed and is represented in Figure 4.

4. Discussion

4.1. Demographic Differences

Education is a crucial and fundamental component needed to raise the standard of human resources. It is underlined that education improves the quality and, consequently, the productivity of the labour force and quickens the rate of knowledge accumulation within society [49]. The results provided information on the distribution of HoFs by gender, level of education, and primary occupations within the communities. Understanding these elements is essential for developing development interventions that take gender into account, making the most of the knowledge and experience of older HoFs, and creating plans for economic growth and diversification in the Mizo communities in Aizawl. A study on education and human development in Mizoram (NEI) also found that employment and standard of living increased with higher education levels and professional degrees such as management and vocational studies [50]. Studies on gender distribution and literacy rates can be valuable for understanding and addressing gender-based disparities in education and opportunities. The household size and food availability in Kulikawn defines the livelihood security at the basic level [51].

4.2. Land Resources

‘Land resources’ emphasizes how different villages have diverse land availability, water management, and land-use practices. Muallungthu has the most varied land-use components, making home gardens essential for food security and generating money. Due to lower land holdings, Kulikawn has a large percentage of irrigated area under various land uses. In both urban and rural areas, the traditional land-use patterns are changing in favour of commercially successful plantations. This change may elevate households’ livelihood statuses, but at the cost of great biodiversity loss and soil degradation [52].

4.3. Risk Dimensions

Risk studies are conducted as a prerequisite in making policies to prevent further degradation due to environmental crises [53]. We derived the risk index for the seven villages and ranked them accordingly as Hmuifang > Maubawk > Kulikawn > Hlimen > Samtlang > Muallungthu > Aibawk. This finding was in agreement with our hypothesis that the risk index of agroforestry households increases with altitude while it decreases with the distance from Aizawl headquarter.
Risk is a relative concept; hence, the risk ranking based on vulnerability indices is a comparison of different villages. Consequently, it does not indicate that villages with higher risk index values are inherently vulnerable and dangerous places to live; rather, it means that they are relatively riskier than villages with lower index values. Furthermore, when employing an indicator-based approach to assess risk, it is important to acknowledge that additional or alternative indicators can also be used for evaluating the risk within the same study area. Therefore, the aforementioned risk indicators or drivers are not exclusive or consistent across all urban and rural households within the represented villages, emphasising the presence of other diverse factors influencing risk.

4.4. Climate Change Hazard and Exposure

Each hazard is characterised by its probability, location, magnitude, and frequency. Rapid urban population growth strains the capacity of developing countries to cope with extreme events, with smaller cities and rural communities being potentially more vulnerable than megacities (United Nations Humans Settle programme [54]). Past climate anomalies (from the questionnaire survey) and future projections (SSP2-4.5, 2040–2059) of Aizawl district revealed precipitation and temperature to be of great concern (Figures S1 and S2).
Exposure denotes the presence of assets, people, and ecosystems in areas where climate hazards could have an adverse effect. A loss of green space in urban areas can exacerbate exposure to extreme climate events by affecting runoff, urban heat island mitigation, and biodiversity [55]. It is essential to invest in infrastructure improvements, early warning systems, and disaster risk reduction strategies to mitigate the impact of hazards in Kulikawn and Samtlang villages. Community engagement and awareness campaigns can also play a vital role in enhancing local resilience to such hazards. To address the problem of diseases and pests on productivity, integrated pest management strategies, including the use of environmentally friendly pesticides, biological control methods, and cultural practices should be implemented. Additionally, training and capacity building of local farmers in pest identification and management can contribute to sustainable agricultural practices.
Finally, managing climatic exposure to crop variety is crucial, particularly for the villages of Muallungthu and Hlimen. The types of crops cultivated in rural households depend on the accessibility, availability, and adaptability of seed varieties. Promoting climate-resilient crop varieties, improving irrigation systems, and implementing climate-smart agricultural practices can help these villages adapt to the changing climate and maintain their agricultural productivity.

4.5. Vulnerability

Addressing vulnerability, hazards, and exposure to existing climatic variability is the first step in mitigating the risk posed by the effects of climate change. However, in practice, hazards and exposure present limited prospects and manageability since it is not viable to move or remove an entire area or system from climate exposure. Vulnerability provides greater manageability and potential for reduction by improving adaptive capacity and addressing the sensitivity of systems to climate change or variability [12]. Therefore, it is more practical and impactful to focus on addressing vulnerability rather than dealing with hazards and exposure.
Risk assessment helps in selecting adaptation measures based on the assessment of the drivers of vulnerability. Drivers of vulnerability are indicators used for vulnerability assessment that are expressed as sensitivity or a lack of adaptive capacity. Our study on these drivers for different villages suggested that biophysical and socioeconomic features such as cultivation schedule, agroforestry and horticulture output, land holdings, loan availability, changes in cultivation practice, areas under irrigation, and the number of farmers depending on agriculture as their primary source of income are the dominant drivers of vulnerability.

4.6. Risk to Urban and Rural Households

There is no simple relationship between exposure and vulnerability to climate extremes in urban and rural environments, as climate risks can be ameliorated or exacerbated by positive or negative adaptation processes and outcomes in either context [22]. Despite Hmuifang village being the farthest from Aizawl headquarters, it faces significant climate risks. This is supplemented by the region’s low productivity, small land holdings, and fewer household members in farming practices. Furthermore, adaptive mechanisms such as health, banking, and training facilities were also unavailable in the area. Households with institutional facilities are better-adapted to climate risks and are more likely to practice climate smart agriculture [56]. A study on the vulnerability of different agroforestry systems (AFS) in Northeast India also found Hmuifang village to be highly vulnerable [57]. The region is also associated with strong wind, steep slopes, a scarcity of water, and winter drought, which renders it highly susceptible to the risk of climate change. This study also found that households with agroforestry practice in higher elevations have greater risk than do lower elevation households. In addition, Hmuifang, located in the highest elevation of all the studied villages, also suffered with the highest risk, which corresponds with the findings of a study conducted on the upper Himalayan region where the socio-economic vulnerability of the people living in hills with an elevation of 1000 m and above showed higher sensitivity and vulnerability to climate change [39].
Rural livelihoods are heavily reliant on the environment and natural resources, and extreme climate events can significantly impact the agricultural sector [58]. On the other hand, accelerated urbanization in Aizawl district has resulted in a decrease in land holding size, a decrease in agricultural production, and an increase in the practice of monocropping. Thus, despite having better urban amenities, the urban farmers were found to be more susceptible to climate change risks.
Urban and rural areas are closely connected, with each depending on the other for resources, employment, and services. Climate-related variability and extremes can affect these relationships. For marginal farmers, climate-led economic uncertainty often influences agricultural households’ decision-making. The coping mechanisms post-disaster may help poor households regain assets and resist extreme poverty, but long-term adaptation strategies to lift them out of poverty remain elusive for most.

4.7. Policy Formulation

Improving agriculture’s ability to withstand climate change requires significant government involvement. This can be achieved through two key strategies: first, the development of context-specific policies and programs, coupled with effective implementation through improved coordination across various administrative levels, ensuring a seamless flow of information, knowledge, and resources to farmers; second, fostering convergence among diverse programs managed by various ministries and departments to optimize the efficient and sustainable allocation of financial and human resources [57]. In this study, we found a few components that require priority intervention through government planning and policies. A brief explanation of these key components along with the target village is given in Supplementary Table S6.
The climate action plans developed by the Indian Government under the National Action Plan on Climate Change (NAPCC) and district-level contingency plans established by the Indian Council of Agriculture Research (ICAR) have demonstrated limited effectiveness. Our study revealed that respondents in the examined villages did not receive the expected assistance during crises, likely due to a lack of coordination at administrative levels below the state, district, block, and village. To enhance the efficacy of these plans, it is imperative that village-level institutions, such as village councils, are effectively coordinated to facilitate the dissemination of adaptation technologies, funding and skill development facilities.

5. Conclusions

The risk index of agroforestry households increases with the altitude of the villages while it decreases as the distance of these villages from Aizawl headquarter extends. The risk analysis of the hazard, exposure, and vulnerability components affecting farmers’ ability to cope with the changing climate in these villages provides important insights that can inform policy and intervention strategies. The findings reveal that every village undergoes a different set of difficulties, suggesting that a one-size-fits-all strategy may not be successful in resolving these problems. Hence, it is essential to create focused treatments that take into account the unique risk factors affecting the sustainability of each village’s livelihood.
Furthermore, given the persistent climate hazards predicted for the next several decades, including rising temperatures and reduced rainfall, it is essential to advocate for policies promoting climate-smart agriculture. Complementary initiatives such as the agriculture credit scheme and skill development programs should be integrated into these efforts. It is also worth noting that despite a high literacy rate in the studied villages, there remains a concerning dropout rate among youths. Therefore, future policy endeavours should also incorporate innovative schemes designed to attract and encourage dropout youths to pursue higher education, aligning with our broader goals of sustainable development and resilience to climate change.

Supplementary Materials

The following supporting information can be downloaded at https://www.mdpi.com/article/10.3390/agriculture13102013/s1. Figure S1: Rainfall projections of the north-eastern states for the year 2040-2059 (SSP2-4.5). Figure S2: Temperature projections of the north-eastern states for the year 2040-2059 (SSP2-4.5). Table S1: Indicator selection from the components of the climate risk dimensions. Table S2: Indicator selection and variance determination for hazard dimension using principal component analysis. Table S3: Indicator selection and variance determination for exposure dimension using principal component analysis. Table S4: Indicator selection and variance determination for sensitivity dimension using the Principal Component Analysis. Table S5: Indicator selection and variance determination for the dimension on adaptive capacity using principal component analysis. Table S6: Major component constrains, policy directions and priority villages.

Author Contributions

P.T. and U.K.S. designed the study; U.T. and P.T. performed the field study/investigation; P.T. and U.T. analysed and validated the data; U.K.S. supervised the work; P.T. and U.T. wrote the first draft; U.K.S., R.P., P.P. and L.S. reviewed and revised the paper; U.K.S. administered the project and obtained research funding; R.P. and L.S. made APC fund requisition. All authors have read and agreed to the published version of the manuscript.

Funding

This research was financially supported by a Department of Science and Technology, Government of India, New Delhi (Grant No. DST/CCP/MRDP/189/2019) under the National Climate Change Program.

Institutional Review Board Statement

Not applicable.

Data Availability Statement

All data are available with the paper. Additional data can be available from the corresponding author upon reasonable request.

Acknowledgments

The first author (P.T.) gratefully acknowledges the financial support received from the Department of Science and Technology, Government of India, in the form of a INSPIRE Fellowship (Grant No. DST/INSPIRE Fellowship/2015/IF 15062). The APC of this paper was covered by a project grant (Code 6PFE) under the scheme ‘Increasing the impact of excellent research on the capacity for Innovation and Technology Transfer within USV Timiosoara’ Romania. The authors are also grateful to the agroforestry managers of Aizawl district for their active cooperation during the survey, and permitting the authors to undertake research in their farms.

Conflicts of Interest

The authors declare that they have no known competing financial interest or personal relationships that could have appeared to influence the work reported in the paper.

References

  1. Marie, M.; Yirga, F.; Haile, M.; Tquabo, F. Farmers’ choices and factors affecting adoption of climate change adaptation strategies: Evidence from northwestern Ethiopia. Heliyon 2020, 6, e03867. [Google Scholar] [CrossRef]
  2. Meshram, S.G.; Kahya, E.; Meshram, C.; Ghorbani, M.A.; Ambade, B.; Mirabbasi, R. Long-term temperature trend analysis associated with agriculture crops. Theor. Appl. Climatol. 2020, 140, 1139–1159. [Google Scholar] [CrossRef]
  3. Murray-Tortarolo, G.N.; Jaramillo, V.J. The impact of extreme weather events on livestock populations: The case of the 2011 drought in Mexico. Clim. Chang. 2019, 153, 79–89. [Google Scholar] [CrossRef]
  4. Tao, F.; Zhang, Z.; Zhang, S.; Zhu, Z.; Shi, W. Response of crop yields to climate trends since 1980 in China. Clim. Res. 2012, 54, 233–247. [Google Scholar] [CrossRef]
  5. Das, A.; Ghosh, P.K.; Choudhury, B.U.; Patel, D.P.; Munda, G.C.; Ngachan, S.V.; Chowdhury, P. Climate change in North East India: Recent facts and events–worry for agricultural management. In ISPRS Archives XXXVIII-8/W3 Workshop Proceedings: Impact of Climate Change on Agriculture; Indian Society of Remote Sensing: Ahmedabad, India, 2009; pp. 32–37. [Google Scholar]
  6. Kumar, S.; Upadhyay, S.K. Impact of climate change on agricultural productivity and food security in India: A State level analysis. Indian J. Agric. Res. 2019, 53, 133–142. [Google Scholar] [CrossRef]
  7. Nath, H.K.; Mandal, R. Heterogeneous climatic impacts on agricultural production: Evidence from rice yield in Assam, India. Asian J. Agric. Dev. 2018, 15, 23–42. [Google Scholar] [CrossRef]
  8. Singh, A.; Thakur, S.; Adhikary, N.C. Influence of climatic indices (AMO, PDO, and ENSO) and temperature on rainfall in the Northeast Region of India. Appl. Sci. 2020, 2, 1728. [Google Scholar] [CrossRef]
  9. Intergovernmental Panel on Climate Change (IPCC). Climate Change 2014: Synthesis Report Summary Chapter for Policymakers; IPCC: Geneva, Szwitzerland, 2014; pp. 1059–1072. [Google Scholar] [CrossRef]
  10. United Nations Development Programme. Draft Final Report: Conduct a Climate Change Risk and Vulnerability Assessment of Agro Ecological Zones of Nepal and Appraising Climate Change Adaptation Measures in Agriculture; United Nations Development Programme: New York, NY, USA, 2018. [Google Scholar]
  11. Contreras, D.; Chamorro, A. The spatial dimension in the assessment of socio-economic vulnerability challenges for an application on an urban scale, a systematic review. Nat. Hazards Earth Syst. Sci. 2019, 147, 1–43. [Google Scholar] [CrossRef]
  12. Hazarika, N.; Barman, D.; Das, A.K.; Sarma, A.K.; Borah, S.B. Assessing and mapping flood hazard, vulnerability and risk in the Upper Brahmaputra River valley using stakeholders’ knowledge and multicriteria evaluation (MCE). J. Flood Risk Manag. 2018, 11, 700–716. [Google Scholar] [CrossRef]
  13. Solangaarachchi, D.; Griffin, A.L.; Doherty, M.D. Social vulnerability in the context of bushfire risk at the urban-bush interface in Sydney: A case study of the Blue Mountains and Ku-ring-gai local council areas. Nat. Hazards 2012, 64, 1873–1898. [Google Scholar] [CrossRef]
  14. Finch, C.; Emrich, C.T.; Cutter, S.L. Disaster disparities and differential recovery in New Orleans. Popul. Environ. 2010, 31, 179–202. [Google Scholar] [CrossRef]
  15. Adger, W.N.; Brooks, N.; Bentham, G.; Agnew, M.; Eriksen, S. New Indicators of Vulnerability and Adaptive Capacity; Technical Report 7; Tyndall Centre for Climate Change Research: Norwich, UK, 2004. [Google Scholar]
  16. Pandey, R.; Jha, S.K. Climate vulnerability index—Measure of climate change vulnerability to communities: A case of rural Lower Himalaya, India. Mitig. Adapt. Strateg. Glob. Chang. 2012, 17, 487–506. [Google Scholar] [CrossRef]
  17. Nandy, S.; Singh, C.; Das, K.K.; Kingma, N.C.; Kushwaha, S.P.S. Environmental vulnerability assessment of eco-development zone of Great Himalayan National Park, Himachal Pradesh. India. Ecol. Indic. 2015, 57, 182–195. [Google Scholar] [CrossRef]
  18. Shukla, R.; Sachdeva, K.; Joshi, P.K. An indicator-based approach to assess village-level social and biophysical vulnerability of agriculture communities in Uttarakhand, India. J. Mt. Sci. 2016, 13, 2260–2271. [Google Scholar] [CrossRef]
  19. Zhou, J.; Ji, G.; Tian, Y.; Chen, Y.; Wang, Z. Environmental vulnerability assessment for mainland China based on entropy method. Ecol. Indic. 2018, 91, 410–422. [Google Scholar] [CrossRef]
  20. Bonfiglio, A.; Coderoni, S.; Esposti, R.; Baldoni, E. The role of rurality in determining the economy-wide impacts of a natural disaster. Econ. Syst. Res. 2021, 33, 446–469. [Google Scholar] [CrossRef]
  21. Matlakala, F.K.; Nyahunda, L.; Makhubele, J.C. Population’s vulnerability to natural disasters in Runnymede Village at Tzaneen Local Municipality, South Africa. Humanit. Soc. Sci. Rev. 2021, 9, 160–166. [Google Scholar] [CrossRef]
  22. Cardona, O.D.; van Aalst, M.K.; Birkmann, J.; Fordham, M.; McGregor, G.; Perez, R.; Pulwarty, R.S.; Schipper, E.L.F.; Sinh, B.T. Managing the Risk of Extreme Events and Disasters to Advance Climate Change Adaptation; Field, C.B., Barros, V., Stocker, T.F., Qin, D., Dokken, D.J., Ebi, K.L., Mastrandrea, M.D., Mach, K.J., Plattner, G.K., Allen, S.K., et al., Eds.; Cambridge University Press: Cambridge, UK; New York, NY, USA, 2012; pp. 65–108. [Google Scholar]
  23. Basannagari, B.; Kala, C.P. Climate change and apple farming in Indian Himalayas: A study of local perceptions and responses. PLoS ONE 2013, 8, e77976. [Google Scholar] [CrossRef] [PubMed]
  24. Aizawl District Management Plan. Department of Disaster Management & Rehabilitation, Government of Mizoram, Aizawl, Mizoram. 2019. Available online: https://dmr.mizoram.gov.in/uploads/attachments/bc5cc8e1e54e6b97600d56df06108fbd/pages-76-aizawl-ddmp-2019.pdf (accessed on 1 September 2023).
  25. Lasco, R.D.; Delfino, R.J.P.; Espaldon, M.L.O. Agroforestry systems: Helping smallholders adapt to climate risks while mitigating climate change. Wiley Interdiscip. Rev. Clim. Chang. 2014, 5, 825–833. [Google Scholar] [CrossRef]
  26. Córdova, R.; Hogarth, N.J.; Kanninen, M. Mountain farming systems’ exposure and sensitivity to climate change and variability: Agroforestry and conventional agriculture systems compared in Ecuador’s Indigenous Territory of Kayambi people. Sustainability 2019, 11, 2623. [Google Scholar] [CrossRef]
  27. Gnonlonfoun, I.; Assogbadjo, A.E.; Gnanglè, C.P.; Glèlè Kakaï, R.L. New indicators of vulnerability and resilience of agroforestry systems to climate change in West Africa: West African agroforestry systems and climate change. Agron. Sustain. Dev. 2019, 39, 23. [Google Scholar] [CrossRef]
  28. Gebru, G.W.; Ichoku, H.E.; Phil-Eze, P.O. Determinants of smallholder farmers’ adoption of adaptation strategies to climate change in Eastern Tigray National Regional State of Ethiopia. Heliyon 2020, 6, e04356. [Google Scholar] [CrossRef] [PubMed]
  29. Zoysa, M.; Inoue, M. Climate Change Impacts, Agroforestry Adaptation and Policy Environment in Sri Lanka. Open J. For. 2014, 4, 439–456. [Google Scholar] [CrossRef]
  30. Sereke, F.; Graves, A.; Dux, D.; Palma, J.; Herzog, F. Innovative agroecosystem goods and services: Key profitability drivers in Swiss agroforestry. Agron. Sustain. Dev. 2015, 35, 759–770. [Google Scholar] [CrossRef]
  31. Nyong, A.; Ngankam, T.; Félicité, T. Enhancement of resilience to climate variability and change through agroforestry practices in smallholder farming systems in Cameroon. Agrofor. Syst. 2019, 94, 687–705. [Google Scholar] [CrossRef]
  32. Directorate of Census Operations. District Census Handbook; Directorate of Census Operations: Aizawl, India, 2011. [Google Scholar]
  33. FSI (Forest Survey of India). India State of Forest Report; Ministry of Environment and Forests, Government of India: Dehradun, India, 2021. [Google Scholar]
  34. Meteorological Data of Aizawl. Directorate of Economics and Statistics. Government of Mizoram. 2021. Available online: https://des.mizoram.gov.in/uploads/attachments/2022/09/c7a320a0094f8d1f1de1714562d8788b/meteorological-data-of-mizoram-2021.pdf (accessed on 5 August 2022).
  35. Wyatt, R.C.; Meyers, L.S. Psychometric properties of four 5-point Likert type response scales. Educ. Psychol. Meas. 1987, 47, 27–35. [Google Scholar] [CrossRef]
  36. United Nations Development Programme. Human Development Reports 2007/2008, Fighting Climate Change: Human Solidarity in a Divided World; United Nations Development Programme: New York, NY, USA, 2007. [Google Scholar]
  37. IBM Corp. Statistical Package for the Social Sciences (SPSS), Version 20.0; IBM Corp: Armonk, NY, USA, 2012. [Google Scholar]
  38. Mohanty, A.K.; Kumar, G.A.K.; Singh, B.B.; Meera, S.N. Developing multidimensional scale for effective measurement of rural leadership. Indian Res. J. Exten. Edu. 2016, 9, 57–63. [Google Scholar]
  39. Gerlitz, J.Y.; Macchi, M.; Brooks, N.; Pandey, R.; Banerjee, S.; Jha, S.K. The multidimensional livelihood vulnerability index-an instrument to measure livelihood vulnerability to change in the Hindu Kush Himalayas. Clim. Dev 2016, 9, 124–140. [Google Scholar] [CrossRef]
  40. Gupta, A.K.; Negi, M.; Nandy, S.; Kumar, M.; Singh, V.; Valente, D.; Petrosillo, I.; Pandey, R. Mapping socio-environmental vulnerability to climate change in different altitude zones in the Indian Himalayas. Ecol. Indic. 2020, 109, 105787. [Google Scholar] [CrossRef]
  41. Simane, B.; Zaitchik, B.F.; Foltz, J.D. Agroecosystem specific climate vulnerability analysis: Application of the livelihood vulnerability index to a tropical highland region. Mitig. Adapt. Strateg. Glob. Chang. 2016, 21, 39–65. [Google Scholar] [CrossRef] [PubMed]
  42. Pandey, R.; Alatalo, J.M.; Thapliyal, K.; Chauhan, S.; Archie, K.M.; Gupta, A.K.; Kumar, S.; Kumar, M. Climate change vulnerability in urban slum communities: Investigating household adaptation and decision-making capacity in the Indian Himalaya. Ecol. Indic. 2018, 90, 379–391. [Google Scholar] [CrossRef]
  43. Ravindranath, N.H.; Rao, S.; Sharma, N.; Nair, M.; Gopalakrishnan, R.; Rao, A.S.; Malaviya, S.; Tiwari, R.; Sagadevan, A.; Munsi, M.; et al. Climate change vulnerability profiles for North East India. Curr. Sci. 2011, 101, 384–394. [Google Scholar]
  44. Thong, P.; Thangjam, U.; Sahoo, U.K.; Pebam, R. Socio-economic vulnerability assessment of shifting cultivators (Jhumias) amidst the changing climate in Mizoram, northeast India. Appl. Geogr. 2022, 147, 102790. [Google Scholar] [CrossRef]
  45. Datta, J.; Gangadharappa, N.R.; Debnath, A. Sustainability of jhum cultivation as perceived by the tribal people of Tripura. Int. J. Soc. Sci. 2014, 3, 179–190. [Google Scholar] [CrossRef]
  46. Sridevi, G.; Jyotishi, A.; Mahapatra, S.; Jagadeesh, G.; Bedamatta, S. Climate Change Vulnerability in Agriculture Sector: Indexing and Mapping of Four Southern Indian States; Quaderni—Working Paper DSE No. 966; SSRN: Rochester, NY, USA, 2014. [Google Scholar] [CrossRef]
  47. Pandey, R.; Kala, S.; Pandey, V.P. Assessing climate change vulnerability of water at household level. Mitig. Adapt. Strateg. Glob. Chang. 2015, 20, 1471–1485. [Google Scholar] [CrossRef]
  48. ArcGIS Version 10.8; Environmental Systems Research Institute, Inc.: Redlands, CA, USA, 2020.
  49. Isa, K. Quality Management in Theory. Int. J. Sci. Res. Pub. 2020, 10, 492–495. [Google Scholar] [CrossRef]
  50. Lalfakwmi. Education and human development in NE-India with special reference to Mizoram. EPRA Int. J. Ecol. Bus. Rev. 2020, 8, 27–30. [Google Scholar] [CrossRef]
  51. Kioko, P. Household Food Security: An Evaluation of the Food Security Sector of the ACTIONAID Kenya Programme; LAP LAMBERT Academic Publishing: London, UK, 2016. [Google Scholar]
  52. He, P.; Martin, K. Effect of rubber cultivation on biodiversity in the Mekong Region. CAB Rev. 2015, 1–7. [Google Scholar] [CrossRef]
  53. International Energy Agency. Climate Resilience Policy Indicator; IEA: Paris, France, 2002; Available online: https://www.iea.org/reports/climate-resilience-policy-indicator (accessed on 5 August 2022).
  54. UN-Habitat. Global Report on Human Settlements 2011: Planning Sustainable Cities, United Nations Human Settlements Program, Earthscan; UN-Habitat: London, UK, 2009. [Google Scholar]
  55. Wilby, R.L.; Perry, G.L.W. Climate change, biodiversity and the urban environment: A critical review based on London, UK. Prog. Phys. Geogr. 2006, 30, 73–98. [Google Scholar] [CrossRef]
  56. Birthal, P.S. Climate Change and Risk Management in Indian Agriculture. Department of Economic Research and Analysis; National Bank for Agriculture and Rural Development: Mumbai, India, 2022. [Google Scholar]
  57. Thangjam, U.; Thong, P.; Sahoo, U.K. Climate change threat on socio-economic condition of agroforestry managers: A vulnerability study in eastern Himalayan state of Mizoram, Northeast India. Clim. Risk Manag. 2023, 40, 100519. [Google Scholar] [CrossRef]
  58. Scoones, I. Sustainable Rural Livelihoods: A Framework for Analysis; IDS Working Paper 72; IDS: Brighton, UK, 1998. [Google Scholar]
Figure 1. Study area map.
Agriculture 13 02013 g001
Figure 2. Methodology for generation of risk map.
Agriculture 13 02013 g002
Figure 3. Urban and rural risk.
Agriculture 13 02013 g003
Figure 4. Risk map of Aizawl district.
Agriculture 13 02013 g004
Table 2. Risk categorisation.
Risk ScaleCategory
0 to 1 × 1 (0–1)No Risk
1 to 1 × 2 (1–2)Low Risk
2 to 2 × 2 (2–4)Moderate Risk
4 to 2 × 3 (4–6)High Risk
6 to 3 × 3 (6–9)Very High Risk
Table 3. Demographic and socio-economic conditions of the villages.
VillageHead of Household InformationCumulative Household Information
Gender (Male %)Average Age (Years)Education (%)Agriculture as Primary Occupation (%)Male (%)Female (%)Total (no.)Male Literacy (%)Female Literacy (%)Overall Literacy (%)AF as Primary Profession>125$ (%)Food Sufficiency (Months)AF Contribution to Income (%)
Kulikawn80.0060.9353.3366.6743.0156.996.20100.00100.00100.000.0012.0050.00
Maubawk80.0048.9353.3340.0045.2454.765.6092.7897.0094.8920.0011.8755.00
Hlimen86.6753.8746.6773.3346.1553.855.20100.00100.00100.0040.0010.6751.00
Samtlang60.0058.6086.6786.6754.8845.125.4796.6794.4495.5620.0012.0054.00
Muallungthu60.0054.8740.0066.6746.9153.095.4097.78100.0098.8933.339.4046.33
Aibawk80.0056.4046.6766.6751.8148.195.53100.00100.00100.006.6711.4758.00
Hmuifang73.3351.5333.3373.3351.1148.896.0097.7895.5696.6720.0010.7345.00
Table 4. Land resources and land use of the rural and urban villages. Here, AS, AH, ASH, and P represents agri-silviculture, agri-horticulture, agri-silvi-horticulture and plantations.
VillageTotal Land Availability (ha)Leased LandHome GardenOther Land Use
Total Area (ha)Irrigated Area (%)Land Use ComponentTotal Area (ha)Irrigated Area (%)Land Use ComponentTotal Area (ha)Irrigated Area (%)Land Use Component
Kulikawn0.860.2336.42ASH0.2981.48ASH0.3496.08AS, ASH, Horticulture
Maubawk0.890.1350.00Agriculture, ASH0.05100.00ASH0.7147.13AH, ASH, Teak P, Areca P, Oil palm P, Citrus P
Hlimen3.190.000.000.000.07100.00AH, ASH3.1229.96Jhum, AS, AH, SH, Areca P, Teak P, Sandal P, Bamboo based
Samtlang0.980.09100.00Agriculture 0.27100.00ASH0.6149.79AS, AH, ASH, Bamboo, Eryngium P
Muallungthu1.900.000.000.000.18100.00AH, ASH, Tea p1.7320.05Jhum, AS, AH, ASH, Tea P, Areca P
Aibawk1.810.2929.55AH, ASH0.14100.00AH, ASH1.3818.02Jhum, AS, AH, ASH, SH
Hmuifang0.880.0550.50AH, Agriculture0.08100.00Agriculture, ASH0.7571.68Jhum, ASH, Orange P, Rubber P, Banana P, Areca P
Table 6. Final risk model. Z = risk, X = elevation, and Y = distance from city.
ModelConstantsRP
aBc
Z = aX + bY + c0.003(−)0.02(−)0.7490.401<0.001
Disclaimer/Publisher’s Note: The statements, opinions and data contained in all publications are solely those of the individual author(s) and contributor(s) and not of MDPI and/or the editor(s). MDPI and/or the editor(s) disclaim responsibility for any injury to people or property resulting from any ideas, methods, instructions or products referred to in the content.

