Abstract
The subsurface pipe drainage project is essential in farmland drainage operations and is globally recognized as an effective saline–alkali land improvement measure owing to its efficient drainage capacity and low land occupation rate. This study aimed to establish enhanced methods for improving saline–alkali land by combining ditching with subsurface pipe drainage. The ditching was conducted at a depth of 60 cm based on the existing subsurface pipe arrangement. The calibrated DRAINMOD-S model was employed to simulate the test area with different ditching depths and subsurface pipe arrangement parameters. Furthermore, the law of soil water and salt transport in the subsurface pipe drainage system at different ditching depths was investigated. After ditching, the total unit drainage volume of leaching increased by an average of 14.65% over two years and the water storage of different soil layers in the different plots decreased by 1.37–1.48 mm on average. Ditching demonstrated a superior salt-leaching effect in areas with subsurface pipe layouts. The soil desalination rate of different soil layers increased by 6.40–13.40% on average, with a more significant impact on the surface soil desalination rate. The effect of the increased desalination rate was more apparent as the ditching depth increased. However, as the buried depth of the subsurface pipe increased, the relationship between the ditching depth and soil desalination rate became insignificant. Ditching improved the salt-leaching effect of subsurface pipe drainage projects, which can effectively reduce the cost of subsurface pipe burial, consequently promoting subsurface pipe use.
1. Introduction
Soil salinization poses a widespread problem globally, negatively impacting agricultural production. The area of global salinized soil is approximately 9.55 million km2 [1,2]. The Hetao Irrigation District, which is the largest irrigation district in Asia, also faces concerns regarding soil salinization caused by inadequate field facilities, imbalanced irrigation and drainage practices, and excessive fertilization [3,4]. However, various solutions have been proposed, including the application of organic or inorganic modifiers, and film mulching [5,6,7]. Among these, using large volumes of water to discharge excessive salt from the soil through a drainage system is widely employed. Commonly used drainage systems include aboveground open ditches and subsurface pipe drainage systems [8,9,10].
The subsurface drainage system serves the dual purpose of discharging excess water in the field in a timely way and reducing the groundwater level to prevent waterlogging disasters [11,12]. The optimization of subsurface pipe arrangement parameters, including subsurface pipe spacing, buried depth, and pipe diameter, has been a key research focus for improving saline–alkali land. Numerous studies have shown that smaller subsurface pipe spacing enhances the salt-leaching effect and that the desalination efficiency of soil above the subsurface pipes increases with greater buried depth [13,14]. Building upon traditional subsurface pipe research, improvements have been made to enhance the salt-leaching efficiency of subsurface pipes, reduce the environmental impact of subsurface pipe drainage, prevent excessive drainage, and improve the service life of the subsurface pipe to reduce operational costs. These enhancements include incorporating a sand and gravel filter above the subsurface pipe, installing control valves at the subsurface pipe outlets, customizing the drainage depth and timing of the subsurface pipes, and increasing drainage circulation facilities. These measures not only alleviate drought but also reduce the potential pollution risks associated with subsurface pipe drainage [15,16,17,18]. While these studies have yielded promising results, their wide-scale implementation is often limited by high costs or a lack of universality, preventing widespread adoption.
The effectiveness of subsurface pipe drainage in discharging water and salt from the soil is well known; however, the obstacle of the plow layer impeding water infiltration during drainage cannot be ignored [19]. Smooth infiltration of water from the surface to subsurface pipes is of utmost importance. Traditional tillage is widely used as an important management method in farmland planting. It can change the physical properties of the soil, making it more suitable for crop growth. While reducing soil bulk density, it can also break the plow layer and improve irrigation efficiency, thereby promoting water and nutrient absorption by crops [20]. Ditching broke the plow layer, facilitating the dissolution of salt in water and its entry into the subsurface pipe for smooth soil discharge. Furthermore, the combination of ditching and subsurface pipe drainage offered the advantage of not requiring additional equipment in farmland, making it cost-effective and suitable for various land types. However, determining the optimal ditching depth was difficult. Shallow ditching may not sufficiently improve water infiltration efficiency, and deep ditching may lead to excessive soil moisture loss and an elevated risk of soil erosion. Furthermore, relying solely on field experiments to elucidate the influence of ditching depth on the law of water and salt transport in subsurface pipe drainage proved difficult. Nevertheless, the successful application of the numerical models in this study compensates for the limitations in field experiments.
Several numerical models have been employed in the study of subsurface drainage systems, such as HYDRUS, SWAT, and DRAINMOD [21,22,23,24]. HYDRUS demonstrates strong performance in simulating agricultural soil water and salt content, allowing for flexible adjustment of boundary conditions to achieve a more accurate simulation of soil water and salt transport processes [25]. The SWAT model can be used to develop effective land and water management strategies in salinized areas while simulating ion transport in subsurface drainage [26]. DRAINMOD, specifically developed for subsurface drainage, has significant advantages in subsurface drainage-related research. It features simple input methods, fewer required parameters, and accurate simulation accuracy. Its successful application in the study of water, salt, and nutrients under subsurface drainage conditions has been widely recognized by scholars [27,28].
This study will combine the DRAINMOD-S model to study the law of water and salt transport in the subsurface pipe under the condition of ditching, and provide data support for combining ditching with subsurface pipes to improve saline–alkali land. These results hold significance for the efforts directed towards utilizing subsurface pipes to improve saline–alkali land.
2. Materials and Methods
2.1. Study Region
The experiment was conducted in the comprehensive improvement test base (40°45′28″ N, 108°38′16″ E) of subsurface drainage saline–alkali land, situated at the Urat irrigation area of Hetao Irrigation District, Inner Mongolia, China. The experimental site falls within a temperate continental climate in an arid and semi-arid area. The annual average sunshine is 3230.9 h, with annual precipitation ranging from 196 to 215 mm and annual average evaporation of 2172.5 mm. Precipitation is mainly concentrated during the rainy season, from June to August. Owing to the significantly lower rainfall compared to evaporation, irrigation plays a vital role in agricultural production in this region. The local irrigation water is sourced from the Yellow River, with a salt concentration of 0.67 g·kg−1. The timing of irrigation depends on the inflow of the Yellow River. The soil at the test site is mainly composed of silt and silty loam and has a fine texture resulting from long-term irrigation and siltation from the Yellow River water. In addition, owing to improper irrigation practices and poor drainage systems, the site had been abandoned for many years prior to the subsurface pipe test. The average soil salinity in the 0–100 cm soil layer is 15.93 g·kg−1, indicating severe saline–alkali soil conditions. The soil parameters for each soil layer are listed in Table 1.

Table 1.
Physical and chemical characteristics of soil at experimental site.
2.2. Experimental Design
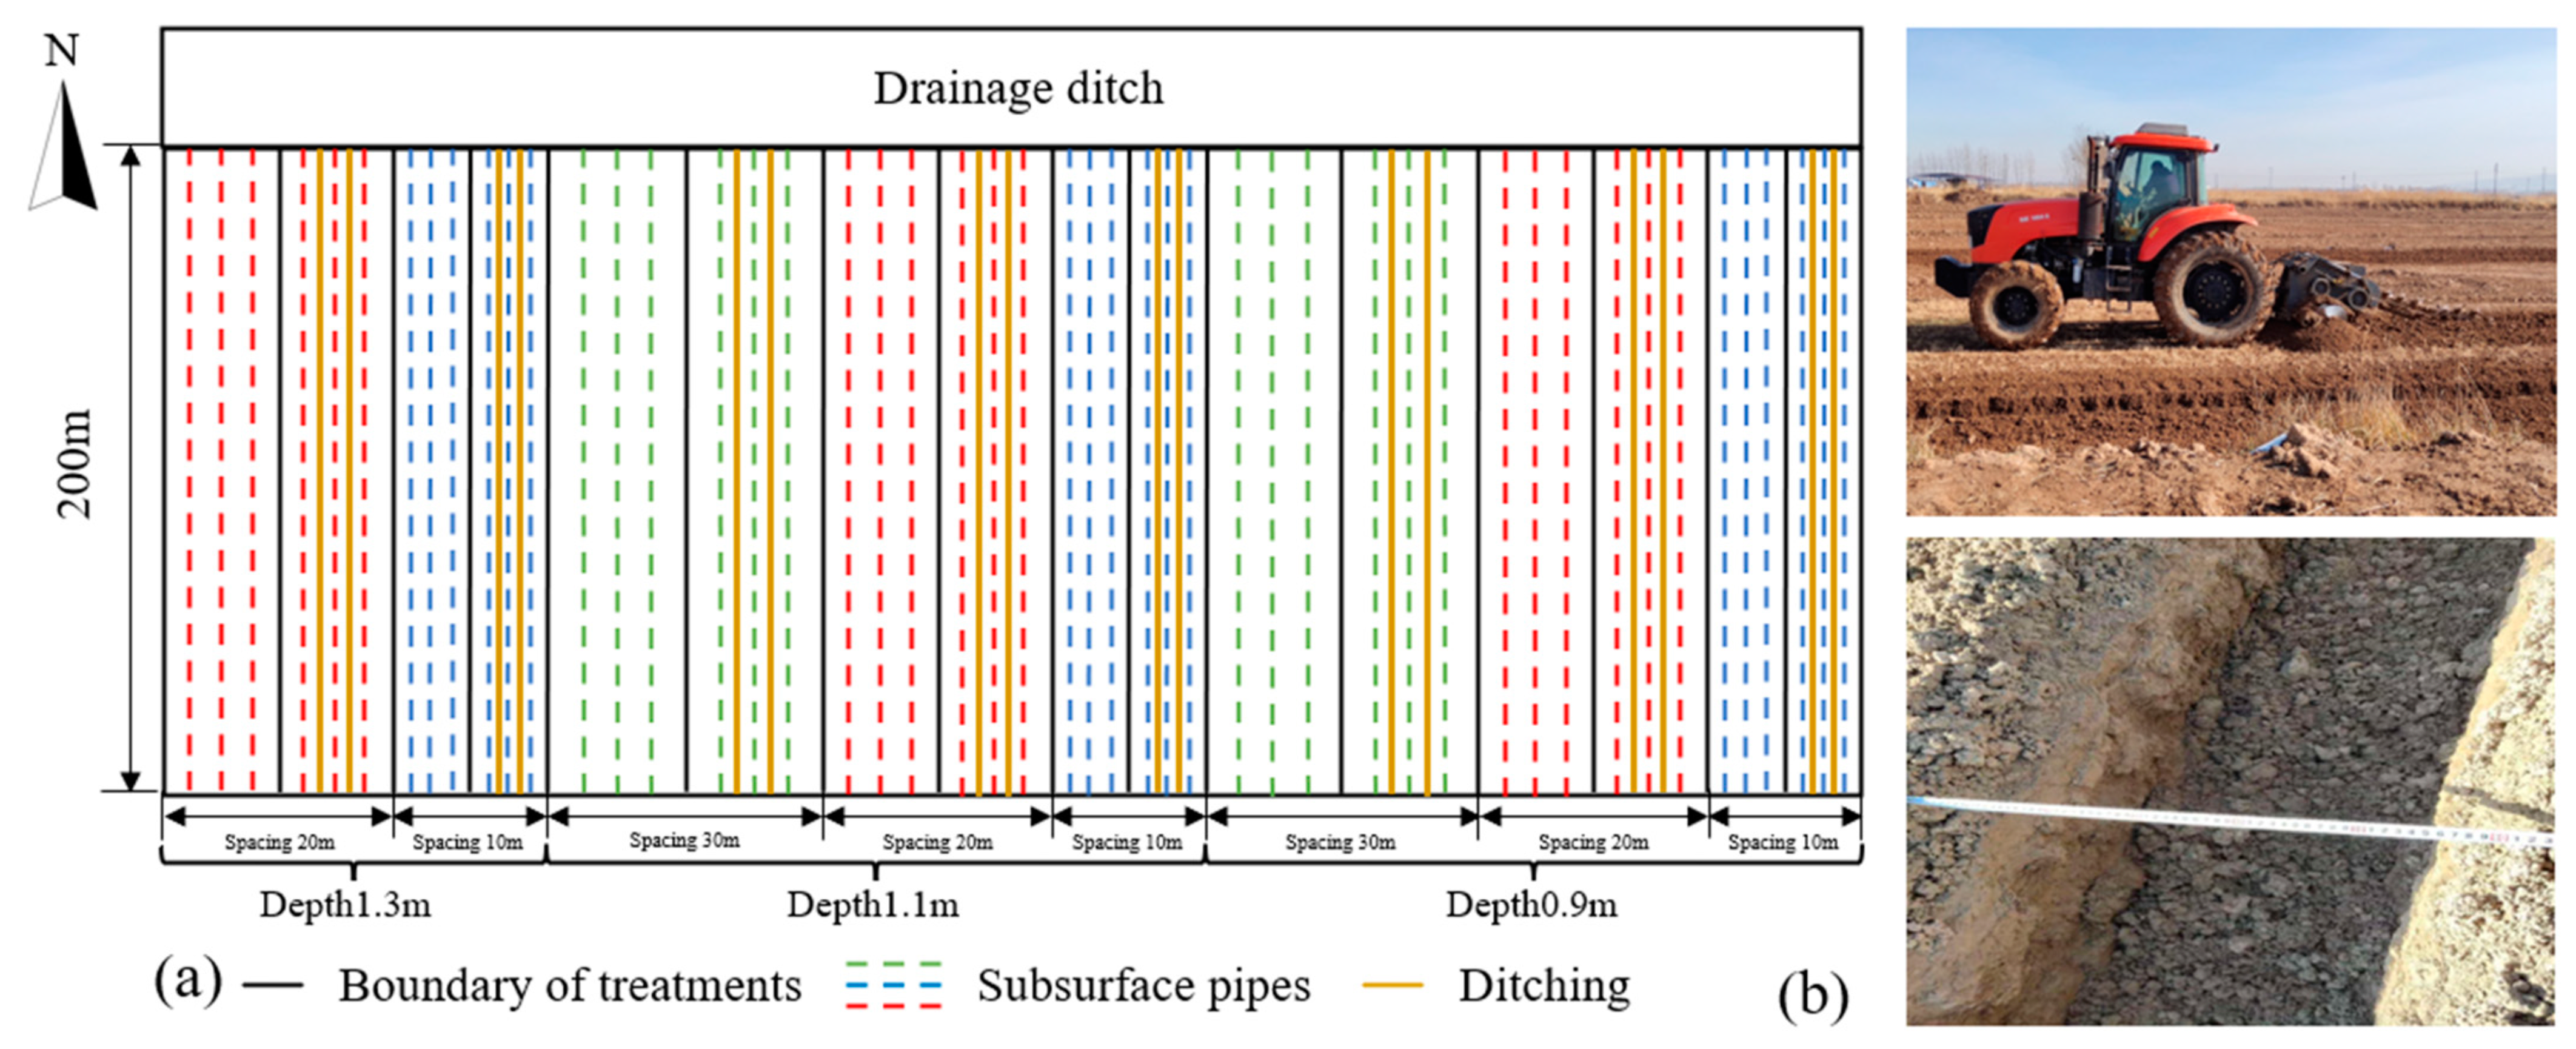
In the comprehensive improvement base of subsurface pipe drainage, a plot with a uniform soil salt distribution was selected as the core test area for the subsurface pipe drainage study. A subsurface pipe with a diameter of 8 cm and length of 200 m was laid north and south of the test area, and the slope of the subsurface pipe was 1‰. A chain opener (JG-200, Jingang Machinery Factory, Jining, China) was then used to create a ditch between the two subsurface pipes in each test area. The ditch width was 60–80 cm and the depth was approximately 60 cm (P60). Three different buried depths (0.9 [D0.9], 1.1 [D1.1], and 1.3 m [D1.3]) and three different pipe spacings (10 [S10], 20 [S20], and 30 m [S30]) were used in the core test area. After employing an orthogonal combination approach, a total of 9 test cells were established, each laid with three pipes. However, owing to construction limitations, the plot with a spacing of 30 m and a buried depth of 1.3 m could not be used; therefore, it was excluded from the remaining treatments. Each treatment included two groups of experimental plots under different ditching conditions. One group had a ditch between two subsurface pipes, whereas the other did not include a ditch. These two groups, totaling 16 experimental plots, were compared to study the effect of ditching on soil water and salt transport in subsurface pipe drainage, as shown in Figure 1.

Figure 1.
(a) Schematic diagram of subsurface drainage pipe layout of each treatment and (b) ditching site in the experiment area.
From 2019 to 2020, each experimental plot was irrigated seven times, according to the designed irrigation quota. The irrigation amounts varied as follows: 1500 m3·ha−1 (26 June 2019; 17 July 2019), 2500 m3·ha−1 (28 June 2020), 3000 m3 ha−1 (15 May 2019; 25 October 2019), and 3500 m3·ha−1 (3 May 2020; 19 October 2020). Owing to the flat terrain of the test area and the use of laser leveling, the surface water was evenly distributed on the soil surface during the water infiltration period. Additionally, there was a 1 m high ridge around the test field. The only drainage method was an underground pipe system, which was used to prevent the formation of surface runoff and facilitate discharge. Soil sampling was conducted before each irrigation and within 24 h after the end of drainages. The sampling points were positioned between the two subsurface pipes in each test plot and soil drills were used to extract soil samples at 20 cm intervals, reaching a depth of 1 m. Groundwater level observation wells were arranged around the soil sampling points, and the soil samples were collected while the groundwater level was measured using a meter scale and a lead hammer. Daily drainage water was collected at the outlet during the drainage period and the daily drainage water volume was recorded using a water meter (LXS-15, Ningbo, China) installed at the outlet. The collected soil samples were transported to the laboratory to determine the electrical conductivity measured on a 1:5 soil-to-water ratio basis (EC1:5), soil texture, bulk density, water content, and soil water characteristic curve. Additionally, the EC of the water sample was determined. The soil texture analysis was performed using a laser particle size analyzer (HELOS-OASZS, SYMPATEC, Clausthal-Zellerfeld, Germany). The soil moisture content was obtained by drying the collected soil samples [29]. The soil moisture content of each layer was utilized to calculate the soil water storage of each layer using Formula (1), which allowed for the recording of water changes in each soil layer. Some soil samples were air-dried, ground, and passed through a 1 mm sieve to prepare a 1:5 extract. After shaking and stirring for 5 min at room temperature (23–28 °C) and allowing it to stand for 24 h, the EC1:5 value was measured using a conductivity meter (DDS-307 A, REX, Shenzhen, China). The relationship between soil salt content and EC1:5 after calibration using the slag method was used to convert the measured EC1:5 value into soil salt content [30]. The soil desalination rate was introduced as an evaluation index for the desalination performance of the subsurface pipes to facilitate the analysis of the soil salt changes in each experimental plot during the test period [17].
where Wi represents the water storage of the i soil layer (mm); ρi denotes the value of dry bulk density of the i layer of soil layer; di is the thickness of the i soil layer (cm); and ωi is the gravimetric moisture content of the i layer (g·g −1). The soil water storage of five soil layers (0–20 cm, 20–40 cm, 40–60 cm, 60–80 cm, and 80–100 cm) at the different depths of unit area (1 cm2) between the two subsurface pipes was calculated. The ρi and ωi in the formula are taken from the soil samples collected in the field to bring back the data on bulk density and gravimetric moisture content of each layer of soil measured in the laboratory, and di is taken as 20 cm according to the design stratification.
2.3. DRAINMOD-S Model
2.3.1. Model Fundamentals and Input Data
In this study, the soil parameters of each soil layer in the DRAINMOD model were adjusted and calibrated to simulate the drainage process of the subsurface pipe under different ditching depths to assess the influence of ditching on the water and salt transport law in subsurface pipe drainage, and elucidate the changes in this law under different ditching depths. The DRAINMOD-S model (Version 6.1), developed based on the field water and salt balance equation, can simulate the transformation and transport of groundwater level, soil salinity, and nitrogen in the soil by inputting soil, meteorology, field drainage system, and crop data [27]. Daily rainfall and minimum and maximum temperatures were all derived from the micro-meteorological station (HOBO-U30) set up at the experimental site. Evapotranspiration (ET) was calculated using the Penman–Monteith formula based on factors such as solar radiation and other parameters. Soil data, including saturated hydraulic conductivity, were mainly obtained from laboratory measurements [31]. The drainage depth and spacing of the field drainage system depended on the buried subsurface pipe parameters in each test area. When calibrating the model, combined with previous studies [32], it was found that the transverse saturated hydraulic conductivity parameter is the most sensitive parameter, followed by impervious layer depth, maximum surface water storage depth, drainage coefficient, and initial groundwater level depth. The values of the parameters after checking are shown in Table 2. The water balance calculation of the model was divided into surface and subsurface situations (Equations (2) and (3)).
Table 2.
The key input parameters of DRAINMOD-S model after calibration.
Because the DRAINMOD-S model is a quasi-two-dimensional model, it only simulates the water and salt changes at different depths at the middle point of the subsurface pipe. The left and right boundary conditions are only controlled by the buried spacing of the subsurface pipe during the model input process. The spacing of the subsurface pipe is input according to the actual situation of the test cell. In the simulation of above-ground water balance (Equation (2)), the upper boundary is the atmosphere, the lower boundary is the surface. In the simulation of water balance under the surface (Equation (3)), the upper boundary defaults to the surface and the lower boundary is the underground relatively impermeable layer or aquitard.
The DRAINMOD-S model takes the calculation results of the water balance simulation as the known input in the salt simulation prediction. The meteorological, soil, crop, and other data needed to be input are exactly the same as those in the water simulation. In the simulation, only the salt simulation parameters and the initial soil profile salt content need to be input. The salt simulation parameters and the initial soil profile salt content are from the field measured values and calculations. In the unsaturated case, the salt transport approximately follows the Fick law, considering that the saturated–unsaturated soil water and salt transport are mainly in the vertical direction. One-dimensional convection–dispersion reaction equation was used to simulate salt transport (Equation (4)).
where ΔW is the change in surface water storage (cm); P is the precipitation (cm); I is the irrigation quantity (cm); F is the infiltration amount (cm); RO is the surface runoff (cm); ΔVa is the change of water content of anhydrous pore space in soil profile (cm); D is the subsurface displacement (cm); ET is the evapotranspiration (cm); and VLS is the vertical and lateral flow (cm).
where θ is soil moisture content (cm3·cm−3), Dsh is the hydrodynamic dispersion coefficient (cm2·h−1), C is the concentration of soil salt solution (g·L−1), z is the soil depth coordinate (cm), t is irrigation time (h), and q is the soil water flux, namely the soil penetration rate (cm·h−1).
2.3.2. Calibration and Validation of the DRAINMOD-S Model
The soil salt content from 14 experimental plots in 2019 were used for calibration, and the fitting results were closely matched to the measured values by adjusting the lateral saturated hydraulic conductivity of the soil and the maximum water storage depth of the surface. The calibrated model was then used to simulate and predict the soil salt content of 14 communities in 2020, which were then verified. To evaluate the accuracy of the simulation of the model, different criteria were employed, including decisive coefficient (R2), mean absolute error (MAE), and root mean square error (RMSE). Based on the simulation of the existing subsurface pipe arrangement and ditching conditions, the calibrated model was used to simulate and predict ditching depths of 20 cm and 40 cm (P20 and P40, respectively).
where Ai is the simulated value, is the averaged simulated value, Oi is the observed value, is the averaged observed value, and n is the sample size.
3. Results
3.1. The Law of Soil Moisture Migration under Ditching Conditions in Different Subsurface Pipe Plots
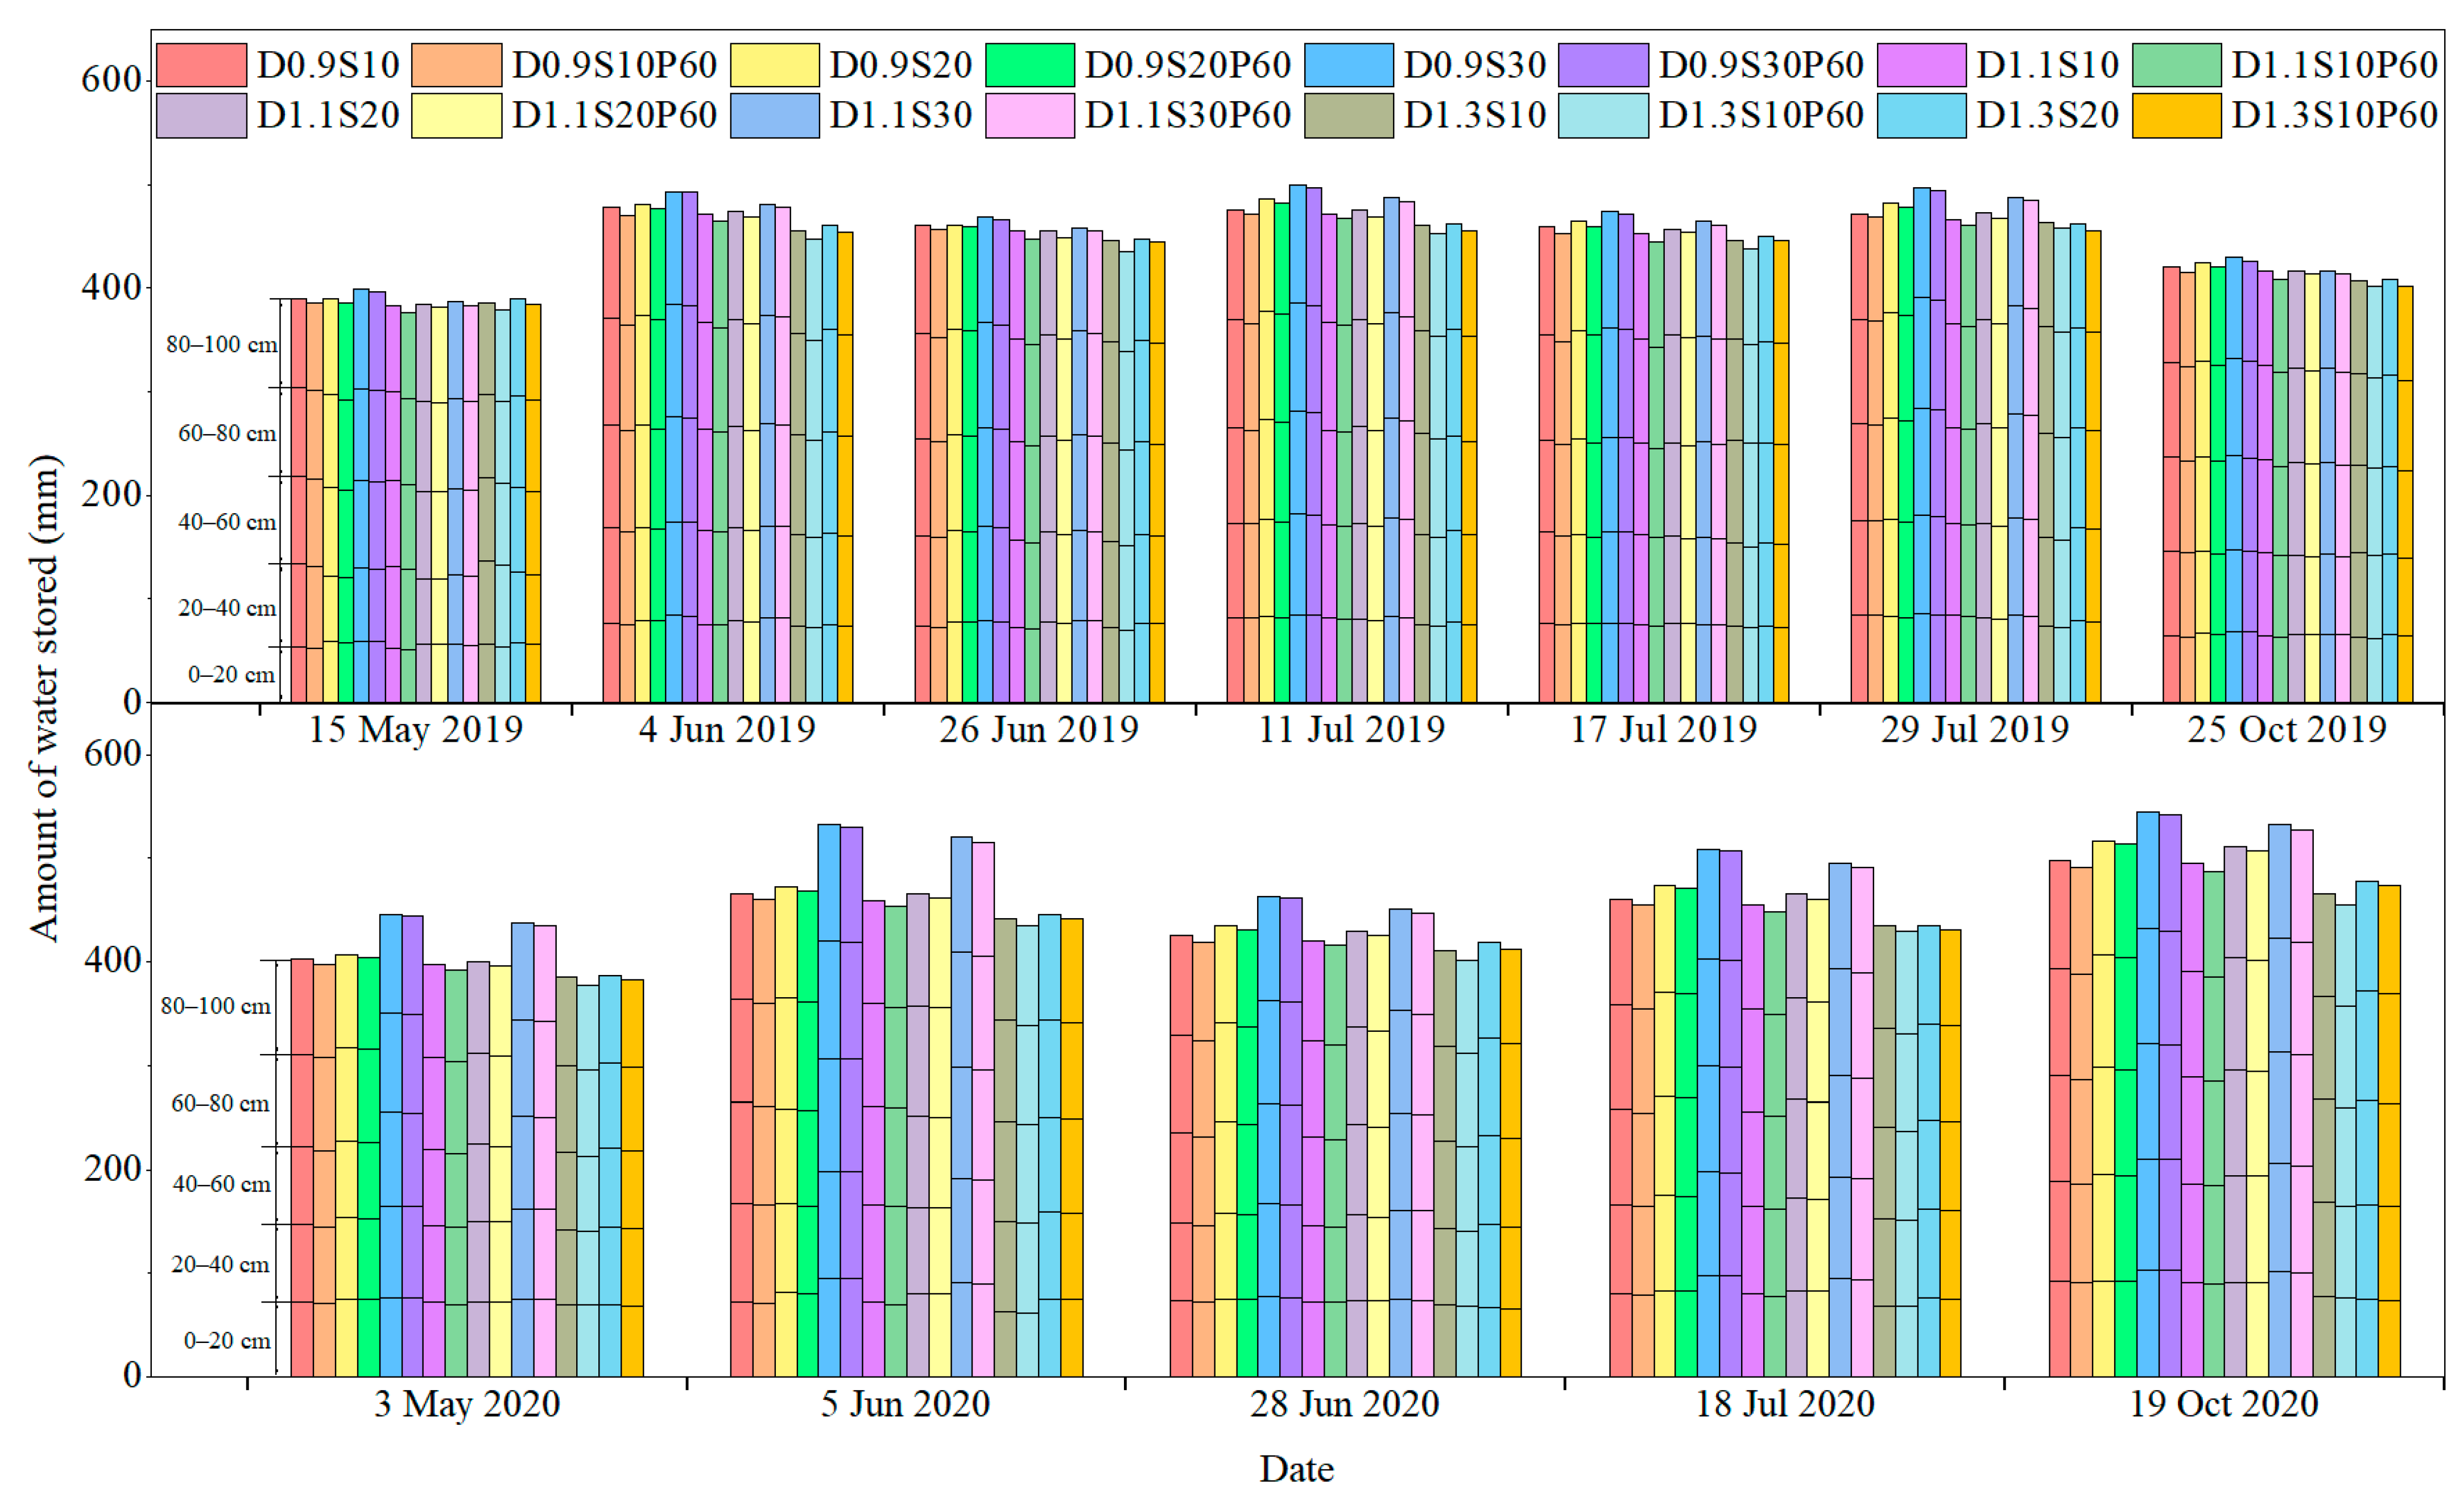
The soil water storage was calculated after the actual measurement of different soil layers in each plot before and after seven leaching cycles from 2019 to 2020 (Figure 2). Regardless of whether ditching was conducted, the soil water storage gradually decreased with an increase in the buried depth of the subsurface pipe or a decrease in spacing. In the non-ditching plot with the same buried depth, the water storage of the 0–100 cm soil layer increased by 6.00–23.06 mm on average for every 10 m increase. In the ditching plot, the water storage of the 0–100 cm soil layer increased by 3.45–22.09 mm on average for every 10 m increase. Considering plots with the same spacing, each 0.2 m increase in buried depth led to an average decrease of 5.28–13.78 mm and 6.11–14.19 mm in the water storage capacity of the 0–100 cm soil layer for non-ditching and ditching plots, respectively. These observations indicate that increasing the buried depth of the subsurface pipe or decreasing the spacing will increase the drainage capacity of the subsurface pipe and that the ditching operation will further strengthen this ability, leading to a more pronounced decrease in soil water storage capacity. Upon comparing the water storage of different soil layers in the ditching and non-ditching plots, a difference of approximately 0.94–0.98 mm was observed from the surface to the deep soil layers. Ditching reduced the water storage of each soil layer in the 0–100 cm soil layer, with the 60–100 cm deep soil layer being more affected by ditching than the surface 0–40 cm soil layer.
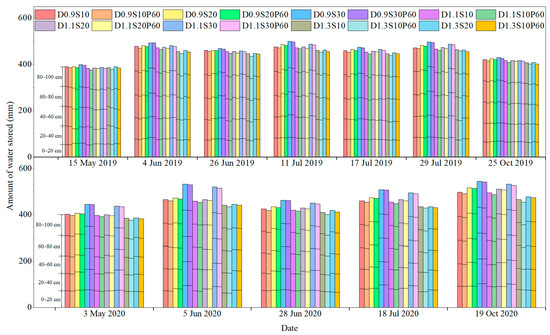
Figure 2.
Soil water storage in different soil layers before and after leaching in each experimental plot from 2019 to 2020. D (m), depth of subsurface pipe; S (m), spacing of subsurface pipe; P (cm), depth of ditching.
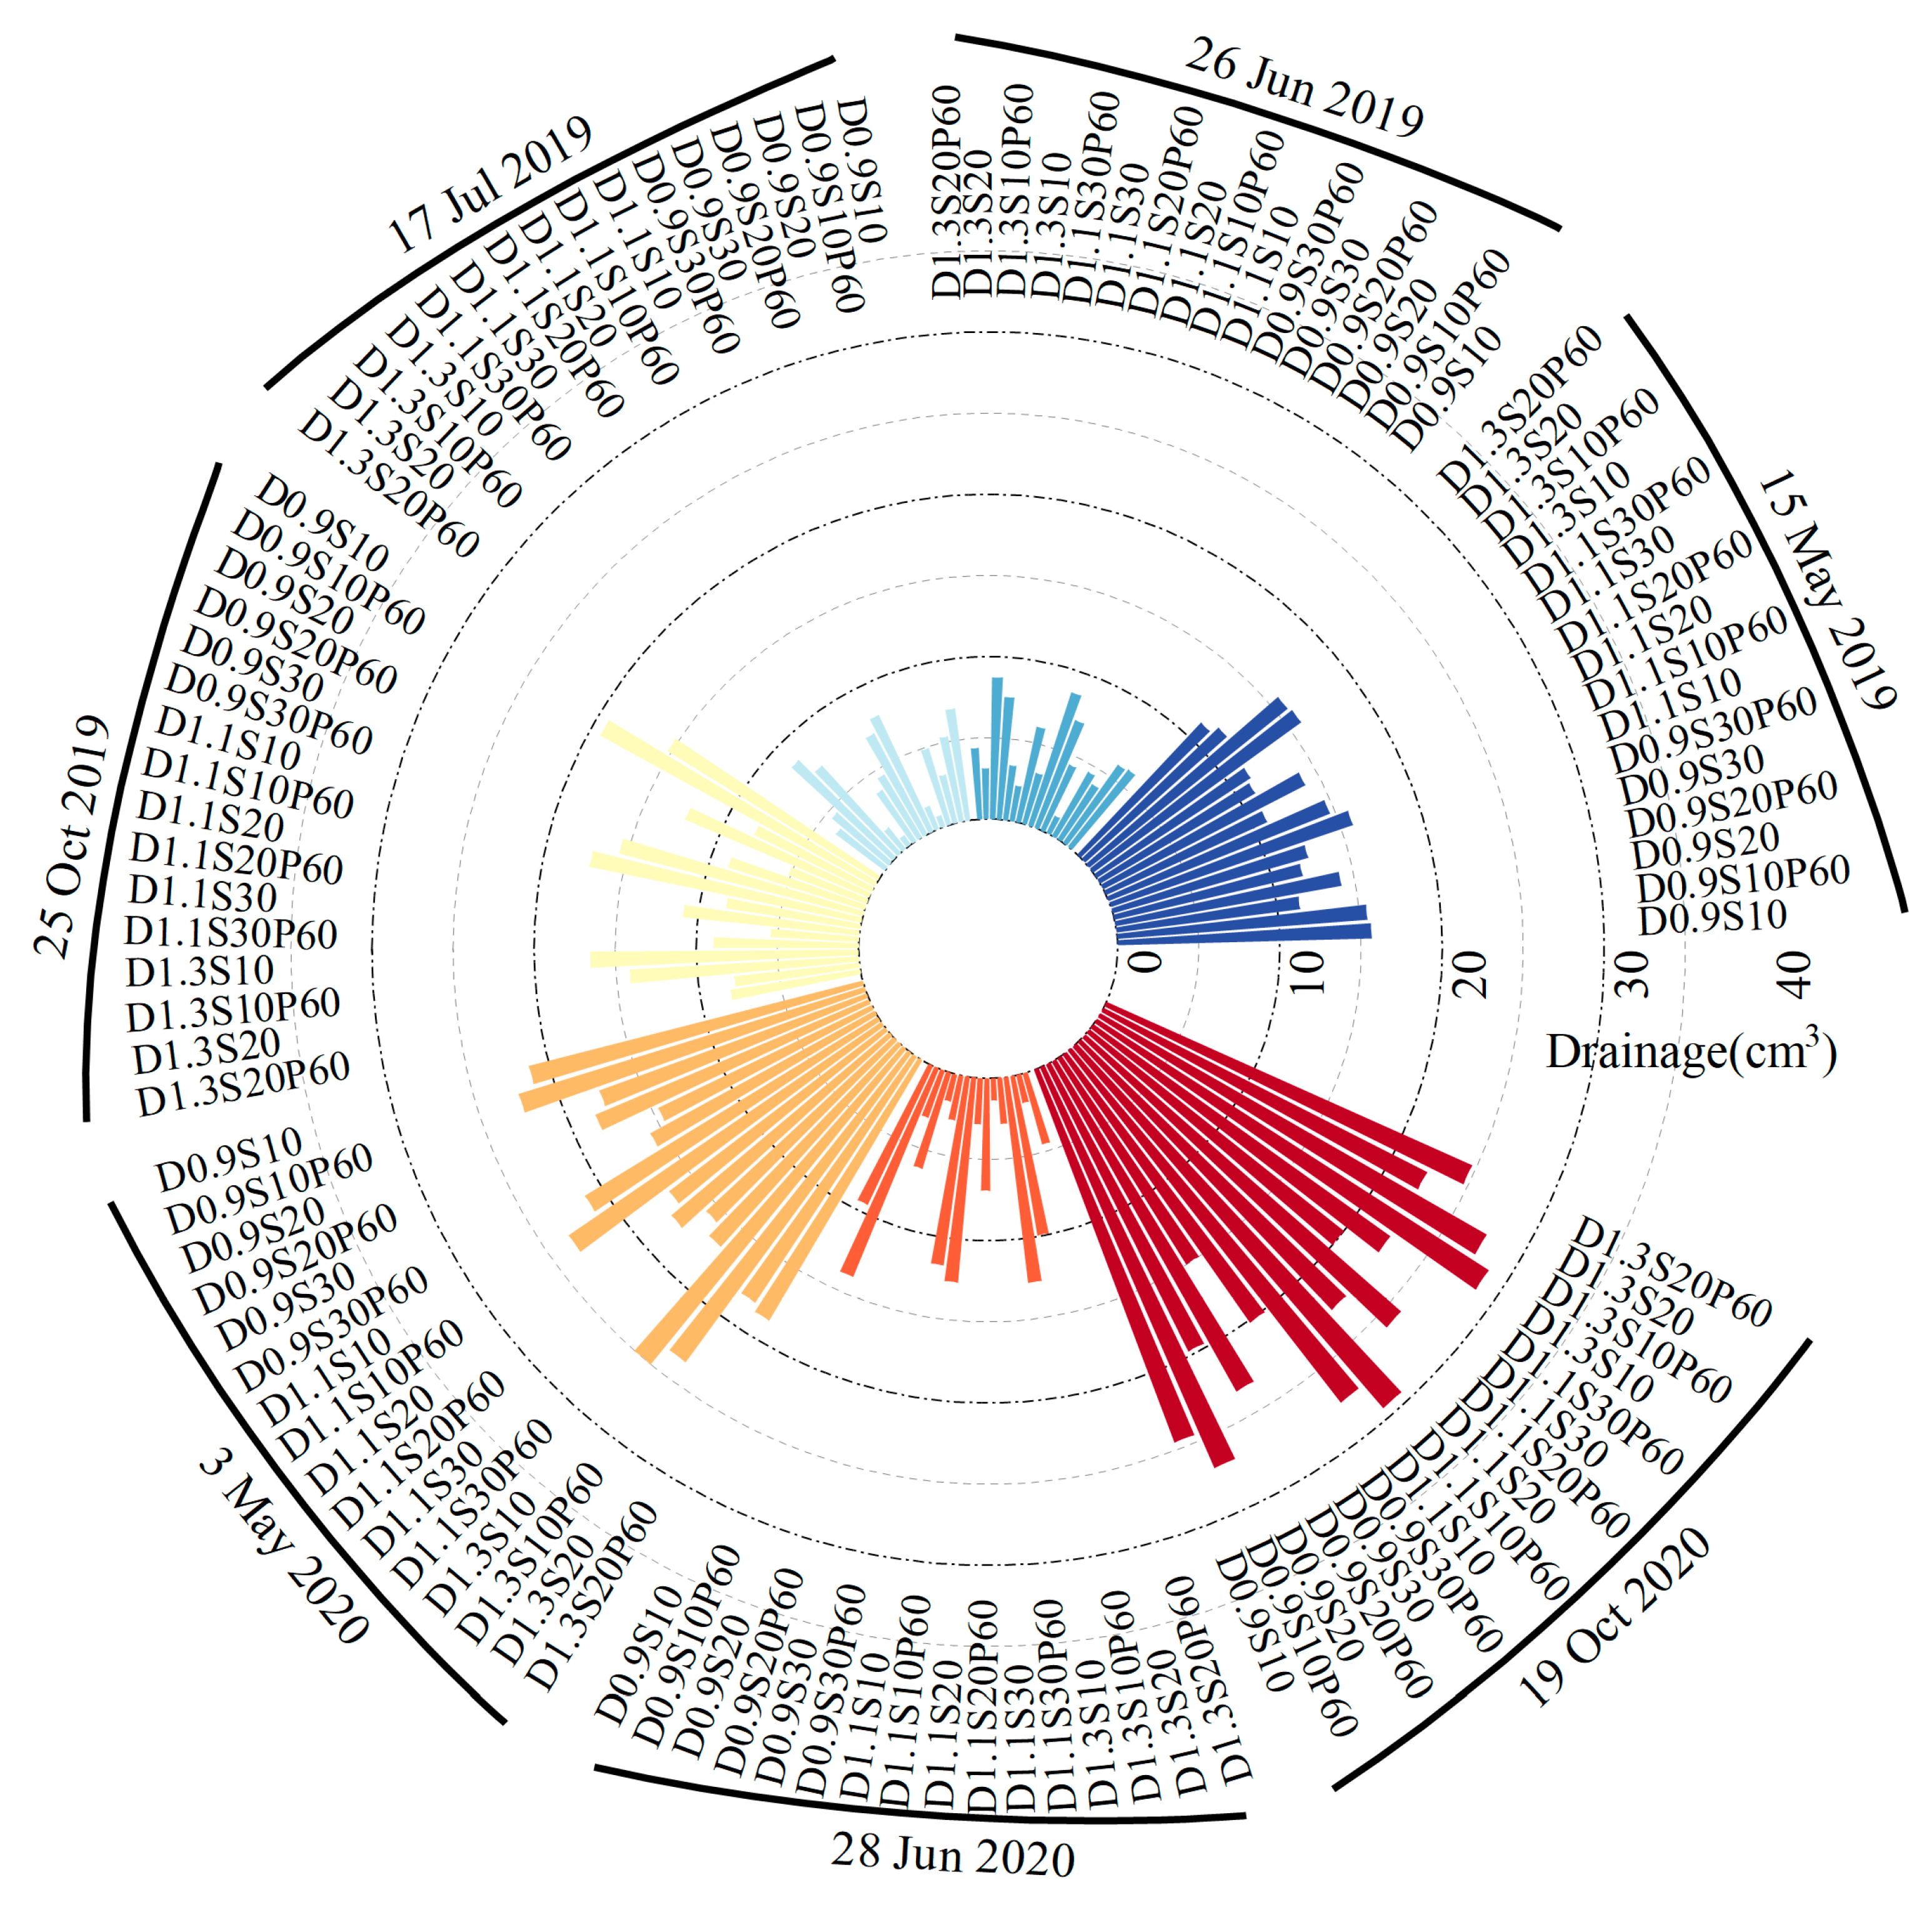
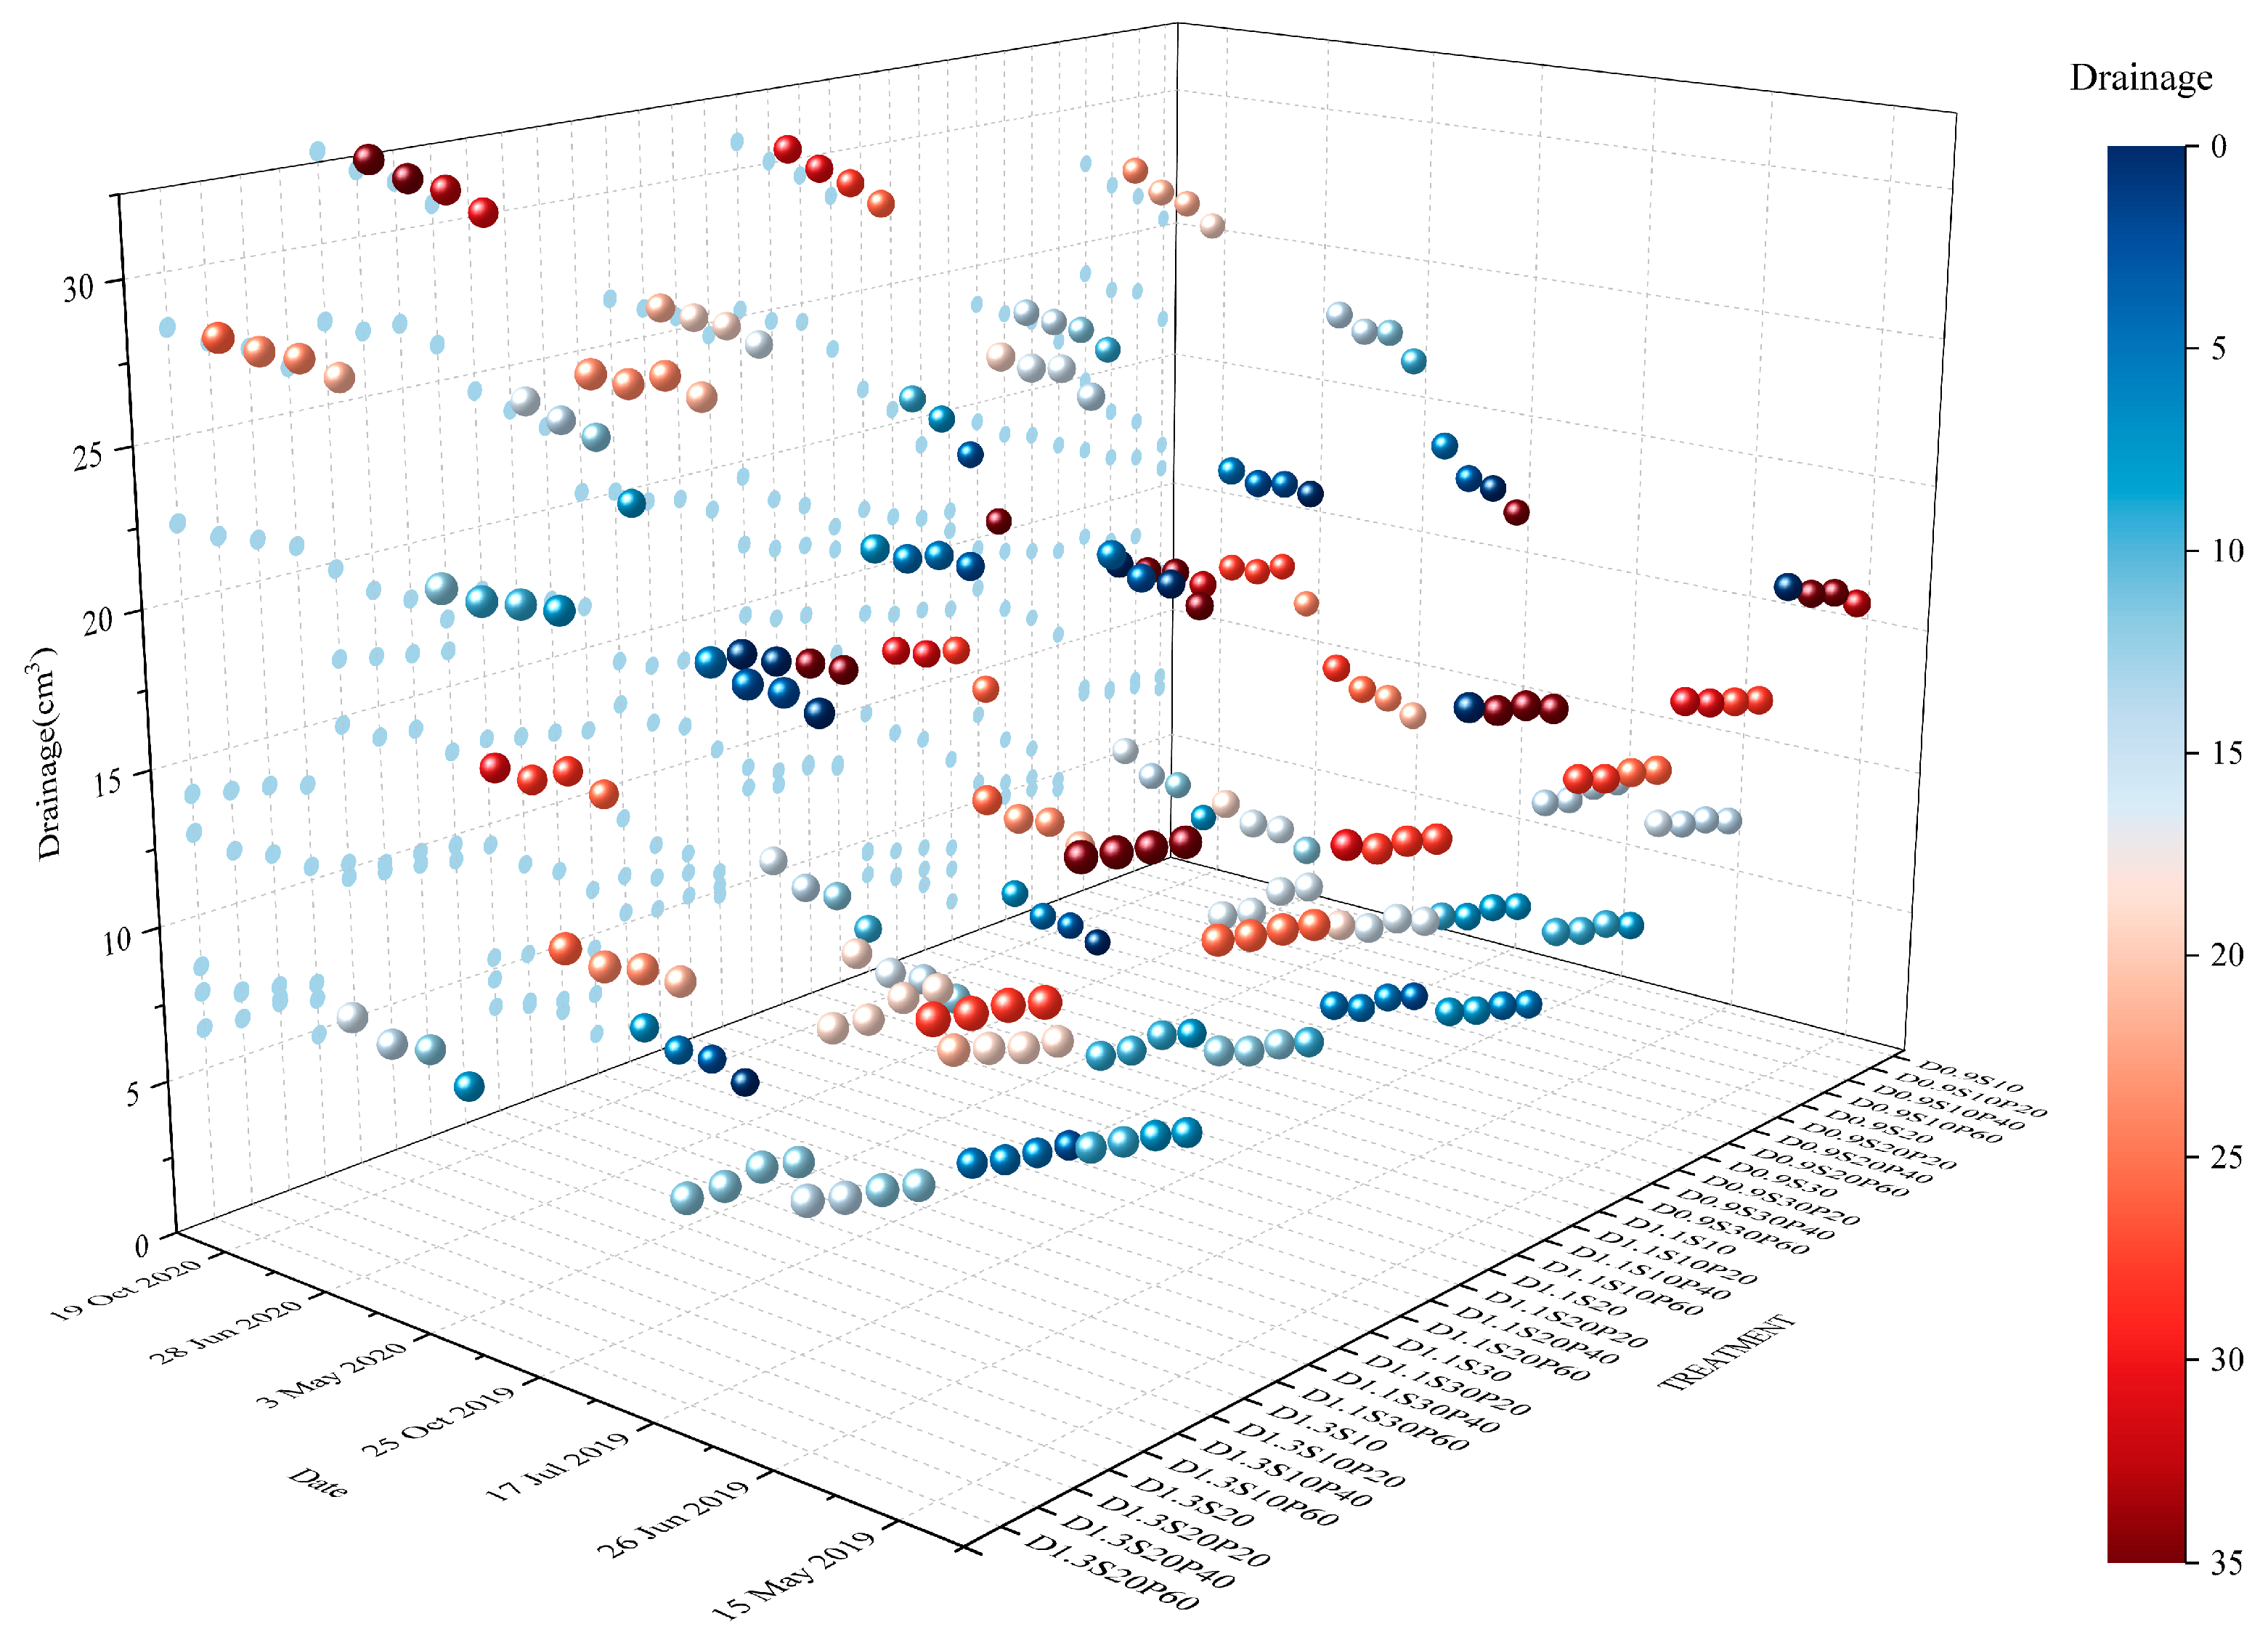
In this study, the ditching operation conducted in the subsurface pipe layout area had an effect similar to that of traditional deep tillage. Upon comparing the total drainage volume of ditching and non-ditching plots over two years, it was observed that the total drainage volume of the ditching plots was higher than that of the non-ditching plots. The drainage volume of the plots with the same subsurface pipe arrangement increased by 14.65% on average after ditching (Figure 3), indicating that incorporating ditching in the subsurface pipe drainage area can effectively improve the drainage capacity of the subsurface pipe.
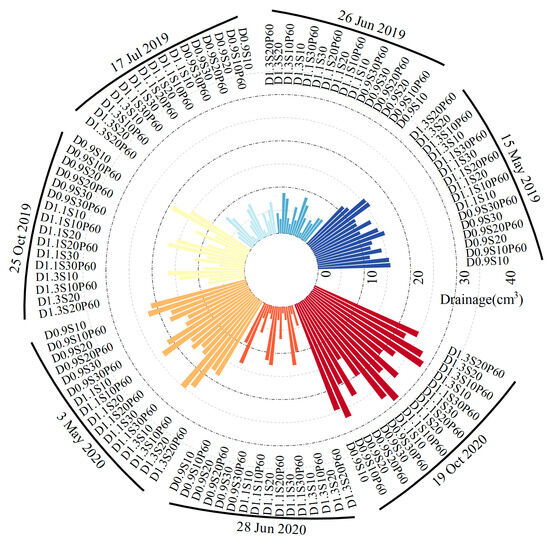
Figure 3.
The amount of subsurface pipe drainage after leaching in each test area from 2019 to 2020. D (m), depth of subsurface pipe; S (m), spacing of subsurface pipe; P (cm), depth of ditching. (The same color represents the drainage data of the same leaching test.)
3.2. Desalination Law of Soil under Ditching Conditions in Different Subsurface Pipe Plots
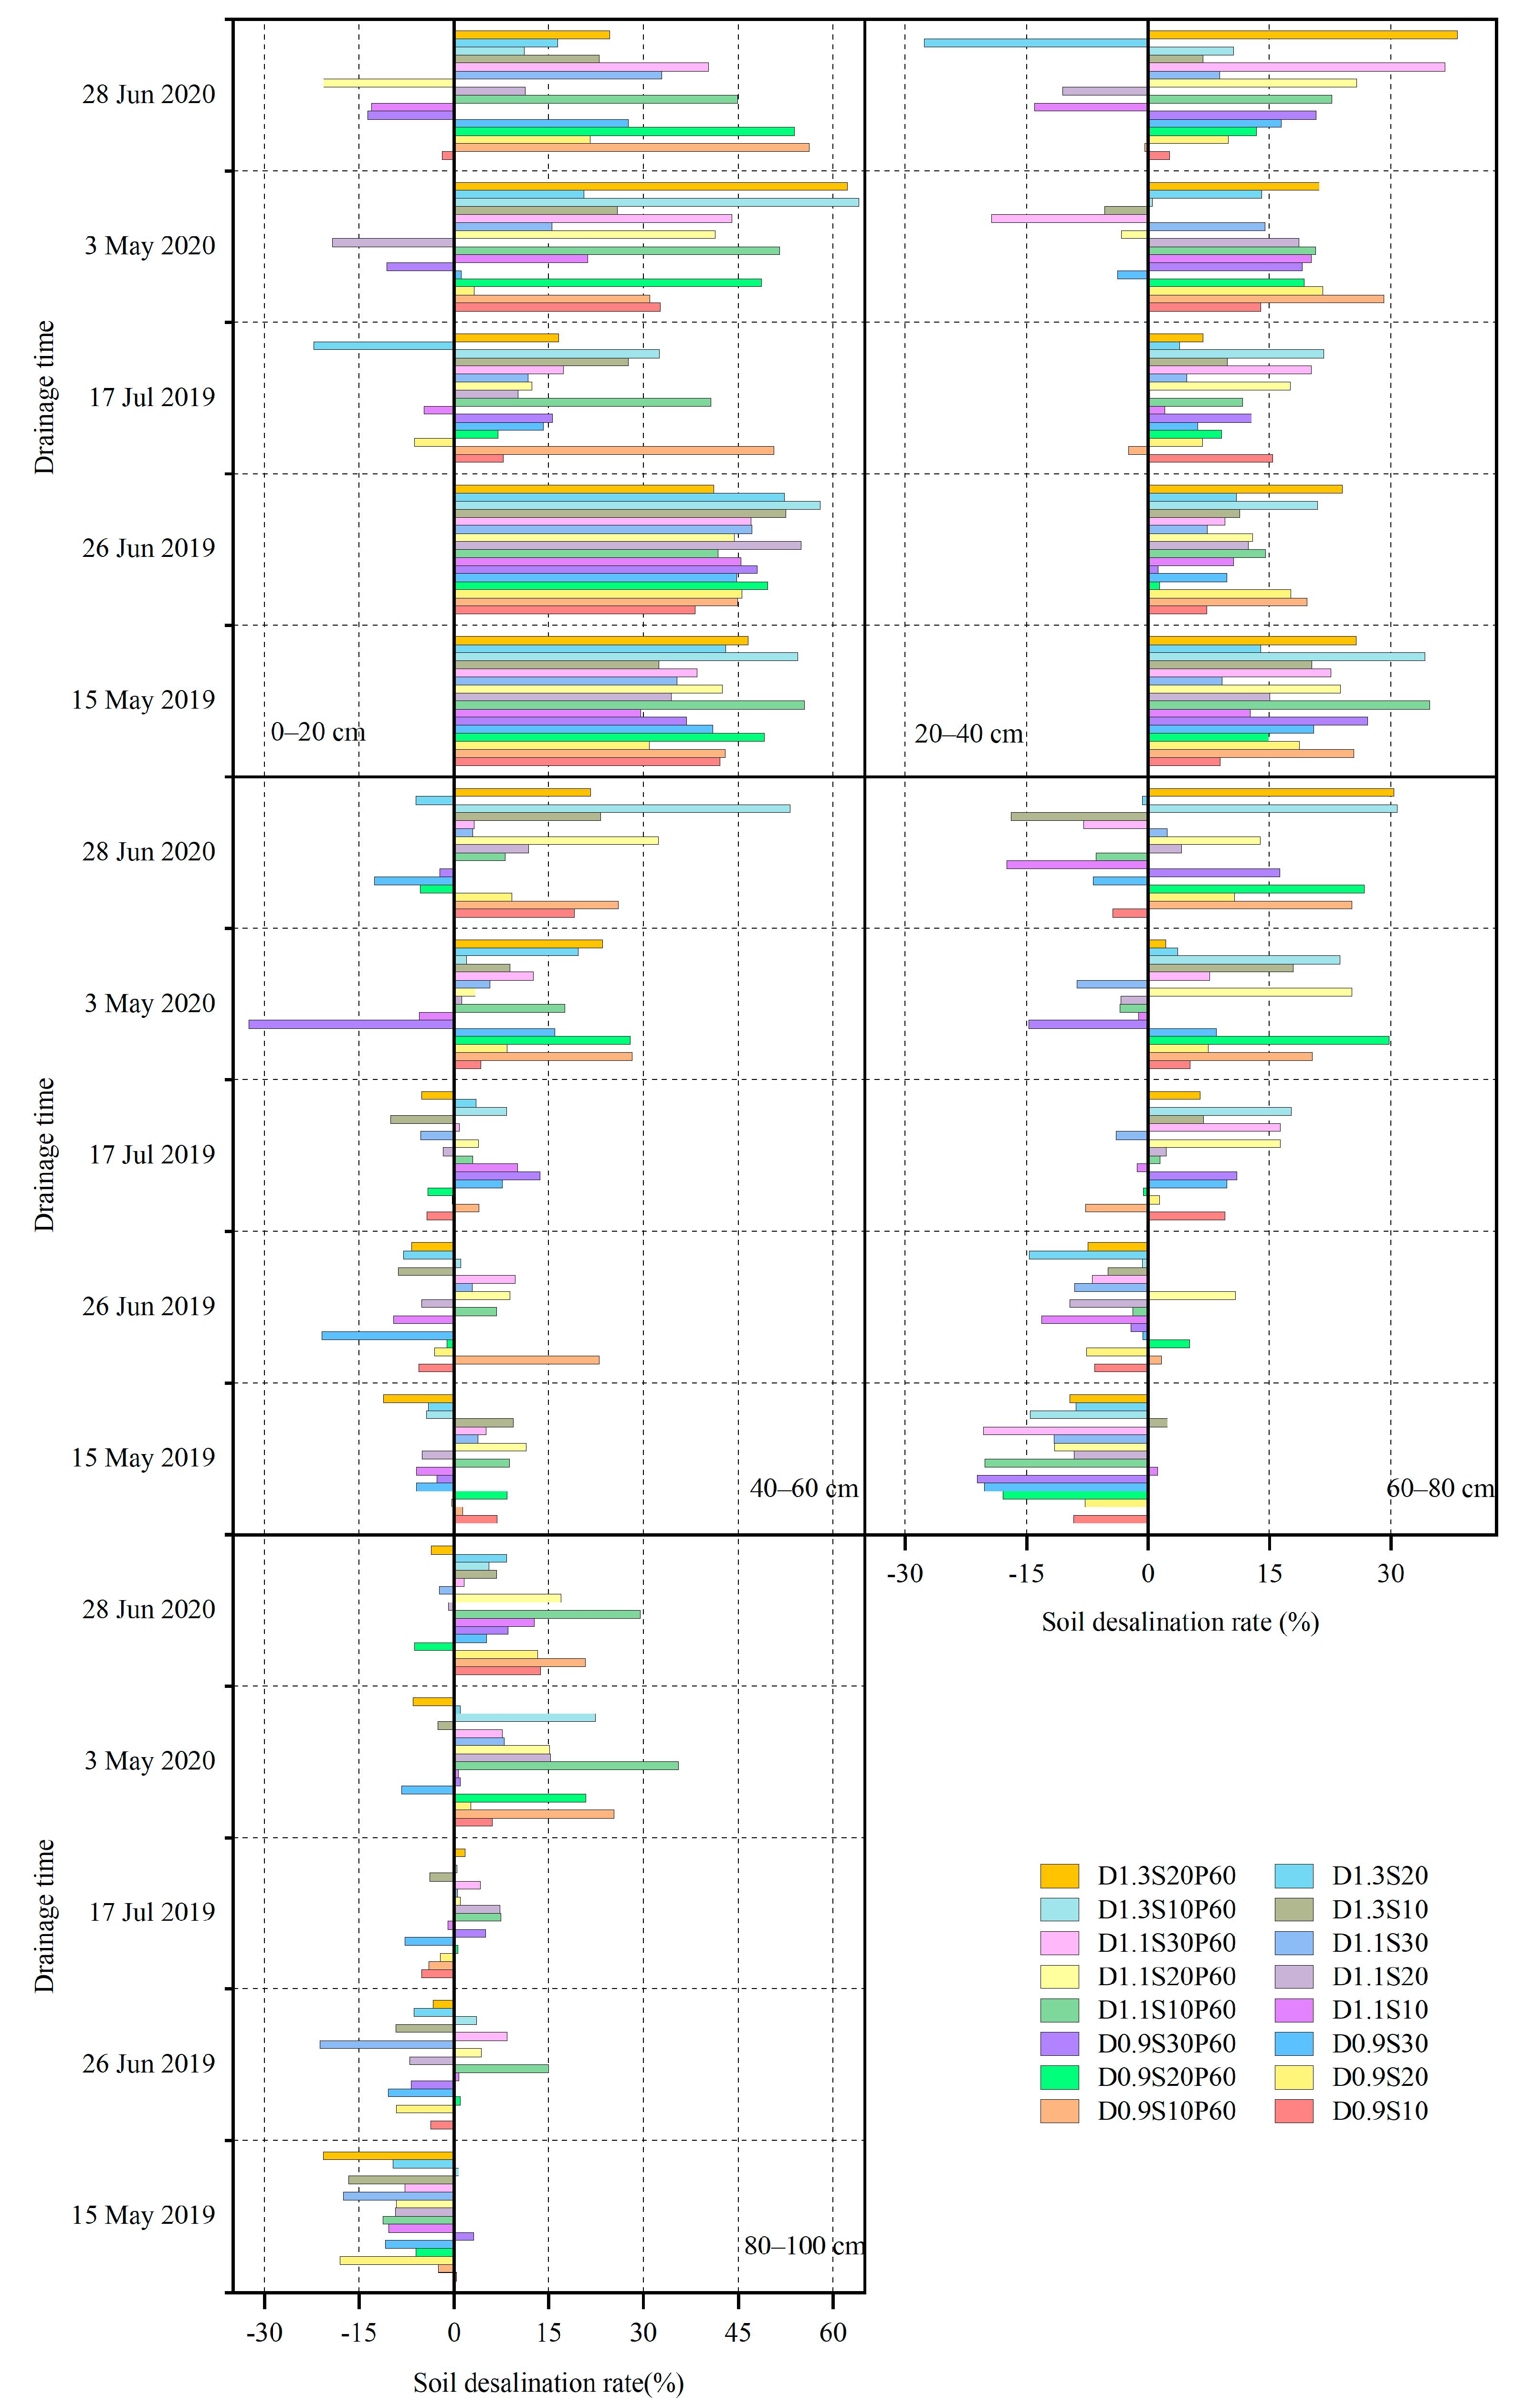
Figure 4 shows the measured desalination rate of each soil layer after the leaching test conducted in the field test area from 2019 to 2020. All plots exhibited a desalination trend after two years of leaching. The average desalination rate of each soil layer after each leaching event in the ditching and non-ditching plots were 5.32–18.33% and 2.78–8.26%, respectively. Under the same subsurface pipe layout parameters, the average soil desalination rate of the ditching plot was 0.52–14.35% higher than that of the non-ditching plot. This indicates that the implementation of ditching enhances the effectiveness of the subsurface pipes in soil desalination. When the pipe buried depth was the same, the improved soil desalination effect through ditching decreased gradually with an increase in spacing. For a buried depth of 0.9 m, the soil desalination rate in the ditching plot was higher than that in the non-ditching plot, decreasing from 10.61% at 10 m to 0.52% at 30 m. For a buried depth of 1.1 m, the soil desalination rate of the ditching plot was higher than that of the non-ditching plot, decreasing from 14.35% (10 m spacing) to 6.30% (30 m spacing). For a buried depth of 1.3 m, the soil desalination rates of the ditching plots were 10.04% (10 m spacing) and 8.63% (20 m spacing) higher than those of the non-ditching plots. However, when the spacing of the underground pipes in the plot was the same, with a change in the buried depth of the underground pipes, the improved soil desalination rate by the influence of ditching did not show a similar trend.
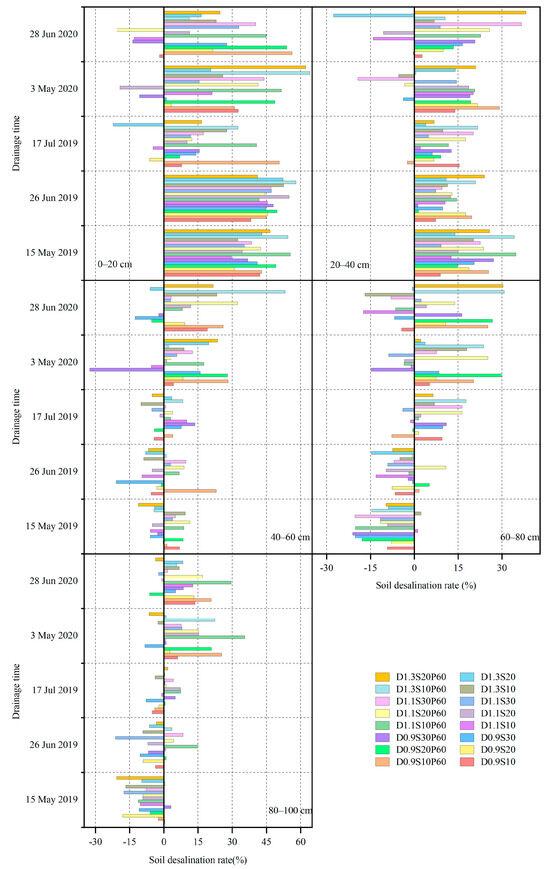
Figure 4.
The soil desalination rate of each soil layer after leaching in each experimental plot from 2019 to 2020. D (m), depth of subsurface pipe; S (m), spacing of subsurface pipe; P (cm), depth of ditching.
Upon comparing the soil desalination rate of each soil layer in each plot, the average soil desalination rates of each soil layer in the non-ditching plots were 23.15%, 8.52%, 1.15%, −2.63%, and −2.28%. The average soil desalination rates of each soil layer in the 60 cm ditching plots were 36.56%, 16.61%, 7.55%, 4.07%, and 4.49%. The desalination effect of the subsurface pipe was more significant on the surface soil. As the soil depth increased, the desalination effect decreased. The average soil desalination rate of the 60–100 cm soil layer in the non-ditching plot was negative for the two-year period. This indicates that the water in the subsurface pipe leached downward. If the soil is not discharged in time, it may result in salt accumulation in the deep layers. Consequently, the soil remains at risk of salinization. Under the same subsurface pipe arrangement conditions, the soil desalination rates for each soil layer in the ditching plots increased by 13.40%, 8.09%, 6.40%, 6.70%, and 6.77%, compared to those in the non-ditching plots. For the deep soil layer, ditching had a more pronounced effect on the desalination rate of the surface 0–40 cm soil layers. The desalination rate of the 0–100 cm soil layer in each plot after ditching was greater than 0. After leaching, each soil layer exhibited a desalinated state, indicating that the ditching operation effectively improved the desalination ability of the subsurface pipe for each soil layer.
3.3. DRAINMOD-S Simulated Soil Water and Salt Transport under Different Ditching Depths
Table 3 and Table 4 provide statistical values of soil salt content in the different soil layers of the test area during the calibration and verification years. The R2 values ranged from 0.20 to 0.99, with most simulation results exceeding 0.5, demonstrating that the simulation meets the requirements of use. Thus, the DRAINMOD-S model is suitable for the corresponding research.
Table 3.
Statistical measures of soil salinity in 2019 (calibration).
Table 4.
Statistical measures of soil salinity in 2020 (validation).
Figure 5 shows the drainage volume for the non-ditching and ditching depths of 20 cm, 40 cm, and 60 cm under the existing subsurface pipe layout parameters, as simulated by the DRAINMOD-S model. Compared to the non-ditching plot, the drainage volumes of the ditching depths of 20 cm, 40 cm, and 60 cm plots increased by an average of 5.60 cm3, 7.99 cm3, and 12.51 cm3, respectively. Moreover, when the buried depth of the subsurface pipe was 0.9 m, the drainage volume of the ditching depths of 20 cm, 40 cm, and 60 cm plots increased by an average of 6.10 cm3, 8.87 cm3, and 13.77 cm3, respectively. When the buried depth of the subsurface pipe was 1.1 m, the drainage volume of the ditching depths of 20 cm, 40 cm, and 60 cm plots increased by an average of 5.78 cm3, 8.10 cm3, and 12.54 cm3. when the buried depth of the subsurface pipe was 1.3 m, the drainage volume of the ditching depths of 20 cm, 40 cm, and 60 cm plots increased by an average of 4.58 cm3, 6.51 cm3, and 10.57 cm3. When the layout parameters of the subsurface pipes were the same, ditching enhanced the drainage capacity of the subsurface pipes. The deeper the surface ditching, the greater the volume of water discharged through the subsurface pipes. However, as the buried depth of the subsurface pipe increased, the effect of increased drainage volume caused by ditching decreased gradually.
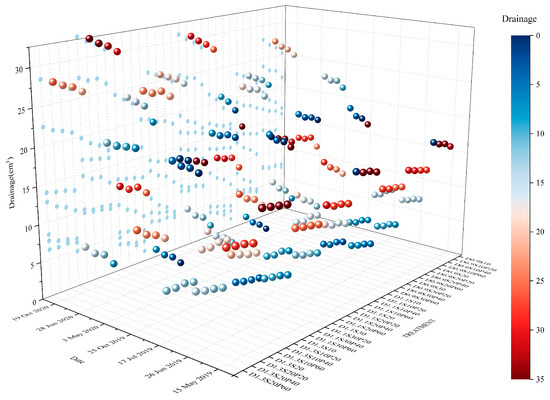
Figure 5.
The drainage volume of the subsurface pipe in each simulated community from 2019 to 2020. D (m), depth of subsurface pipe; S (m), spacing of subsurface pipe; P (cm), depth of ditching.
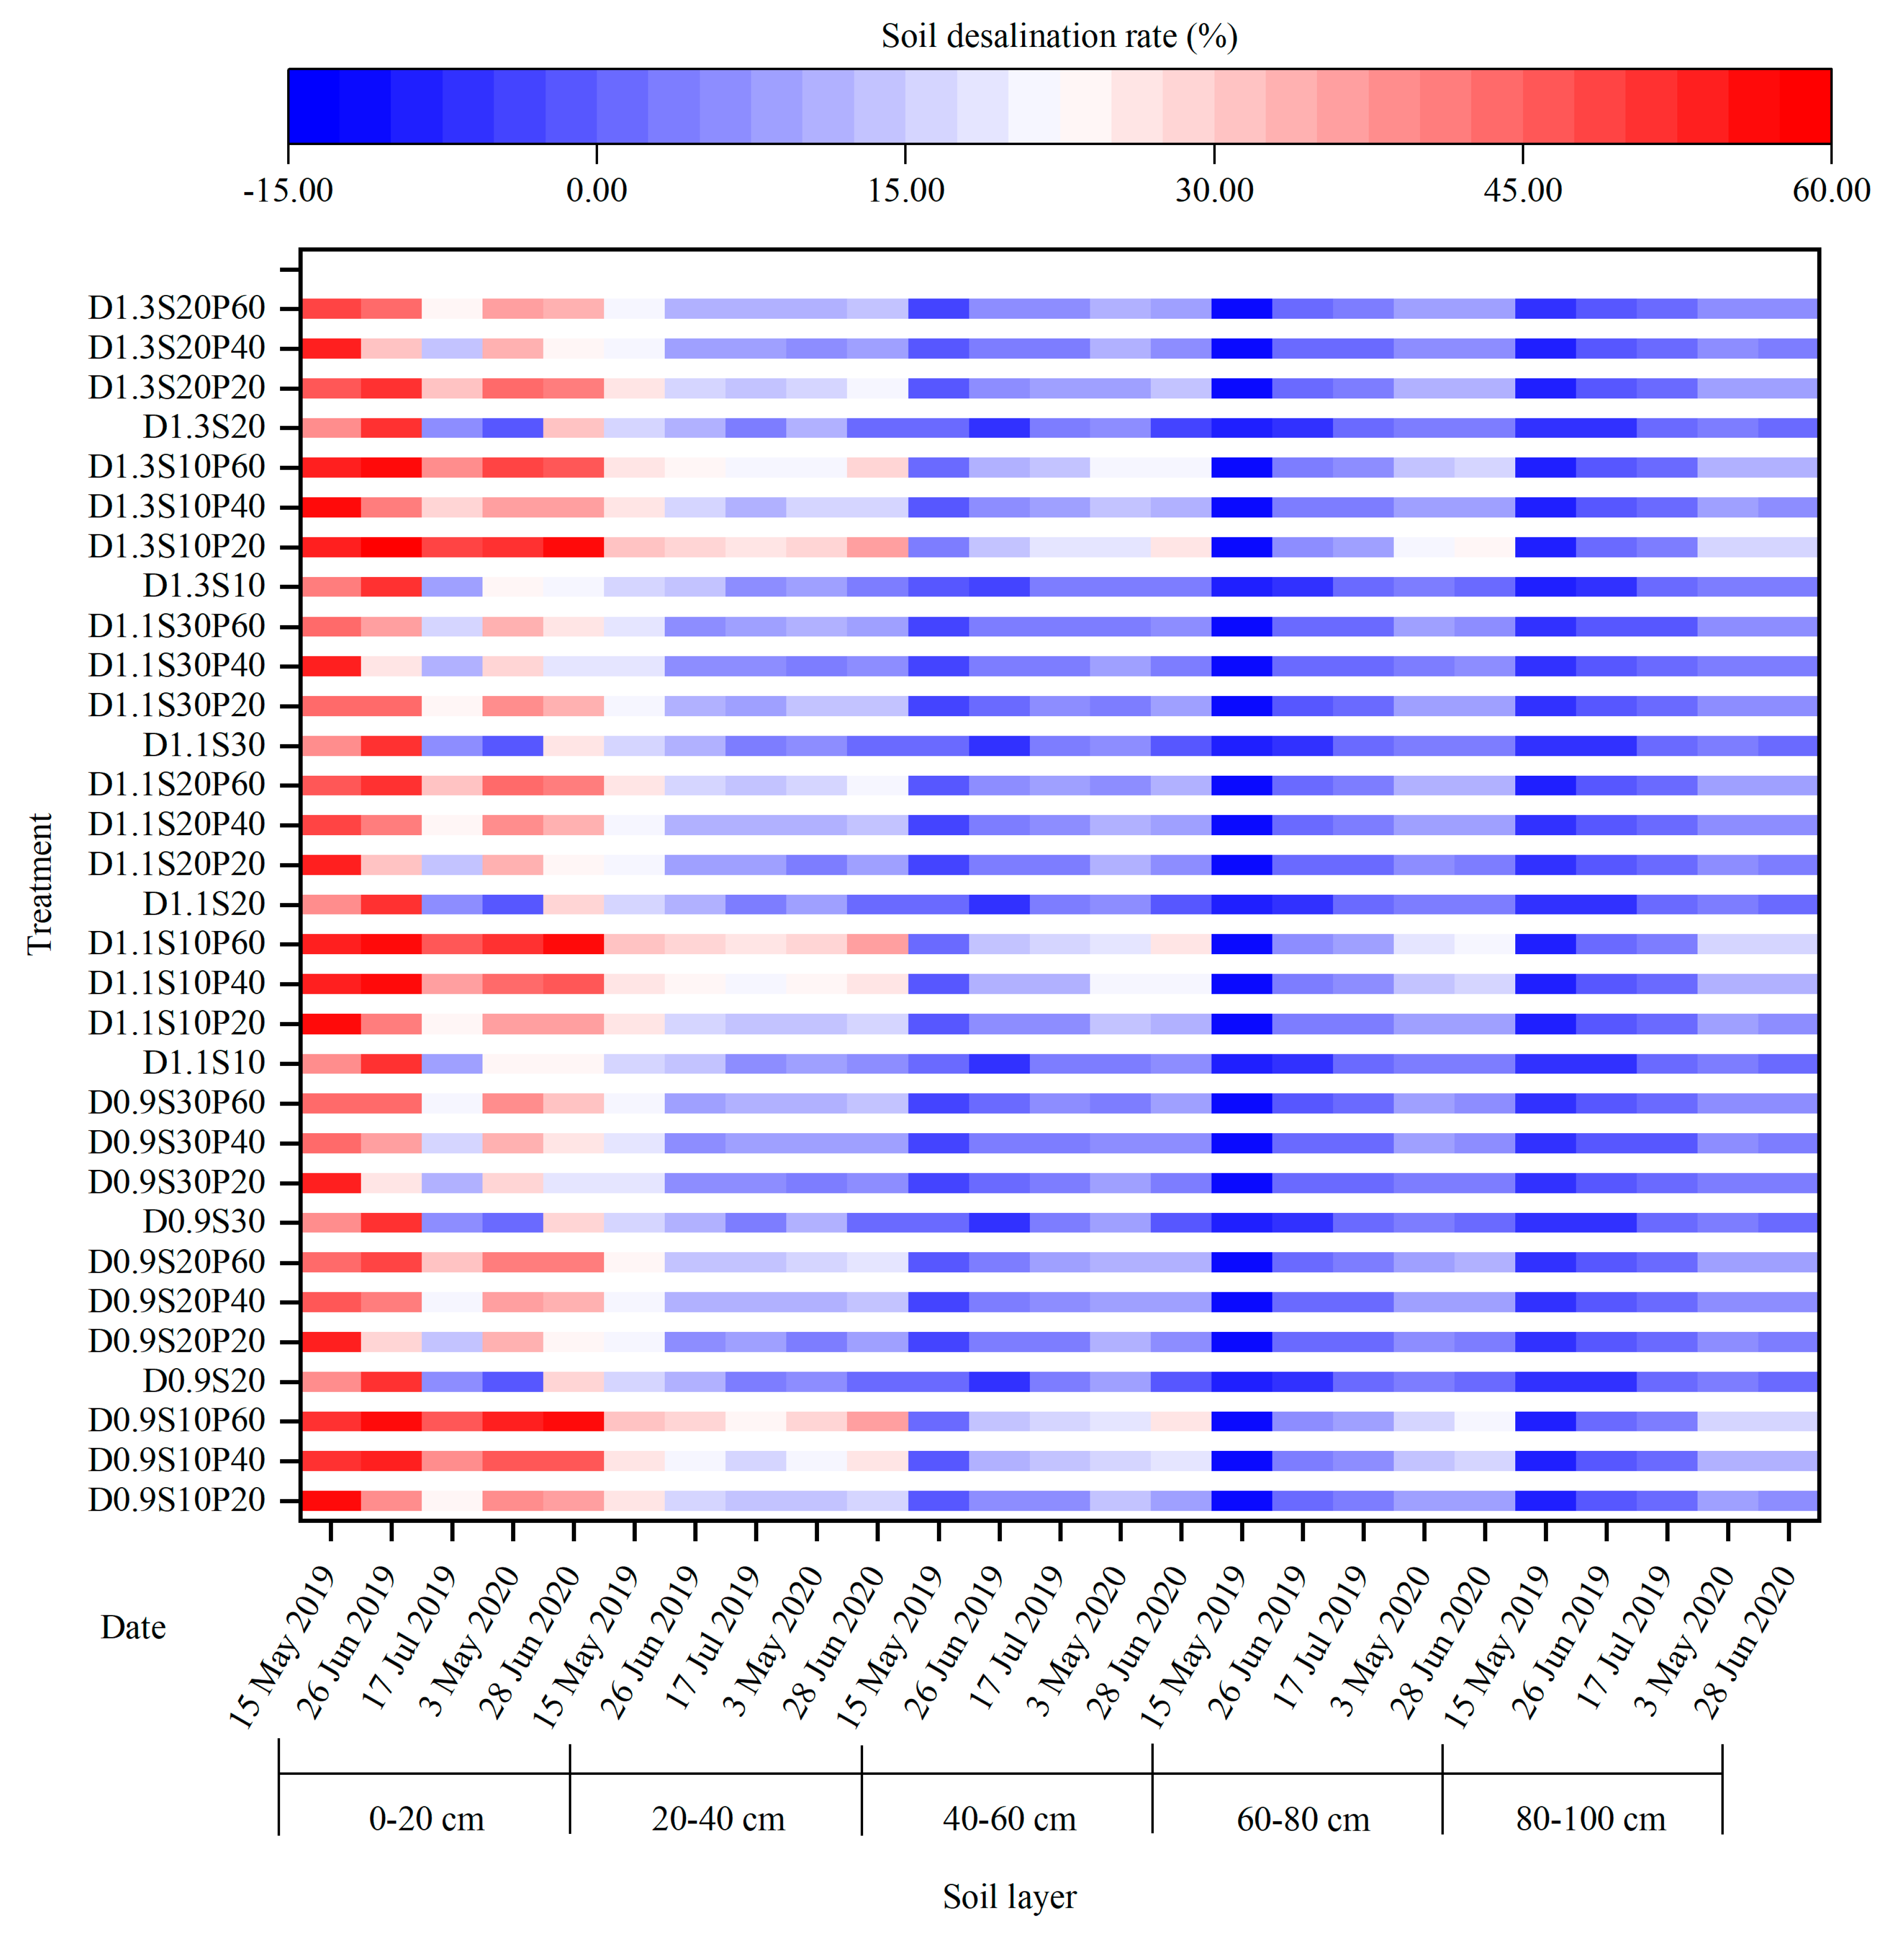
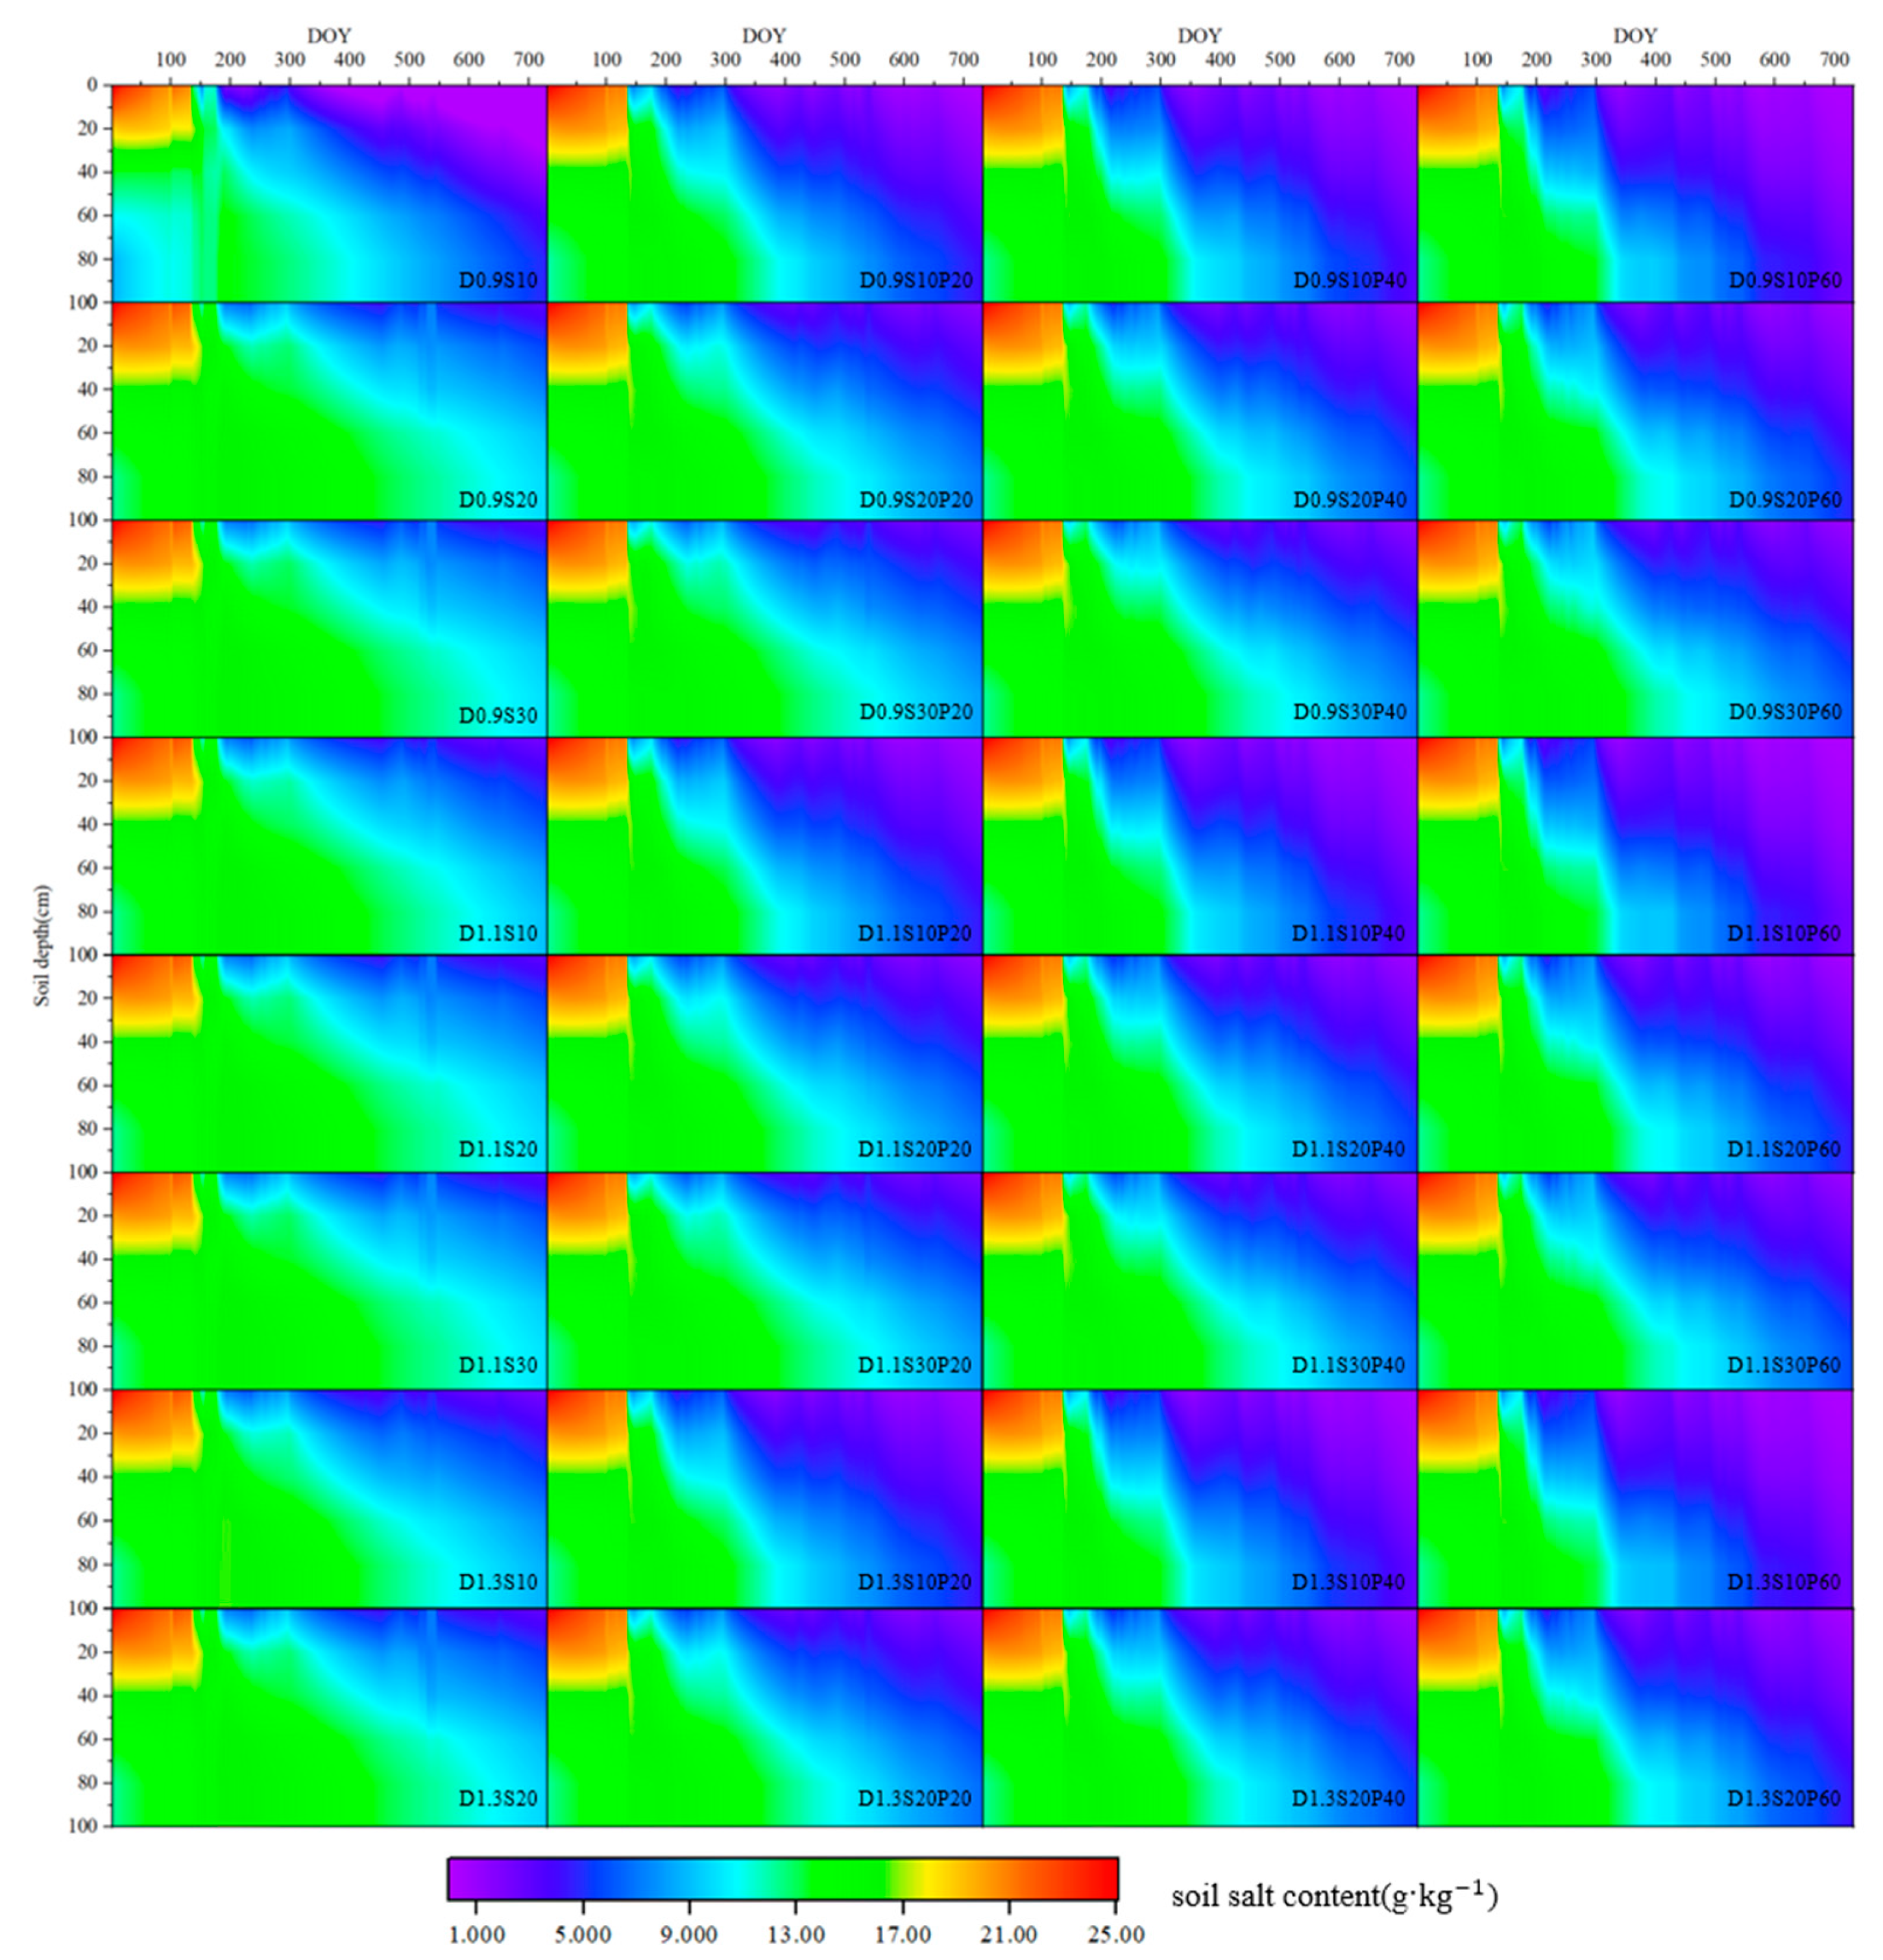
Figure 6 shows the soil desalination rate of each soil layer after leaching from 2019 to 2020 under the existing subsurface pipe layout parameters, as simulated using the DRAINMOD-S model. Figure 7 is the salt change in the 0–100 cm soil layer in the existing plot during 2019–2020 years simulated by DRAINMOD-S model. The ditching depths were 20 cm, 40 cm, and 60 cm. The analysis revealed that the spacing of the subsurface pipes varied. At a buried depth of 0.9 m, the average soil desalination rates of the 0–100 cm soil layers in all plots with no ditching and ditching depths of 20 cm, 40 cm, and 60 cm were 6.63%, 10.04%, 12.81%, and 15.61%, respectively. At a burial depth of 1.1 m, the average soil desalination rates were 6.63%, 10.04%, 12.81%, and 15.61%, respectively. The average soil desalination rates of the 0–100 cm soil layer in the plots with no ditching and ditching depths of 20 cm, 40 cm, and 60 cm were 6.63%, 11.36%, 12.78%, and 15.46%, respectively. At a buried depth of 1.3 m, the average soil desalination rates of 0–100 cm soil layer in the plots with no ditching and ditching depths of 20 cm, 40 cm, and 60 cm were 6.94%, 18.81%, 11.69%, and 15.48%, respectively. Under the same buried depth of the subsurface pipe, the average soil desalination rates of 0–100 cm soil layer in the plots with no ditching and ditching depths of 20 cm, 40 cm, and 60 cm were 6.94%, 18.81%, 11.69%, and 15.48%, respectively. The soil desalination effect of most plots with different spacing increased with ditching depth. However, when the spacing of the subsurface pipes was the same, the average soil desalination rates of the subsurface pipes at different depths differed slightly. When the spacing of subsurface pipes was 10 m, the average soil desalination rates of 0–100 cm soil layers in the plots with no ditching and ditching depths of 20 cm, 40 cm, and 60 cm were 7.50%, 16.52%, 16.78%, and 21.22%, respectively. When the spacing of subsurface pipes was 20 m, the average soil desalination rates of 0–100 cm soil layers in the plots with no ditching and ditching depths of 20 cm, 40 cm, and 60 cm were 6.25%11.10%, 10.92% and 13.46%, respectively. When the spacing of the subsurface pipe was 30 m, the average soil desalination rates of the 0–100 cm soil layer in the non-ditching and ditching depths of 20 cm, 40 cm, and 60 cm were 6.21%, 9.50%, 8.53%, and 10.07%, respectively. When the spacing of subsurface pipes was the same, the average soil desalination rate of 0–100 cm soil layer in each plot did not show regularity with ditching depth. The data analysis revealed that, when the buried depth of subsurface pipes reached 1.3 m, the effectiveness of ditching in increasing the soil desalination rate diminished gradually and the soil desalination rate no longer exhibited a regular increase with ditching depth. As can be intuitively seen from Figure 7, in the initial stage of the test, salt migrated downward and accumulated in the deep soil, but, with the progress of the test, the deep salt also gradually decreased. The change of trenching depth has a significant effect on the migration of soil salt. The shallower the buried depth and the smaller the spacing, the faster the salt in the trenching plot decreases, and the deeper the trenching depth, the more obvious the efficiency improvement.
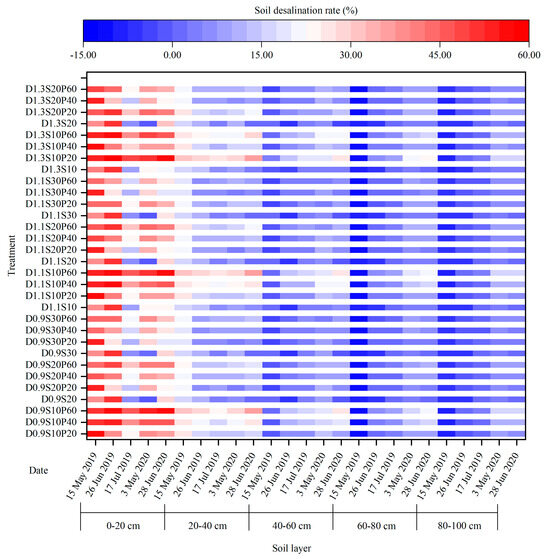
Figure 6.
The soil desalination rate of each soil layer after leaching in each simulated plot from 2019 to 2020. D (m), depth of subsurface pipe; S (m), spacing of subsurface pipe; P (cm), depth of ditching.
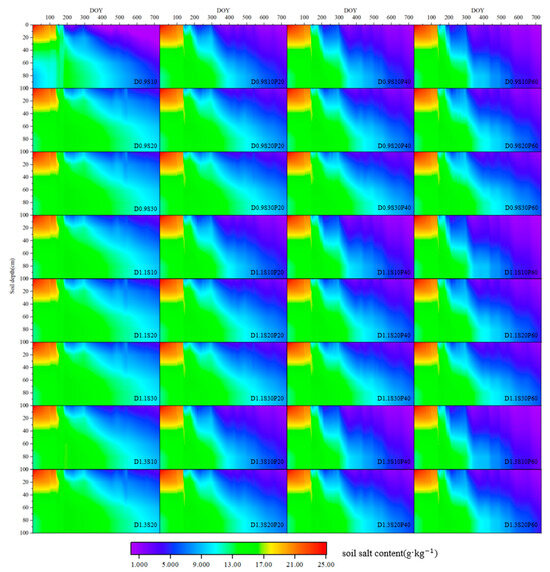
Figure 7.
The changes in salinity in 0–100 cm profile of soil in each simulated plot from 2019 to 2020. D (m), depth of subsurface pipe; S (m), spacing of subsurface pipe; P (cm), depth of ditching.
The soil desalination rates of each soil layer in the ditching plot increased by an average of 11.93% (0–20 cm), 7.24% (20–40 cm), 5.79% (40–60 cm), 4.34% (60–80 cm), and 3.05% (80–100 cm) compared to those in the non-ditching plot. The effect of ditching on soil salt migration was significant. However, this effect will gradually decrease with the increase of soil depth.
4. Discussion
4.1. The Effects of Different Spacing and Buried Depth of Subsurface Pipes on Soil Water and Salt Transport under Ditching Conditions
The main research contents of traditional subsurface pipe drainage engineering encompass soil water content, salt and nutrient changes, subsurface pipe drainage, and salt and nutrient discharge, among other things. Several studies have yielded significant findings in related aspects [33,34]. Based on a traditional subsurface pipe drainage project, the law of soil water and salt migration in combination with surface ditching was analyzed in this study. The subsurface pipe drainage in the experimental area after ditching increased with decreasing spacing or increasing buried depth. Concurrently, the soil water storage in the corresponding area also decreased gradually, consistent with the results of previous research on traditional subsurface pipe drainage engineering [13,32]. In traditional agricultural production, proper implementation of deep tillage can break the plow layer, effectively improve irrigation efficiency, and increase the infiltration of water and nutrients into the crop root layer [35,36]. The implementation of subsurface pipe drainage to improve saline–alkali land involved conducting ditching operations, which broke the plow layer, strengthened the infiltration rate of water to the depth of the soil layer, and bolstered the drainage capacity of the subsurface pipe. Following ditching, the subsurface pipe drainage per unit area increased by 14.65% on average compared to the traditional subsurface pipe drainage project. Moreover, when the spacing of the subsurface pipe was the same, for every 0.2 m increase in the buried depth, the soil water storage in the 0–100 cm soil layer of the ditching plot decreased by 0.41–1.26 mm on average compared to that of the non-ditching plot. When the buried depth was the same, for every 10 m decrease in spacing, the soil water storage in the 0–100 cm soil layer of the ditching plot decreased by 0.94–2.55 mm on average compared to that of the non-ditching plot, indicating that implementing ditching based on the subsurface pipe drainage project can further improve the overall drainage efficiency of the subsurface pipe system.
Ditching increased the discharge of soil salt and the subsurface pipe drainage capacity. In this study, the surface ditching project increased the soil desalination of the subsurface pipe by 0.52–14.35% on average, compared to the traditional subsurface pipe drainage project. This finding is consistent with that of Ghuman and Lal [37]. The soil possesses an adsorption capability for chloride ions; however, the tillage or ditching processes weaken the chloride ion adsorption capacity of the soil compared to that of uncultivated soil. This process significantly improves the efficiency of the subsurface pipe in improving saline–alkali land. Moreover, the proximity of the salt effect to the soil surface amplifies its effect. In the implementation of subsurface pipe drainage without ditching to improve saline–alkali land, the improvement effect of the subsurface pipes mainly affected the surface soil. This observation indicates that increased ditching did not significantly change the law observed in the traditional subsurface pipe drainage project. The influence of subsurface pipe drainage projects mainly revolved around the strengthening of drainage and salt discharge capacity, indicating that ditching and breaking up the plow layer in the areas where the subsurface pipes have been installed can significantly enhance the efficiency of subsurface pipe drainage in improving saline–alkali land.
4.2. The Effect of Ditching Depth on Water and Salt Transport under Subsurface Drainage Conditions
Deep plowing and tillage are generally employed in traditional tillage practices to break the plow pan layer to improve soil porosity, enhance water and nutrient diffusion towards crop roots, and ultimately increase crop yield [35]. In this study, surface ditching was used to break the plow pan produced owing to long-term tillage to achieve a more efficient subsurface pipe leaching effect. The results demonstrate that ditching had an effect similar to that of deep plowing and tillage, which significantly improved the discharge efficiencies of soil moisture and salt. The pre-laid underground subsurface pipe could improve the leaching effect of saline–alkali land. However, owing to the limitations of the test site and cost, this study only used the plot with a ditching depth of 60 cm. To explore the influence of ditching depth on water and salt transport in subsurface pipe drainage, the fitted DRAINMOD-S model was employed to simulate the subsurface pipe plots at different ditching depths. The simulation results revealed that increased ditching depth could increase the drainage volume of the subsurface pipe under the existing simulated burial depth of the subsurface pipe (<1.3 m), indicating that an increase in the ditching depth strengthens the infiltration of water. Hemmat et al. reported that increasing the depth of cultivated land resulted in a 44% increase in water infiltration rate [38]. However, based on the findings of this study, the law governing the relationship between the buried depth of the subsurface pipe and drainage volume indicates that, as the buried depth of the subsurface pipe increased, the increase in drainage volume of the subsurface pipe caused by an increase in the ground ditching depth decreased gradually until the ditching depth had no effect on the drainage volume of the subsurface pipe. The movement of salt followed that of water, indicating that, when the buried depth of the subsurface pipe increases to a certain depth, the change in the surface ditching depth will no longer have a significant impact on the salt-leaching effect of the subsurface pipe. Subsequent data analysis of salt further supports this observation. When the buried depth of the subsurface pipe reached 1.3 m, the average soil desalination rate of the 0–100 cm soil layer in the plots with different ditching depths no longer showed a correlation with the ditching depth. However, the soil desalination effect of other areas with buried pipe arrangement depths less than 1.3 m was more significant with an increase in ditching depth, consistent with the results of Yao et al. [39]. Under the same buried pipe arrangement parameters, the drainage volume per unit area of the ditching area increased by 14.65% on average compared to that of the non-ditching area with the same buried pipe arrangement parameters. Additionally, the soil water storage capacity was also significantly reduced. The difference in soil water storage from the surface to the deep layer was between 0.94 and 0.98 mm. The desalination intensity of the subsurface pipe in the plot increased mainly in the surface soil. From the surface to deeper soil layers, the increased effect of soil desalination owing to ditching gradually decreased (in the surface 0–20 cm soil layer). Specifically, the increase in desalination effect decreased from 11.93% to 3.05% in the 80–100 cm soil layer. This trend can be attributed to the surface ditching operation, which enhanced the water infiltration rate in the surface soil, causing more dissolved salt to be transported into the deeper soil layers. However, the deep soil possesses a lower hydraulic conductivity, hindering the timely discharge of water into subsurface pipes. Consequently, the salt leaching effect was not as good as that in the surface soil. In summary, although the deeper ditching depths improved the salt-leaching effect of the soil, they also facilitated the reformation of the plow pan at the corresponding position below the ditching depth. The newly formed plow pan tends to persist for longer durations and becomes more challenging to break [40]. Therefore, to achieve an improved salt-leaching effect, it is not advisable to blindly prioritize deeper ditching depths. Deeper ditching depths lead to higher construction costs, which pose challenges regarding widespread implementation. Therefore, when determining the optimal subsurface pipe layout parameters, it is crucial to consider the appropriate ditching depth. This approach can significantly enhance the effectiveness of subsurface pipe systems in improving saline–alkali land while simultaneously reducing the construction cost of subsurface pipe drainage projects.
5. Conclusions
In this study, ditching operations based on traditional subsurface pipe drainage to improve saline–alkali land projects were explored, and the migration law of water and salt in the soil under different ditching depths combined with different subsurface pipe layout parameters was compared. The main conclusions are as follows:
- Under the same buried pipe layout parameters, the drainage volume per unit area of the ditching plot increased by an average of 14.65% compared to that of the non-ditching plot. The soil water storage capacity was also significantly reduced. This disparity in soil water storage from the surface to the deep layers was between 0.94 mm and 0.98 mm.
- Under the same arrangement parameters of the subsurface pipe, the implementation of ditching significantly improved the soil salt-leaching effect of the subsurface pipes. The most significant effect was observed on the desalination rate of the surface soil, where it increased by 13.40% in the 0–20 cm soil layer.
- An increase in ditching depth improved the drainage and salt discharge capacity of the subsurface pipes. However, when the buried depth of the subsurface pipes reached a certain threshold (1.3 m in this study), the improved leaching effect of the subsurface pipes owing to ditching became independent of the ditching depth.
The results show that the ditching work in the subsurface pipes layout area can increase the drainage and salt discharge capacity of the subsurface pipes, and, with the increase in the ditching depth, the desalination capacity of the subsurface pipes is also improved, which provides an effective idea and method for improving the efficiency of saline–alkali land improvement. However, the excessive increase in the ditching depth increases the construction cost and the improvement efficiency of the subsurface pipes that may be improved is not significant. Therefore, according to the results of this study, the appropriate ditching depth under the appropriate buried parameters of the subsurface pipes can be selected according to the actual soil conditions, which will greatly improve the efficiency of the subsurface pipes to improve the saline–alkali land.
Author Contributions
F.T. wrote the manuscript, H.S. provided financial support, Q.M. modified the manuscript, R.L. modified the manuscript, X.D. analyzed the data, J.D. data curation, and W.F. modified and improved the manuscript language. All authors discussed the results and reviewed the manuscript. All authors have read and agreed to the published version of the manuscript.
Funding
This work was supported by the 14th Five-Year Key Technologies Research and Development Program [2021YFD1900602-06]; the National Natural Science Foundation of China [52269014 and 52009056]; and the Science and Technology Program of the Inner Mongolia Autonomous Region, China [2022YFHH0044].
Institutional Review Board Statement
Not applicable.
Informed Consent Statement
Not applicable.
Data Availability Statement
Data are contained within the article.
Conflicts of Interest
The authors declare that they have no known competing financial interests or personal relationships that could have appeared to influence the work reported in this paper.
Abbreviation
| EC1:5 | 1:5 soil-to-water ratio basis |
| ET | evapotranspiration |
| R2 | decisive coefficient |
| MAE | mean absolute error |
| RMSE | root mean square error |
References
- Metternicht, G.I.; Zinck, J. Remote sensing of soil salinity: Potentials and constraints. Remote Sens. Environ. 2003, 85, 1–20. [Google Scholar] [CrossRef]
- Srivastava, P.; Wu, Q.-S.; Giri, B. Salinity: An overview. In Microorganisms in Saline Environments: Strategies and Functions; Springer: Berlin, Germany, 2019; pp. 3–18. [Google Scholar] [CrossRef]
- Dou, X.; Shi, H.B.; Li, R.P.; Miao, Q.F.; Tian, F.; Yu, D.D.; Zhou, L.Y.; Wang, B. Effects of controlled drainage on the content change and migration of moisture, nutrients, and salts in soil and the yield of oilseed sunflower in the Hetao Irrigation District. Sustainability 2021, 13, 9835. [Google Scholar] [CrossRef]
- Feng, Z.Z.; Miao, Q.F.; Shi, H.B.; Feng, W.Y.; Li, X.Y.; Yan, J.W.; Liu, M.H.; Sun, W.; Dai, L.P.; Liu, J. Simulation of water balance and irrigation strategy of typical sand-layered farmland in the Hetao Irrigation District, China. Agric. Water Manag. 2023, 280, 108236. [Google Scholar] [CrossRef]
- Feng, W.Y.; Yang, F.; Cen, R.; Liu, J.; Qu, Z.Y.; Miao, Q.F.; Chen, H.Y. Effects of straw biochar application on soil temperature, available nitrogen and growth of corn. J. Environ. Manag. 2021, 277, 111331. [Google Scholar] [CrossRef] [PubMed]
- Zhou, L.X.; Liu, W.; Duan, H.J.; Dong, H.W.; Li, J.C.; Zhang, S.X.; Zhang, J.; Ding, S.G.; Xu, T.Y.; Guo, B.B. Improved effects of combined application of nitrogen-fixing bacteria Azotobacter beijerinckii and microalgae Chlorella pyrenoidosa on wheat growth and saline-alkali soil quality. Chemosphere 2023, 313, 137409. [Google Scholar] [CrossRef] [PubMed]
- Xiao, L.G.; Wei, X.; Wang, C.Y.; Zhao, R.Q. Plastic film mulching significantly boosts crop production and water use efficiency but not evapotranspiration in China. Agric. Water Manag. 2023, 275, 108023. [Google Scholar] [CrossRef]
- Askri, B.; Khodmi, S.; Bouhlila, R. Impact of subsurface drainage system on waterlogged and saline soils in a Saharan palm grove. Catena 2022, 212, 106070. [Google Scholar] [CrossRef]
- Sazawa, K.; Komiyama, T.; Tsuchida, T.; Taguchi, R.; Nakashima, F.; Ohta, T.; Nishio, M.; Yamazaki, Y.; Kuramitz, H. Effects of paddy irrigation-drainage system on water quality and productivity of small rivers in the Himi region of Toyama, Central Japan. J. Environ. Manag. 2023, 342, 118305. [Google Scholar] [CrossRef]
- He, X.L.; Liu, H.G.; Ye, J.Y.; Yang, G.; Li, M.S.; Gong, P.; Aimaiti, A. Comparative investigation on soil salinity leaching under subsurface drainage and ditch drainage in Xinjiang arid region. Int. J. Agric. Biol. Eng. 2016, 9, 109–118. [Google Scholar] [CrossRef]
- Konukcu, F.; Gowing, J.W.; Rose, D.A. Dry drainage: A sustainable solution to waterlogging and salinity problems in irrigation areas? Agric. Water Manag. 2006, 83, 1–12. [Google Scholar] [CrossRef]
- Haj-Amor, Z.; Bouri, S. Subsurface drainage system performance, soil salinization risk, and shallow groundwater dynamic under irrigation practice in an arid land. Arab. J. Sci. Eng. 2018, 44, 467–477. [Google Scholar] [CrossRef]
- Qian, Y.Z.; Zhu, Y.; Ye, M.; Huang, J.S.; Wu, J.W. Experiment and numerical simulation for designing layout parameters of subsurface drainage pipes in arid agricultural areas. Agric. Water Manag. 2021, 243, 106455. [Google Scholar] [CrossRef]
- Ghane, E.; Askar, M.H.; Skaggs, R.W. Design drainage rates to optimize crop production for subsurface-drained fields. Agric. Water Manag. 2021, 257, 107045. [Google Scholar] [CrossRef]
- Tao, Y.; Wang, S.; Xu, D.; Qu, X. Experiment and analysis on flow rate of improved subsurface drainage with ponded water. Agric. Water Manag. 2016, 177, 1–9. [Google Scholar] [CrossRef]
- Tao, Y.; Wang, S.; Xu, D.; Yuan, H.; Chen, H. Field and numerical experiment of an improved subsurface drainage system in Huaibei plain. Agric. Water Manag. 2017, 194, 24–32. [Google Scholar] [CrossRef]
- Dou, X.; Shi, H.B.; Li, R.P.; Miao, Q.F.; Yan, J.W.; Tian, F.; Wang, B. Simulation and evaluation of soil water and salt transport under controlled subsurface drainage using HYDRUS-2D model. Agric. Water Manag. 2022, 273, 107899. [Google Scholar] [CrossRef]
- Moursi, H.; Youssef, M.A.; Poole, C.A.; Castro-Bolinaga, C.F.; Chescheir, G.M.; Richardson, R.J. Drainage water recycling reduced nitrogen, phosphorus, and sediment losses from a drained agricultural field in eastern North Carolina, USA. Agric. Water Manag. 2023, 279, 108179. [Google Scholar] [CrossRef]
- Nishida, K.; Harashima, T.; Yoshida, S.; Ohno, S. Water flow resistance along the pathway from the plow layer to the drainage canal via subsurface drainage in a paddy field. Agri. Water. Manag. 2020, 242, 106391. [Google Scholar] [CrossRef]
- Ali, M.A.; Ilyas, F.; Danish, S.; Mustafa, G.; Ahmed, N.; Hussain, S.; Arshad, M.; Ahmad, S. Soil Management and Tillage Practices for Growing Cotton Crop. In Cotton Production and Uses; Ahmad, S., Hasanuzzaman, M., Eds.; Springer: Singapore, 2020; pp. 9–30. [Google Scholar] [CrossRef]
- Tao, Y.; Li, N.; Wang, S.; Chen, H.; Guan, X.; Ji, M. Simulation study on performance of nitrogen loss of an improved subsurface drainage system for one-time drainage using HYDRUS-2D. Agric. Water Manag. 2021, 246, 106698. [Google Scholar] [CrossRef]
- Addab, H.; Bailey, R.T. Simulating the effect of subsurface tile drainage on watershed salinity using SWAT. Agric. Water Manag. 2022, 262, 107431. [Google Scholar] [CrossRef]
- Singh, R.; Helmers, M.J.; Qi, Z.M. Calibration and validation of DRAINMOD to design subsurface drainage systems for Iowa’s tile landscapes. Agric. Water Manag. 2006, 85, 221–232. [Google Scholar] [CrossRef]
- Youssef, M.A.; Liu, Y.; Chescheir, G.M.; Skaggs, R.W.; Negm, L.M. DRAINMOD modeling framework for simulating controlled drainage effect on lateral seepage from artificially drained fields. Agric. Water Manag. 2021, 254, 106944. [Google Scholar] [CrossRef]
- Liu, Y.; Ao, C.; Zeng, W.; Kumar Srivastava, A.; Gaiser, T.; Wu, J.; Huang, J. Simulating water and salt transport in subsurface pipe drainage systems with HYDRUS-2D. J. Hydrol. 2021, 592, 125823. [Google Scholar] [CrossRef]
- Hosseini, P.; Bailey, R.T. Investigating the controlling factors on salinity in soil, groundwater, and river water in a semi-arid agricultural watershed using SWAT-Salt. Sci. Total Environ. 2022, 810, 152293. [Google Scholar] [CrossRef] [PubMed]
- Skaggs, R.W.; Youssef, M.A.; Chescheir, G.M. DRAINMOD: Model use, calibration, and validation. Trans. ASABE 2012, 55, 1509–1522. [Google Scholar] [CrossRef]
- Youssef, M.A.; Abdelbaki, A.M.; Negm, L.M.; Skaggs, R.W.; Thorp, K.R.; Jaynes, D.B. DRAINMOD-simulated performance of controlled drainage across the U.S. Midwest. Agric. Water Manag. 2018, 197, 54–66. [Google Scholar] [CrossRef]
- Zhai, L.C.; Xu, P.; Zhang, Z.B.; Li, S.K.; Xie, R.Z.; Zhai, L.F.; Wei, B.H. Effects of deep vertical rotary tillage on dry matter accumulation and grain yield of summer maize in the Huang–Huai–Hai Plain of China. Soil Tillage Res. 2017, 170, 167–174. [Google Scholar] [CrossRef]
- Tong, W.; Chen, X.; Wen, X.; Chen, F.; Zhang, H.; Chu, Q.; Dikgwatlhe, S. Applying a salinity response function and zoning saline land for three field crops: A case study in the Hetao Irrigation District, Inner Mongolia, China. J. Integr. Agric. 2015, 14, 178–189. [Google Scholar] [CrossRef]
- Feng, W.Y.; Wang, T.K.; Zhu, Y.R.; Sun, F.H.; Giesy, J.P.; Wu, F.C. Chemical composition, sources, and ecological effect of organic phosphorus in water ecosystems: A review. Carbon Res. 2023, 2, 12. [Google Scholar] [CrossRef]
- Pourgholam-Amiji, M.; Liaghat, A.; Ghameshlou, A.N.; Khoshravesh, M. The evaluation of DRAINMOD-S and AquaCrop models for simulating the salt concentration in soil profiles in areas with a saline and shallow water table. J. Hydrol. 2021, 598, 126259. [Google Scholar] [CrossRef]
- Liang, H.; Qi, Z.M.; Hu, K.L.; Li, B.G.; Prasher, S.O. Modelling subsurface drainage and nitrogen losses from artificially drained cropland using coupled DRAINMOD and WHCNS models. Agric. Water Manag. 2018, 195, 201–210. [Google Scholar] [CrossRef]
- Singh, S.; Negm, L.; Jeong, H.; Cooke, R.; Bhattarai, R. Comparison of simulated nitrogen management strategies using DRAINMOD-DSSAT and RZWQM2. Agric Water Manag. 2022, 266, 107597. [Google Scholar] [CrossRef]
- Romanyuk, N.; Ednach, V.; Nukeshev, S.; Troyanovskaya, I.; Voinash, S.; Kalimullin, M.; Sokolova, V. Improvement of the design of the plow-subsoiler-fertilizer to increase soil fertility. J. Terramechanics 2023, 106, 89–93. [Google Scholar] [CrossRef]
- Han, Y.L.; Guo, D.; Ma, W.; Ge, J.Z.; Li, X.L.; Mehmood, A.N.; Zhao, M.; Zhou, B.Y. Strip deep rotary tillage combined with controlled-release urea improves the grain yield and nitrogen use efficiency of maize in the North China Plain. J. Integr. Agric. 2022, 21, 2559–2576. [Google Scholar] [CrossRef]
- Ghuman, B.S.; Lal, R. Water percolation in tropical Alfisol under conventional ploughing and no-tillage systems of management. Soil Tillage Res. 1984, 4, 263–276. [Google Scholar] [CrossRef]
- Hemmat, A.; Ahmadi, I.; Masoumi, A. Water infiltration and clod size distribution as influenced by ploughshare type, soil water content and ploughing depth. Biosyst. Eng. 2007, 97, 257–266. [Google Scholar] [CrossRef]
- Yao, R.J.; Gao, Q.C.; Liu, Y.X.; Li, H.Q.; Yang, J.S.; Bai, Y.C.; Zhu, H.; Wang, X.P.; Xie, W.P.; Zhang, X. Deep vertical rotary tillage mitigates salinization hazards and shifts microbial community structure in salt-affected anthropogenic-alluvial soil. Soil Tillage Res. 2023, 227, 105627. [Google Scholar] [CrossRef]
- Bakken, A.K.; Brandsæter, L.O.; Eltun, R.; Hansen, S.; Mangerud, K.; Pommeresche, R.; Riley, H. Effect of tractor weight, depth of ploughing and wheel placement during ploughing in an organic cereal rotation on contrasting soils. Soil Tillage Res. 2009, 103, 433–441. [Google Scholar] [CrossRef]
Disclaimer/Publisher’s Note: The statements, opinions and data contained in all publications are solely those of the individual author(s) and contributor(s) and not of MDPI and/or the editor(s). MDPI and/or the editor(s) disclaim responsibility for any injury to people or property resulting from any ideas, methods, instructions or products referred to in the content. |
© 2023 by the authors. Licensee MDPI, Basel, Switzerland. This article is an open access article distributed under the terms and conditions of the Creative Commons Attribution (CC BY) license (https://creativecommons.org/licenses/by/4.0/).