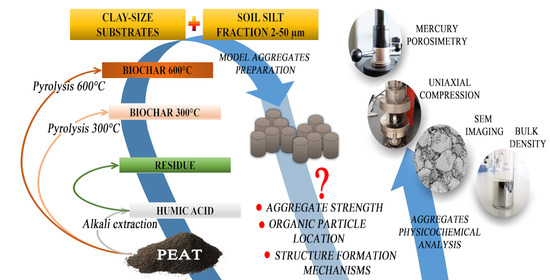
The presentation of the results follows the general concept of the paper presented above. At first, the surface and physicochemical properties of the substrates are examined and discussed. Next, some characteristics of the structure and strength of the aggregates formed from the silt and different amounts of organic species are presented. Finally, a picture attempted to interconnect the observed aggregates behavior and material properties is drawn.
3.1. Properties of Substrates
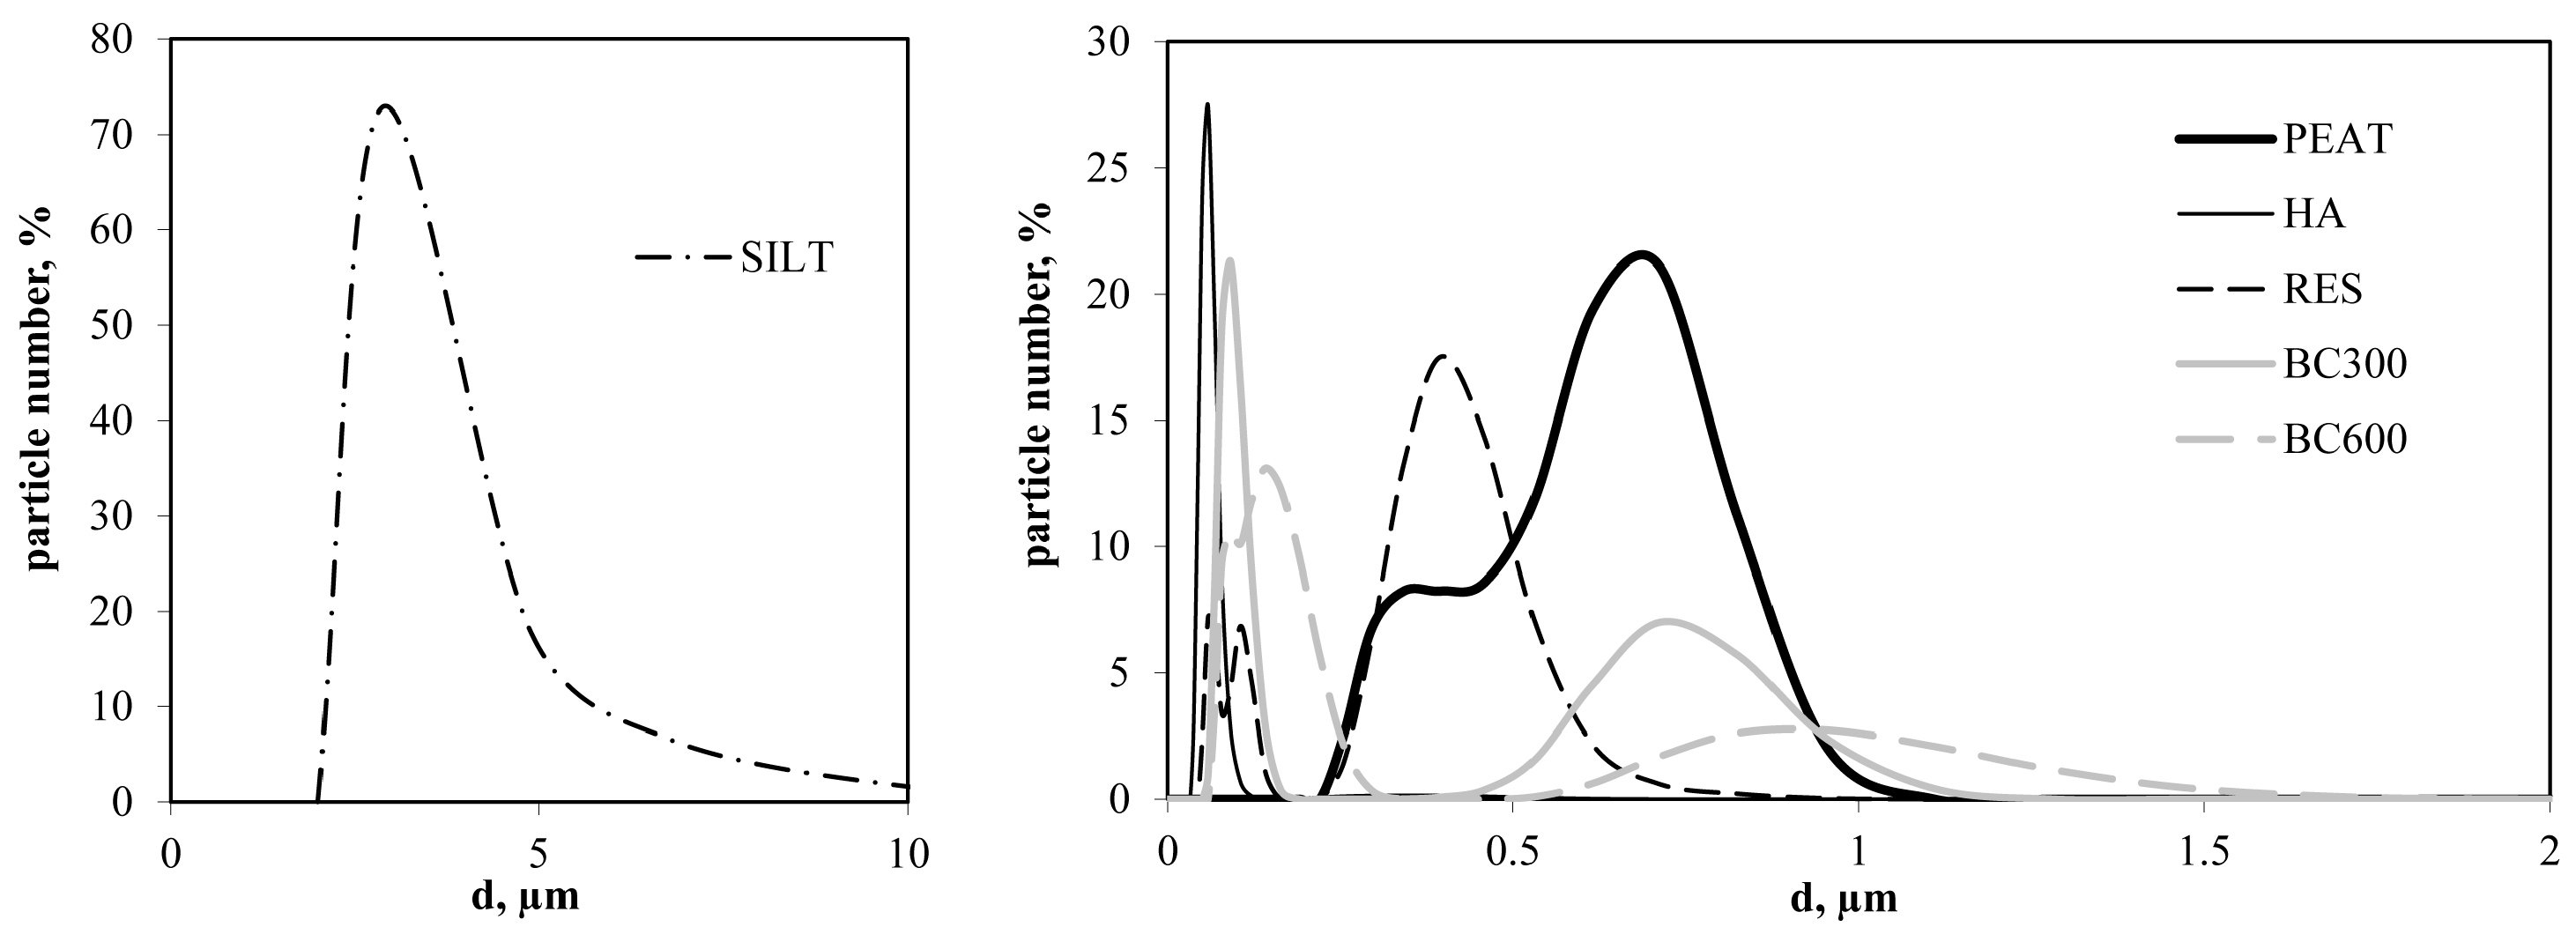
Particle size distributions of the studied materials: silt extracted from a loessial soil being a skeletal material for aggregates preparation (SILT) and organic additives: commercial acidic peat (PEAT), humic acid extracted from the peat (HA), residue after HA extraction from the peat (RES), and biochars obtained from the peat after 300 °C and 600 °C heating (BC300 and BC600, respectively) are shown in
Figure 1.
Unimodal particle size distribution occurs only for SILT and HA, whereas for other substrates, two or three peaks can be distinguished. Average particle diameters calculated from the distribution functions along with solid phase (particle) densities of the studied substrates are shown in
Table 1.
The solid phase density is the highest for pure silt and much lower for organic materials. HA is characterized by the smallest particle diameter. Humic acid nanoparticles of several tens of nanometers can be found in alkaline solutions, while for concentrated solutions, the particle size distributions usually contain larger particles, up to 1 µm [
38]. In our experiments, the particle sizes are located within the above range. Peat has around two times larger particles than RES and both biochars. HA and RES are characterized by the lowest solid phase density. Higher particle densities have PEAT and BC300, while the highest particle density was measured for BC600. Lower
SPD for BC300 than for BC600 is due to the preservation of isolated, unconnected pores inaccessible to helium molecules in BC300, such as those that are plugged by tar. It was found that tars coat pores in biochars produced at lower temperatures [
50,
51]. The high-temperature pyrolysis process leads to tar evaporation [
52], which may open of the unconnected intraparticle pores, allowing helium to enter. As a result, the BC600 particles had a higher solid phase density measured by helium pycnometry. A similar effect might have also occurred if
SPD of the tar was significantly lower than that of the char. The particle density of various soil organic materials is most often reported to be around 1.4 g cm
–3 [
53,
54]. Significantly higher values found in this paper most likely result from fine granulation of the materials: intensive grinding may influence the destruction of very fine or closed pores, which are not available for the measuring medium during particle density measurement of intact materials.
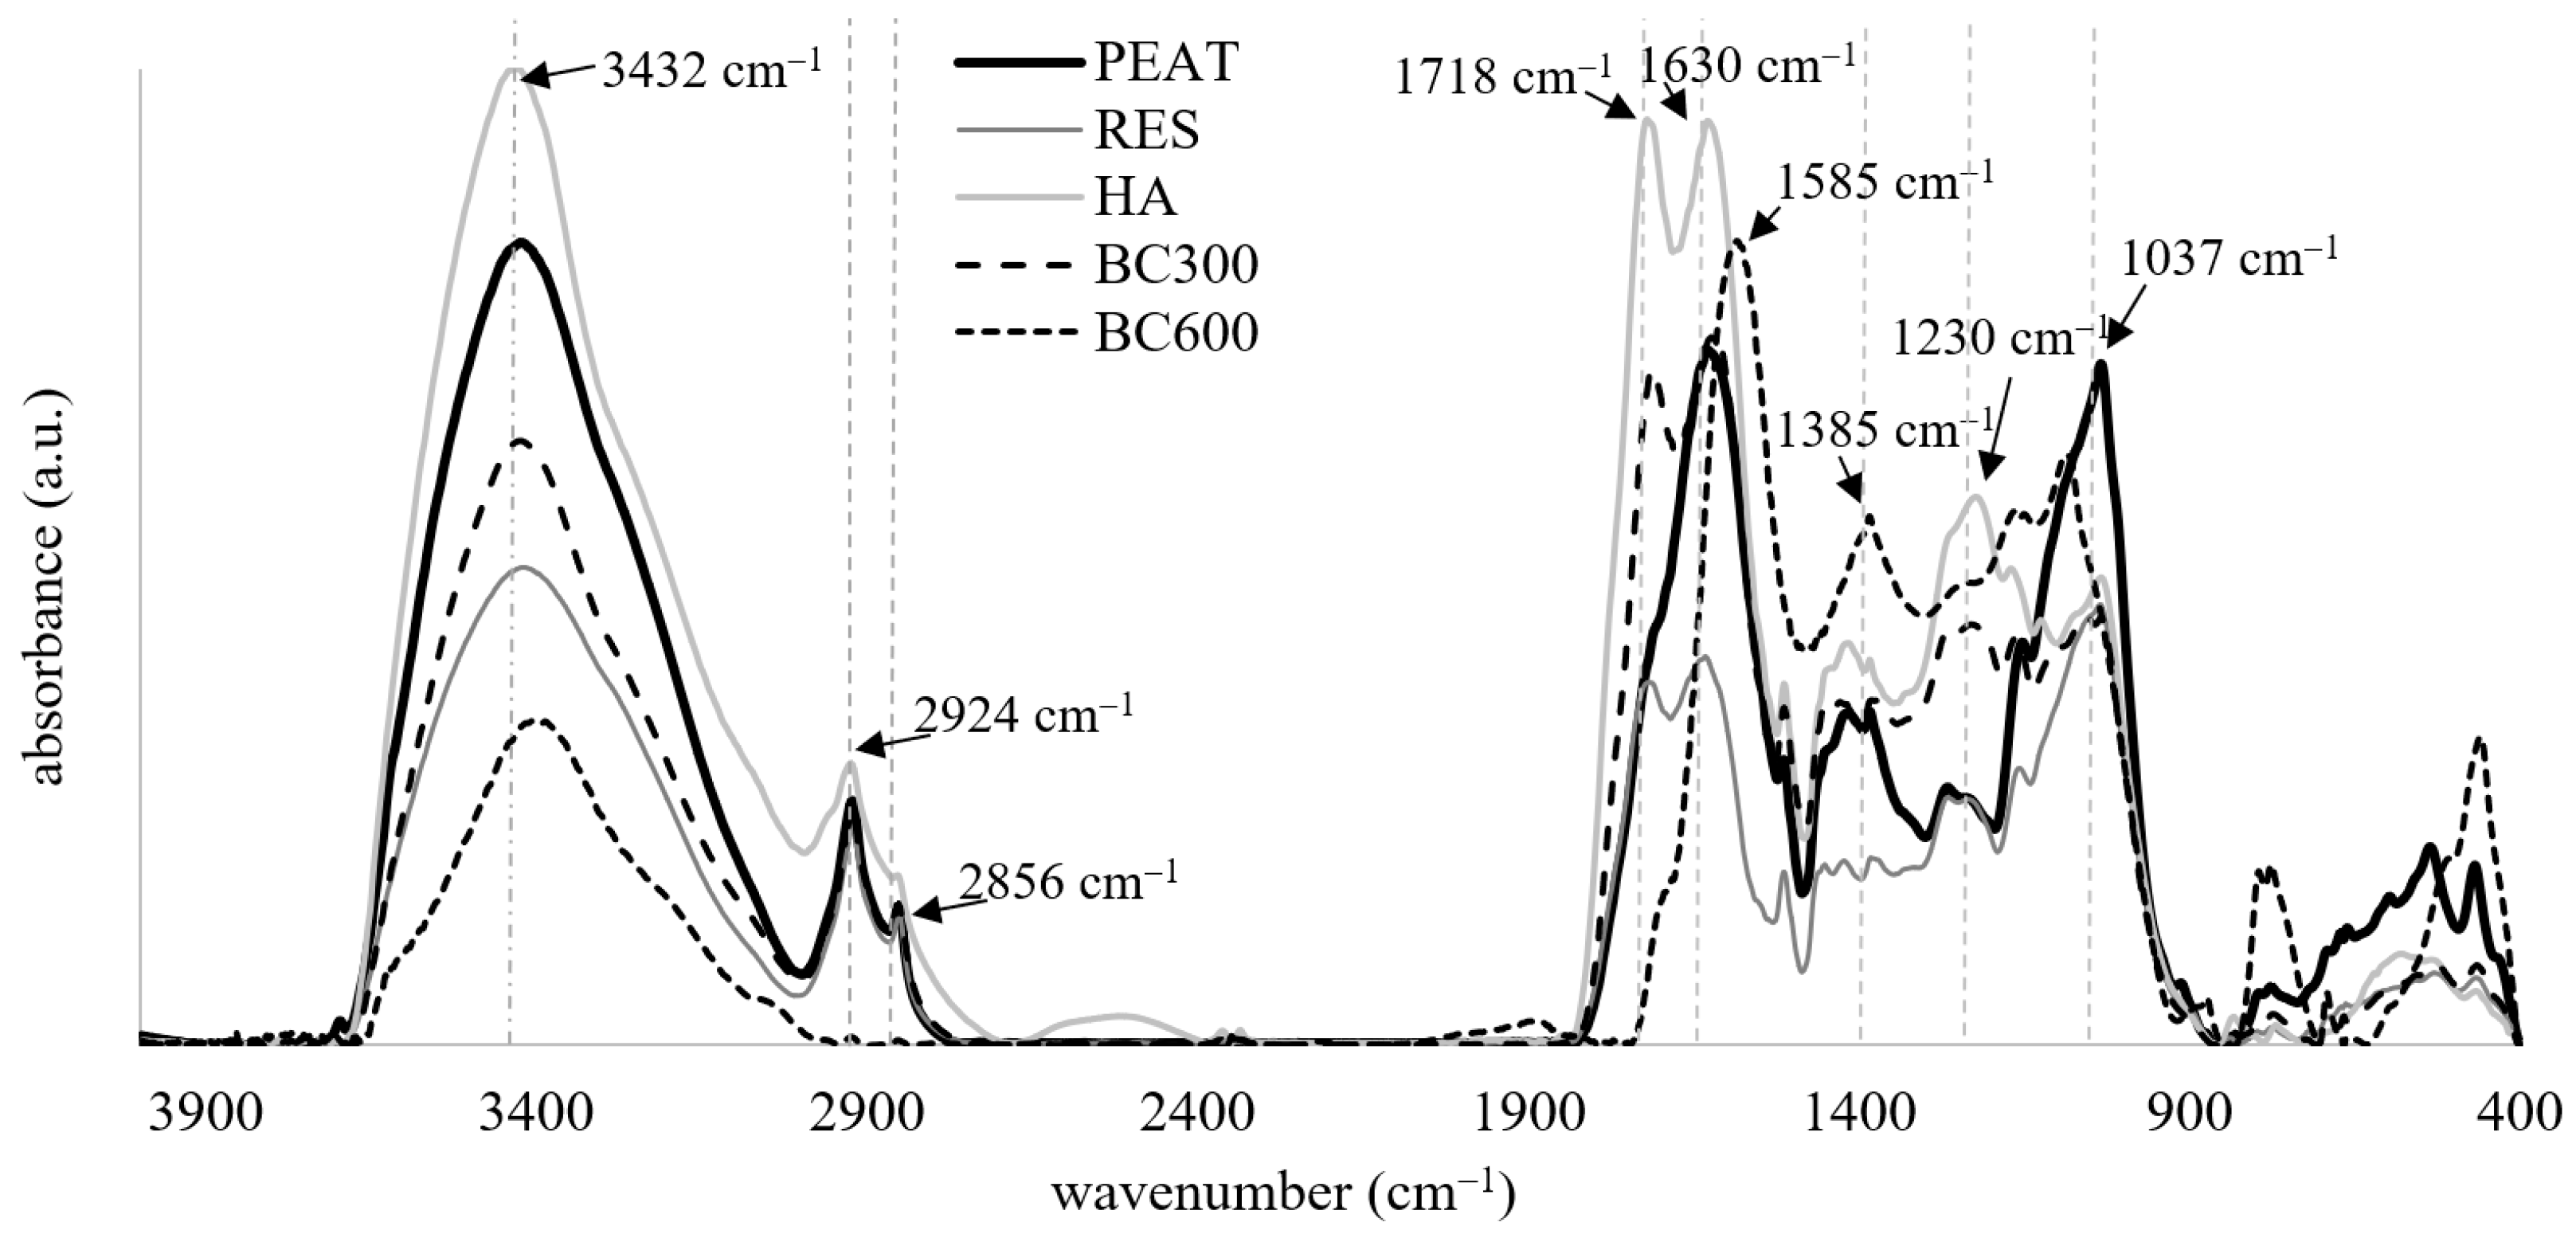
FTIR spectra of the studied organic materials are shown in
Figure 2. The FTIR characteristics differ in the location and intensity of the main absorption bands. The HA and peat show the highest signal at ~3432 cm
−1 assigned to the O-H stretching of carboxylic acids, phenols, alcohols, and water [
55]. Significant reduction of this band for RES suggests the loss of organic components due to alkaline extraction while indicating degradation of oxygen-containing structures under pyrolysis conditions for BC600. Higher pyrolysis temperature used for the production of BC600 also resulted in the disappearance of bands at ~2924, 2856, 1718, and 1230 cm
−1, which can be attributed to asymmetric and symmetric stretching vibrations of aliphatic C-H and C=O in carboxyls, esters, lactones, aldehydes, and ketones [
56]. The highest intensities at 1718 and 1230 cm
−1 were revealed for HA, indicating the largest population of carboxylic groups. Interestingly, clear signals of the above bands are also observed for BC300, suggesting relatively low degradation of COOH structures under the peat processing at low temperatures. High absorbance of the band at 1585 and 1385 cm
−1 for BC600 shows an increasing share of aromatic structures, which are more temperature resistant [
43]. The band at ~1037 cm
−1, mostly attributed to cellulose, hemicellulose, and lignin [
57], was the strongest for peat, slightly lower for RES, and considerably reduced for BC300 and BC600.
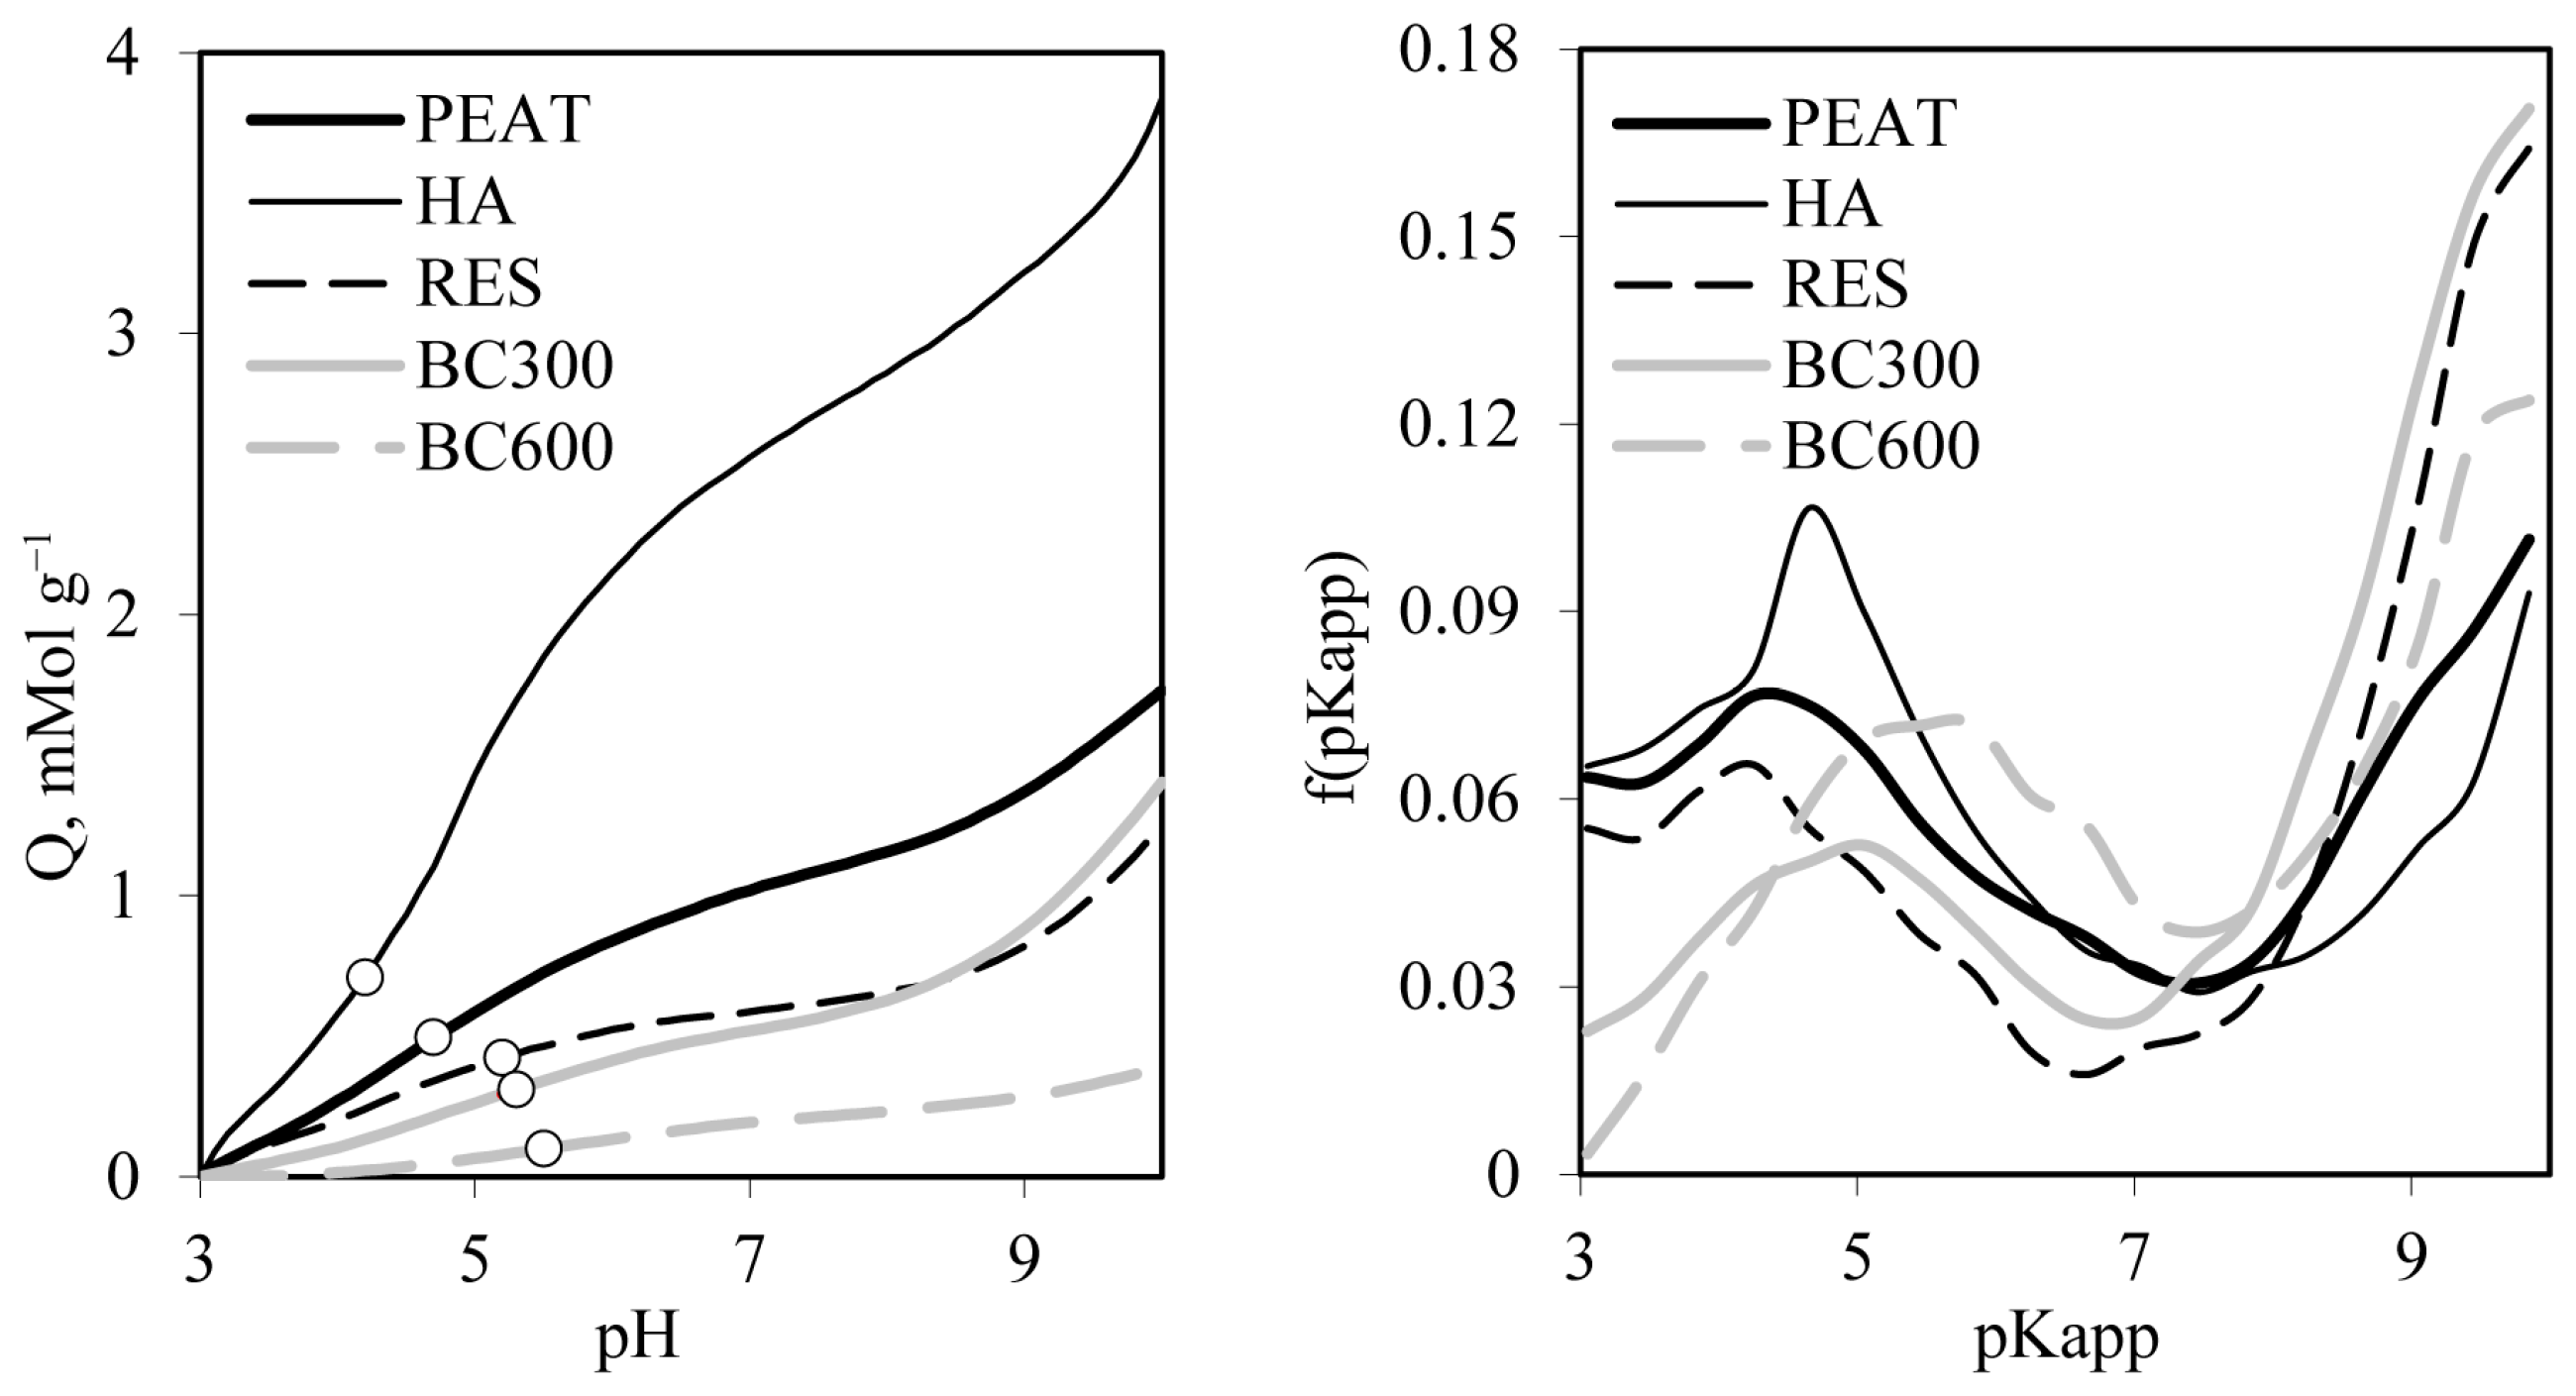
Variable charge vs. pH curves of the studied organic materials derived from potentiometric titration, along with distribution functions of apparent surface dissociation constants, are shown in
Figure 3. Assuming that the variable charge of the studied organic substances at pH = 3 is close to zero, the variable charge vs. pH curves approximate the total (actual) charge vs. pH dependencies. Despite the roughly identical initial pH of the organic substrates, the silt–organic mixtures had different pH values due to the higher pH of the silt (6.4) and different buffering properties of the organic substances. Because the charge developed at the actual aggregate pH seems to be the most important for interactions in the studied aggregates, the surface charge at mid values of pH measured for each silt–organic mixture was compared. The above values (also marked in the titration curves), with average apparent surface dissociation constants, are shown in
Table 2.
The HA extracted from the peat has the highest charge. The charge of the residue after the HA extraction is around 20% smaller than that of the peat, which can be associated with the washout of highly charged HA compounds, also confirmed in our studies by the FTIR spectra (
Figure 2). Biochar obtained from 300 °C heated peat has a variable charge lower than the residue remaining after HA extraction. The biochar obtained from 600 °C heated peat has the smallest charge. A reduction in surface charge and cation exchange capacity with biochar preparation temperature increase is a common observation, which can be explained by a decrease in acidic surface groups [
44]. Quite low
Q values for BC300 may result from partial degradation of peat biomass during pyrolysis, which at 300 °C is mostly related to the degradation of hemicellulose and partly to cellulose [
41]. Under this temperature, some parts of humic substances, especially fulvic acids and other volatile compounds, can also be degraded resulting in surface charge reduction [
43]. The lowest
Q value observed for BC600 could be a consequence of further thermal degradation of organic compounds, including lignin, whose structures are rich in aromatic units and are more thermally resistant than cellulose and hemicellulose [
42]. Apparent surface dissociation constants distribution functions revealing frequencies of occurrence of surface functional groups of different acidities show that the relative amount of strongly acidic groups (p
Kapp between 3 to 4) is much lower in biochars than in the other materials. Reduction of the structures of high acidity in BC300 and BC600 is mostly linked to intensive decarboxylation [
58]. The peak of medium acidic groups (p
Kapp around 5) is the highest in HA and is shifted towards higher values for both biochars. The effect is more pronounced for BC600, which may be due to the further removal of fatty acids from the biomass under thermal treatment [
59]. Both pyrolysis and HA removal from the peat resulted in the enrichment of biochars and RES in the groups of very weak acidity (
pKapp between 9 and 10), e.g., phenolic groups from lignin or aliphatic hydroxyl groups [
59]. Overall acidity of surface functional groups is the highest for HA, followed by PEAT and RES, respectively, which is reflected in the consequent increase in the average value of the surface dissociation constant. The highest values of p
Kapp,av have biochars that indicate a marked weakening of overall surface acidity after the heating of the peat.
3.2. Structure of the Aggregates
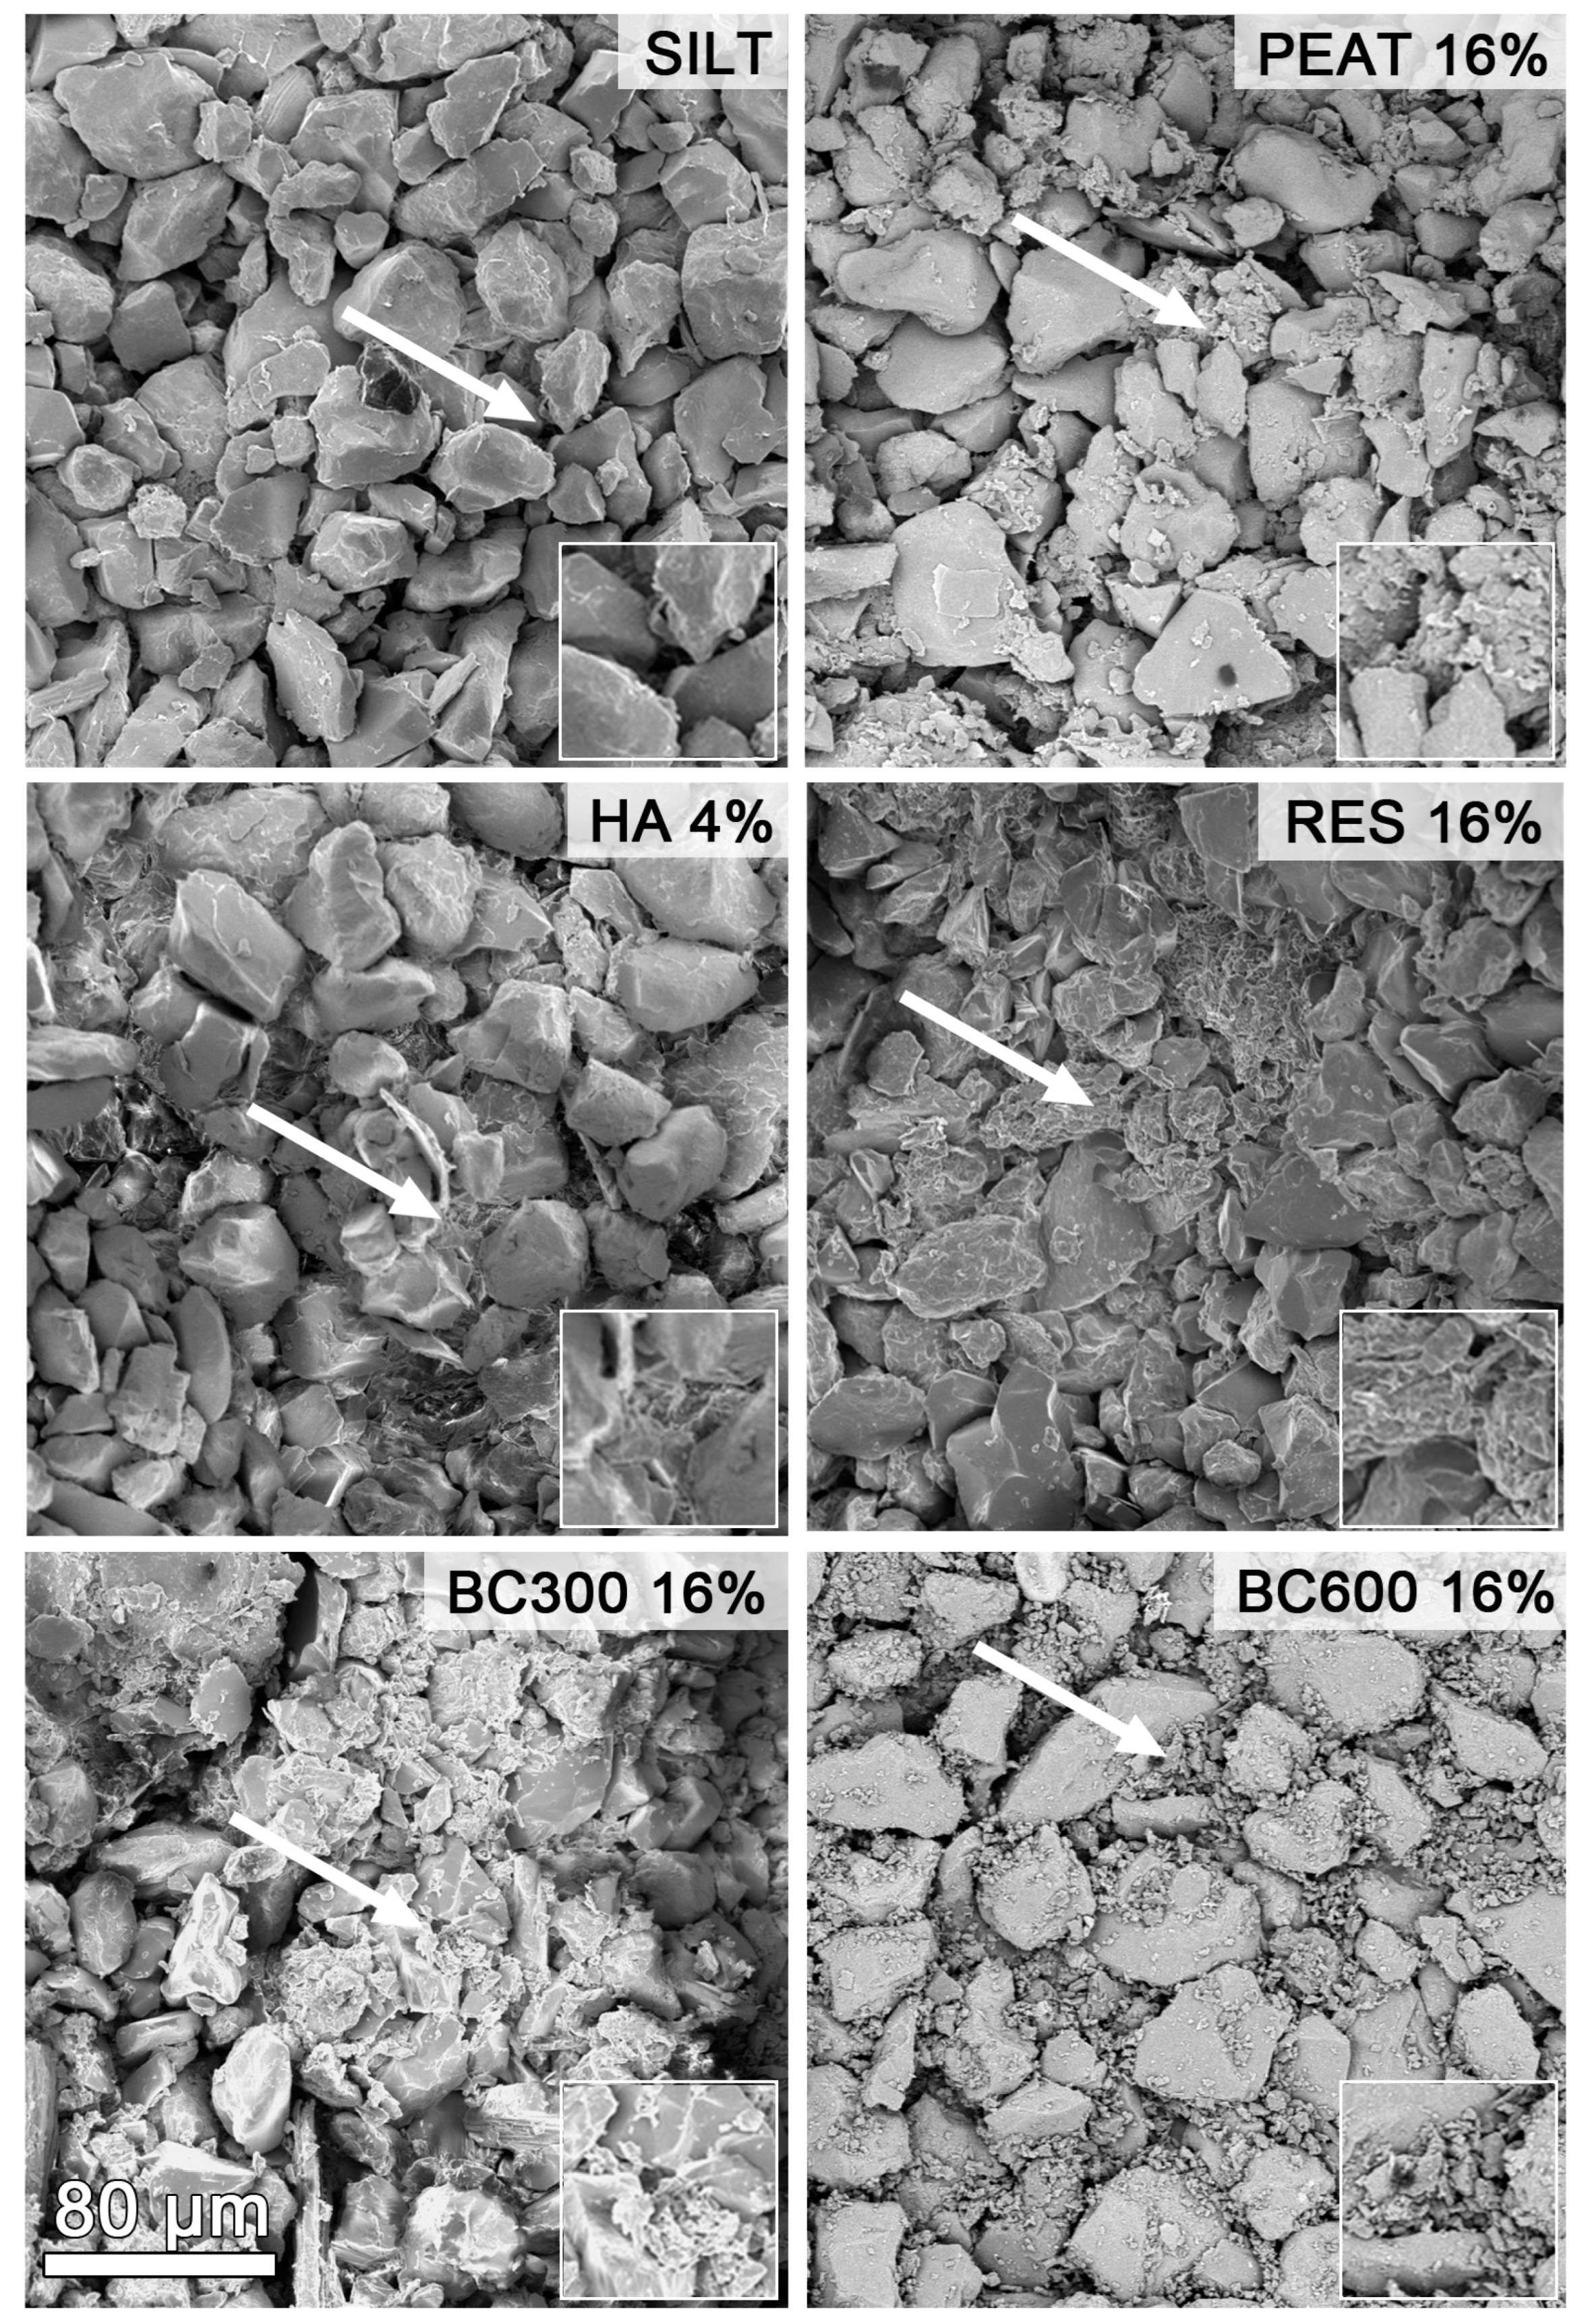
Representative SEM images of the surfaces of broken aggregates containing maximum doses of organic substances and that of the pure silt are presented in
Figure 4. Different positions of the organic substances relative to the silt grains may be observed. PEAT particles occur as large agglomerates separately or close to silt grains. Agglomerated humic acid appears to be located mainly between the silt grains, connecting them to each other. Larger agglomerates of RES and BC300 can be distinguished; however, smaller ones appear to coat silt grain surfaces. Non-agglomerated individual particles of BC600 are located mainly on silt grain surfaces. A similar effect was also observed by Kelly et al. [
60], who noticed that biochar remained unassociated with soil particles.
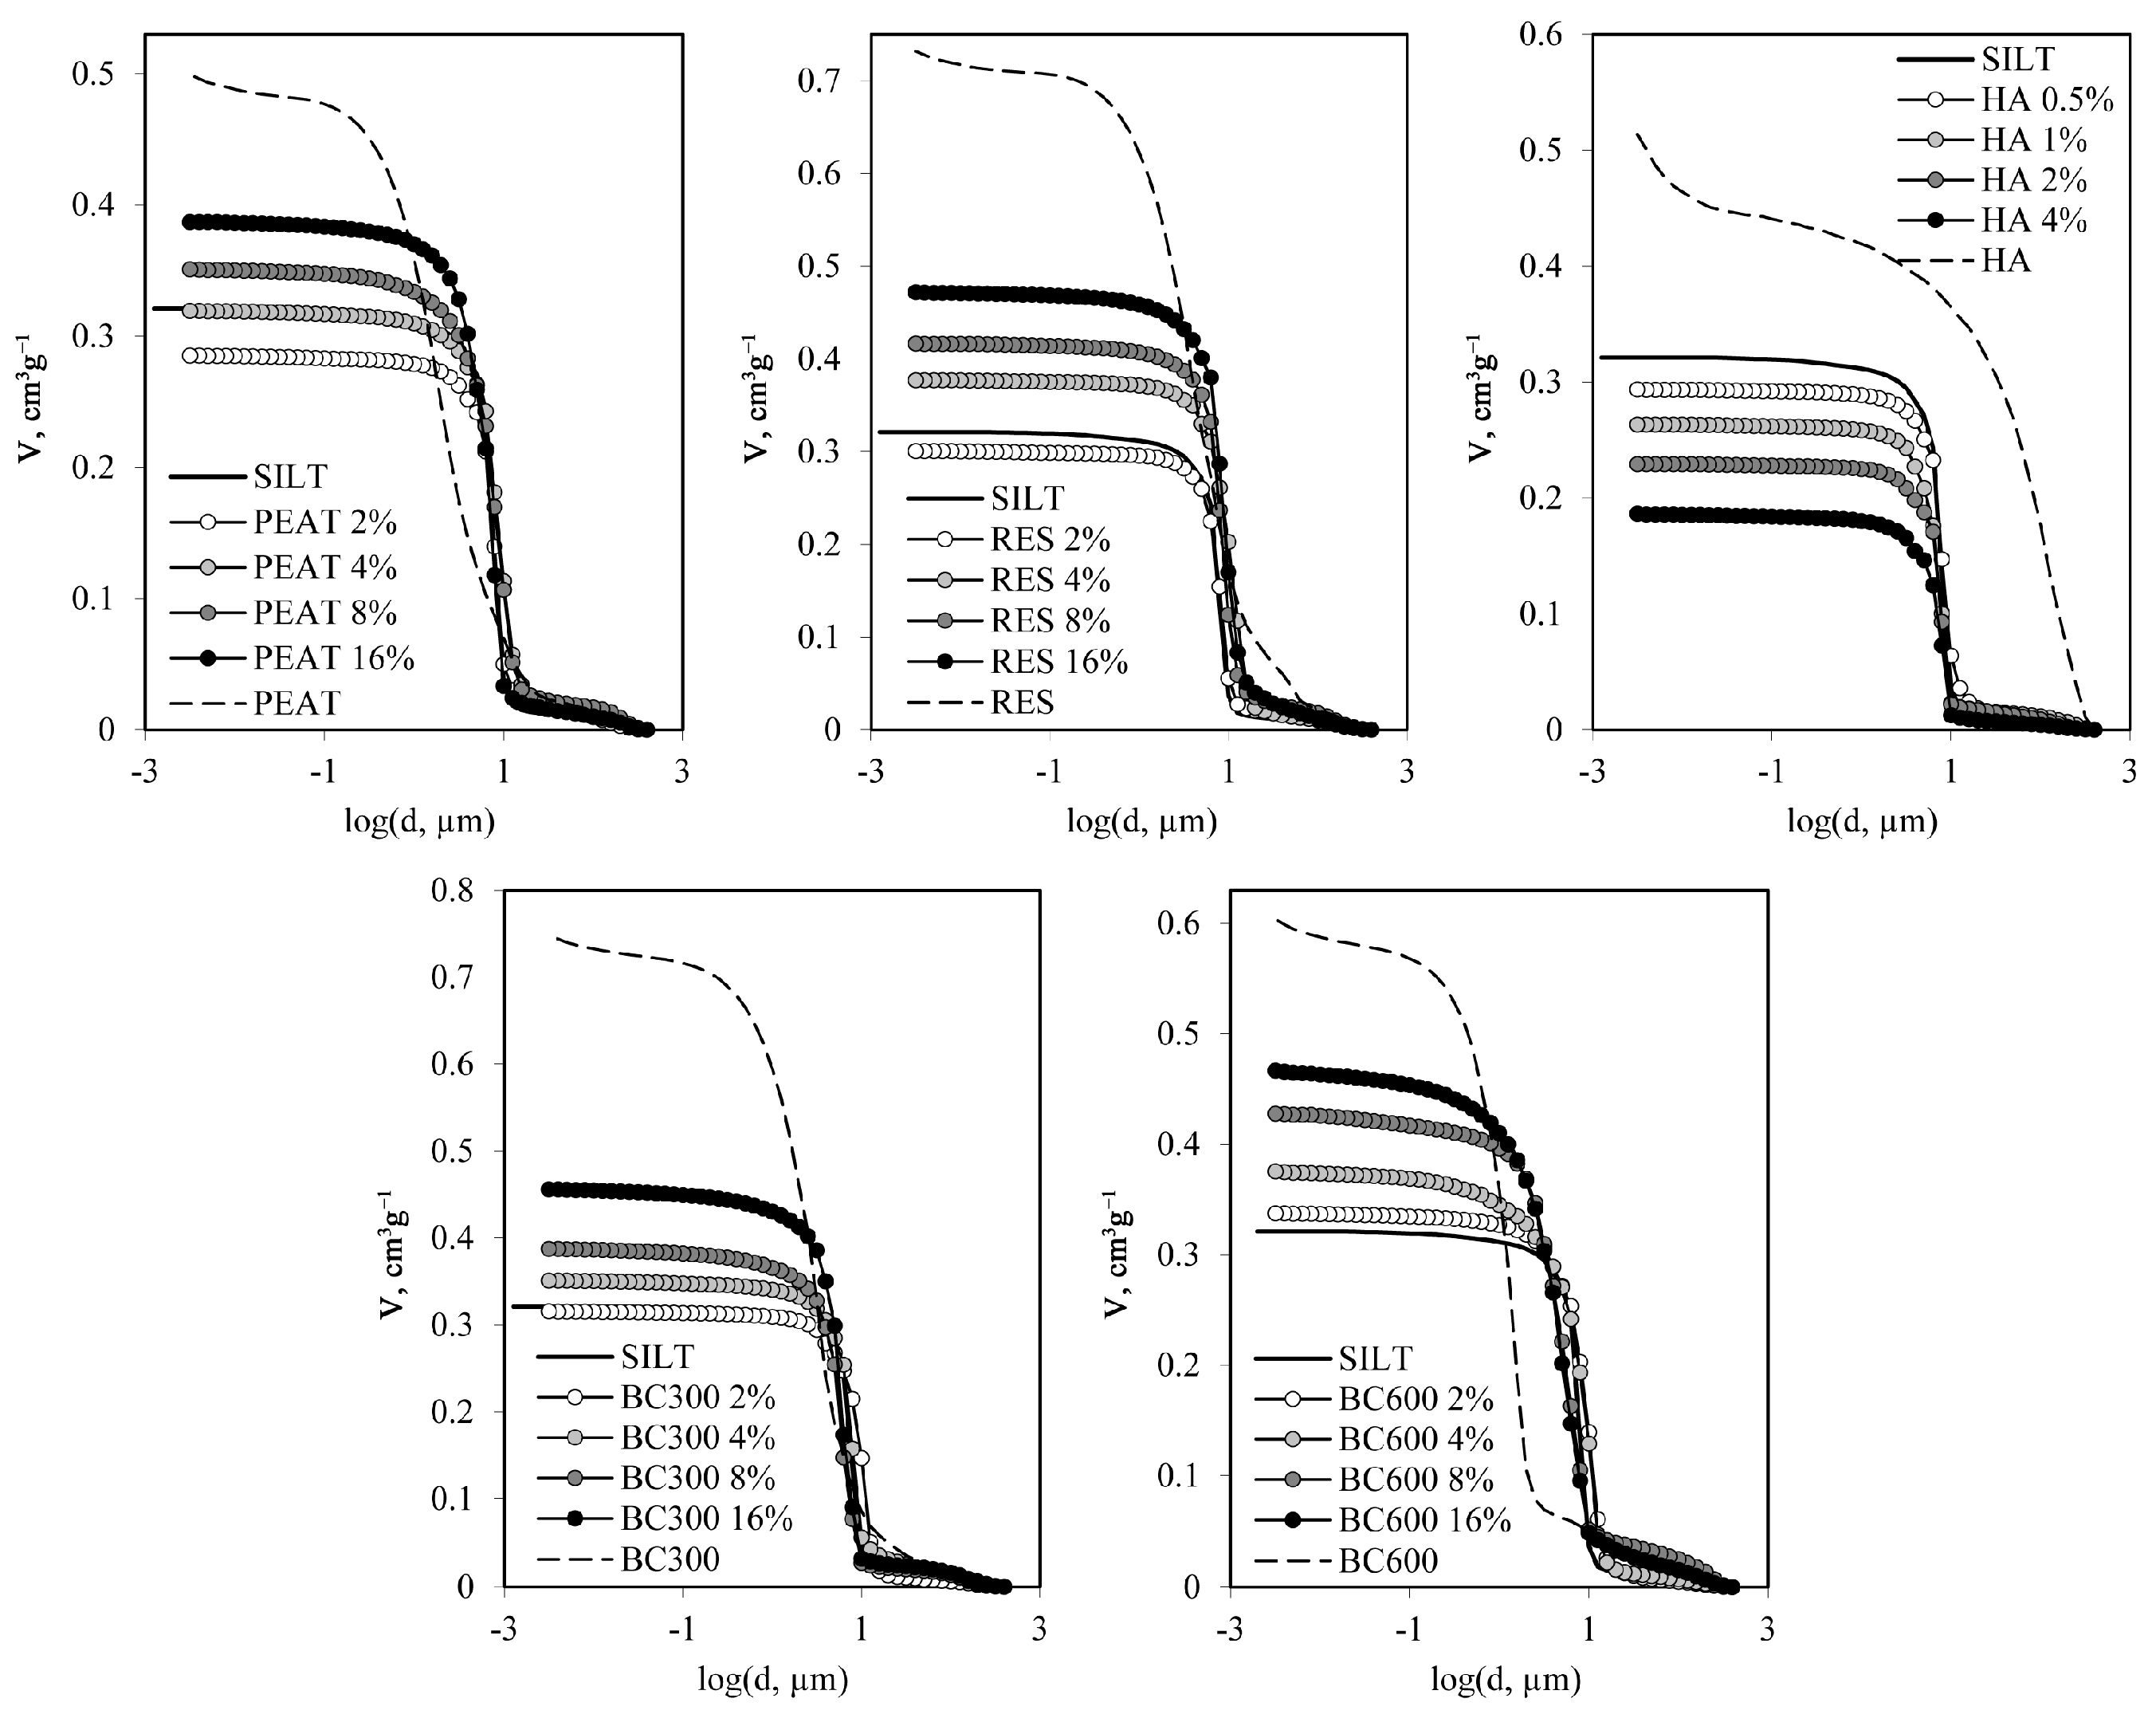
Mercury intrusion curves showing the dependencies of pore volumes on pore diameters for the studied aggregates are shown in
Figure 5. For pure humic acid, the results for the dried HA paste and not for the aggregate are presented.
The MIP curves for all studied aggregates have similar S-shapes. For all aggregates, a rapid increase in pore volume starts at around 10 µm pore diameter; however, for pure BC600, it starts around 0.4 µm. For pure silt and silt/organic aggregates, the pore volume increases very slowly for pores smaller than around 1 µm, whereas for aggregates composed of pure organic substrates, the pore volume increases again for pores smaller than 0.1 µm. Two main parameters of the total aggregate porosity may be derived from the whole range of mercury intrusion: the total volume of pores and their average diameter. The above parameters along the bulk density of the aggregates formed from the silt and pure organic substances are presented in
Table 3.
It is important to note that the total pore volume,
Vt, and the average pore diameter,
dav, presented in the above Table for HA, cannot be compared with the same parameters measured for the aggregates of the other materials. The dried HA paste was composed of grains of around 0.2–1 mm (by eye) of a flaky to spongy structure, which were markedly smaller than 8 mm aggregates of the other substrates. According to Jozefaciuk [
49], the MIP results, particularly at low pressures (large pore diameters), depend very strongly on the dimensions of the studied objects. Even the same materials crushed and sieved to various sizes had quite different MIP curves.
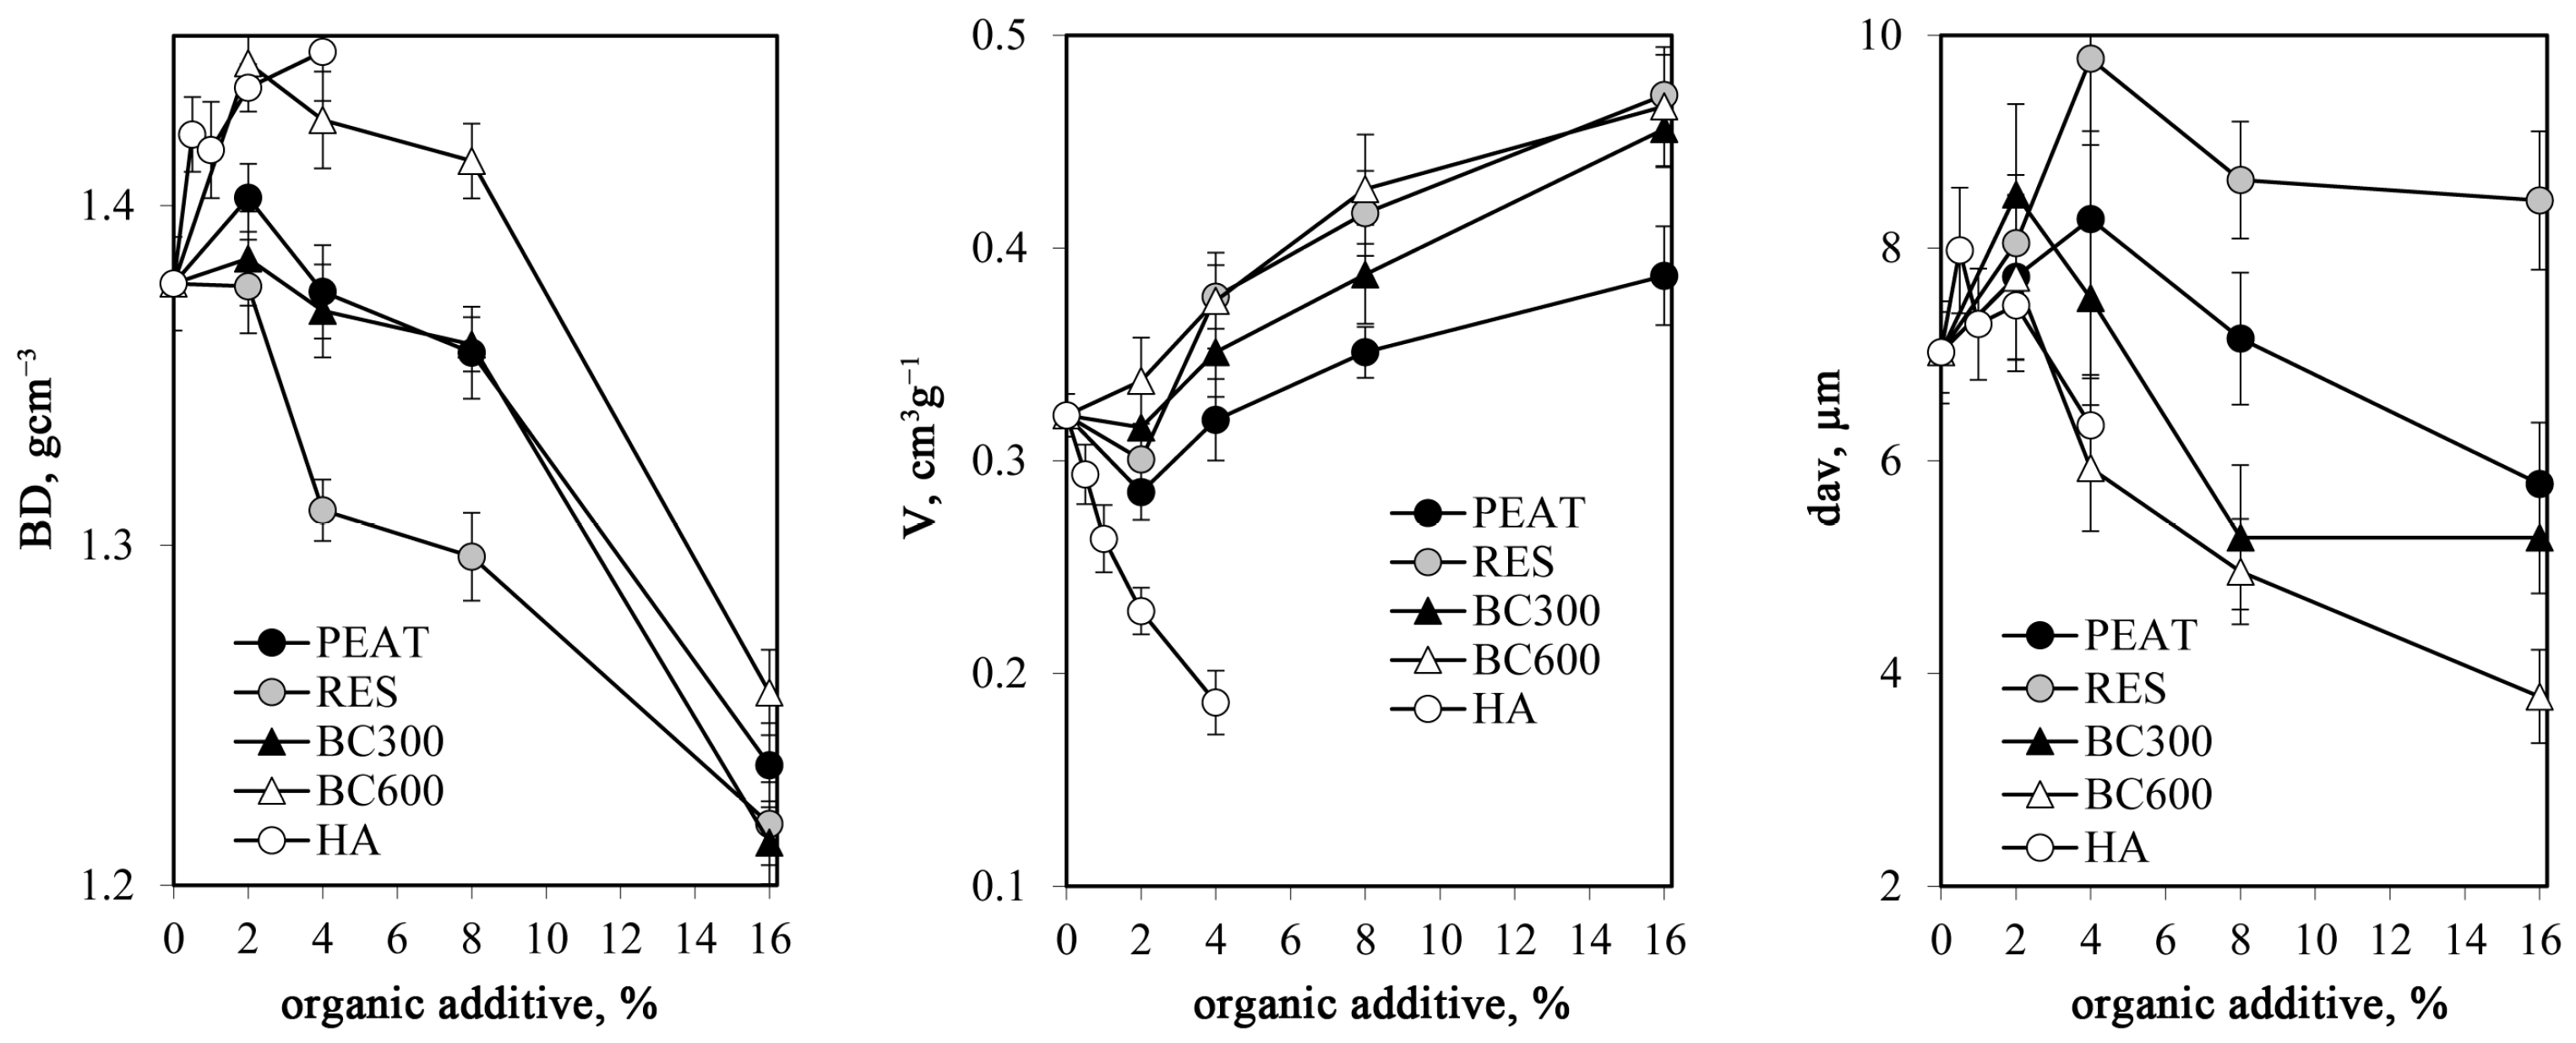
Changes in bulk densities, total pore volume, and average pore diameter in the whole MIP experimental window for silt–organic aggregates are shown in
Figure 6. For aggregates enriched with HA, the bulk density increases with the HA content. The effect may be related to the location of small HA particles within larger spaces between the particles within the silt skeleton. Our findings are in line with Liu et al. [
52], who found that finer organic particles can fill the pores between the coarse mineral fraction, resulting in more effective packing and higher bulk density. A similar phenomenon may explain why the bulk density of the silt–organic aggregates exceeds that of the pure silt for the small loads of the other organic substrates. An increase in
BD was also observed in soils of smaller organic matter levels by Munkholm [
61] and in biochar-treated field soil by Ajayi and Horn [
62] or Mukherjee and Lal [
63]. For aggregates containing PEAT, RES, and biochars, the bulk density goes through an initial rise before it decreases with an increase in organic substrate loads. The particle density of all organic substrates is significantly lower than that of the silt; therefore, the observed reduction in the bulk density of silt–organic aggregates at higher loads of organic substances may be a direct consequence of organic substance addition. It is also possible that after filling the silt skeletal pores, the excess of organic particles sits between the silt grains, pushing them apart and loosening the pore structure. Soil organic matter acts as a crucial bonding material in soil structure formation by establishing complexes with primary mineral particles and secondary structural units. In this way, interaggregate pores are formed, resulting in a general reduction in bulk density. Reduction in soil bulk density by organic materials has been reported by other authors, confirming the dominance of this effect at a wide range of organic material types and concentrations [
52,
64,
65,
66,
67,
68,
69]. Furthermore, a decrease in soil bulk density is frequently observed due to biochar amendment [
25,
70,
71]
The inverse behaviour to that of the bulk density is observed for total pore volume, which seems rather obvious: higher porosity induces smaller bulk density. The average pore diameter increases at the smallest loads of all organic materials. This may be explained by either the location of a part of organic species between silt particles, moving them away from each other, or by the creation of relatively large pores on the aggregate external surface. For HA-containing aggregates, a reduction in pore volume accompanies a decrease in pore sizes also at higher HA rates. Surprisingly, for the other aggregates at higher organic substrate loads, the pores become narrower with an increase in pore volume. Our results are somewhat different from those presented by Skic et al. [
72] and Dlapa et al. [
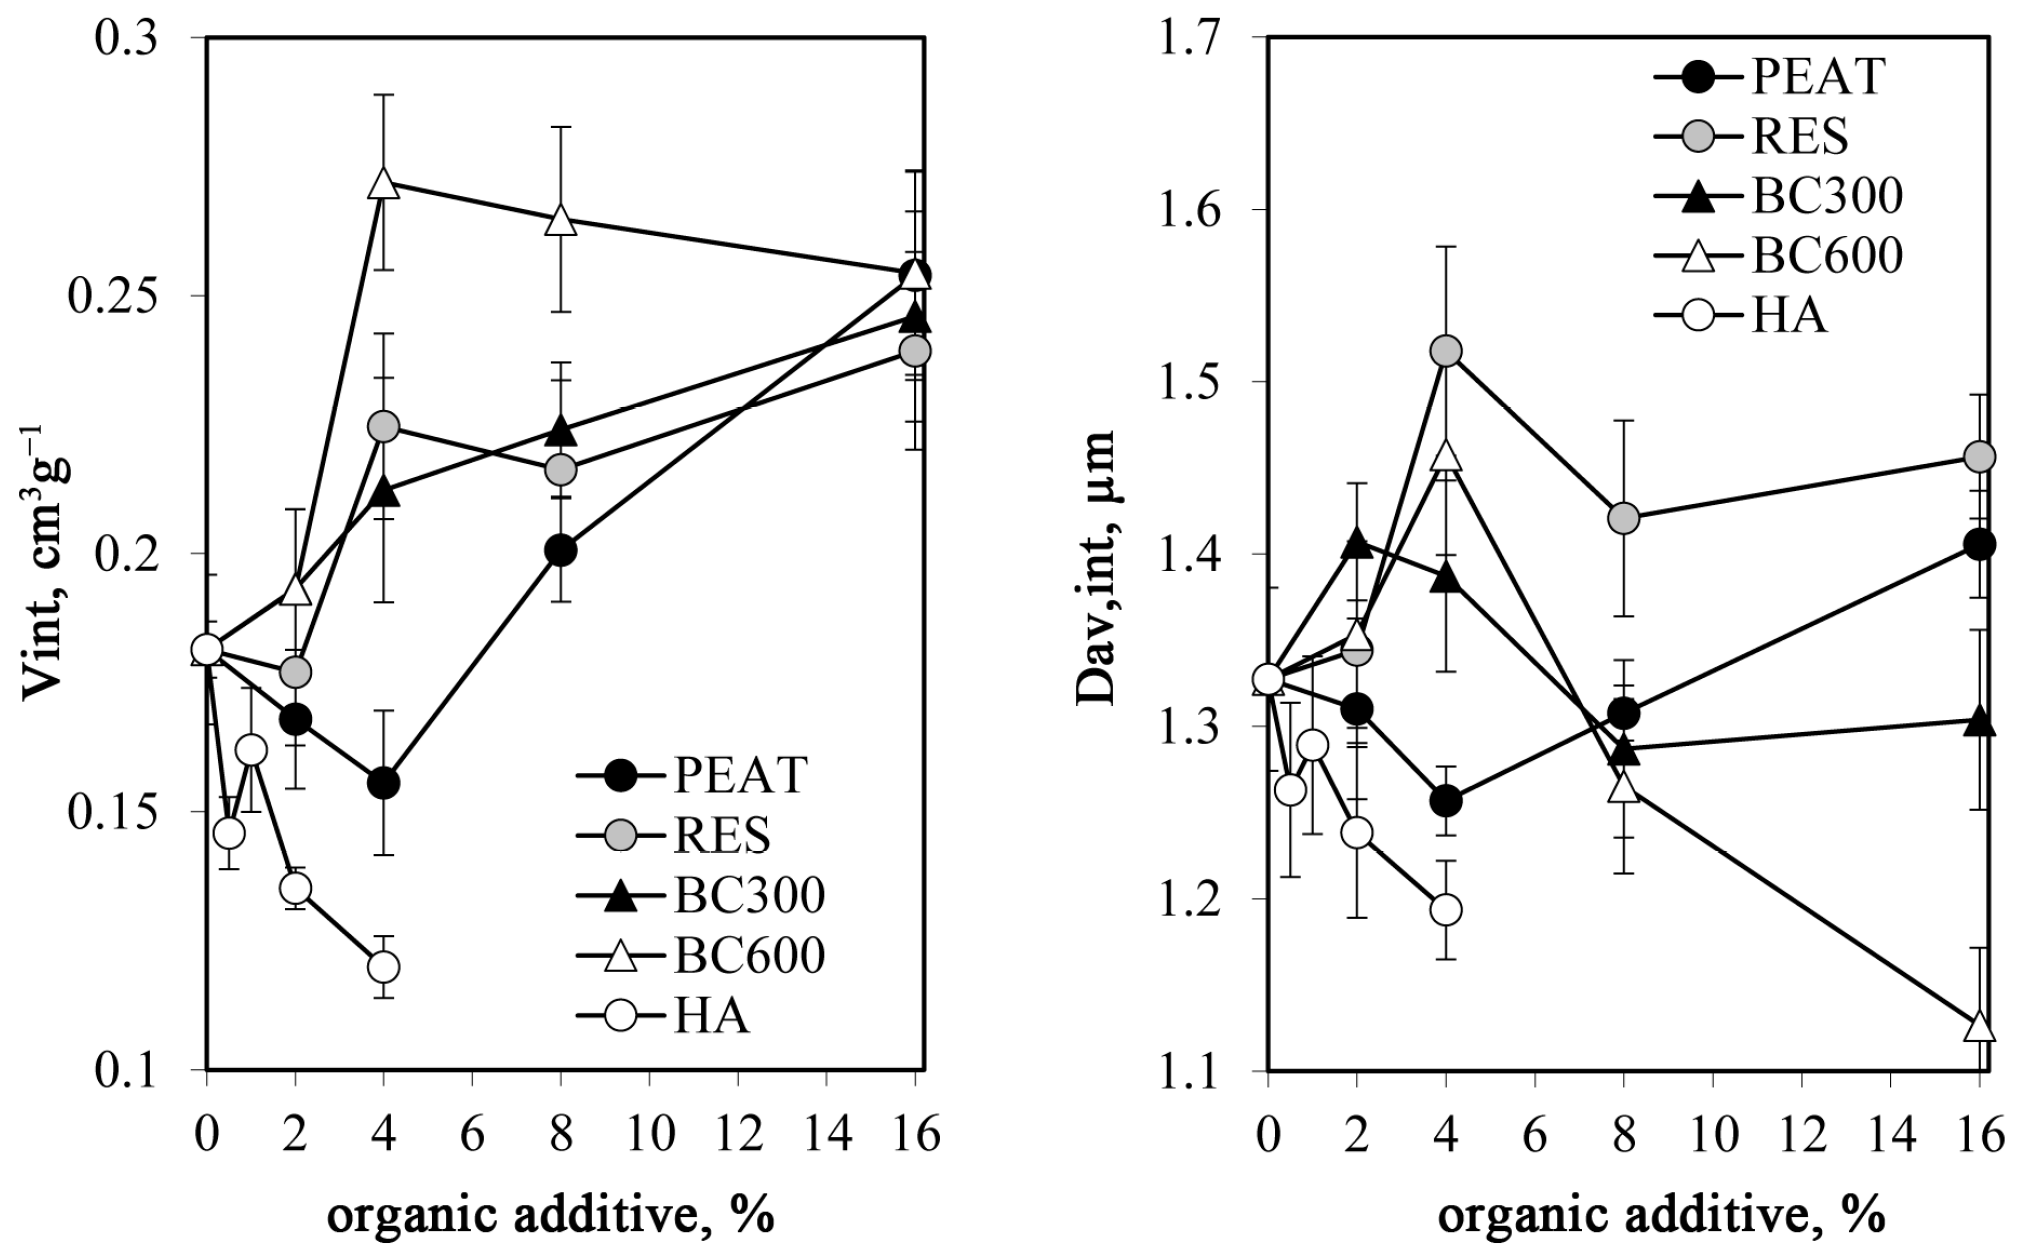
73], who reported that a higher carbon content promotes the formation of elongated pores of a higher pore diameter. In the authors opinion, the dependencies between pore parameters could be better understood based on the intrinsic porosity parameters measured below penetration thresholds. Intrinsic pore volumes and average diameters of the studied substrates are presented in
Table 4.
The intrinsic pore volume and diameter of the HA are markedly smaller than other substrates, which can be due both to the smallest size of HA particles (the bed constituted of the smallest particles ought to have the smallest pores) and to the strongest attraction between HA particles during drying (pore shrinking). Changes in intrinsic pore volumes and sizes for silt–organic aggregates are presented in
Figure 7. The intrinsic pore volumes follow the same trends as the total pore volumes for all materials. Similar trends also hold for intrinsic pore diameter and average pore diameter.
Pores formed within the studied organic materials appear to have a fractal character. The roughness and geometrical irregularities of the pore surface have a crucial influence on the value of the fractal dimensions, which, for porous solids, may vary between 2 and 3. The value of 2 describes a regular (flat) pore surface, whereas the value of 3 corresponds to the highest pore-surface complexity. As was indicated by Bartoli et al. [
48], the mercury porosimetry data are difficult to interpret in terms of fractal geometry due to the pore connectivity effects. It has been recommended that only the data for a very narrow pressure range, exceeding the percolation threshold, should be used for computing a fractal dimension of pores located inside the aggregate. This practice has been exercised in our calculations. Pore surface fractal dimensions for pure organic aggregates (including dry HA paste) are higher than 3, which suggests the extreme complexity of fine pore surfaces. In the case of biochars, the large number of microporous structures can be a result of pyrolysis and the gradual release of volatile substances with increasing temperature [
74]. Such high values can also indicate a specific wavy buildup of fine pores [
75] of a very high level of roughness [
76].
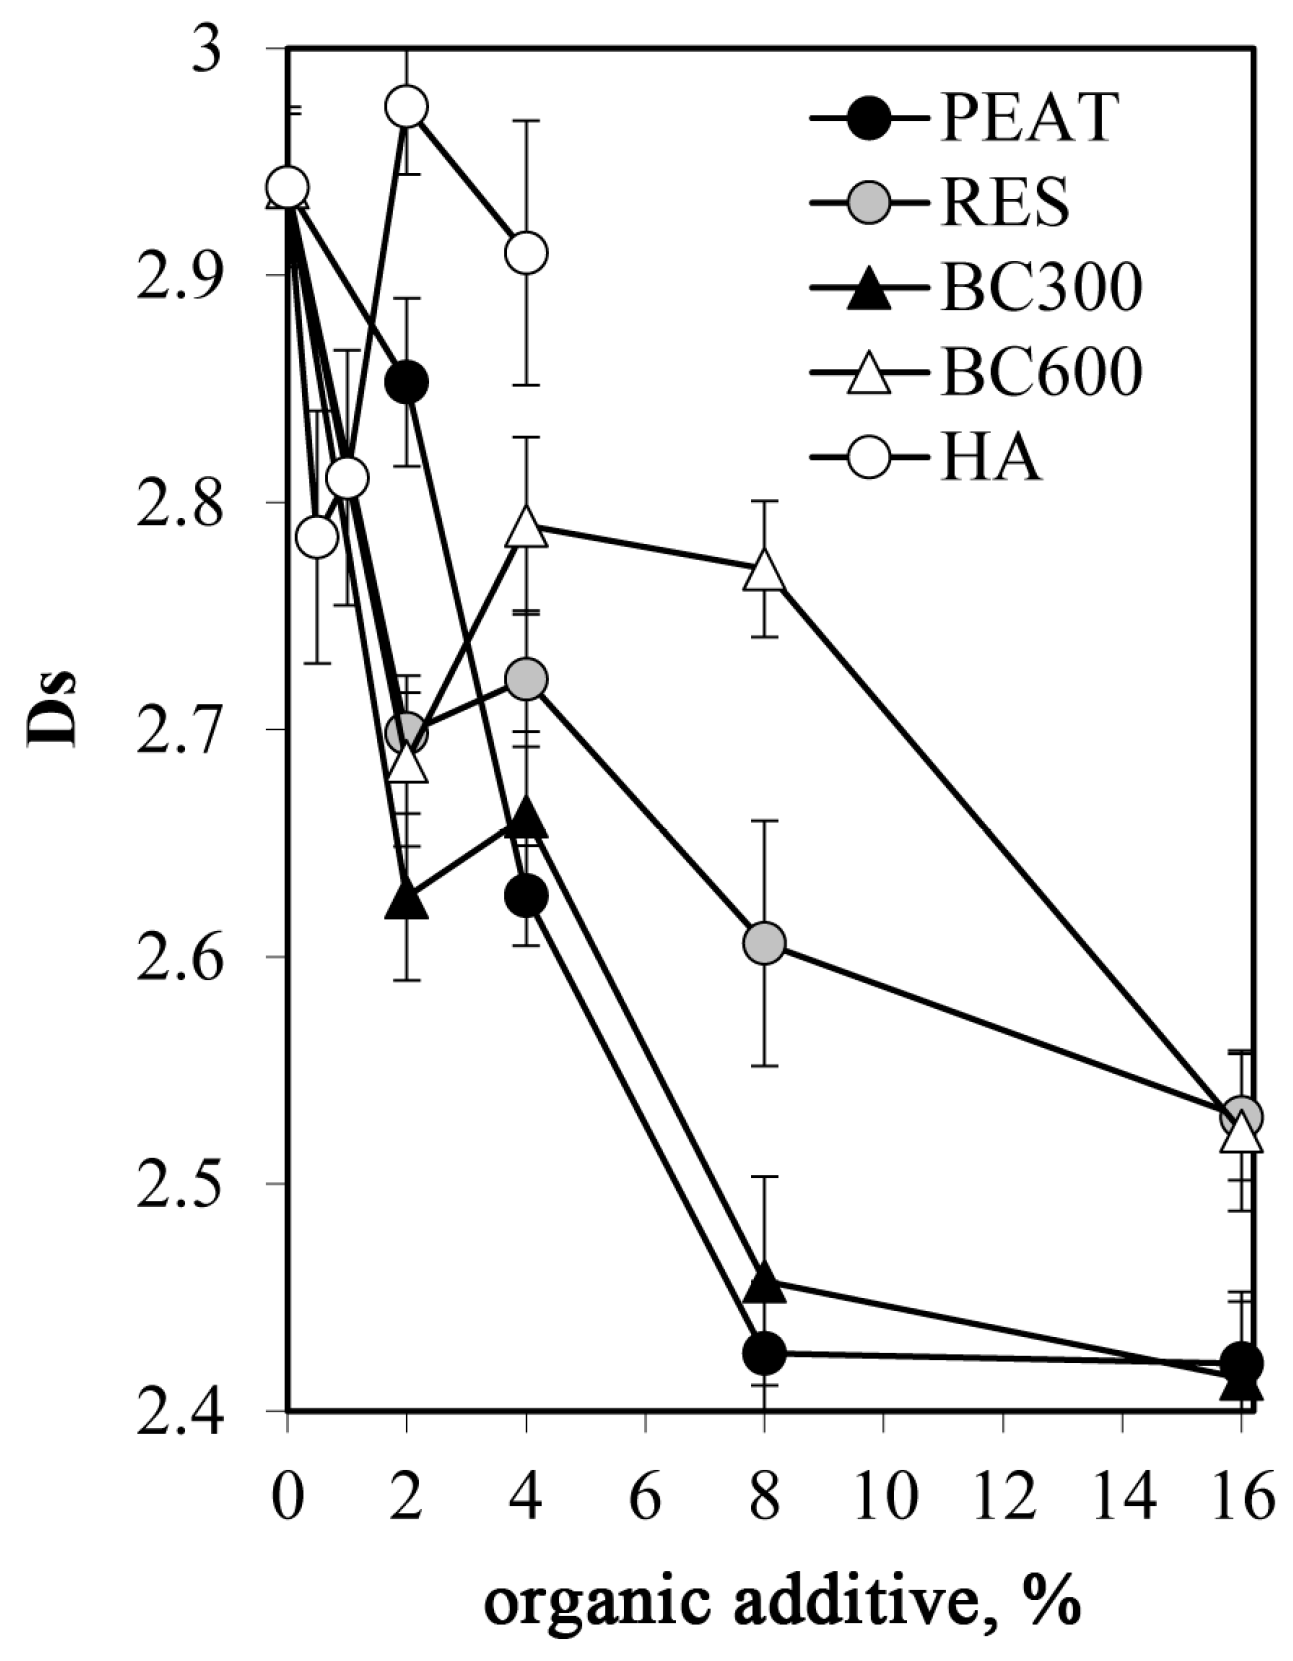
The behaviour of pore surface fractal dimensions of the studied silt–organic aggregates is shown in
Figure 8. The most complicated, rough surface belongs to pores of HA-containing aggregates, for which the fractal dimension varies between 2.78 and 2.97. For low HA amendments, the fractal dimension initially decreases and then increases at higher HA loads. For the other organic substrates, the Ds value appears to decrease with the increase of the substrate dose. Similar findings were found by Sokolowska et al. [
77], who noticed a substantial decrease in the peat–muck soil fractal dimension with the organic carbon content but increased with the amount of humic acids characterized by complex chemical composition and irregular structures. A decrease in fractal dimension and smoothening of pore surfaces can be due to the filling of the finest pores or the blockage of their entrances by small-sized organic particles [
78].
3.3. Strength of Aggregates
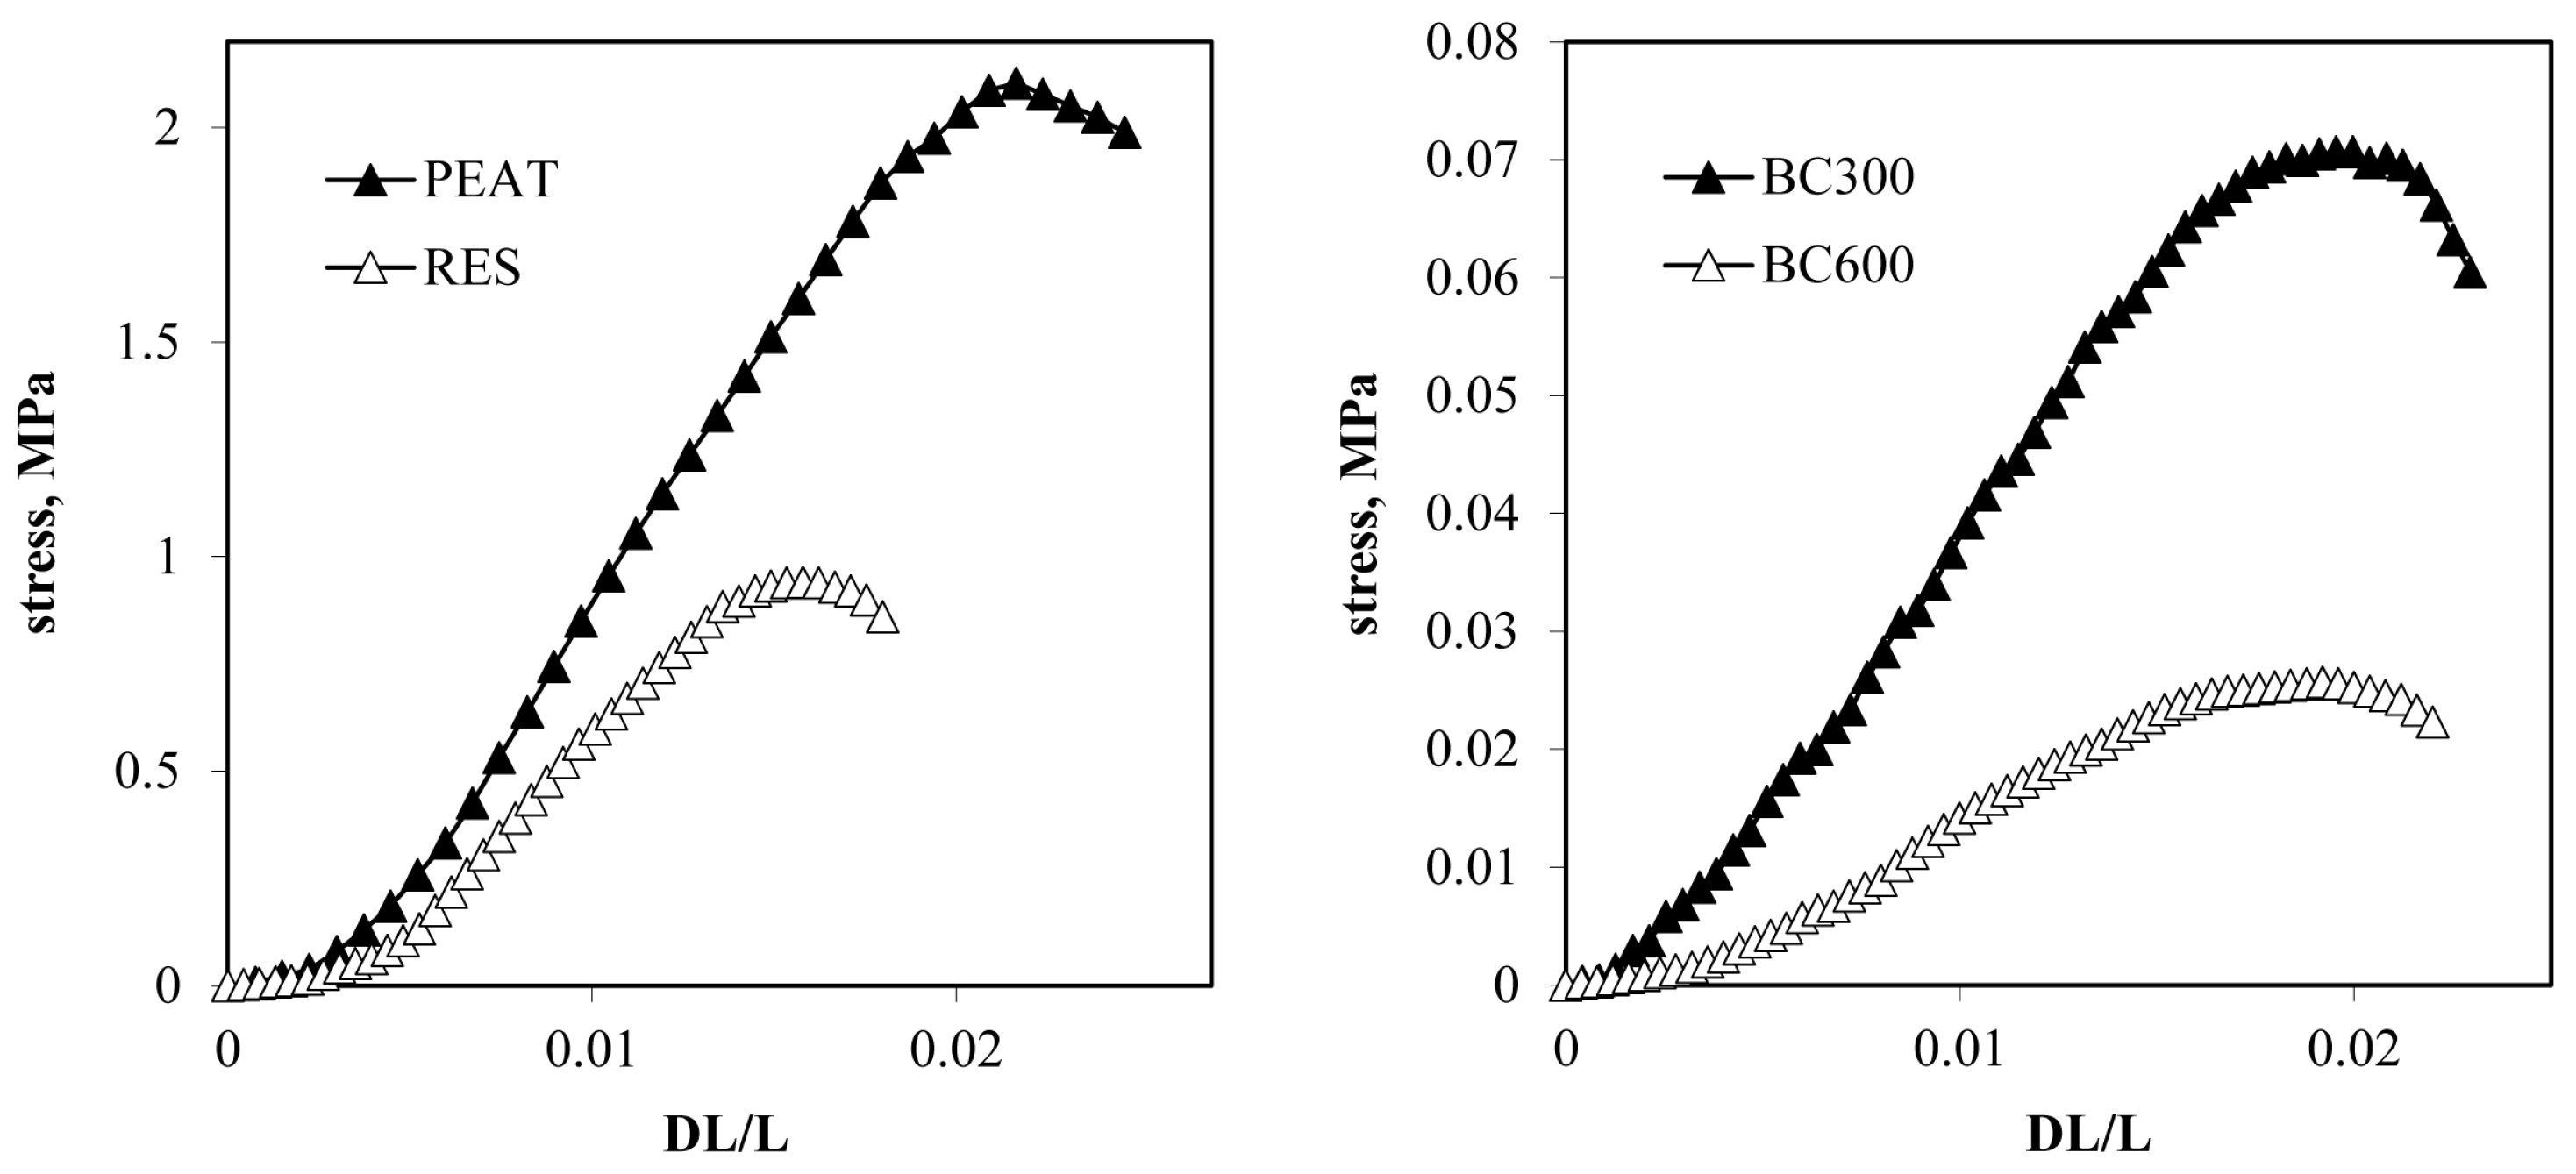
Stress–strain curves derived from uniaxial compression tests for aggregates of 100% organic substrates (excluding HA) are presented in
Figure 9. The ductile breakage mode (i.e., significant plastic deformation before failure and distributed cracks [
79]) was observed for organic substrates. The highest strength was measured for the PEAT aggregate. Peat soils are geotechnically problematic due to high compressibility and low shear strength. In many cases, the shear strength of different peats from a few to a maximum of twenty kPa has been reported [
17,
80,
81], which is much lower than over 2000 kPa observed in our experiments. Such significant difference is most probably linked to various material structures: natural peat has a fibrous, spongy structure [
82], while the peat used in the present studies was dried and milled into small particles, enabling stronger aggregate formation.
The residue after humic acid extraction has around two times smaller strength than the PEAT. The BC300 aggregate demonstrates a tenfold lower strength than RES. The aggregates of BC600 have the lowest strength, around three times lower than BC300. Unfortunately, the strength of the HA aggregates cannot be compared with the values above because pure HA aggregates were not prepared in this study, as detailed previously. However, considering the extremely high effect of HA on silt aggregation, presented below (see
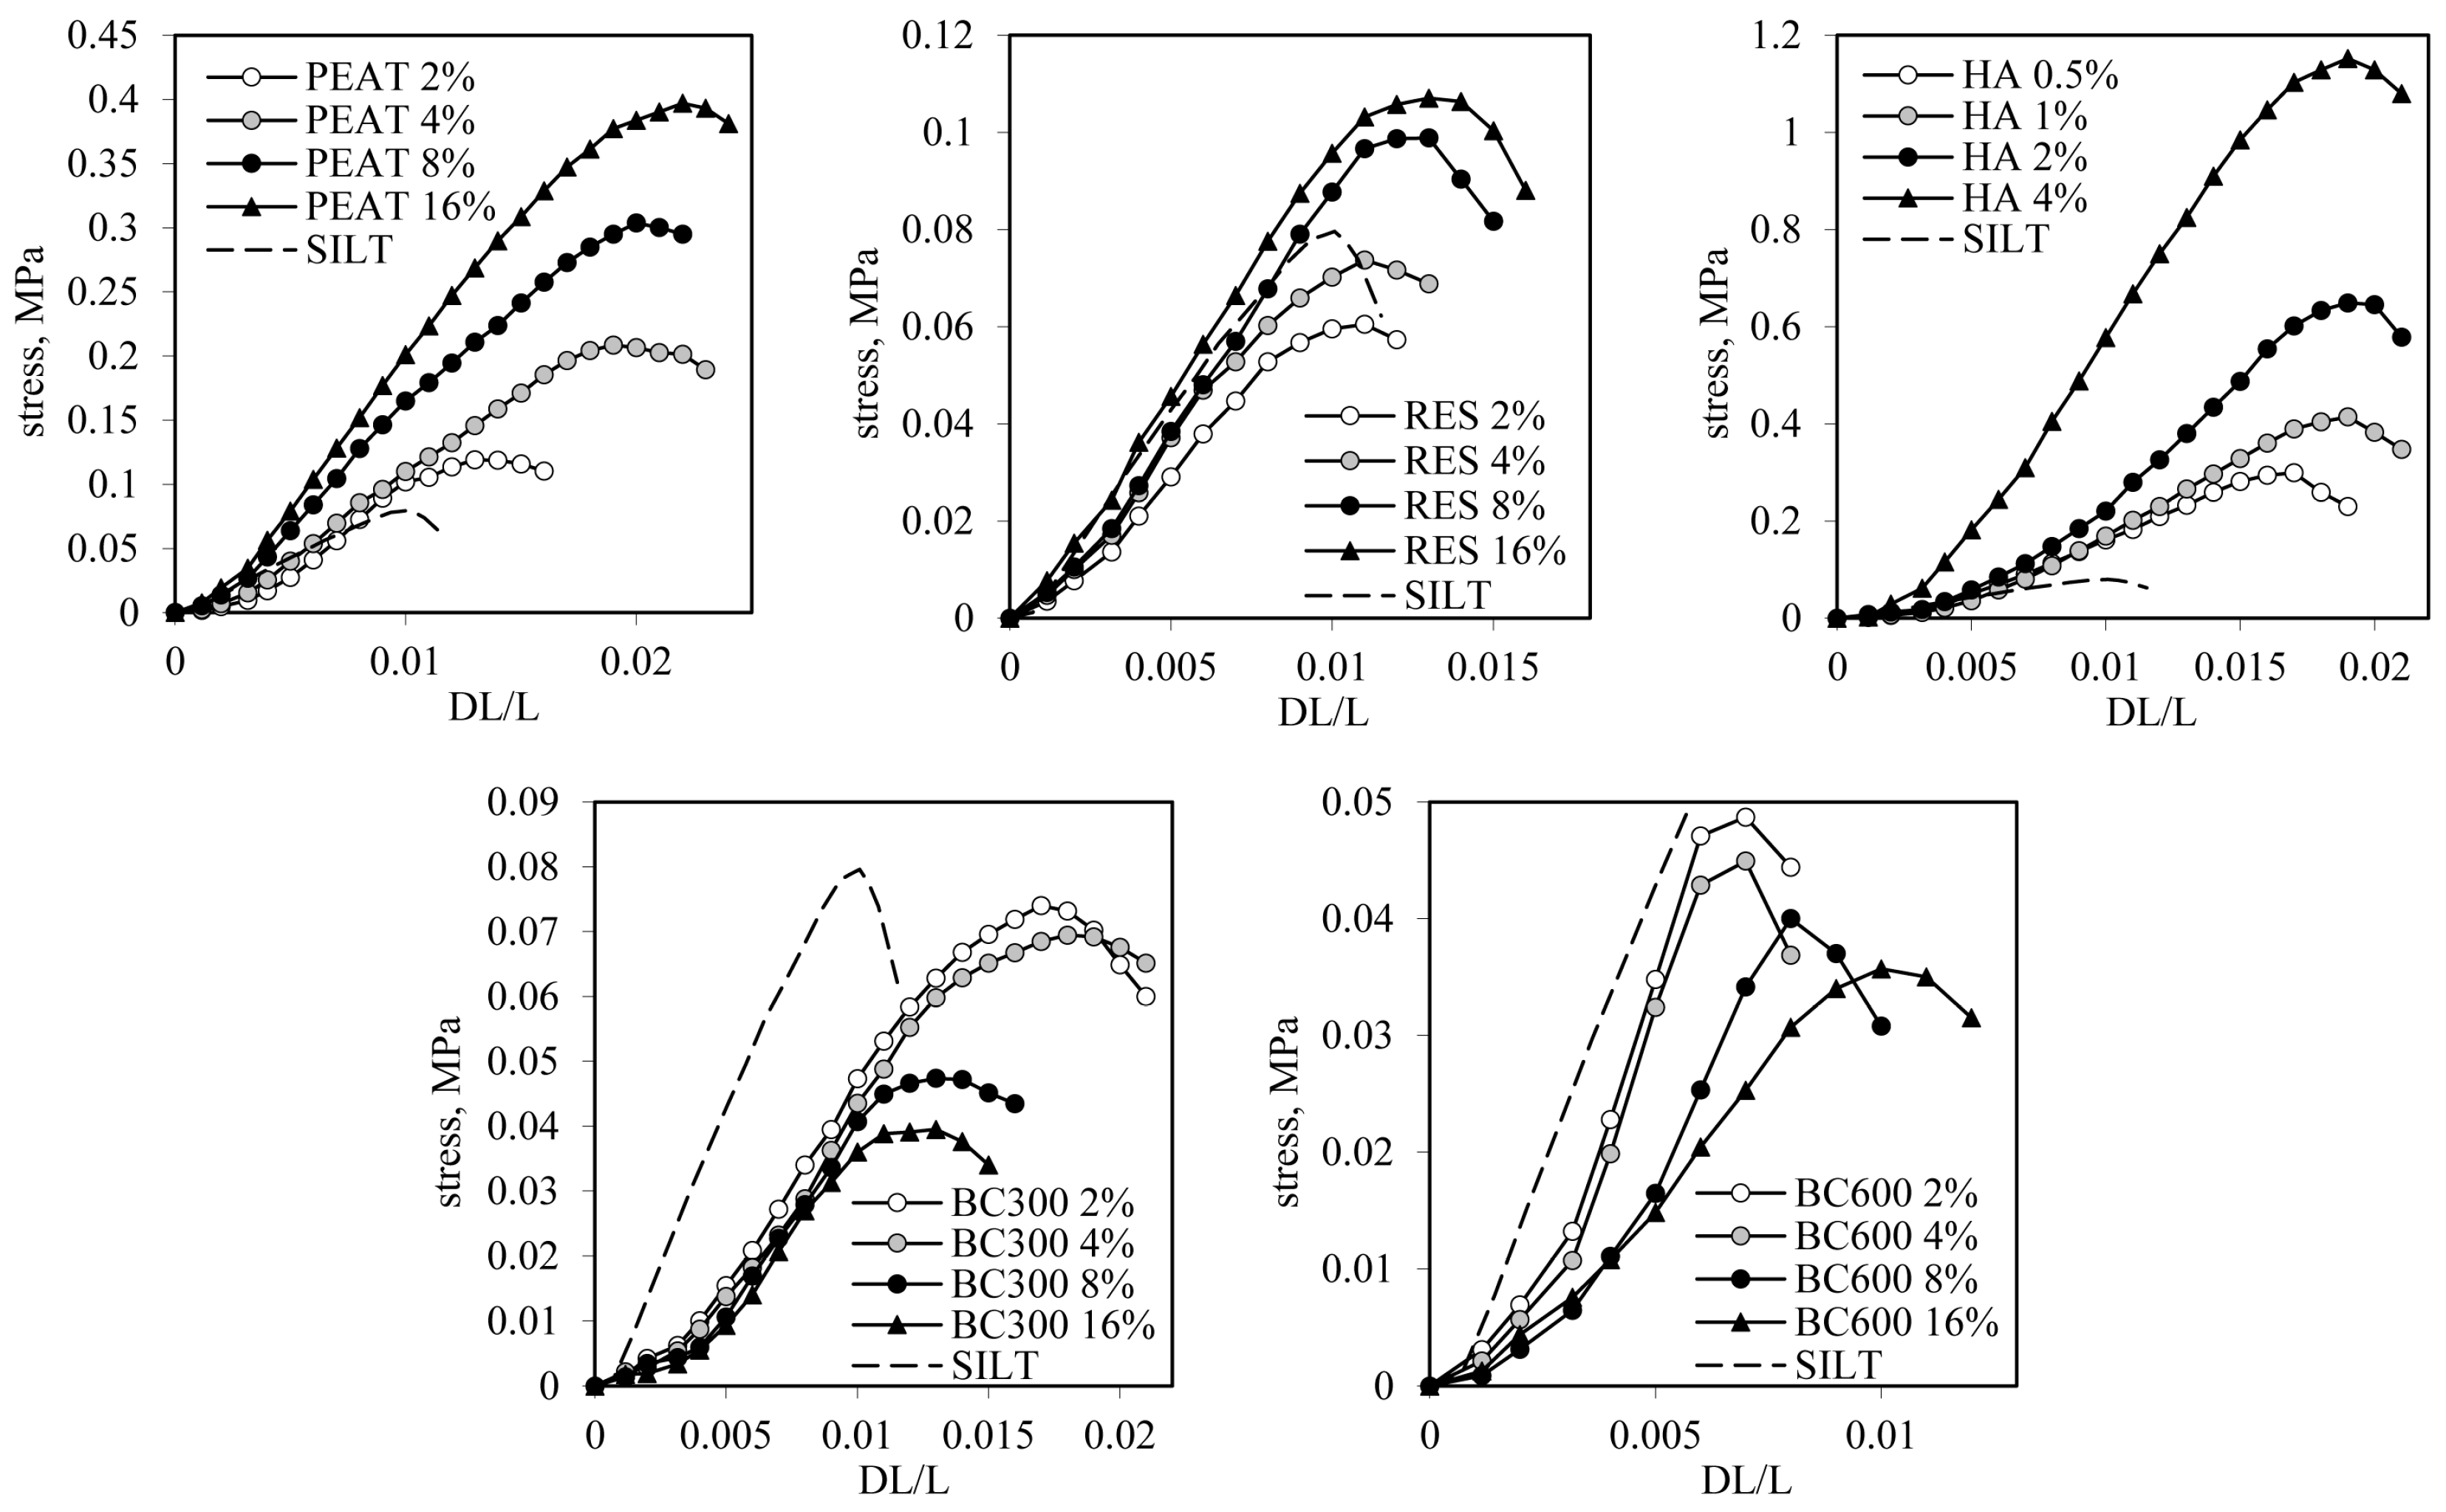
Figure 10), one can suspect that the pure HA aggregates should have significantly higher strength than that of the PEAT. The stress–strain curves resulting from uniaxial stress tests for the studied silt–organic aggregates are shown in
Figure 10.
Generally, it is acceptable that particle size is the primary factor responsible for the aggregate’s strength. Aggregates composed of smaller particles have higher compressive strength [
83,
84,
85] due to capillary effects at the grain-to-grain contacts [
86]. In our studies, the descending order of particle size was SILT, PEAT, RES + both biochars (all of the latter three substrates have almost the same particle size), and HA. Nevertheless, the order of increasing aggregate strength does not reflect the particle sizes. The strength of SILT aggregates, composed of particles 15 times larger than both biochars, is similar to BC300 and higher than BC600. Despite being composed of particles of similar sizes, the strength of RES, BC300, and BC600 aggregates is quite different. The strength of the RES aggregate is over two times smaller than that of the PEAT aggregate, which is built from larger particles than the RES. The controversies above can be partially explained by different organo–mineral interactions stabilizing aggregate structure. Some authors indicate that the binding effect of organic matter on an aggregate’s stability is closely linked to its intrinsic chemical composition expressed in terms of cellulose, hemicellulose, and lignin contents [
87], while high content of aromatic carbons hamper aggregation [
13]. Our results have shown that the strength of the aggregates increases along with an increase in the surface charge of the organic substances and their surface acidity (see
Figure 3 and the respective comments). It may be hypothesized that the acidic surface groups of hydrophilic character bind the neighboring particles together, possibly through the residual layer of the adsorbed water or by polyvalent cation bridging. What is more, an increase in surface hydrophobicity decreases the aggregate strength [
88], which was explained by a state of water on hydrophobic surfaces. Chen and Sun [
89] stated that water in hydrophobic sands would not form a meniscus, but it forms water droplets on the particle’s surface instead. Indeed, among the investigated aggregates composed of pure substrates, the smallest strength is associated with the biochar synthesized at 600 °C, which has the lowest charge and the highest share of aromatic groups and thus should be the most hydrophobic.
In general, significant plastic deformation before failure was observed for aggregates. Pure silt aggregate was the exception, breaking in a semi-brittle mode (little plastic deformation before failure).
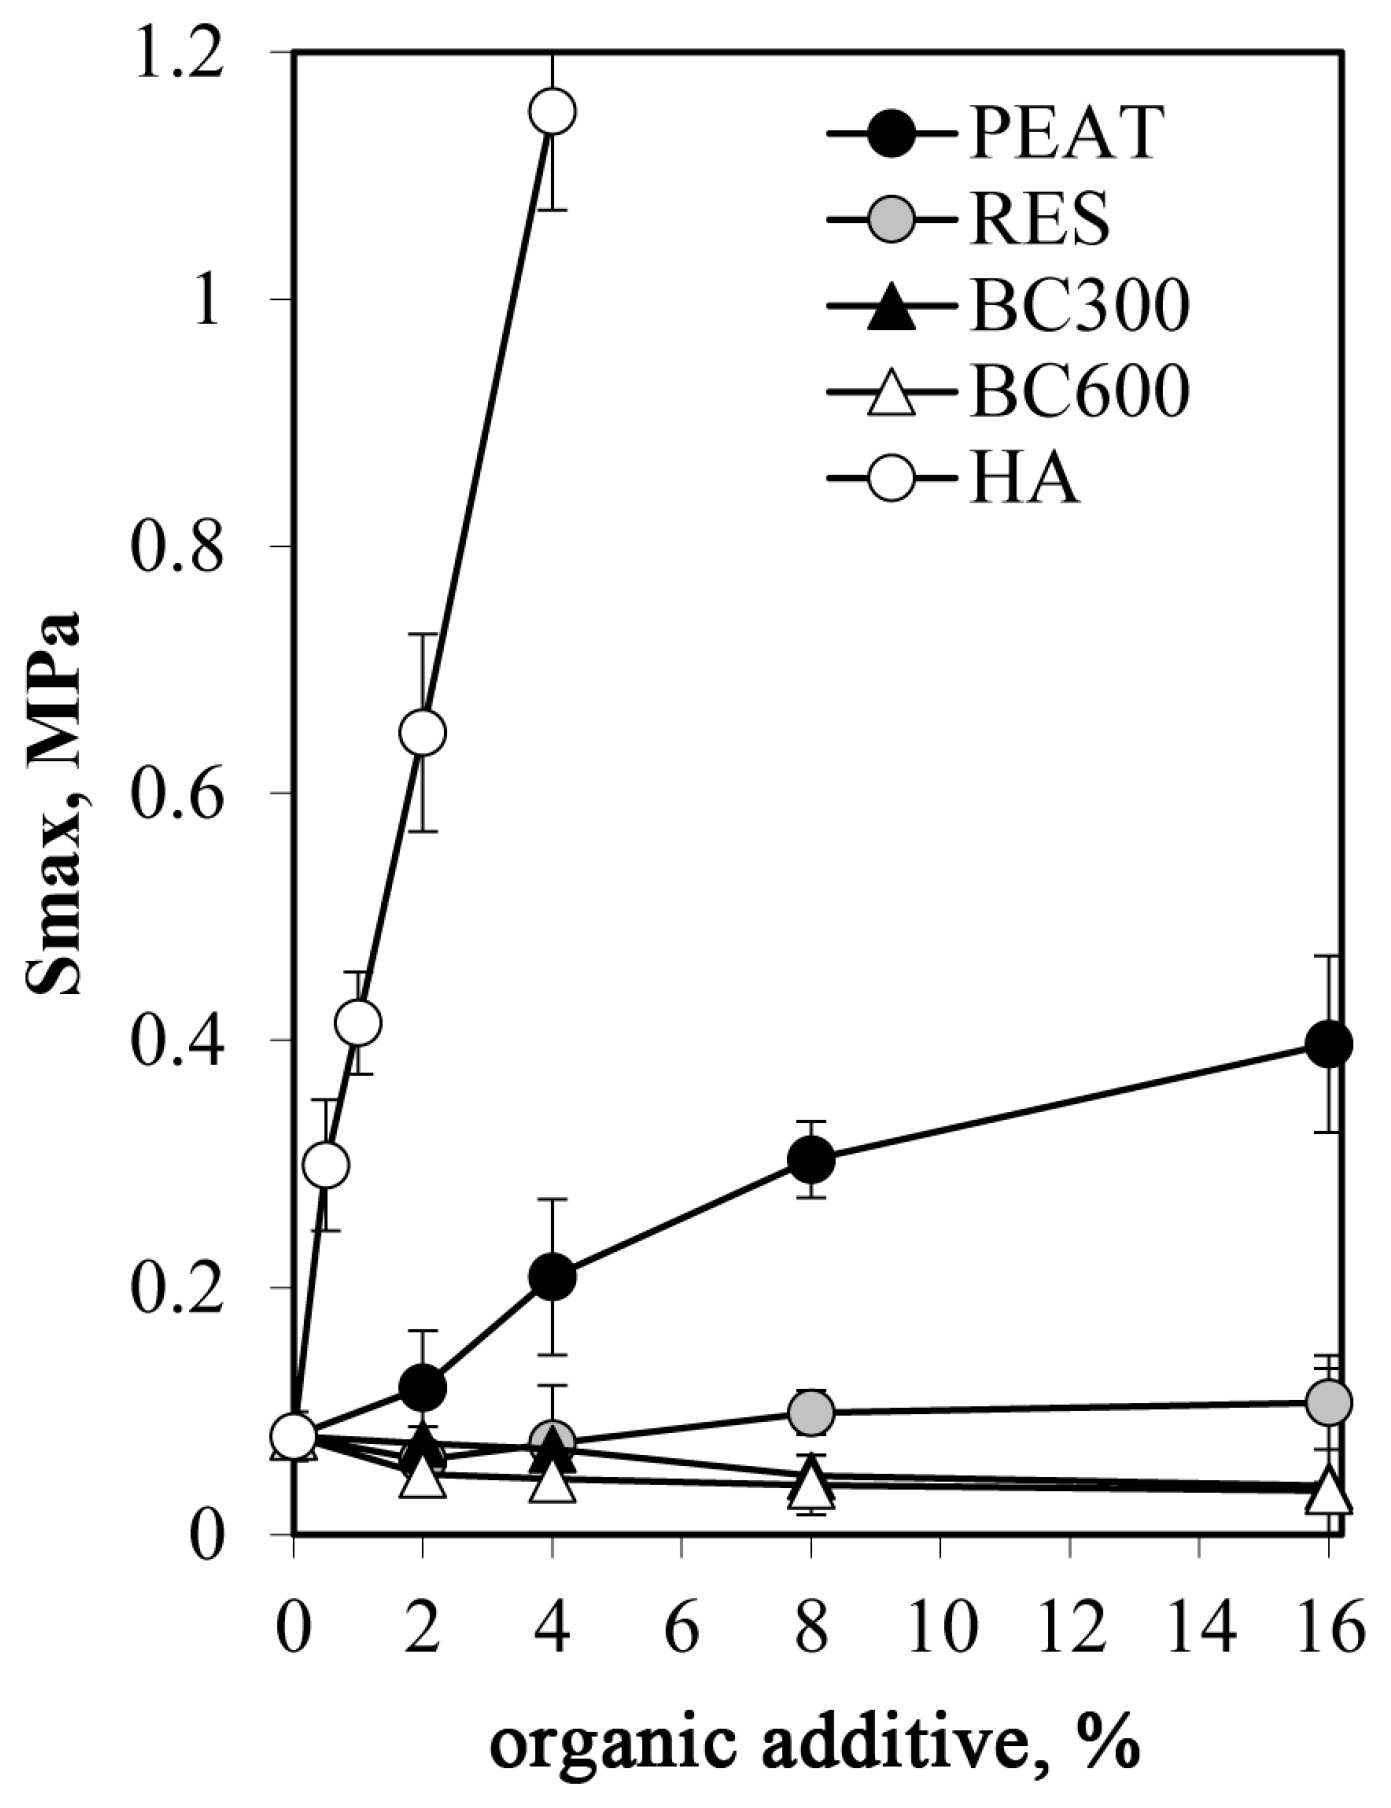
Figure 11 summarizes the dependency of the maximum strength of the silt–organic aggregates on organic substances percentage.
The maximum strength was observed for aggregates that contained humic acids. The high stabilizing effect of HA on aggregates can be related to the small size of HA particles, which can produce more interparticle contact points. Furthermore, the small HA particles can easily penetrate the silt structure and coat the silt grains [
90], gluing them together. The silt–HA complexes formation through Al and Fe bridges may enhance the strength of such coatings [
91]. Indeed, for the same silt used in the present paper but cleaned from Al and Fe oxides, the rupture force of the aggregate increased with humic acid content up to 1% and decreased afterwards [
92]. For Al/Fe containing silt, the strength of the aggregates increases in the whole range of HA added. The maximal strength of peat-containing aggregates is lower than that of the HA-enriched aggregates and higher than for aggregates containing the residue after HA extraction. The maximal strength increases with the rate of the above materials. Increasing the dose of both biochars diminishes the strength of the silt aggregate. Similar findings were reported by Sokołowska et al. [
93], who found that biochar diminished the tensile strength of model soil aggregates regardless of the starting materials used in the pyrolysis process. The reduced tensile strength of the biochar-containing aggregates underscores the fact that biochar weakens the interparticle bonding and reduces the density and overall cohesiveness, as also suggested in the literature [
94,
95,
96,
97]. Biochar produced at 300 °C consolidates the silt aggregates to a greater extent when compared to BC600. The effect can be due to the release of small particle-sized, humic-like substances of gluing character. As it was reported by Joseph et al. [
98], biochars produced at low temperatures added to moist soils could release a considerable quantity of soluble organics into the soil solution. Similar to pure substrates, the consolidation effect of organic substrates on silt aggregates cannot be explained by their particle sizes.
The dependence of maximal stress on the concentration of the substrates can be approximated by a Langmuir-type equation, similar to that introduced by Horabik and Jozefaciuk [
99] for kaolin-silt aggregates, which has been proven to be applicable for other minerals [
47]. For the silt–organic aggregates studied in the present paper, this equation has been written in the updated form:
where
Smax,SILT is the maximal stress of the pure silt aggregate,
c is the weight/weight ratio of the organic substrate to the silt, and A and k are constants. The ± sign before the second term in the RHS of this Equation means that the + sign is placed when
Smax increases with
c (PEAT, RES and HA), and the - sign holds in the opposite case (BC300 and BC600). The A constant may be treated as the strength of the aggregate for which
c tends to infinity (i.e., the silt content approaches zero), and the k constant relates to the rate of
Smax changes with
c increase.
The parameters of Equation (1) for the studied aggregates calculated from the experimental dependencies of
Smax vs.
c using Excel’s Solver tool (Microsoft Office Professional Plus 2019) are presented in
Table 5. This Table also contains values of maximal stress measured for aggregates prepared from pure substrates, read from
Figure 9.
We expected that the parameter A will be similar to the maximal stress of the aggregate prepared from the pure substrate; however, for PEAT and RES, the A values are markedly lower. Conversely, for both biochars, the A values are higher than the Smax of the pure biochar aggregates. It may be hypothesized that the difference in A and Smax can reflect the strength of interactions between silt and organic particles: if A < Smax, organic particles are more weakly bound to the silt than to each other, and if A > Smax, organic particles bound with the silt are stronger. We believe that this hypothesis is worth checking. We plan to do this in the near future.
3.4. General Remarks and Implications
The overall trends in changes of maximal strength and structural parameters of silt–organic aggregates with increasing concentration of the amendments are summarized in
Table 6. Mechanical stability is improved by peat, humic acid, and the residue after humic extraction from the peat, whereas both biochars weaken the aggregates. The above substances are applied to loosen the soil structure and decrease its mechanical resistance. As it may be concluded from our experiments, in the case of the peat, the commonly observed loosening of the field soil is mostly caused by the large size of particles of the added peat because clay-size peat particles strongly increase the aggregates’ strength. However, the strong compaction of aggregate structure and extreme hardening of the aggregates caused by the addition of humic acid observed in our studies is in contrary to the field observations. Because humic acid is applied in similar forms in both cases (field and laboratory), the field effects seem to be due to the inhomogeneous application of humic acid and the formation of strong aggregates at the points where humic acid is deposited. This shifts the aggregate size distribution towards larger values that enlarge soil pore volumes and decrease mechanical resistance. On the other side, the loosening of soil structure and decreasing strength are valid for both large and clay-size biochar particles. The differences between the impact of the biochars and the other substrates on the aggregate strength may indicate the importance of surface properties of these materials, such as surface charge and hydrophobicity.
The particle size of individual organic additives did not reflect the mechanical strength of aggregates. Despite the fact that, as expected, humic acid of the smallest particles strengthens the aggregates to the greatest extent, peat of the largest particles is the second in line. Such high effect of peat on aggregate strengthening may be caused by the release of humic acids into the solution during aggregate preparation. Other substrates have very similar particle sizes, but their effects on aggregation are quite different. It may be caused by differences in the mutual position of organic particles with respect to silt grains. Two main positions may be distinguished: when organic particles group within large pores inside the silt bed and when organic particles are located between the silt particles, pushing them apart from each other. Prevalence of inside-pore grouping should lead to a pore volume and pore radius decrease, an increase in bulk density and in the consequence, and an increase in aggregate strength. The dominance of the between-silt-grain location should lead to an increase in porosity and decrease in bulk density; however, the aggregate strength may either decrease or increase. An increase in the strength should occur when organic particles are strongly bound to inorganic grains (PEAT and RES); whereas if these interactions are weak, a decrease in the strength may occur (biochars). Because the ratio of organic particles in both positions should vary with their amount, the changes in different parameters accompanying small additions of a given organic component can differ from those at higher loads that are observed in our studies. For example, an increase in the average pore radius at small loads of all organic materials and its decrease with higher loads may indicate the prevalence of the between-silt-grains location at small organic loads. However, the ratio of organic particles located in both positions should also depend on the nature of the organic substrates, including their physicochemical and surface properties, which may strongly vary among various substrates; therefore, the impact of different organic species on soil structure and strength is difficult to predict.
Very similar trends in changes of structural parameters at higher organic loads are observed for PEAT, RES, and both biochars, which differ only in the behaviour of intrinsic pore diameter. The intrinsic porosity in biochars-containing aggregates is mostly associated with fine pores inside biochar particles rather than the formation of new pores between silt and the organic material. Humic-acid-amended aggregates behave in quite different ways than aggregates containing other organic substrates. Only humic acid addition led to an increase in the aggregate bulk density and a decrease in the total volume of pores, which apparently indicates the strong prevalence of the inside-pore grouping of HA particles.
Our hypothesis that the organic particles should compact soil structure and increase soil strength seems overly simplistic because it assumes that filling large skeletal pores is a dominant process after clay-size organic species addition. As it was observed, the location of organic particles between the skeletal grains also plays a significant role. Probably in both aforementioned cases, interactions between organic and inorganic soil components are the most important factors affecting the strength. Various physical and chemical mechanisms of these interactions for different organic substances make it difficult to predict the results of soil structure formation processes under various organic additives. This topic requires more detailed studies.


 ,
, 


