Article

A High-Precision Detection Method of Apple Leaf Diseases Using Improved Faster R-CNN

1
College of Agricultural Engineering, Shanxi Agricultural University, Jinzhong 030801, China
2
School of Software, Shanxi Agricultural University, Jinzhong 030801, China
*
Author to whom correspondence should be addressed.
Agriculture 2023, 13(2), 240; https://doi.org/10.3390/agriculture13020240
Submission received: 1 January 2023 / Revised: 16 January 2023 / Accepted: 16 January 2023 / Published: 19 January 2023
(This article belongs to the Section Digital Agriculture)

Abstract

:
Apple leaf diseases seriously affect the sustainable production of apple fruit. Early infection monitoring of apple leaves and timely disease control measures are the key to ensuring the regular growth of apple fruits and achieving a high-efficiency economy. Consequently, disease detection schemes based on computer vision can compensate for the shortcomings of traditional disease detection methods that are inaccurate and time-consuming. Nowadays, to solve the limitations ranging from complex background environments to dense and small characteristics of apple leaf diseases, an improved Faster region-based convolutional neural network (Faster R-CNN) method was proposed. The advanced Res2Net and feature pyramid network architecture were introduced as the feature extraction network for extracting reliable and multi-dimensional features. Furthermore, RoIAlign was also employed to replace RoIPool so that accurate candidate regions will be produced to address the object location. Moreover, soft non-maximum suppression was applied for precise detection performance of apple leaf disease when making inferences to the images. The improved Faster R-CNN structure behaves effectively in the annotated apple leaf disease dataset with an accuracy of 63.1% average precision, which is higher than other object detection methods. The experiments proved that our improved Faster R-CNN method provides a highly precise apple leaf disease recognition method that could be used in real agricultural practice.

1. Introduction

Around the world, apple fruit consumption has risen due to its high therapeutic and nutritional value. In 2021, the apple cultivation area in China contained close to 3 million hectares with annual productivity of around 45 million metric tons, making it a rather great apple production and consumption country [1]. However, diverse leaf diseases often arise during the growth of apples, causing major problems in terms of production and economics in the apple fruit industry [2]. Therefore, it is extremely essential to predict and forecast apple leaf disease at the initial stage to perpetuate fruit quantity and quality.
For apple leaf disease identification, the conventional means depend on farmers’ observations, which has delineated to be labor-intensive, unstable and time-consuming. Additionally, these farmers need to have extensive knowledge of various leaf diseases to avoid unnecessary errors and costs [3]. In fact, an automated detection disease system may be a suitable alternative to labor tasks.
Over the years, various computer vision and image processing techniques have been applied to detect and identify plant diseases in terms of their convenient and non-destructive characteristics. Previous research on plant disease recognition mainly extracts features, e.g., texture [4], color [5], shape [6], or others [7] from the image, and then distinguishes objects according to different features. The conventional methods of using computer vision to detect plant diseases have been widely used in the past few decades. An algorithm utilizing image processing means and a technique of RGB image color transform applied for better segmentation of disease spots were developed to segment different “Monocot” and “Dicot” plant leaves [8]. Furthermore, a new methodology of rice leaf blast detection was put forward with the help of color and shape, which receive an 85.71% accuracy rate [9]. Additionally, with the aid of the texture statistics in the useful segments, a software system was developed to recognize and classify the database of nearly 500 plant leaves with a little computational effort [10]. That is, the advantages of these methods are simple and efficient, however, the dependence on pixel grain and the neglect of spatial details make the method less robust to noise [11].
Recently, for automatic identification and diagnosis of plant diseases, the technology combined with machine learning and network technology has been deeply researched with the popularization of electronic devices [12]. Hyperspectral imagery was selected for the detection of apple marssonina blotch in the different stages. Meanwhile, feature selection and redundancy reduction are completed by an unsupervised method. Three classifiers were adopted to classify the features including ensemble bagged, decision tree and weighted k-nearest neighbor, reaching an overall accuracy of more than 70%, reflecting the possibility of detecting various apple marssonina blotch disease stages [13]. Moreover, by using a genetic algorithm and feature selection, an apple leaf disease identification method was proposed and the experiment results confirmed that the recognition rate on the constructed dataset of apple diseased leaves exceeded 90%, meaning that the proposed scheme was feasible and effective [14]. In addition, after preprocessing and feature extraction of images, artificial neural networks as well as support vector machines were presented for disease classification, and the result showed that the artificial neural network is inferior to the support vector machine method in disease classification [15]. Although extensive hand-crafted vision features can be extracted by traditional methods, the generalization ability of models is insufficient because the features heavily depend on professional knowledge and experience. Moreover, these models cannot achieve satisfactory accuracy due to the susceptibility of artificially selected features.
In recent years, driven by the rapid development of GPU processors in computing power and memory capacity, deep learning mechanics have become more and more popular [16]. As a new research direction in the field of machine learning, deep learning can acquire high-grade information of data during training without manual intervention [17]. A convolutional neural network (CNN) is one of the most representative models of deep learning framework, which is a feed-forward neural network with convolutional computation and depth structure, suitable for processing computer vision tasks. A series of classic CNN models have been put forward since 2012, including AlexNet, VGG, GoogLeNet, ResNet, etc. Subsequently, due to the advanced robust feature extraction ability, CNN has also achieved good performance in the task of apple leaf disease classification [18,19,20]. However, apple leaf disease classification is not sufficient for practical application scenarios. This is mainly for two reasons; on the one hand, the dataset of images used for disease classification always comes from plain background instead of the real field, on the other hand, detailed information such as the type and the regions of the diseases infected leaves cannot be obtained from the image classification method. Evidently, object detection is more suitable for disease diagnosis. Many improved schemes of apple leaf disease detection have been proposed on the basis of existing algorithms, such as the single shot multiBox detector (SSD), the R-CNN and you only look once (YOLO) series of algorithms. A mobile detection model, called Mobile End AppleNet-SSD, was devised to automatically detect five common apple leaf disease spots on the mobile device in real-time [21]. Moreover, a lightweight one-stage convolutional neural network, namely Mobile Ghost Attention-YOLO, was proposed to perform real-time apple leaf disease detection with the highest average precision and the fastest detection speed but the smallest model size compared to other detection methods [22]. Moreover, based on MASK R-CNN and transfer learning, a novel parallel real-time framework is proposed for recognizing apple leaf diseases [23]. Meanwhile, an SSD with the inception module and rainbow concatenation model was trained to detect five common apple leaf diseases with higher accuracy and faster detection speed than previous methods [24]. However, the background of the disease datasets in the above literature is white or in a laboratory environment, limiting practical agricultural applications. Although some datasets were taken from a field environment, there were fewer types of diseases in the datasets. Additionally, due to the complex background small disease spots are difficult to detect. Moreover, the visual symptoms of different diseases may be dense and overlapping leading to missed objects. At present, there is no solution to solve the three problems at the same time.
In this paper, our major concern is detecting apple leaf diseases in the real field environment with high precision. An improved Faster R-CNN architecture is proposed for detecting apple leaf diseases. Unlike most backbones networks in Faster R-CNN, our method jointly uses Res2Net and feature pyramid network (FPN) [25] as the extraction feature network to obtain more multi-scale, high-representations and semantically rich features. Furthermore, we also employ RoIAlign [26] instead of RoIPool to predict the feature map location, thereby improving the detection accuracy. When testing, soft non-maximum suppression (soft-NMS) [27] is used instead of NMS to accurately detect the performance of apple leaf disease. Finally, the proposed method is evaluated along with other advanced detection models in which our annotated apple leaf disease dataset (AALDD) is applied.

2. Materials and Methods

2.1. Data Collection

The purpose of the study is to detect apple leaf disease in a real environment. To collect more qualified pictures, we obtained the dataset through both publicly available datasets and self-collected data. The former came from Plant Pathology 2021-FGVC8 challenge competition and the latter was captured from the Pomology Institute of Shanxi Agricultural University and farmers’ orchards by smartphones under field conditions. The constructed dataset is full of images of five common apple diseases including scab, frogeye leaf spot, rust, powdery mildew and mosaic. Furthermore, multiple different diseases may appear on the same apple leaf, which meets the demands of detecting multiple diseases in one apple leaf. The specific apple leaf disease image samples and their corresponding scientific name are clarified in Figure 1.

2.2. Data Analysis

To meet the experiment requirements of data and ease the labor of labeling, a total of 4182 images of apple disease were used to compose our dataset. First, the dataset was annotated by the LabelImg tool for the object detection task. Annotated results were saved as XML files in PASCAL VOC format. All images in the dataset were manually labeled and verified by agricultural experts to make them correct. Then, we resized the image size uniformly to 640 × 480 in order to train the model effortlessly.
To perform the experiment, AALDD was randomly shuffled and divided into a training dataset, validation dataset and test dataset based on the ratio of 8:1:1 according to the category of apple disease. To balance the dataset of different categories, various data enhancement methods were used to extend the training dataset, including horizontal or vertical translation and image rotation. After these operations, our training set was expanded from 3216 to 3851. Thus, the training set was balanced in terms of data types and also included images containing two diseases on the same leaf for training the model. The validation set consisted of 484 images responsible for tuning the model’s hyperparameters and evaluating the model’s capabilities. The 482 pictures in the test set were used to evaluate the performance of the final model. After these operations, the dataset was constructed as AALDD, which is short for annotated apple leaf disease dataset. The specific numbers are listed in Table 1.

2.3. The Improved Faster R-CNN Model

Faster R-CNN [28] is the last algorithm that depends on region proposal algorithms after region-based CNN (R-CNN) [29] and the Fast R-CNN [30]. The model benefits from a region proposal network (RPN), which is used to generate proposals in less time and can be easily combined into Fast R-CNN to make it a whole network. As shown in Figure 2, the detection model using Faster R-CNN involves two steps: RPN and Fast R-CNN.

2.3.1. Res2Net Architecture

Due to the small and dense characteristics of apple leaf disease, it is inappropriate to use the original Faster R-CNN model, whose feature extraction backbone is difficult to fully express the high-level semantic information. In order to represent features at multiple scales, we selected Res2Net [31] which has a stronger feature extraction ability as the backbone network for our improved Faster R-CNN architecture. Instead of utilizing features with different resolutions, Res2Net demonstrates the multi-scale features by constructing hierarchical residual-like connections within one single residual block. Therefore, the receptive fields can be varied at a finer-grained level to capture details and global features. Res2Net in this paper refers to ResNet [32] integrated Res2Net block.
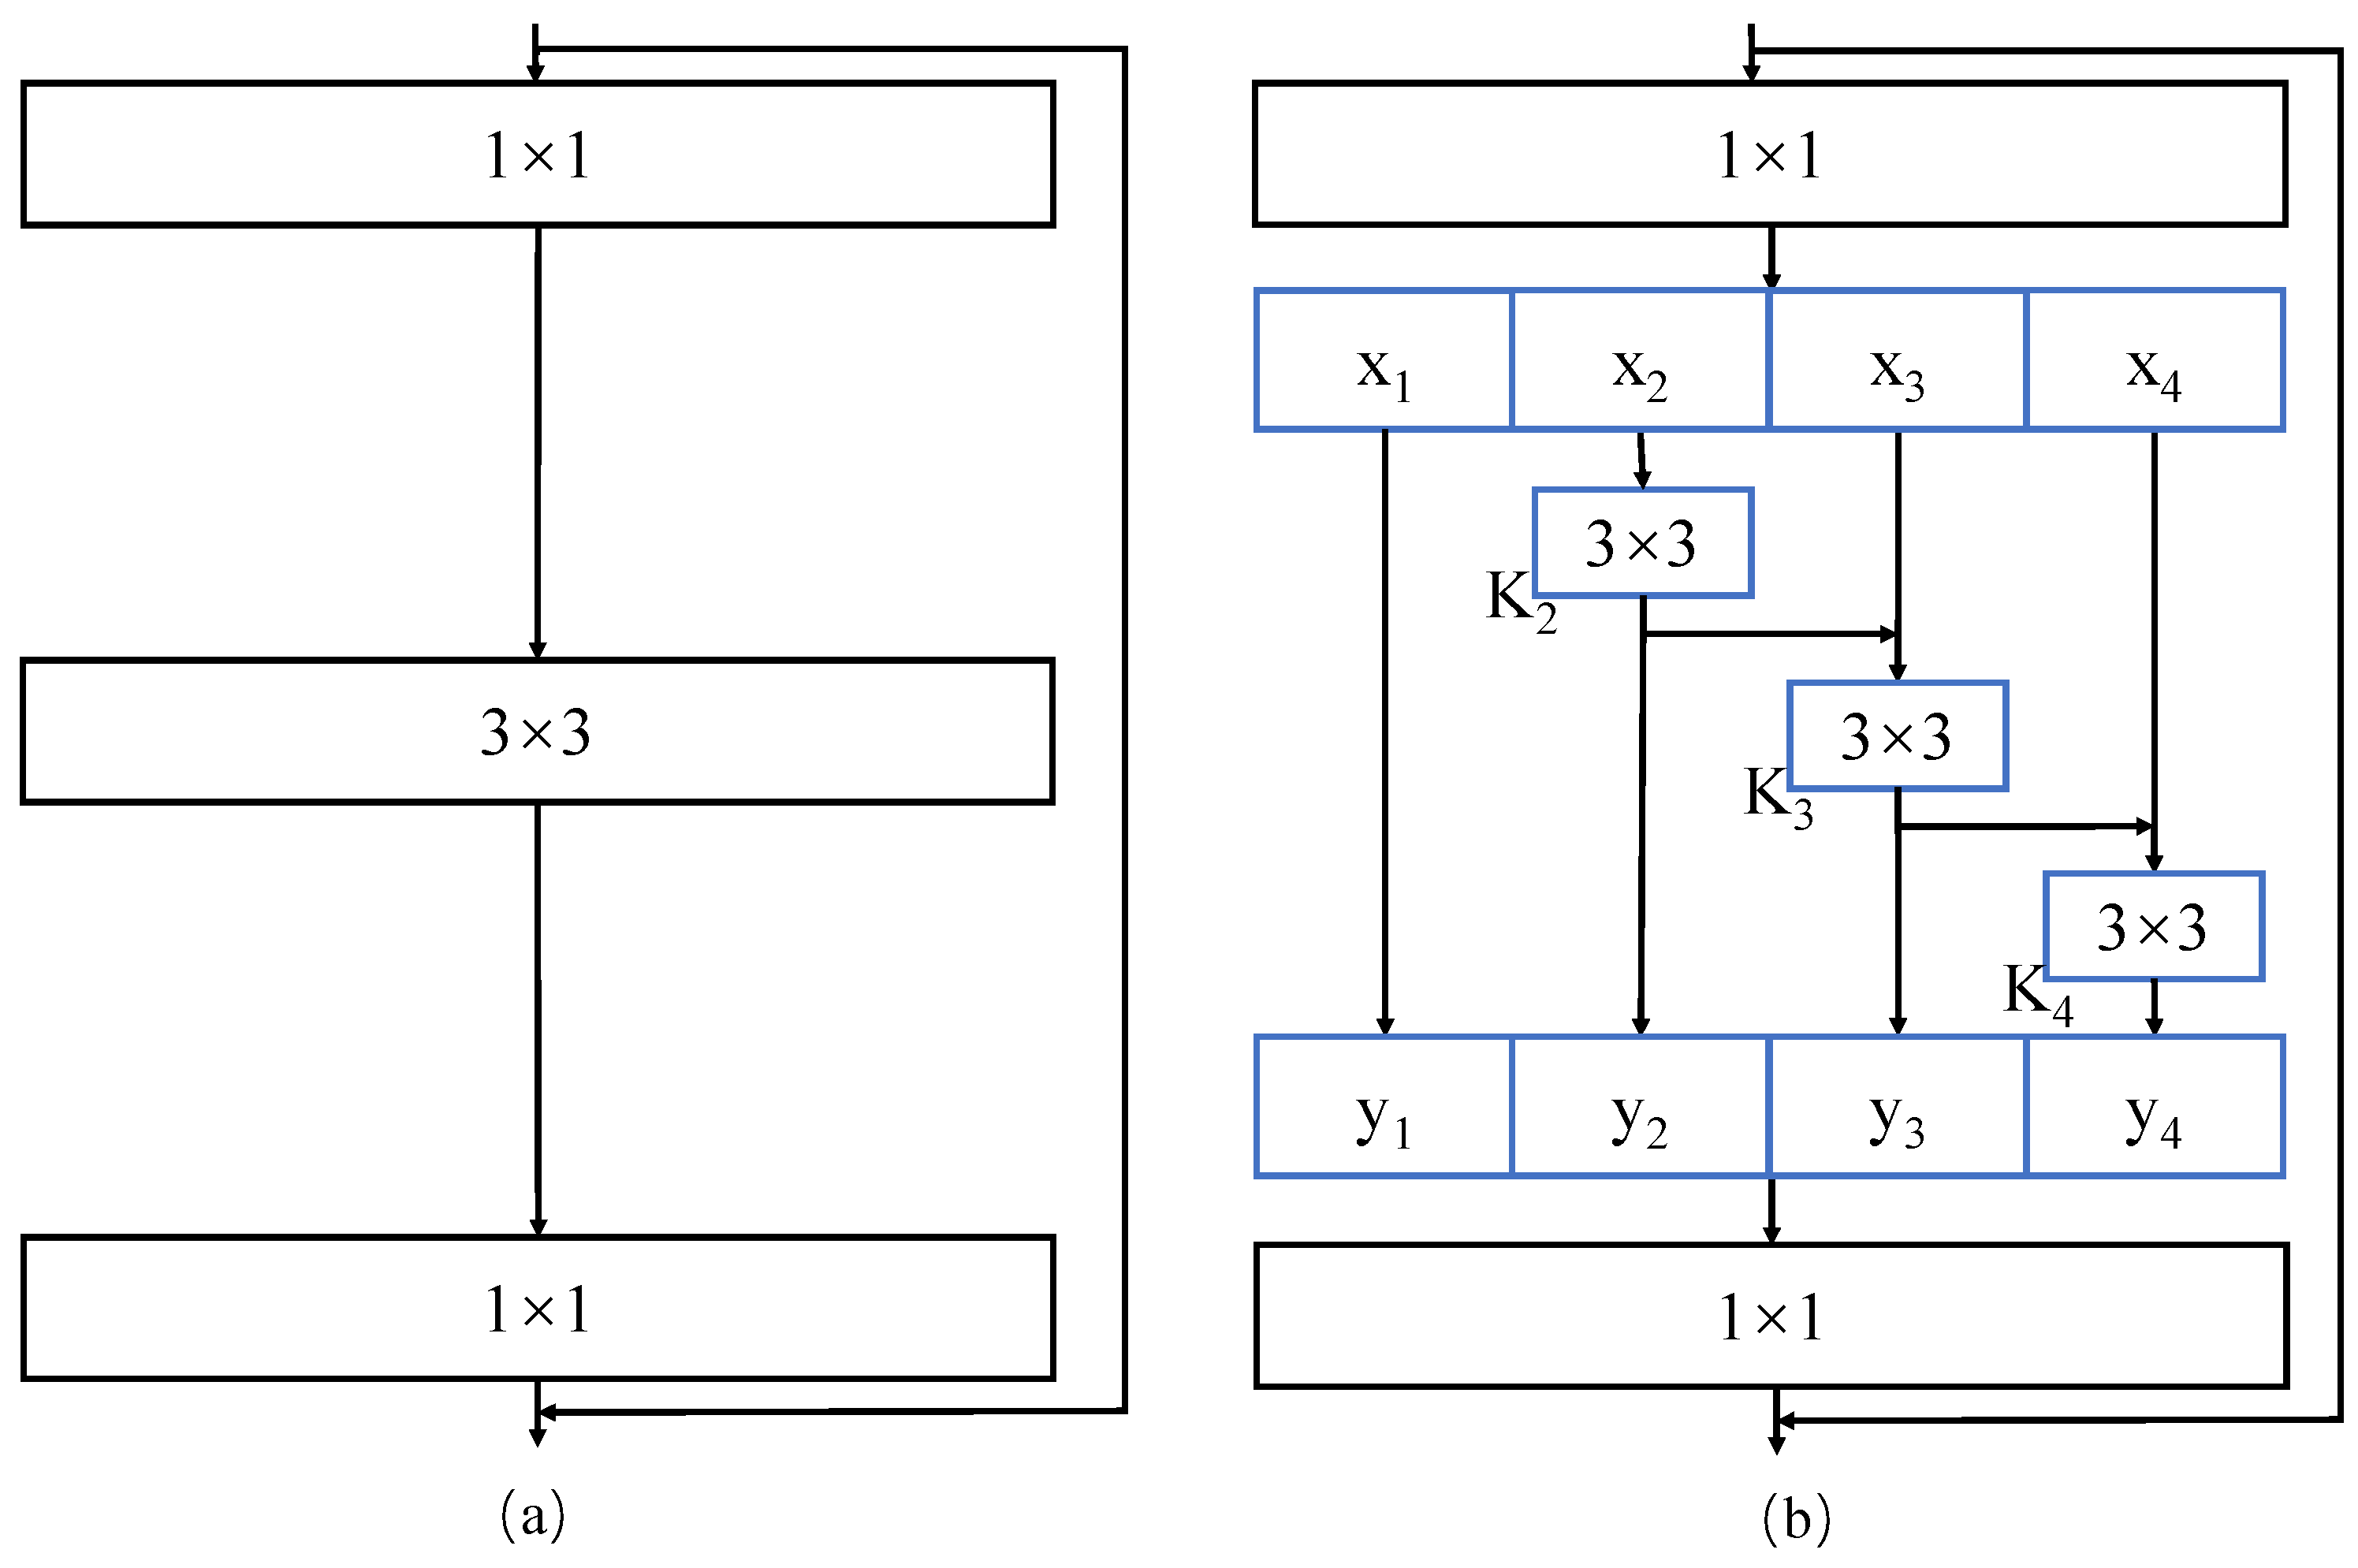
Res2Net split the feature maps of ResNet residual block into multiple feature map subsets. Within different feature map subsets, residual-like connections are designed for multi-scale expression at a granular level. Unlike the bottleneck block in ResNet by using 3 × 3 filters extracting features, the feature maps that have undergone 1 × 1 convolution in the Res2Net block are split into s feature map subsets as shown in Figure 3. We denote these feature map subsets by x i , where i { 1 , 2 , , s } . Each feature subset x i has the same spatial size, but the number of channels is 1 / s to that of the input feature map. We use symbol K i ( ) to represent 3 × 3 convolution and y i to denote the output of K i ( ) . Each x i has a corresponding 3 × 3 convolution except for x 1 . Therefore, the output of x 1 is y 1 , which is equal to x 1 . The feature split x 2 goes through the 3 × 3 convolutional operator and the output is y 2 = K 2 ( x 2 ) . The result that x 3 added with the output of K 2 ( x 2 ) fed into K 3 ( ) , that is y 3 = K 3 ( x 3 + y 2 ) In a similar way, we can obtain y i as follows,
y i = { x 1 i = 1 K i ( x i ) i = 2 K i ( x i + y i 1 ) 3 i s
Each 3 × 3 convolution K i ( ) has the potential to receive the information of all previous feature map subsets, i.e., that from { x j , j i } . Thanks to the 3 × 3 convolution, the receptive field of each feature split’s output x j is larger than that of x j . Then all splits are concatenated and 1 × 1 convolution is used to better fuse the information of different scales. The strategy of split and concatenation enables the module to process features with extraordinary efficiency. The output feature map contains different receptive fields, which are conducive to extracting multi-scale features. As a result, Res2Net can capture global and local features at a finer level.

2.3.2. FPN

In order to detect objects at different scales, we added the feature pyramid network, i.e., FPN after Res2Net. The FPN building block is shown in Figure 4. Through the feedforward backbone convnet of the input image, a series of hierarchy feature maps with a scaling step of 2 were generated, which are displayed on the left of Figure 4. As we know, low-level features have less semantic information, but high resolution and accurate location information; whereas high-level features have rich semantic information, but low resolution and rough location information. To fuse these features, we used upsampling to obtain a coarser-resolution feature map, and the spatial resolution of the feature map is two times greater than the original one (the red line on the right of Figure 4). The corresponding bottom-up feature maps reduce channel dimensions to make them have the same channel through a 1 × 1 convolutional layer (the orange line on the right of Figure 4). Then, we merged them element-wise and iterated the process to obtain multiple feature sets. Finally, each merged map generated the final feature map by applying a 3 × 3 convolution. Thus, the feature pyramid fuses the information between different layers to obtain an object detection system with accurate identification and location.

2.3.3. RoIAlign

To extract a small identical feature map (e.g., 7 × 7) from each RoI, RoIPool was utilized as a solution. Unfortunately, quantization and rounding operations in the process of RoIPool cause deviations between the RoI and the extracted features, resulting in the loss of recognition accuracy. In order to improve the identification precision of apple leaf diseases, we adopted RoIAlign instead of RoIPool in our improved Faster R-CNN.
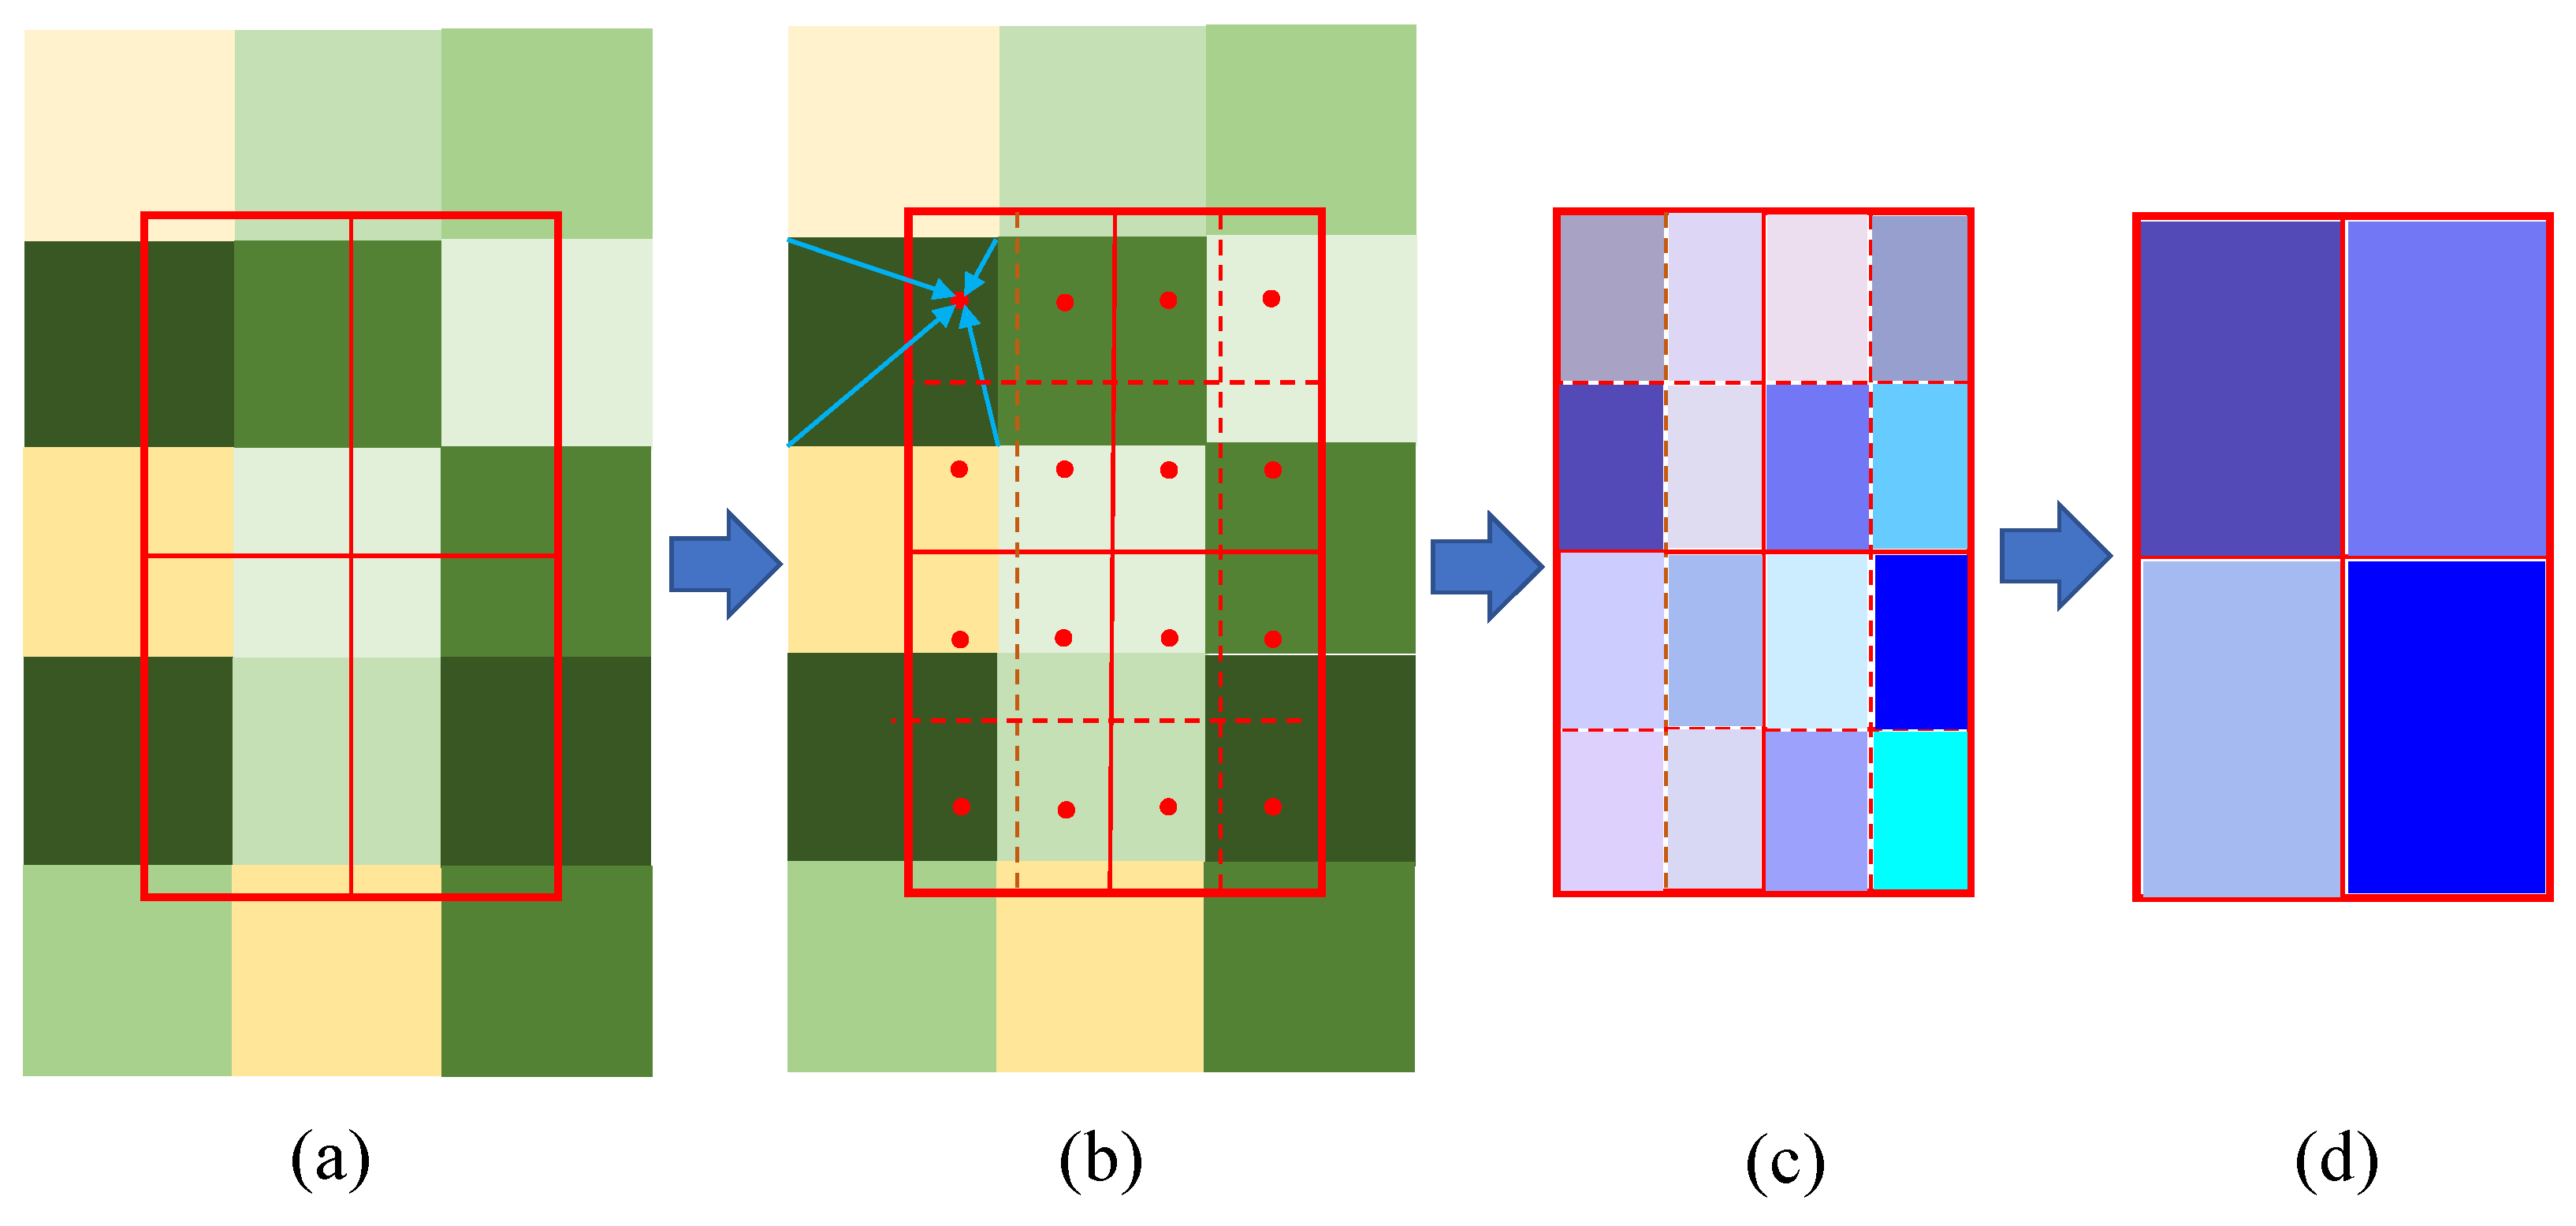
RoIAlign was first proposed in the Mask R-CNN [26] for faithfully preserving exact spatial locations, which removes the harsh quantization of RoIPool, properly aligning the extracted features with the input. It avoids any quantization of the RoI boundaries. First, bilinear interpolation was used to compute the exact values of the input features at four regularly sampled locations in each RoI bin (for example, for a continuous coordinate x, x/16 is used instead of [x/16], where 16 is a feature map stride and the symbol [] is rounding), then the result was aggregated (sample 4 points in each bin rather than directly dividing the RoI, then max or average pooling). The procedure of RoIAlign is shown in Figure 5. Consequently, RoIAlign is a regional feature aggregation method that can improve the accuracy of the detection model. In our apple leaf disease detection structure, the feature map obtained by FPN was fed into the RoIAlign layer to produce the same size features for later calculations.

2.3.4. Soft-NMS

NMS is an indispensable operation after region regression in the task of object detection. It is also a post-processing algorithm for the redundant elimination of prediction boxes for a target. As a greedy algorithm, the scores of all detection boxes are sorted first, then the highest scoring detection box M was selected and the others that overlap significantly with M were suppressed (evaluated with a predefined threshold). This procedure is handled recursively to the remaining boxes. By adopting different thresholds, NMS performs well in general object detection. However, because of local maximum suppression, it is likely to miss some dense and overlapping target objects. To improve the detection accuracy of apple leaf disease, we used soft-NMS in the R-CNN network of the test stage instead of NMS.
Soft-NMS, on the other hand, adds a function to the classical NMS, which is mainly to suppress the confidence level s i of each box. f ( i o u ( M , b i ) ) is an overlap-based weighting function, which is an overlapping linear function here. The score of detection boxes updates according to the intersection of union (IoU) of the detection boxes with the highest score at each iteration. The pruning step can be represented by the following rule:
s i = { s i , i o u ( M , b i ) < N t s i ( 1 i o u ( M , b i ) ) , i o u ( M , b i ) N t ,
The above function can attenuate detection scores above the threshold N t with a linear function that overlaps M for initial detection boxes b i . As a result, the detection boxes far away from M would not be affected and those close to M would be penalized more heavily. Moreover, the computational complexity of soft-NMS is the same as traditional NMS. It is easy to implement by integrating the module into any object detection pipeline without additional training.

2.4. Experimental Setup

2.4.1. Experiment Platform

The experiments used an Ubuntu server with an AMD Ryzen 5 5600X 6-core processor (Advanced Micro Devices Inc., Santa Clara, Silicon Valley, California) that was installed by GeForce RTX 3060 Lite Hash Rate (Nvidia Corp., Santa Clara, CA, USA). Ubuntu 18.04.5 LTS 64-bit system and Python 3.8 was opt for the software environment. MMdetection toolbox [33] was employed to develop codes.

2.4.2. Parameter Settings

Unless otherwise specified, the parameter settings of each comparison detection network were the same as the default parameters named in MMdetection benchmark. Res2Net-50 and FPN were selected to extract features, 1333 × 800 was the default training image size. Moreover, in accordance with the linear scaling rule, the learning rate picks the value of 0.0025, which is one-eighth of the original default learning rate.

2.4.3. Evaluation Metrics

Several standard metrics were employed to evaluate our model for verifying the reliability after training was completed, including IoU, average precision (AP), and average recall (AR), as well as AP50 and AP75. Specifically, AP50 and AP75 are AP at IoU thresholds of 0.5 and 0.75, respectively. In addition, the detection speed was calculated in terms of frames per second and confusion matrix was also used to evaluate the classification accuracy of the results. For experiment results, the defaulting final epoch was selected to calculate these values.

3. Results

3.1. Comparison of Different Feature Extraction Networks

To illustrate the advantage of Res2Net and FPN, we compared the effects of different feature extraction networks on detection results. For a fair comparison, all parameters were set the same during the training process.
Table 2 presents the detection comparison between our network and other networks, such as ResNet-50-FPN, ResNet-101-FPN, ResNeXt-101-FPN, ResNeSt-50-FPN, and RegNet-FPN. It is obvious that the AP detection performance of the proposed Res2Net-50-FPN exceeds ResNeSt-50-FPN, achieving 1.9% AP improvement. We can also see that our feature extraction network performed slightly better than ResNet-50-FPN, ResNet-101-FPN, ResNeXt-101-FPN, and RegNet-FPN. That is to say, our approach achieved the best performance with an AP detection accuracy of 62.9%. Regarding other AP values, the improved Faster R-CNN with Res2Net-50-FPN achieved 91.3% AP50, which is slightly lower than that of ResNet-50-FPN, and obtained 69.8% AP75, which is higher than that of Res NeXt-101-FPN and ResNeSt-50-FPN. In addition, our method had 68.5% AR, which is the highest among these extraction networks. In a word, Res2Net-50-FPN performs better than other backbones, indicating that Res2Net and FPN have advantages in feature extraction and object detection. Because Res2Net and FPN extraction feature networks can obtain high-level semantic information for recognition, in this way, a higher AP value is obtained.

3.2. Detection Accuracy Comparison between RoIPool and RoIAlign

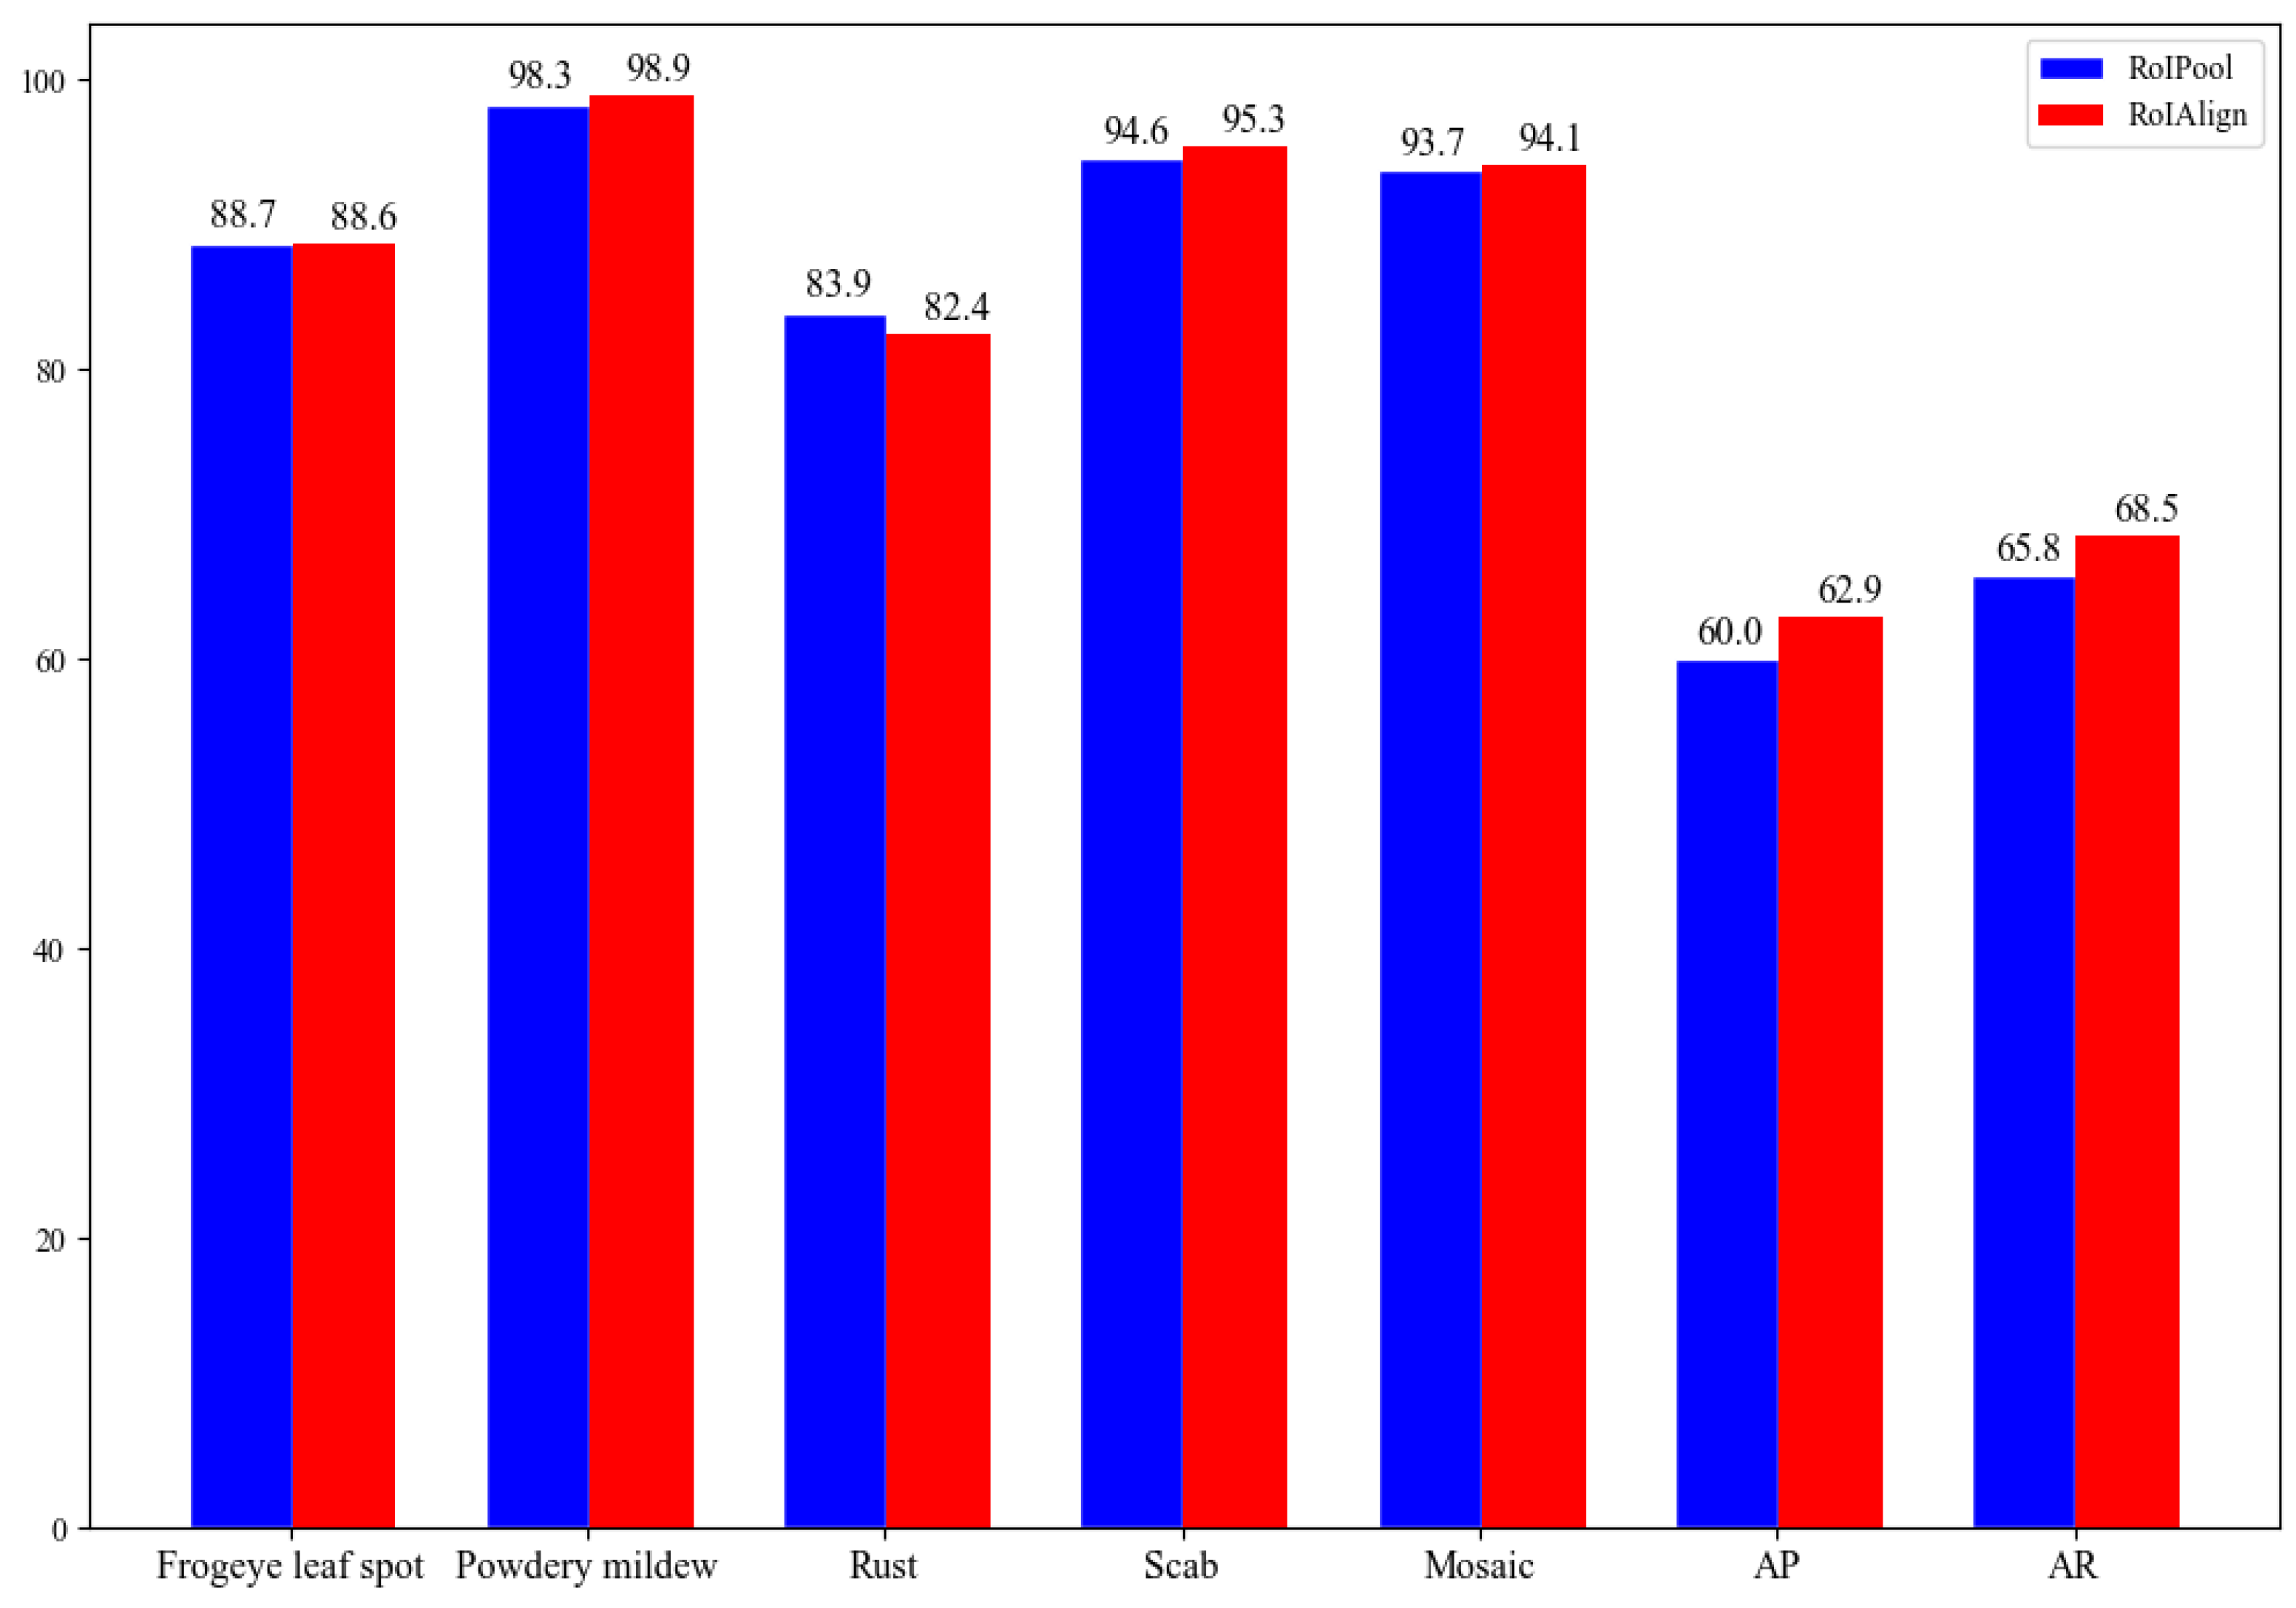
To position the apple diseased object more accurately, we selected RoIAlign instead of RoIPool in our improved Faster R-CNN. Figure 6 demonstrated the detection results of apple leaf diseases using RoIPool and RoIAlign, including the value of AP50 of five apple leaf diseases, AP and AR. It also can be found that the apple leaf disease detection accuracy utilizing RoIAlign is obviously higher than that of RoIPool, especially the detection result of scab, which improved 0.7%, implying that RoIAlign is more significant for large object detection. However, the detection accuracy of frogeye leaf spot and rust using RoIPool is higher than that of using RoIAlign, which means that RoIAlign is not valid for all targets. Our model performs better than Faster R-CNN with RoIPooL due to RoIAlign. A benefit of removing the harsh quantization of RoIPool is that RoIAlign reduces misalignments between the RoI and the extracted features making the recognition more accurate.

3.3. Comparison of Different Detection Techniques

To analyze the performance of various detection algorithms, we utilized several state-of-the-art object detection algorithms to detect apple leaf diseases, namely, one-stage object detection algorithms, including YOLOv3, SSD, RetinaNet, Generalized Focal Loss (GFL), VarifocalNet (VFNet); two-stage object detection algorithms, i.e., Grid R-CNN and Libra R-CNN; multi-stage object detection algorithm Cascade R-CNN.
Table 3 shows the result of different models on AALDD. With the same dataset, our proposed method had the highest AP value. Additionally, our model had 91.3 AP50, which is 0.1% less than RetinaNet. On the other hand, it has the highest AP75 value. It also can be seen from Table 3 that the AR of our model is below the highest AR of 2.7% in GFL. To sum up, the experiment indicated that the detection accuracy of our approach is better than other object detection frameworks. This gain can mainly be attributed to Res2Net and FPN, which can introduce the stronger multi-scale representative feature map, and to the RoIAlign, which helps the network learn the exact location of different objects.
The detection speed is another important indicator to measure the object detection algorithm. The computational efficiency of different detectors is evaluated by frames per second (FPS). The result is shown in Table 3. It is undeniable that the proposed method has a gap in detection speed compared with other target detection algorithms, however, our method is fit for the real-time detection of five apple leaf diseases accurately.

3.4. Specific Class Performance Analysis

To analyze the recognition accuracy of a particular species, we calculated and compared AP50 values for each category of different detection models. The results are exhibited in Table 4. We can see that the mode attained a rather high accuracy, especially in detecting powdery mildew and mosaic, whose detection accuracy has surpassed other detection models. The improvement in accuracy contributes to Res2Net-50-FPN backbone, which can extract more multi-scale features for apple disease identification, and to the RoIAlign mechanism, which supports the network learning more accurate location.
As shown in Table 4, there are significant differences in the detection accuracy of different categories. Obviously, among all apple leaf diseases, rust is the toughest to identify with the lowest AP value; but for powdery mildew, scab and mosaic, all models are capable of detecting it with fairly high accuracy. The reason for this result is that the difficulty of recognition of different targets is different, in other words, small targets are more difficult to identify than large ones. Moreover, three kinds of apple leaf diseases can be detected accurately, reaching more than 90%, indicating that the model can be applied to practical applications.

3.5. Result Comparison between NMS and Soft-NMS

To improve the missed and incorrect detection of apple leaf diseases caused by overlapping, adhesion, and other complex environmental issues in the fields, we employed soft-NMS instead of traditional NMS in the Faster R-CNN model. The results are illustrated in Table 5. Faster R-CNN using soft-NMS achieved an AP value of 63.1% and an AR value of 71.4%, which is better than the Faster R-CNN model using NMS. That is, the Faster R-CNN based on soft-NMS leads to fewer missed and incorrect apple leaf diseases.
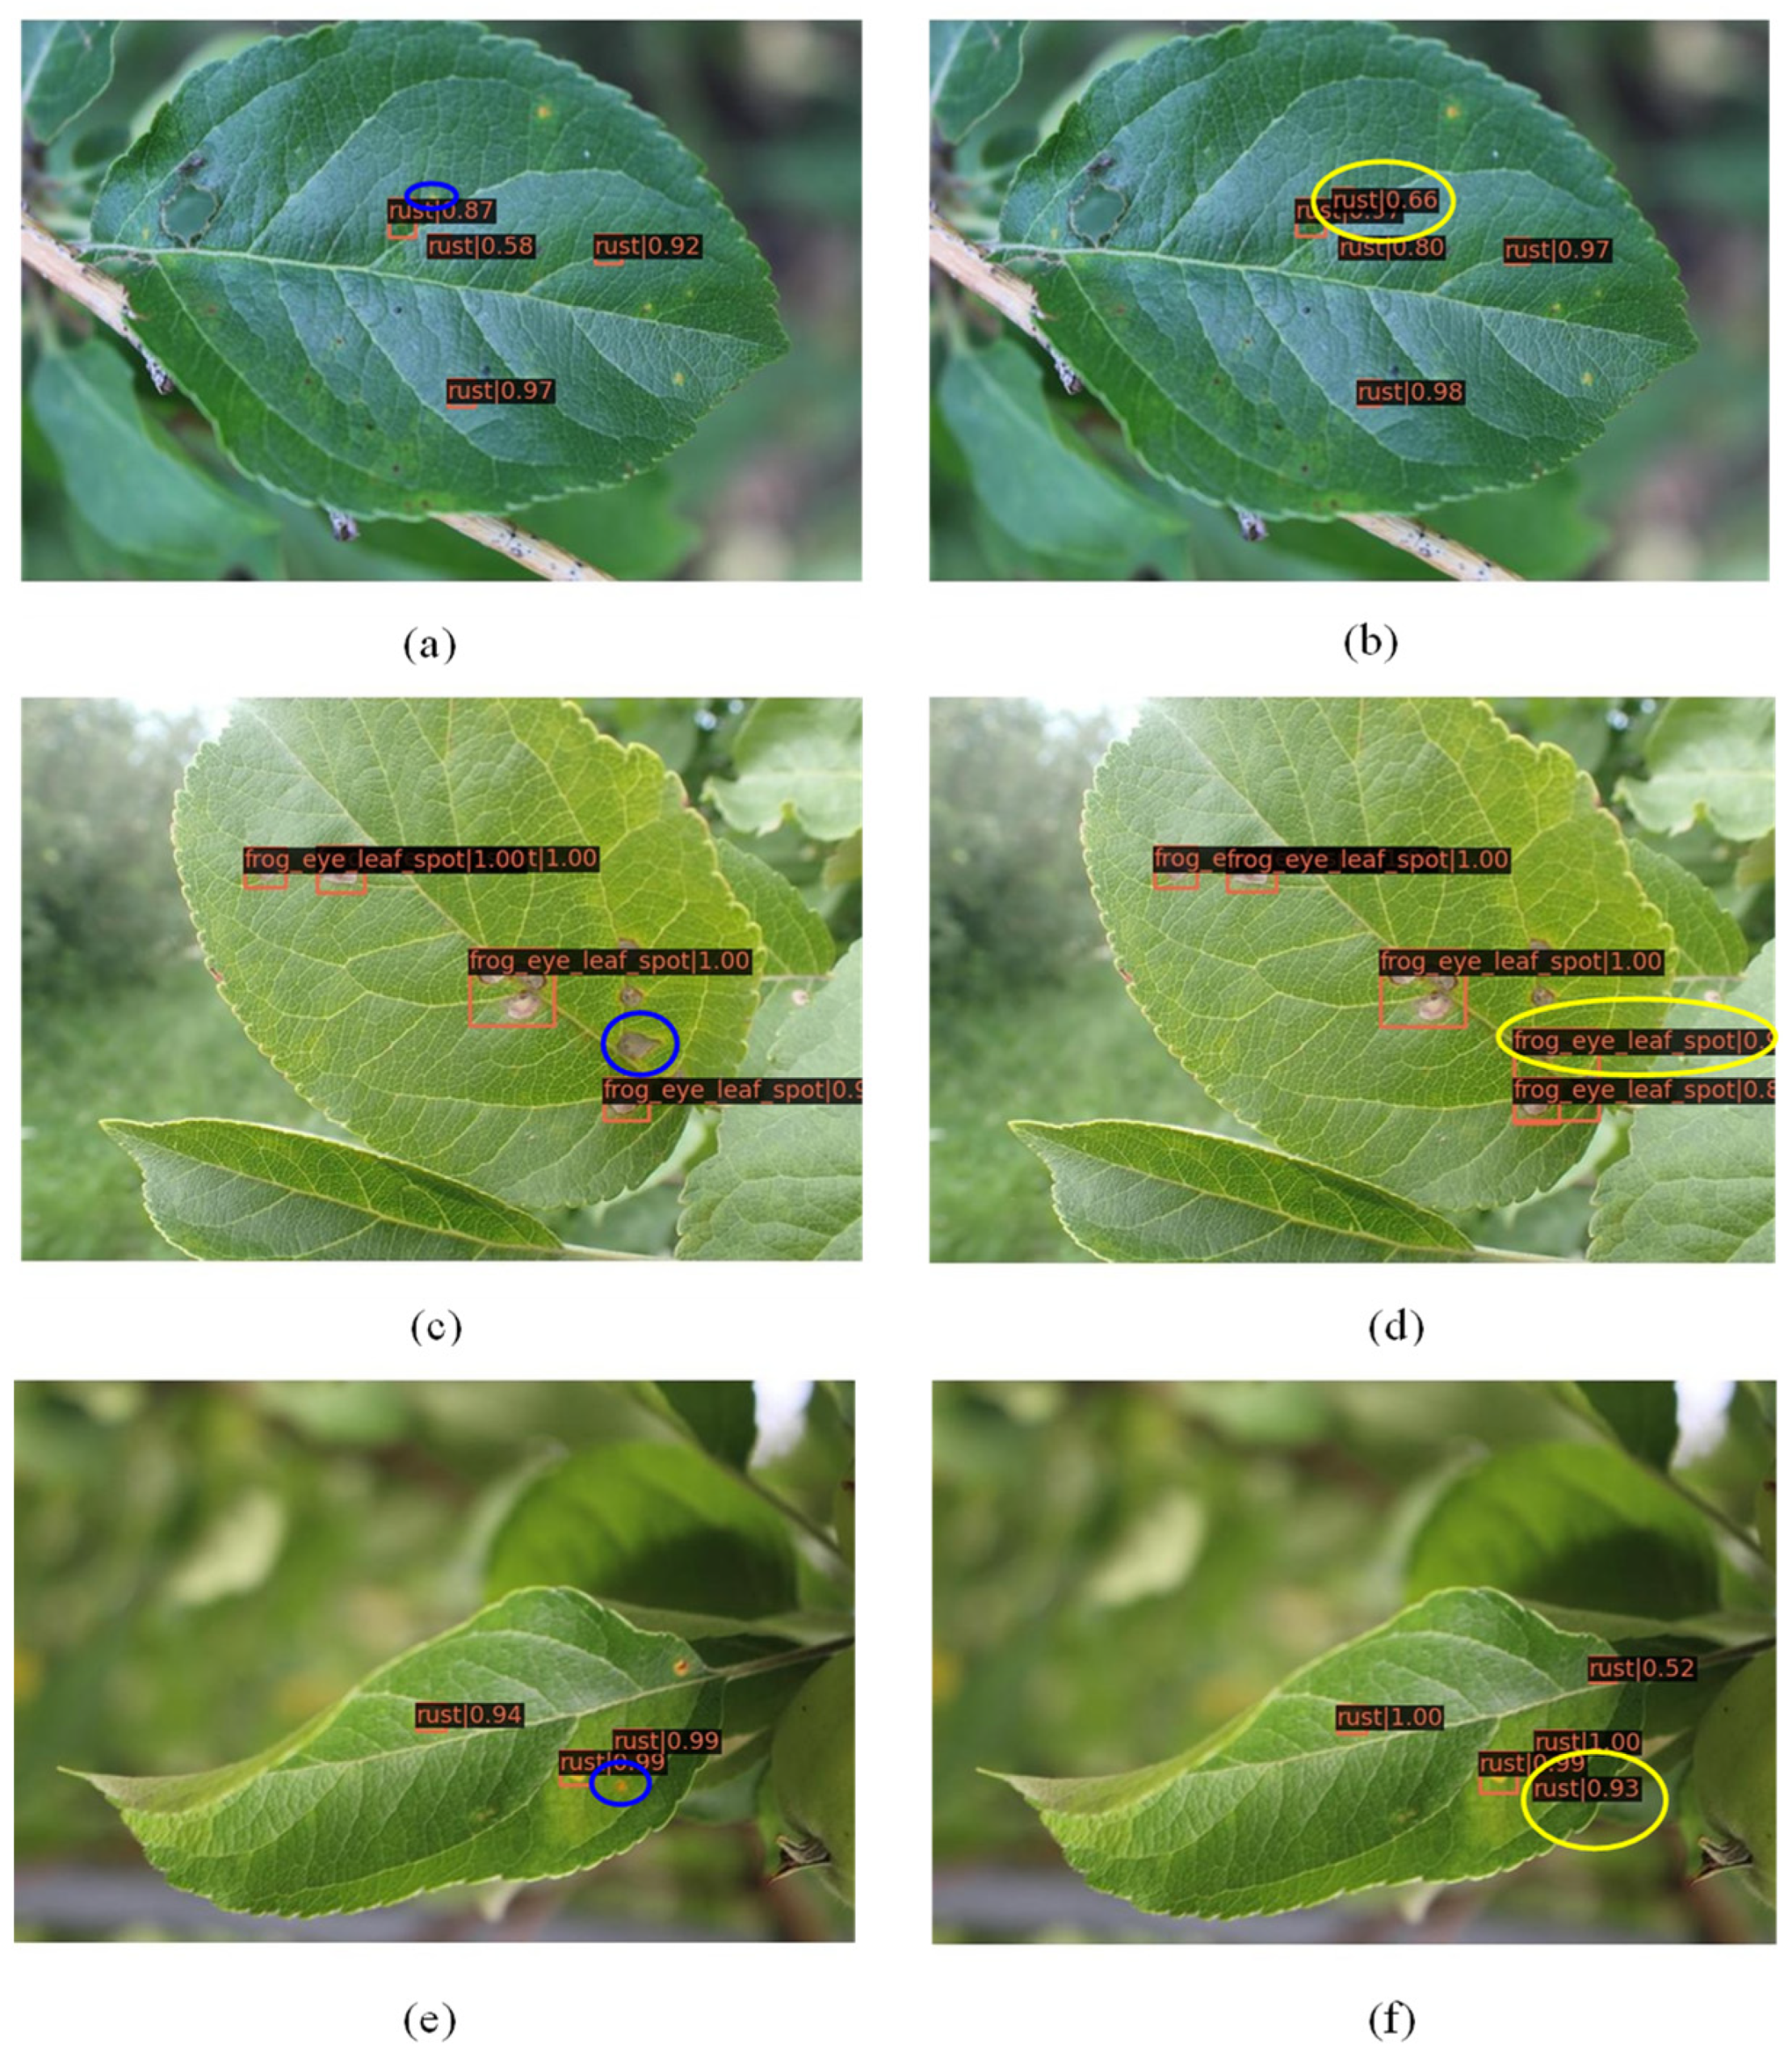
The visualization comparison of apple leaf disease detection between the Faster R-CNN method using NMS and soft-NMS is discussed. With the IoU thread of 0.5, Figure 7 presents a comparison of some examples. The red boxes in the figure denote apple leaf diseases detected, the blue ovals are marked as the object detected successfully with the yellow ovals, and the blue ovals indicate the missed detection.
The Faster R-CNN method using NMS and soft-NMS can successfully detect apple leaf diseases which are quite widely separated. However, the Faster R-CNN method using NMS (the left column in Figure 7) produced some missing detection results under dense conditions. For example, the diseases in Figure 7a,c,e were too close to distinguish them. Thanks to soft-NMS, it can overcome the influence of the connected diseases by decaying the scores of neighboring boxes via a linear penalty function, and the final more reliable results (the right column in Figure 7) were obtained. Hence, Faster R-CNN using soft-NMS can obtain effective results in improving the missed detection of apple leaf diseases.

3.6. Comparison of Confusion Matrix

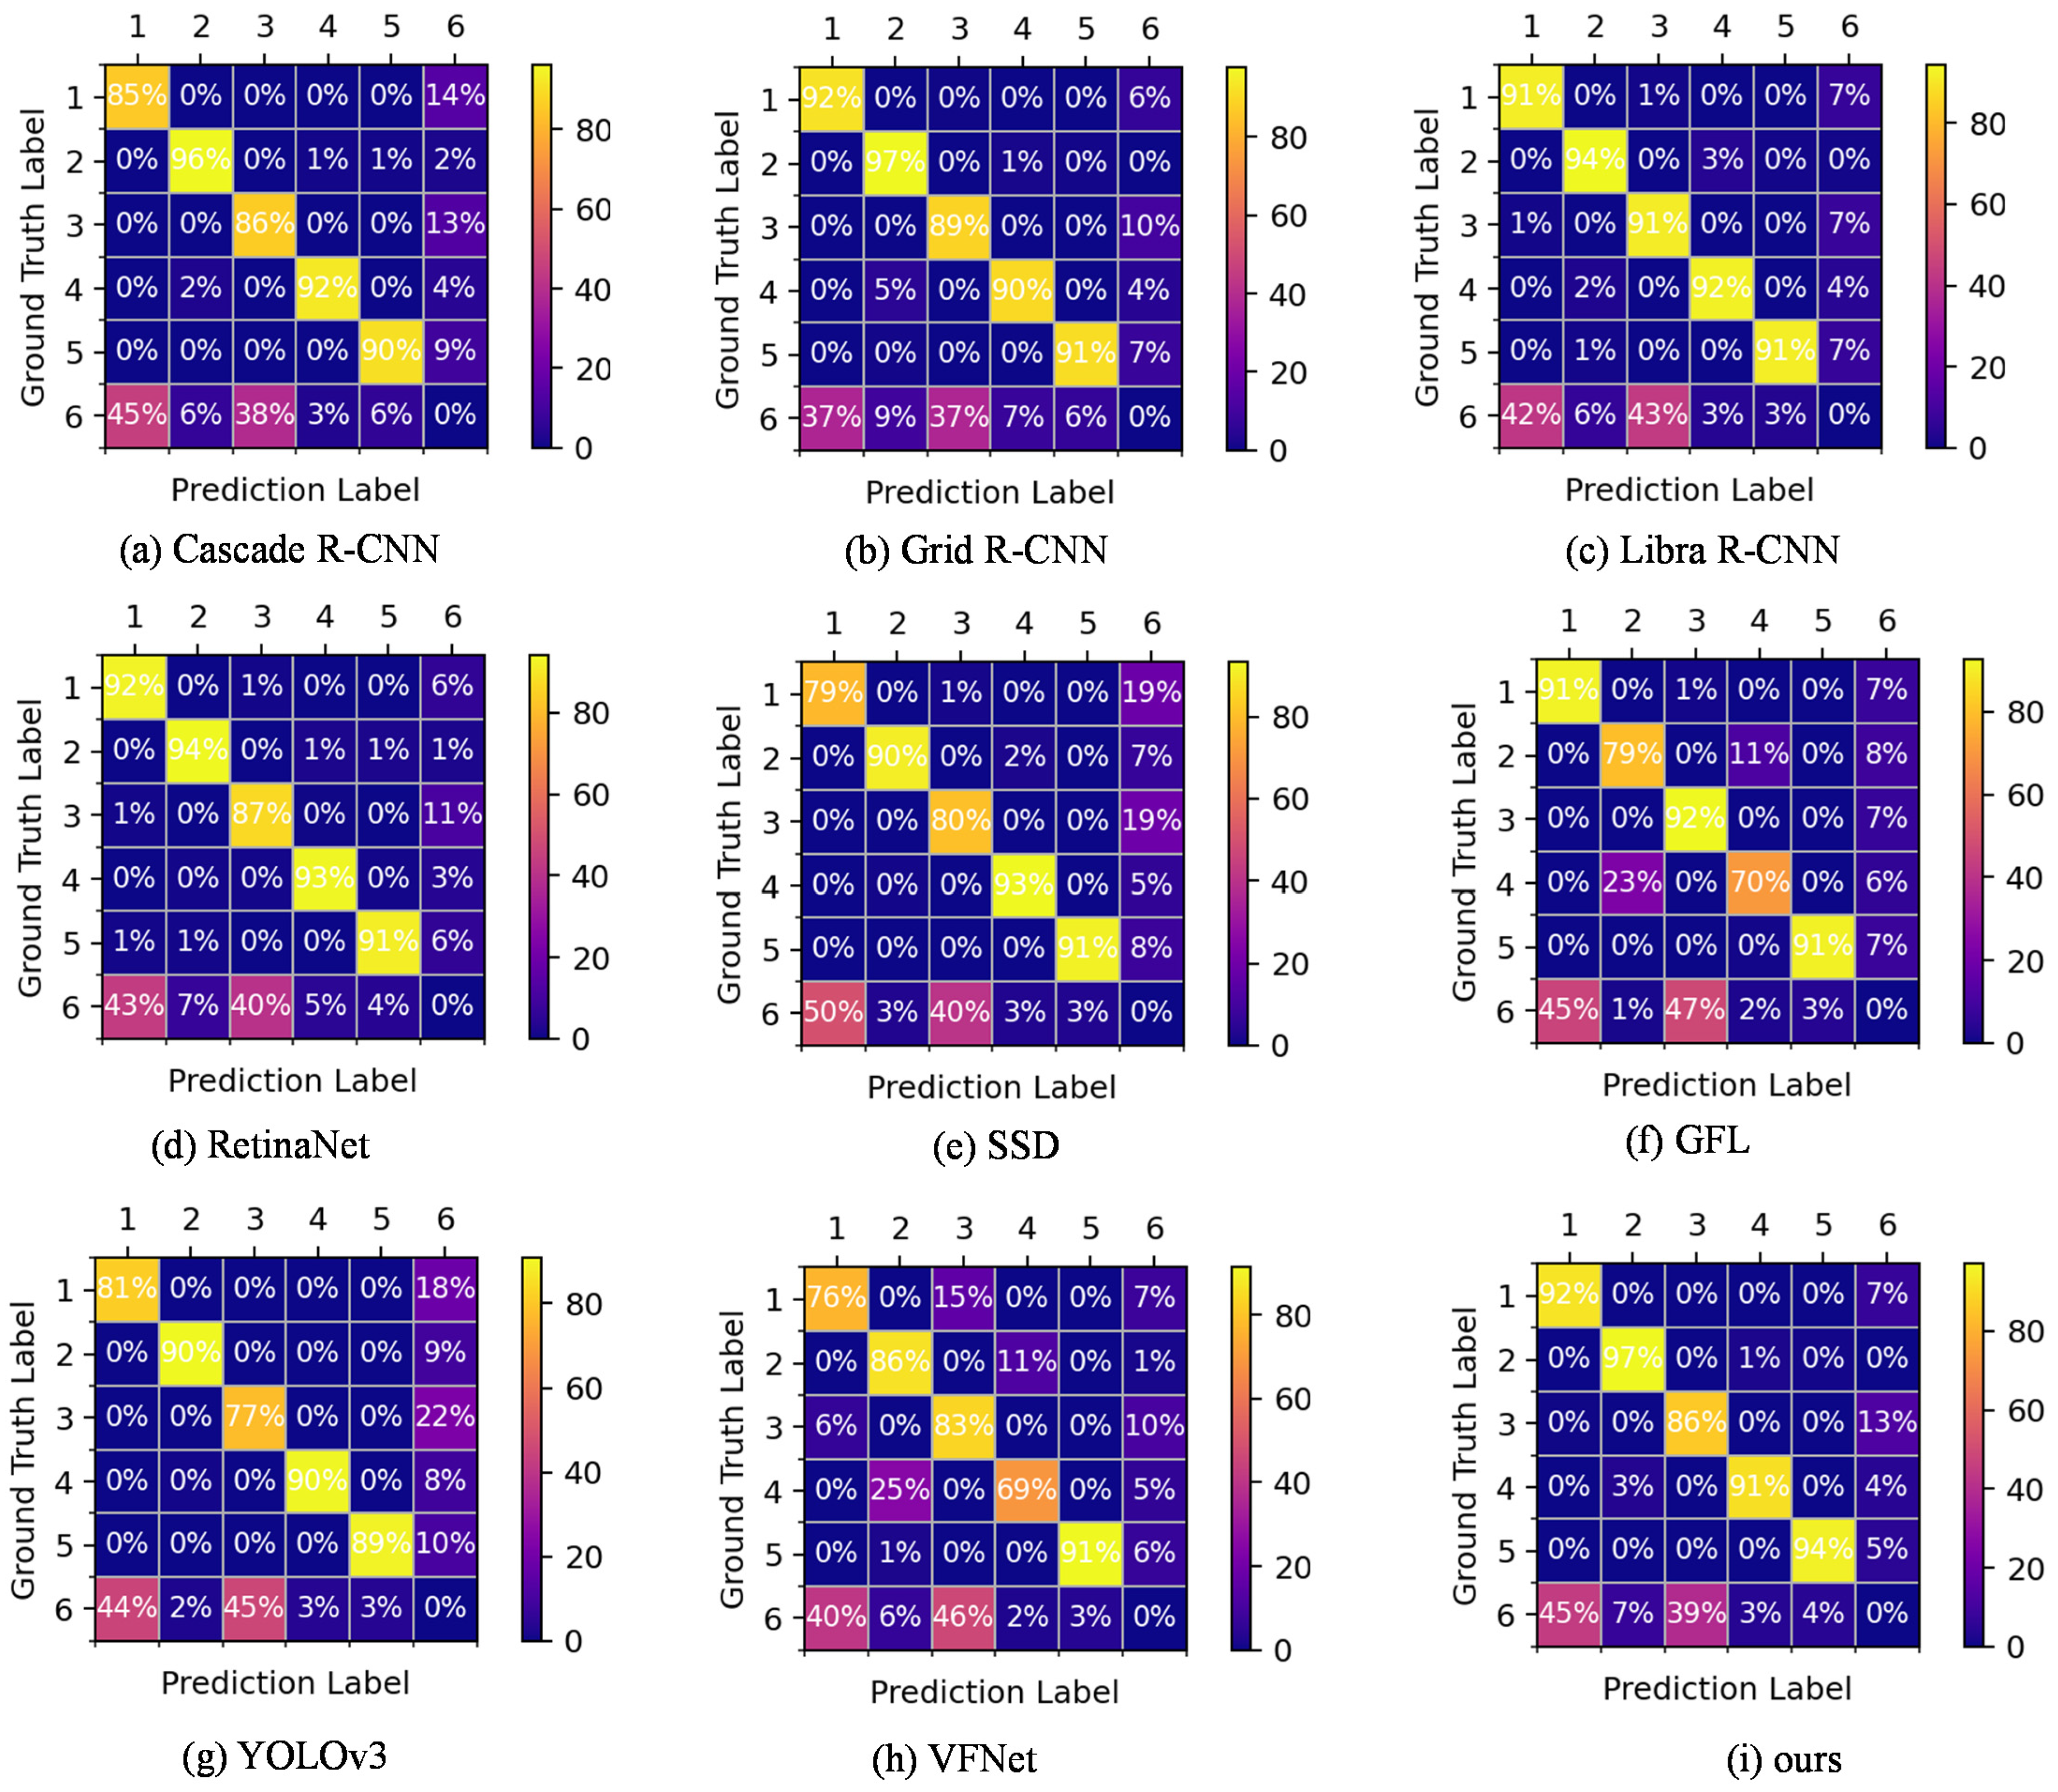
As a visual tool, the confusion matrix intuitively shows the prediction results of the model for the recognition task. The rows of the figure represent the ground truth label, the columns represent the predicted label, and the value represents the percentage of correct or incorrect predictions. We plotted the confusion matrix of the nine models compared earlier, which is shown in Figure 8. As can be seen from Figure 8, our method has the highest classification accuracy for frogeye leaf spot, powdery mildew, and mosaic in these nine models. In addition, rust has the lowest classification accuracy in almost all models due to the fact that rust is relatively small with limited information, making the detection process difficult. We can also see that all models have a higher misidentification the background as frogeye leaf spot and rust, because there are many frog leaf spots and rust targets on the apple leaves that are not all labeled. That is to say, the improved Faster R-CNN architecture achieves great classification performance on the test dataset, as well as good feature extraction capability.

4. Discussion

This paper proposes a high-precision detection method of apple leaf diseases using improved Faster R-CNN. A database of apple leaves containing five diseases, frogeye leaf spot, powdery mildew, rust, scab and mosaic was constructed, all of which were taken in the natural environment, among which the targets of frogeye leaf spot and rust were small as well as there were some dense and overlapping disease targets. The improved Faster R-CNN solves the identification difficulties and improves the accuracy compared to other object detection models. Due to tiny and dense objects characteristic of apple leaf diseases, we presented Res2Net and FPN feature extraction networks to obtain high-level semantic information. Moreover, RoIAlign was employed to replace RoIPool to extract features from each RoI in the Fast R-CNN stage, which can generate a more precise location of apple leaf diseases. In addition, Soft-NMS was utilized instead of NMS to eliminate missing prediction for effective and robust detection. Thanks to these series of improvements, the recognition accuracy of apple leaf disease under complex backgrounds has been significantly improved.
This paper focuses on the improvement of the Faster R-CNN algorithm for detecting apple leaf diseases. The improvements for the Faster R-CNN algorithm in disease detection also include Refs. [34,35,36]. Ref. [34] made a small modification to the original Faster R-CNN model by reducing the number of layers from twelve to nine to avoid overfitting for detecting tomato plant leaf disease. The entire simulation shows that the suggested model is superior to other existing models in terms of automatically detecting tomato leaf disease. The reason for that is the images trained come from PlantVillage datasets which are taken in a white background. Ref. [35] improved the recognition model accuracy of crop disease leaves with an improved Faster R-CNN using a depth residual network ResNet101. Moreover, the bounding boxes are recalculated. However, the dataset is laboratory data, so only a single leaf disease in the image can be detected. Ref. [36] proposed a disease detection system for apple leaves using Faster R-CNN with Inception v2 and the proposed system successfully classified diseased and healthy leaves, but the model can also identify diseased and healthy images from apple orchards, without knowing the specific type of disease. Different from them, our model can detect different diseases in an image that comes from the natural environment along with specific disease categories. In particular, it can also detect dense disease targets.
In this paper, we focus on the improvement of the model in detecting disease accuracy. Although our model has the highest AP on the test dataset, reaching 63.1%, the detection speed of the model is not fast, only 12.2 FPS, and this speed has a gap compared to the requirement of real-time detection. In addition, arranging the model on mobile and embedded devices have a strong practical significance for apple disease detection, but the requirement for detection speed is very high, so determining how to balance the model in terms of detection accuracy and speed is the next key issue we will study.

5. Conclusions

This work is devoted to studying the high-precision detection method of apple leaf diseases using improved Faster R-CNN. Our approach provides a scheme for identifying tiny and dense disease objects in the field background. By using our constructed dataset AALDD, the main conclusions were as follows:
  • The AP and AR of the improved Faster R-CNN model with Res2Net-50-FPN are 62.9% and 68.5%, it is highest among other different backbones including ResNet-50-FPN, ResNet-101-FPN, ResNeXt-101-FPN, ResNeSt-50-FPN, and Reg-Net-FPN.
  • The AP50 of the improved Faster R-CNN with RoIAlign is 0.6%, 0.7% and 0.4% higher than that of Faster R-CNN with RoIPool in detecting powdery mildew, scab and mosaic, respectively. The AP and AR of the Faster R-CNN with RoIAlign also has an improvement of 2.9% and 2.7% compared with Faster R-CNN with RoIPool.
  • To compare the recognition results of specific apple leaf diseases, eight different detection methods are used. The AP50 of our improved Faster R-CNN in detecting frogeye leaf spot, powdery mildew, rust, scab and mosaic was 88.6%, 98.9%, 82.4%, 95.3% and 94.1%, respectively. Moreover, the AP50 of powdery mildew and mosaic has the best performance. This indicates that our method has a wide application in practice.
  • The improved Faster R-CNN using soft-NMS can achieve a 63.1% AP and 71.4 AR, outperforming the Faster R-CNN using NMS. There is also an advantage in detecting dense disease objects compared with the original Faster R-CNN.
The apple leaf disease detection method proposed in this paper shows higher detection accuracy. Because the diagnosis of leaf diseases is homogeneous, the present results provide technical references for automatic disease detection. In addition, there are some limitations fail to address in our paper. In terms of real-time detection speed, the proposed method has a significant gap with one-stage object detection methods. Moreover, the AP of rust is only 82.4%, which is lower than that of other classes of diseases. The above issues are ones we will explore in our future research work.

Author Contributions

Conceptualization, methodology, software, validation, formal analysis, investigation, resources, data curation, and writing—original draft preparation, X.G.; writing—review and editing, visualization, supervision, project administration, and funding acquisition, S.Z. All authors have read and agreed to the published version of the manuscript.

Funding

This research was funded by the Youth Science and Technology Innovation Project of Shanxi Agricultural University Grant (Project No: 2019019) and the Shanxi Provincial Key Research and Development Project (Project No: 201903D221027).

Institutional Review Board Statement

Not applicable.

Informed Consent Statement

Not applicable.

Data Availability Statement

Acknowledgments

The authors thank the editor and anonymous reviewers for providing helpful suggestions for improving the quality of this manuscript.

Conflicts of Interest

The authors declare no conflict of interest.

References

  1. National Bureau of Statistics of China, Agricultural Data. Available online: https://data.stats.gov.cn/easyquery.htm?cn=C01 (accessed on 1 January 2023).
  2. Zhong, Y.; Zhao, M. Research on deep learning in apple leaf disease recognition. Comput. Electron. Agric. 2020, 168, 105146. [Google Scholar] [CrossRef]
  3. Bansal, P.; Kumar, R.; Kumar, S. Disease detection in apple leaves using deep convolutional neural network. Agriculture 2021, 11, 617. [Google Scholar] [CrossRef]
  4. Hlaing, C.S.; Maung Zaw, S.M. Tomato plant diseases classification using statistical texture feature and color feature. In Proceedings of the 2018 IEEE/ACIS 17th International Conference on Computer and Information Science (ICIS), Singapore, 6–8 June 2018. [Google Scholar]
  5. Shrivastava, V.K.; Pradhan, M.K. Rice plant disease classification using color features: A machine learning paradigm. J. Plant Pathol. 2021, 103, 17–26. [Google Scholar] [CrossRef]
  6. Yang, N.; Qian, Y.; El-Mesery, H.S.; Zhang, R.; Wang, A.; Tang, J. Rapid detection of rice disease using microscopy image identification based on the synergistic judgment of texture and shape features and decision tree-confusion matrix method. J. Sci. Food Agric. 2019, 99, 6589–6600. [Google Scholar] [CrossRef]
  7. Mahmud, M.S.; Zaman, Q.U.; Esau, T.J.; Price, G.W. Development of an artificial cloud lighting condition system using machine vision for strawberry powdery mildew disease detection. Comput. Electron. Agric. 2019, 158, 219–225. [Google Scholar] [CrossRef]
  8. Chaudhary, P.; Chaudhari, A.K.; Godara, S. Color transform based approach for disease spot detection on plant leaf. Int. J. Comput. Sci. Telecommun. 2012, 3, 65–70. [Google Scholar]
  9. Pupitasari, T.D.; Basori, A.H.; Riskiawan, H.Y.; Setyohadi, D.P.S.; Kurniasari, A.A.; Firgiyanto, R.; Mansur, A.B.F.; Yunianta, A. Intelligent detection of rice leaf diseases based on histogram color and closing morphological. Emir. J. Food Agric. 2022, 34, 404–410. [Google Scholar] [CrossRef]
  10. Arivazhagan, S.; Shebiah, R.N.; Ananthi, S.; Varthini, S.V. Detection of unhealthy region of plant leaves and classification of plant leaf diseases using texture features. Agric. Eng. Int. CIGR J. 2013, 15, 211–217. [Google Scholar]
  11. Li, Z.; Guo, R.; Li, M.; Chen, Y.; Li, G. A review of computer vision technologies for plant phenotyping. Comput. Electron. Agric. 2020, 176, 105672. [Google Scholar] [CrossRef]
  12. Chen, J.; Yin, H.; Zhang, D. A self-adaptive classification method for plant disease detection using GMDH-logistic model. Sustain. Comput. Inform. 2020, 28, 100415. [Google Scholar] [CrossRef]
  13. Shuaibu, M.; Lee, W.S.; Schueller, J.; Gaderc, P.; Hong, Y.K.; Kim, S. Unsupervised hyperspectral band selection for apple Marssonina blotch detection. Comput. Electron. Agric. 2018, 148, 45–53. [Google Scholar] [CrossRef]
  14. Zhang, C.; Zhang, S.; Yang, J.; Shi, Y.; Chen, J. Apple leaf disease identification using genetic algorithm and correlation based feature selection method. Int. J. Agric. Biol. Eng. 2017, 10, 74–83. [Google Scholar]
  15. Omrani, E.; Khoshnevisan, B.; Shamshirband, S.; Saboohi, H.; Anuar, N.B.; Nasir, M. Potential of radial basis function-based support vector regression for apple disease detection. Measurement 2014, 55, 512–519. [Google Scholar] [CrossRef]
  16. Tian, Y.; Yang, G.; Wang, Z.; Li, E.; Liang, Z. Detection of apple lesions in orchards based on deep learning methods of CycleGAN and YOLOV3-Dense. J. Sens. 2019, 2019, 7630926. [Google Scholar] [CrossRef]
  17. Khan, A.I.; Quadri, S.M.K.; Banday, S.; Shah, J.L. Deep diagnosis: A real-time apple leaf disease detection system based on deep learning. Comput. Electron. Agric. 2022, 198, 1070931. [Google Scholar] [CrossRef]
  18. Liu, B.; Zhang, Y.; He, D.; Li, Y. Identification of apple leaf diseases based on deep convolutional neural networks. Symmetry 2018, 10, 11. [Google Scholar] [CrossRef] [Green Version]
  19. Mahato, D.K.; Pundir, A.; Saxena, G.J. An improved deep convolutional neural network for image-based apple plant leaf disease detection and identification. J. Inst. Eng. India Ser. A 2022, 103, 975–987. [Google Scholar] [CrossRef]
  20. Atila, Ü.; Uçar, M.; Akyol, K.; Uçar, E. Plant leaf disease classification using EfficientNet deep learning model. Ecol. Inform. 2021, 61, 101182. [Google Scholar] [CrossRef]
  21. Sun, H.; Xu, H.; Liu, B.; He, D.; He, J.; Zhang, H.; Geng, N. MEAN-SSD: A novel real-time detector for apple leaf diseases using improved light-weight convolutional neural networks. Comput. Electron. Agric. 2021, 189, 106379. [Google Scholar] [CrossRef]
  22. Wang, Y.; Wang, Y.; Zhao, J. MGA-YOLO: A lightweight one-stage network for apple leaf disease detection. Front. Plant Sci. 2022, 13, 927424. [Google Scholar] [CrossRef]
  23. Rehman, Z.u.; Khan, M.A.; Ahmed, F.; Damaševicius, R.; Naqvi, S.R.; Nisar, W.; Javed, K. Recognizing apple leaf diseases using a novel parallel real-time processing framework based on mask rcnn and transfer learning: An application for smart agriculture. IET Image Process. 2021, 15, 2157–2168. [Google Scholar] [CrossRef]
  24. Jiang, P.; Chen, Y.; Liu, B.; He, D.; Liang, C. Real-Time Detection of Apple Leaf Diseases Using Deep Learning Approach Based on Improved Convolutional Neural Networks. IEEE Access 2019, 7, 59069–59080. [Google Scholar] [CrossRef]
  25. Lin, T.Y.; Dollar, P.; Girshick, R.; He, K.; Hariharan, B.; Belongie, S. Feature pyramid networks for object detection. In Proceedings of the 2017 IEEE Conference on Computer Vision and Pattern Recognition (CVPR), Honolulu, HI, USA, 21–26 July 2017. [Google Scholar]
  26. He, K.; Georgia, G.; Piotr, D.; Ross, G. Mask R-CNN. In Proceedings of the 2017 IEEE Transactions on Pattern Analysis & Machine Intelligence (ICCV), Venice, Italy, 22–29 October 2017. [Google Scholar]
  27. Bodla, N.; Singh, B.; Chellappa, R.; Davis, L.S. Improving object detection with one line of code. In Proceedings of the 2017 IEEE International Conference on Computer Vision (ICCV), Venice, Italy, 22–29 October 2017. [Google Scholar]
  28. Ren, S.; He, K.; Girshick, R.B.; Sun, J. Faster R-CNN: Towards real-time object detection with region proposal networks. Adv. Neural Inf. Process. Syst. 2015, 39, 1137–1149. [Google Scholar] [CrossRef] [PubMed]
  29. Girshick, R.; Donahue, J.; Darrell, T.; Malik, J. Rich feature hierarchies for accurate object detection and semantic segmentation. In Proceedings of the 2014 IEEE Conference on Computer Vision and Pattern Recognition (CVPR), Columbus, OH, USA, 24–27 June 2014. [Google Scholar]
  30. Girshick, R. Fast R-CNN. In Proceedings of the 2015 IEEE International Conference on Computer Vision (ICCV), Santiago, Chile, 7–13 December 2015. [Google Scholar]
  31. Gao, S.H.; Cheng, M.M.; Zhao, K.; Zhang, X.Y.; Yang, M.H.; Torr, P. Res2net: A new multi-scale backbone architecture. IEEE Trans. Pattern Anal. Mach. Intel. 2021, 43, 652–662. [Google Scholar] [CrossRef] [Green Version]
  32. He, K.; Zhang, X.; Ren, S.; Sun, J. Deep residual learning for image recognition. In Proceedings of the 2016 IEEE Conference on Computer Vision and Pattern Recognition (CVPR), Las Vegas, NV, USA, 27–30 June 2016. [Google Scholar]
  33. Kai, C.; Jiaqi, W.; Jiangmiao, P.; Yuhang, C.; Yu, X.; Xiaoxiao, L.; Shuyang, S.; Wansen, F.; Ziwei, L.; Jiarui, X.; et al. MMDetection: OpenMMLab detection toolbox and benchmark. arXiv 2019, arXiv:1906.07155. [Google Scholar]
  34. Alruwaili, M.; Siddiqi, M.H.; Khan, A.; Azad, M.; Khan, A.; Alanazi, S. RTF-RCNN: An architecture for real-time tomato plant leaf diseases detection in video streaming using Faster-RCNN. Bioengineering 2022, 9, 565. [Google Scholar] [CrossRef]
  35. Zhang, Y.; Song, C.; Zhang, D. Deep Learning-Based Object Detection Improvement for Tomato Disease. IEEE Access 2020, 8, 56607–56614. [Google Scholar] [CrossRef]
  36. Sardogan, M.; Ozen, Y.; Tuncer, A. Detection of apple leaf diseases using Faster R-CNN. Düzce Univ. J. Sci. Tech. 2020, 8, 1110–1117. [Google Scholar]
Figure 1. Image samples and their scientific name. (a) Scab (Venturia inaequalis (Cooke) G. Winter). (b) Frogeye leaf spot (Alternaria alternata (Fr.) Keissl). (c) Rust (Gymnosporangium asiaticum Miyabe ex G. Yamada). (d) Powdery mildew (Podosphaera leucotricha (Ell. Ev Ev.) Salm.). (e) Mosaic (Apple mosaic virus).
Agriculture 13 00240 g001
Figure 2. The flowchart of the detection model using Faster R-CNN. (The result picture contains the predicted disease category, the confidence, and the location of the disease marked by an orange box).
Agriculture 13 00240 g002
Figure 3. ResNet block and Res2Net block architecture. (a) ResNet block. (b) Res2Net block. x i ( i = 1 , 2 , 3 , 4 ) represents the split feature map subsets, K i ( ) ( i = 2 , 3 , 4 ) denotes 3 × 3 convolution and y i ( i = 1 , 2 , 3 , 4 ) refers to the output of K i ( ) .
Agriculture 13 00240 g003
Figure 4. The building block of FPN. The black arrows, red arrows and yellow arrows imply convolution, upsampling and 1 × 1 convolution, respectively.
Agriculture 13 00240 g004
Figure 5. The procedure of RoIAlign. To begin with, the color grid represents a feature map and the red solid lines an RoI (with 2 × 2 bins) in (a). Then, in (b) sampling 4 points in each bin, which are demonstrated as the red dots. The value of each sampling point is computed by bilinear interpolation from the nearby grid points on the feature map, as the blue arrows pointed and the result is depicted in (c). Finally, max or average pooling is aggregated for 4 bins. The final feature after pooling is elucidated in (d).
Agriculture 13 00240 g005
Figure 6. The indictors comparison of apple leaf diseases detection using RoIPool and RoIAlign. AP and AR denote average precision and average recall, respectively. (unit: %).
Agriculture 13 00240 g006
Figure 7. Comparison of NMS and soft-NMS test results. The left column (a,c,e) shows that Faster R-CNN with NMS produces some missed diseases under dense conditions. The right column (b,d,f) exhibits that Faster R-CNN overcomes the influence of the connected diseases by a linear penalty function. (The orange box represents the predicted bounding box; blue circle is the object missed to recognize in Faster R-CNN with NMS and yellow circle denotes the detection objects in Faster R-CNN with soft-NMS).
Agriculture 13 00240 g007
Figure 8. Confusion matrices of different models, where 1–6 in the confusion matrix represents frogeye leaf spot, powdery mildew, rust, scab, mosaic and background.
Agriculture 13 00240 g008
Table 1. Numbers of the training set, validation set, and testing set.
DiseaseNumber of
Images
Training
Set
Enhanced
Training Set
Validation
Set
Test
Set
Scab9157337339191
Frogeye leaf spot9527627629595
Rust9287437439392
Powdery mildew9037237239090
Mosaic3781907609494
Scab and frogeye leaf spot5433661110
Rust and frogeye leaf spot5232641010
Total418232163851484482
Table 2. Detection results of different feature extraction networks. (unit: %).
FrameworkBackboneAPAP50AP75AR
Faster R-CNNRes2Net-50-FPN62.991.369.868.5
ResNet-50-FPN61.992.270.467.6
ResNet-101-FPN62.590.970.668.1
ResNeXt-101-FPN61.891.069.667.7
ResNeSt-50-FPN61.091.368.667.0
RegNet-FPN62.189.370.067.9
Table 3. Detection results of different detection frameworks. AP and AR are average precision and average recall, respectively. AP50 and AP75 stand for the AP under Intersection over Union thresholds of 0.5 and 0.75, respectively. FPS represents frames per second. (unit: %).
MethodBackboneAPAP50AP75ARFPS
Cascade R-CNNResNet-50-FPN62.690.168.268.412.0
Grid R-CNNResNet-50-FPN61.591.165.968.312.5
Libra R-CNNResNet-50-FPN60.391.366.767.413.3
RetinaNetResNet-101-FPN61.291.468.267.714.6
SSDSSDVGG59.888.964.868.564.4
GFLResNet-50-FPN61.289.768.071.214.5
YOLOv3DarkNet-5359.388.063.968.076.6
VFNetResNet-50-FPN59.688.764.769.913.6
Ours 62.991.369.868.512.2
Table 4. AP50 of different categories under different detection models. (unit: %).
MethodBackboneFrogeye
Leaf Spot
Powdery
Mildew
RustScabMosaic
Cascade R-CNNResNet-50-FPN83.798.583.094.890.2
Grid R-CNNResNet-50-FPN89.698.084.194.989.1
Libra R-CNNResNet-50-FPN87.898.085.094.890.8
RetinaNetResNet-101-FPN87.896.384.096.392.7
SSDSSDVGG83.196.480.193.891.1
GFLResNet-50-FPN88.591.286.090.092.9
YOLOv3DarkNet-5380.094.378.093.993.6
VFNetResNet-50-FPN83.093.582.492.891.7
Ours 88.698.982.495.394.1
Table 5. Detection result with NMS and soft-NMS. AP and AR mean average precision and average recall, respectively. (unit: %).
MethodBackboneAPAR
Faster R-CNN using NMSRes2Net-50-FPN62.968.5
Faster R-CNN using soft-NMSRes2Net-50-FPN63.171.4
Disclaimer/Publisher’s Note: The statements, opinions and data contained in all publications are solely those of the individual author(s) and contributor(s) and not of MDPI and/or the editor(s). MDPI and/or the editor(s) disclaim responsibility for any injury to people or property resulting from any ideas, methods, instructions or products referred to in the content.