Abstract
Accurately detecting and identifying granary pests is important in effectively controlling damage to a granary, ensuring food security scientifically and efficiently. In this paper, multi-scale images of seven common granary pests were collected. The dataset had 5231 images acquired with DSLR-shot, microscope, cell phone and online crawler. Each image contains different species of granary pests in a different background. In this paper, we designed a multi-scale granary pest recognition model, using the YOLOv5 (You Look Only Once version 5) object detection algorithm incorporating bidirectional feature pyramid network (BiFPN) with distance intersection over union, non-maximum suppression (DIOU_NMS) and efficient channel attention (ECA) modules. In addition, we compared the performance of the different models established with Efficientdet, Faster rcnn, Retinanet, SSD, YOLOx, YOLOv3, YOLOv4 and YOLOv5s, and we designed improved YOLOv5s on this dataset. The results show that the average accuracy of the model we designed for seven common pests reached 98.2%, which is the most accurate model among those identified in this paper. For further detecting the robustness of the proposed model, ablation analysis was conducted. Furthermore, the results show that the average accuracy of models established using the YOLOv5s network model combined with the attention mechanism was 96.9%. When replacing the model of PANet with BiFPN, the average accuracy reached 97.2%. At the same time, feature visualization was analyzed. The results show that the proposed model is good for capturing features of pests. The results of the model have good practical significance for the recognition of multi-scale granary pests.
1. Introduction
Food is a matter of national transportation and people’s livelihood, and food security is an important foundation of national security. In the process of granary storage and transportation, due to the influence of constant changes in temperature and humidity, the resulting granary pests can lead to mold and decay, which directly affects the edible quality and processing characteristics of stored granary and causes a large amount of granary loss [1]. Solving the problem of pest infestation in granary silos has become a top priority in granary storage. Therefore, it is of great practical value to accurately detect and identify granary pests, which can then lead to the effective control of pests and reduce damage scientifically and efficiently to ensure food security [2].
The traditional method of granary pest recognition is mainly by manual identification, with the help of human eyes or equipment such as magnifying glasses and microscopes, to identify the species and number of pests in granary bins. This has disadvantages including lower efficiency and limited professional ability to identify granary pests. In order to overcome such limitations, physical and chemical detection methods are used for granary pest detection. Physical methods such as the cuttings sieving method [3], probe tube trapping method [4], conductivity method [5], etc., are limited by lower detection sensitivity, long time spent, high labor costs and the inability to detect hidden pests. Chemical methods such as the staining method [6], solid-phase microextraction method [7], molecular biology methods [8], characteristic volatile compounds detection method [9], etc., are more convenient, intuitive and sensitive in operation. However, due to the requirement of special chemical instruments and equipment, experienced professionals and high cost, the resulting chemical methods have been difficult to popularize.
With the development of image recognition technology, computer vision technology has been applied to the identification of granary pests. For example, Chelladurai et al. used soft X-ray and hyperspectral imaging to identify infected and uninfected soybeans with an accuracy of more than 90% [10]. Karunakaran et al. used soft X-ray to identify larvae and adults of rice weevils and granary borers with an identification rate of 98% [11]. Dowwell et al. detected 11 beetle species associated with stored granarys with near-infrared, identifying 99% of the tested insects as primary [12]. Keagy et al. used a machine recognition method to detect weevils and weevil damage regions with wheat granary film X-ray images [13]. However, these traditional recognition models mainly rely on manually extracted features, which makes it difficult to distinguish the marker features of small storage pests from the complex background. This is in addition to poor recognition, low accuracy and a slow calculation speed.
In recent years, deep learning methods are increasingly used in the recognition of granary pests. Chen et al. used a car loaded with a camera to drive on the surface of a grain bin, and the camera took pictures of two pests, red flour beetle and rice weevil, and then used the trained yolov4 model to identify them with an average accuracy (mAP) of 97.55% [14]. Jiang et al. applied deep convolutional neural networks to construct feature pyramid networks to extract insect image features with different spatial resolutions and semantic information, and used tiled anchor points at different scales to deal with grain storage pests at different scales, and achieved an average detection accuracy of 94.77% for 10 kinds of grain bin pests [15]. Shen et al. used the Faster-RCNN method to extract regions in the image that might contain grain storage pests and identified these regions using an improved Inception neural network structure, which was able to effectively detect grain storage pests in the background with impurities, with an mAP value of 88% [16]. He, Y. et al. improved the Faster R-CNN and YOLOv3 algorithms and tested them on the brown rice lice dataset, and the recognition rate of the improved algorithm was higher than that of Faster R-CNN, with an average accuracy of 96.48% [17]. Rahman, C.R. et al. proposed a two-stage small CNN to detect 10 rice pests with 93.3% accuracy [18].
The deep learning based recognition methods for granary pests make up for the problem of insufficient feature extraction in the traditional methods, improving the detection performance. However, the detection and identification of granary pests in a real granary bin environment needs to solve the problems of distinguishing granary pests between different scales, different backgrounds and species, as well as the complex spatial environment. As a result, there is not a good model available to achieve effective results for the recognition of granary pests.
The detection of granary pests should not only take into account the small target of granary pests, but also the complex background of the granary in which the pests are located and the small differences between pest species. Thus, the key to detecting granary pests using deep learning methods is to solve the problem of detecting multi-scale granary pests in complex backgrounds and to improve the detection accuracy of granary pests in different environmental backgrounds. In this study, we first collected a multi-scale image dataset of granary pests. This dataset included 5231 images acquired with a DSLR-shot, microscope, cell phone and online crawler for seven common granary pests. Each image contains different species of granary pests in a different background. Then, an improved granary pest recognition model was proposed based on YOLOv5 network. The main contributions of this work include the following three points: Firstly, we collected one dataset, including seven common grain bin pests, containing mixed kinds of images in different backgrounds and environments. Second, we designed an improved yolov5 model, which can, to some extent, solve the problem of detecting and identifying multiple species of grain bin pests in complex backgrounds. The average accuracy of the improved model proposed in this study can reach 97.20%, and 98.20% for mAP0.5. In addition, we compared the performance of different models established with Efficientdet [19], Faster rcnn [20], Retinanet [21], SSD [22], YOLOx [23], YOLOv3 [24], YOLOv4 [25], YOLOv5s and improved Yolov5s we designed.. The experimental results show that the detection and recognition ability and generalization ability of this model are higher than those of the above models. Next, an ablation analysis was conducted for detecting the robustness of the proposed model. Finally, feature visualization was analyzed. The flowchart of this paper is shown in Figure 1.
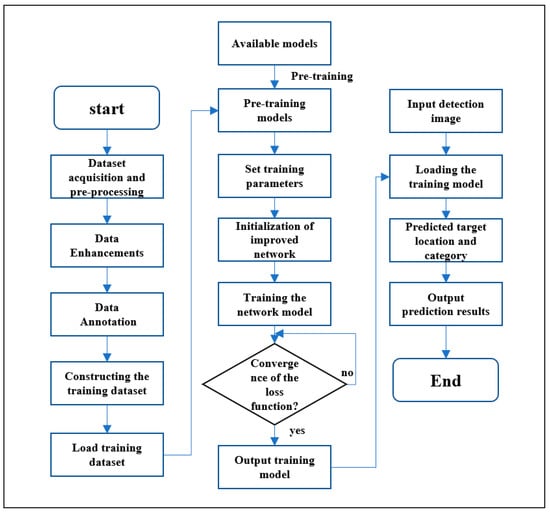
Figure 1.
General flowchart of this paper.
2. Image Dataset and Method
2.1. Image Data Set Acquisition
The dataset used in this paper contained seven common granary pests in the granary environment, which were rusty red flat granary borer, sawed granary borer, rice weevil, bean weevil, red proposed granary borer, granary borer and Indian granary borer. The images were acquired with DSLR-shot, microscope, cell phone and online crawler. Illustrations for the images of the various granary pests are shown in Figure 2. The dataset contains four types of images with resolutions of 2188 × 2918 (cell phone), 5800 × 1200 (SLR), 3648 × 2746 (microscope), 1828 × 1219 (network) and 1200 × 800 (mixed species).
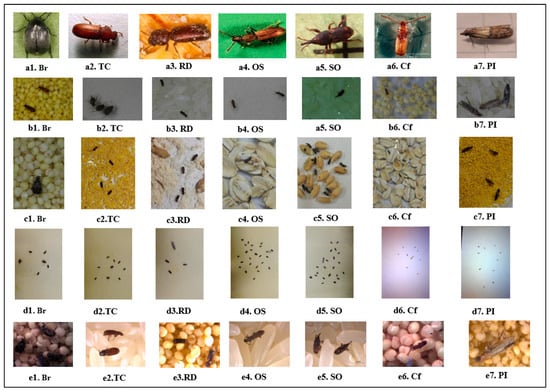
Figure 2.
Illustrations for the images of the various granary pests. (a1–a7) are images of seven kinds of pests acquired from the internet downloaded by crawling insects. (b1–b7) are images of seven species of pests taken with a Canon 750D SLR. Similarly, (c1–c7), (d1–d7) and (e1–e7) are images of seven kinds of pests captured by HUAWEI mate30 cell phone, the OV2640 image sensor equipment and a laboratory microscope, respectively. Note: Br = Bruchuidae, RD = Rhizopertha Dominica, SO = Sitophilus Oryzae, OS = Oryzaephilus Surinamensis, PI = Plodia Interpunctella, TC = Tribolium Castaneum, Cf = Cryptolestesferrugineus.
The acquisition of image data simulated the different postures of granary pests in a real granary environment. In this granary pest dataset, there were 5231 images of seven kinds of granary pests. The image number of each kind of pest is shown in Table 1. Among them, the number of microscope-shot images and DSLR-shot images were evenly distributed, and the number of web images and mobile phone-shot images were unevenly distributed. The dataset was divided into train and test sets according to a 9:1 ratio, which were used for training and testing of the model, respectively.

Table 1.
Details of image dataset categories.
2.2. Data Enhancement
The model uses Mosaic to randomly crop, stitch and scale 16 images to generate a single image. The network learns information from 16 images simultaneously, which enriches the detection data set while reducing the difficulty of the model for diversity learning. At the same time the model generates images in different sizes in the process of random scaling, which makes the network more robust. In addition, this model uses the adaptive scaling anchor frame for calculation of image scale to a uniform standard size. The size of the image input to the network was 640 × 640, and the adaptive scaling of the network was used to generate xml files using the Labelimg tool for labeling work. The data enhancement images of the input network are shown in Figure 3. The gray borders in the images are the effect of adaptive scaling images.
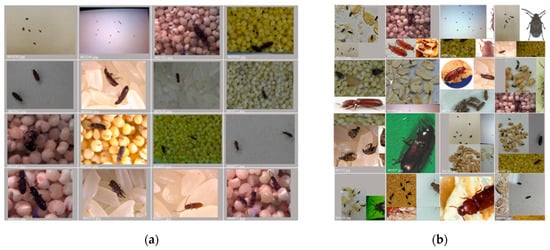
Figure 3.
Mosaic data enhancement effect. (a) Input images; (b) Generated images.
2.3. Method
2.3.1. YOLOv5 Algorithm
The main idea of the YOLO algorithm is to return the position of the bounding box and the category to which the bounding box belongs directly to the output layer [26]. The YOLOv5 network is one of YOLO algorithms. It contains the four versions: YOLOv5s, YOLOv5m, YOLOv5l, and YOLOv5x. Of these, the YOLOv5s network has the smallest size and fastest detection speed and was used to establish the granary pests recognition model in this paper. The YOLOv5s network includes four parts, input, backbone, neck, and head outputs, as shown in Figure 4.
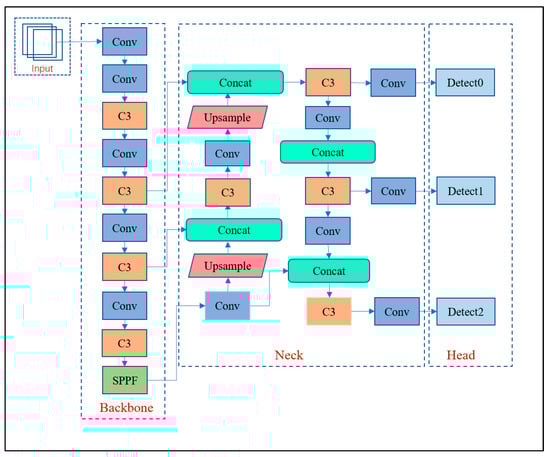
Figure 4.
Structure of YOLOv5s.
Backbone is used to extract image feature information, including C3, Conv and SPPF modules. The C3 module connects the feature information and fuses the feature information before and after the network. The C3 module contains three standard convolutional layers and several Bottleneck modules, which are the main modules for learning the residual features. The C3 module first divides the feature mapping of the base layer into two parts, and then merges them through the cross-stage hierarchy, which reduces the computational effort while ensuring accuracy. The Conv module performs convolution, BN, and activation function operations on the input feature map.The conv module implements the convolutional layer, activation function, and normalization layer to obtain the output layer. SPPF is a spatial pyramid pooling function that serves to implement adaptive size output and can convert feature maps of arbitrary sizes into feature vectors of a fixed size. The SPPF effectively avoids problems such as image distortion caused by cropping and scaling operations on image regions. The SPPF module maximizes the pooling layer and increases the perceptual field to solve the problem of fusing repetitive features generated in convolution and to improve the speed of the network in generating candidate frames. The neck module includes structures of feature pyramid networks (FPN) [27] and path aggregation networks (PAN) [28], and uses multiple scales to achieve the fusion of feature information, which further enhances the diversity of its features and robustness. The output of the YOLOv5s are the target detection results for small, medium and large targets. In the output module, the GIOU_Loss bounding box loss function and the non-maximum suppression (NMS) [29] algorithm are used to improve the speed and accuracy of the prediction model.
2.3.2. Improved YOLOv5 Model
Due to the small difference between granary pest species, small target size and complex background of the granary, it is difficult to obtain satisfactory results using traditional detection methods. In this paper, an improved YOLOv5-based granary pest detection model is proposed, as shown in Figure 5. The attention mechanism of the efficient channel attention (ECA) [30] is introduced into the feature extraction module to improve the feature extraction ability for small target information. In addition, the bidirectional feature pyramid network (BiFPN) [19] is used to feature the fusion module to enhance the information flow between higher and lower layers. Furthermore, the prediction module replaces NMS with DIOU_NMS to improve the problem of overlapping target frames due to dense targets.
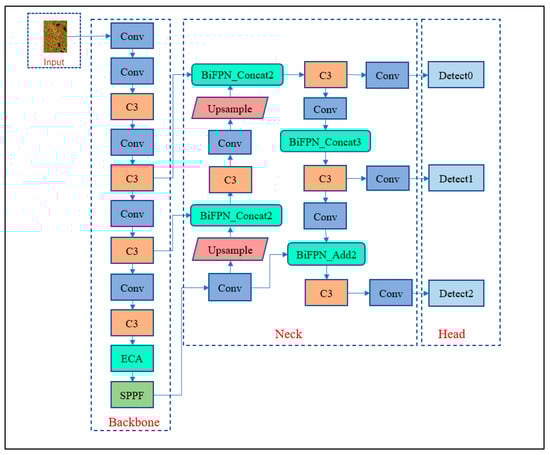
Figure 5.
Structure of the improved YOLOv5 network model.
Fusion efficient channel attention. The YOLOv5s original model uses upsampling to obtain large size feature maps, and achieves aggregation of target information by stitching the same-sized feature maps in the backbone network. In the process of continuous convolution, the complex background generates a large amount of redundant information due to granary pests belonging to smaller targets, which leads to the network’s disinterest in the target information and, therefore, it is not able to locate and identify accurately. In this paper, to optimize the feature extraction backbone module, ECA is added after the last C3 structure. The ECA is shown in Figure 6.
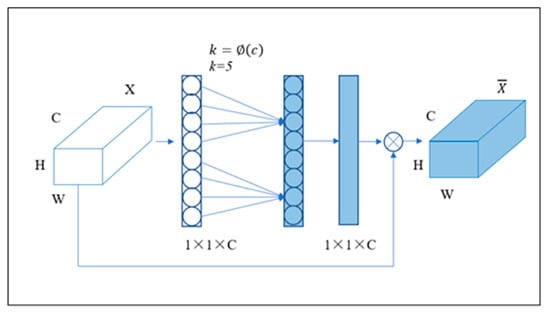
Figure 6.
Schematic diagram of ECA attention.
In Figure 6, X denotes the input feature map, H, W and C denote the height, width and number of channels of the feature map, respectively. The number of channels, denotes the output feature map, and ⊗ denotes the element-by-element multiplication. k and the relationship Equation (1) existing between channels c are as follows: k denotes the coverage of local cross-channel interaction, denotes the most similar odd number, and γ and b are 2 and 1, respectively.
ECA increases the feature extraction field by enhancing feature aggregation, the combination of channel and spatial attention, to effectively improve the detection accuracy of the network.
Feature Pyramid Improvement. PANet in the YOLOv5s network has only one top-down and bottom-up path, and the feature information of its input part is processed by FPN, which often leads to errors in network learning during the training process due to the loss of feature information extracted from the backbone network. BiFPN [19], the weighted bidirectional feature pyramid network, handles each bidirectional path as a feature network layer, repeatedly applying top-down and bottom-up multi-scale fusion, enhancing feature fusion and improving the accuracy of detecting targets at different scales. The BiFPN structure is shown in Figure 7. In Figure 7, Pi (i = 3,4, …, 7) represents each feature layer in the network structure, and feature information flows repeatedly between the nodes in each layer in both top-down and bottom-up directions. The BiFPN processes each bidirectional path as a feature network layer and repeats the same layer several times to achieve higher-level feature fusion. BiFPN is more compact and feature fusion is more efficient. In the improved YOLOv5s network model, the original neck part of the concat structure is replaced with BiFPN_Concat2 and BiFPN_Concat3 modules, to repeat the connection between the layers several times to improve the flow effect of bottom-up as well as top-down feature information and reduce the feature information of small targets in the feature-fusion process.
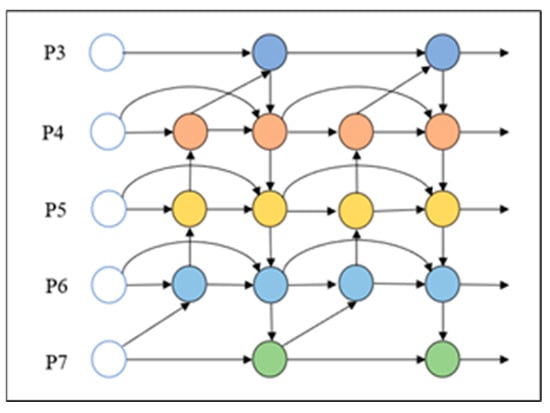
Figure 7.
BiFPN structure diagram.
NMS non-extreme suppression improvement. In the process of network prediction, non-maximum suppression (NMS) is needed to filter a large number of detection frames. The principle of NMS is to remove the detection frame when the intersection ratio IOU between the detection frame and the detection frame with the highest prediction score is greater than a given threshold. However, in the actual granary environment, the target frames of granary pests are mostly overlapping and the targets are blocking each other, as shown in Figure 8. Therefore, target detection under the condition of overlapping target frames should consider the distance between the center points of the two prediction frames in addition to the IOU of the overlapping area of the prediction frames. DIOU_NMS takes into account the distance between the prediction frames and the target frames, the overlap rate and the scale influence. If the IOU between two frames is relatively large, but the distance between the two frames is relatively large, it may be considered as the frames of two objects and will not be filtered out. This can improve the problem of missed detection when the target is crowded, and increase the recall and accuracy of detection. The calculation of DIOU_NMS is shown in Formula (2).
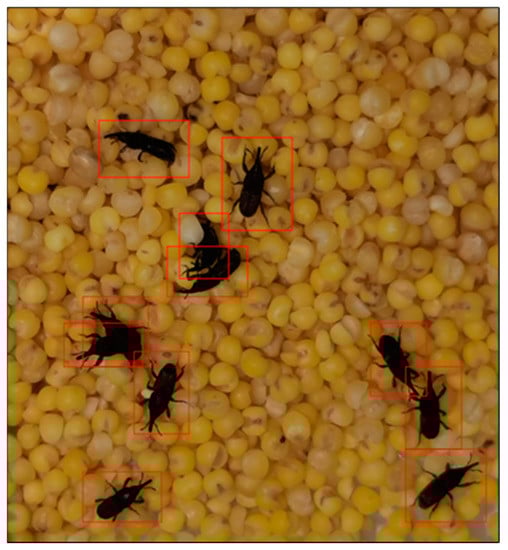
Figure 8.
Target box overlap diagram.
a and denote the centroids of the prediction box and the labeled box, respectively, d denotes the Euclidean distance between the two centroids, IOU is the prediction box overlap region, and c is the diagonal distance of the smallest external rectangle between the prediction box and the labeled box.
2.4. Evaluation Indexes for Detection Model
In this paper, precision (P), recall (R), average precision (AP) and mean average precision (mAP), were used as the metrics for evaluation.
Precision is defined as the correct detection rate of all detected targets, which can be expressed as Formula (3). TP: True Positive, which is judged as a positive sample. TP represents the number of targets detected by correct identification. FP: False Positive, the sample is judged as positive, but in fact it is negative. FP is the number of missed and wrong detections.
Recall is defined as the correct detection rate in all positive samples, which can be expressed as Formula (4). FN: False Negative, the sample is judged as negative, but in fact it is positive. FN is the number of target objects detected as other kinds of objects.
In Equations (3) and (4), the average accuracy AP is defined as the mean value of the accuracy rate under different recall rates, and it is the integral of the accuracy rate to the recall rate, which can be expressed as Formula (5).
mAP is the average value taken over AP, n represents the number of target types, and APi is the average accuracy rate of the ith target, which is calculated with Equation (6).
mAP0.5 is the average AP value when the intersection ratio (IOU) threshold is 0.5, n represents the number of target species, and AP0.5i is the average accuracy rate of the ith target when the intersection ratio threshold is 0.5, which is calculated with Equation (7).
3. Results and Analysis
3.1. Experimental Environment
All the experiments in this paper were carried out in the Ubuntu system environment, in which the Pycharm software used in this experiment was equipped with the following environment: pytorch1.7, python3.7, CUDA11.1. The hardware environment and related model parameters are shown in Table 2 and Table 3.
Table 2.
Experimental environment configuration.
Table 3.
Experimental model parameters.
3.2. Comparison of Performance between Pest Recognition Models Established by Different Algorithms
The loss variation of this model established with the improved YOLOv5s network in the training process is shown in Figure 9, which are the graphs of loss variation of border regression, confidence loss and classification probability loss, respectively. From the curves of the graphs, we can see that the border loss, confidence loss and classification probability loss of the training set decrease continuously with the increase of epoch, and gradually stabilize.
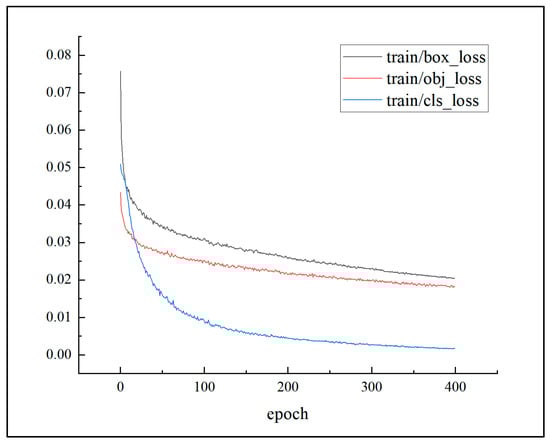
Figure 9.
Loss variation.
In order to compare the performance of this model established with the improved YOLOv5s network, common target detection models were also established with Efficientdet, faster rcnn, Retinanet, SSD, YOLOv3, YOLOv4, YOLOv5, YOLOx, YOLOv6 and YOLOv7. All network models were set to 400 iterations. Comparison results of models are shown in Table 4. As Table 4 shows, the model established with the proposed algorithm is higher than the other detection models in terms of precision and recall. The results proved that the model improved in performance and reduced the occurrence of wrong and missed detections to some extent.
Table 4.
Comparison of network models.
As can be seen from Table 5, the Mosaic data augmented approach for both the pre- and post-improvement networks yielded a significant improvement in mAP and Recall recall. Using the improved algorithm with Mosaic data augmentation, mAP0.5 improved from 88.51% to 99.20% (+9.69%) and Recall improved from 82.28% to 96.85% (+14.57%) over the network without the Mosaic algorithm. It is shown experimentally that the Mosaic data enhancement approach enriches the data sample and improves the generalization of the model.
Table 5.
Comparison of data enhancement results of the network before and after improvement.
Table 6 shows the comparison of the accuracy of the models before and after the improvement in detecting various types of granary pests.
Table 6.
Comparison of accuracy of each category before and after improvement.
As can be seen in Table 6, the model established by the improved algorithm improved the detection of granary pests such as cereal beetles, that are heavily obscured due to complex backgrounds, and the accuracy was improved from 87.6% to 99.0%. This model is able to better capture the indistinguishable detailed features of very small targets such as rust stealers and red flat cereal beetles, which in turn improved the detection accuracy by 3.1%. The model can adapt to different types of multi-scale granary pests in different complex backgrounds, improving the detection accuracy of obscured targets.
3.3. Ablation Experiment
In order to better detect and demonstrate the robustness of the model, ablation experiments were conducted in this paper. Based on the original YOLOv5s algorithm, only one improvement method was added at each step to verify the improvement effect of each on the original algorithm. A total of five sets of experiments were carried out to compare the present model, results are shown in Table 7.
Table 7.
Ablation experiments.
As can be seen from Table 6, the YOLOv5s network model with the addition of the attention mechanism improved precision and recall by 1.11% and 1.6%, respectively. When replacing PANet with BiFPN, the mAP0.5 of model improved by 2.07% and recall increased by 3.44%. When the NMS of the model was changed to DIOU_NMS, the mAP0.5 improved by 0.87%. As can be seen in Table 6, the YOLOv5s network model with the added attention mechanism improved from 94.17% to 96.28% (+1.11%) in precision and from 90.45% to 92.05% (+1.6%) in recall. When the PANet was replaced with BiFPN, the mAP0.5 of the model improved from 95.13% to 97.2% (+2.07%) and the recall improved from 90.45% to 93.89% (+3.44%). When the NMS of the model was changed to DIOU_NMS, the mAP0.5 improved from 95.13% to 96.0% (+0.87%), and the recall improved from 90.45% to 91.14% (+0.69%). The model established with the improved algorithm had an improvement in mAP0.5 from 95.1 to 98.2% (+3.1) and an improvement in Recall from 90.45 to 96.85% (+6.40). The results show that through continuous feature fusion, the detection performance for small targets with occlusion in complex environments is improved by a small margin, which improves the detection capability of the model and proves that the model can adapt to complex granary environments.
3.4. Feature Visualization
In the feature extraction stage, the feature map shows mostly image detail feature information, and as the network goes deeper and deeper, the obtained feature map becomes more abstract. In order to show the effect of this model on feature extraction and feature fusion more intuitively, Conv_0 and Conv_1 in Figure 10 focus on the local features, morphology and detailed texture information of the target, while Conv_3 and Conv_5 focus more on the abstract information such as the background around the target information. As can be seen from Figure 10b, the improved model obtains a more obvious feature map of the granary pests, and extracts more detailed features for the images in the input network, and the feature information is more significant, which enhances the feature extraction capability of the network.
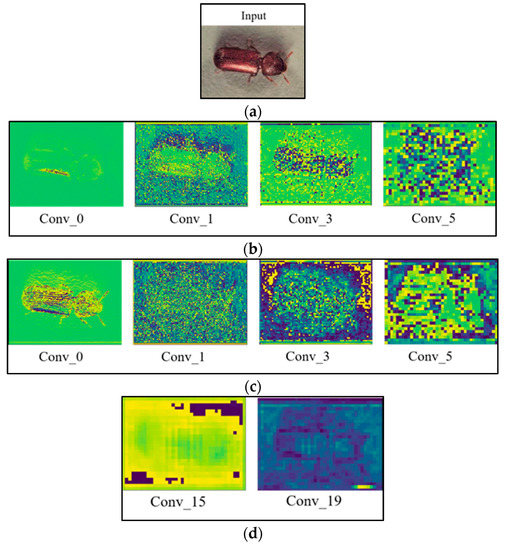
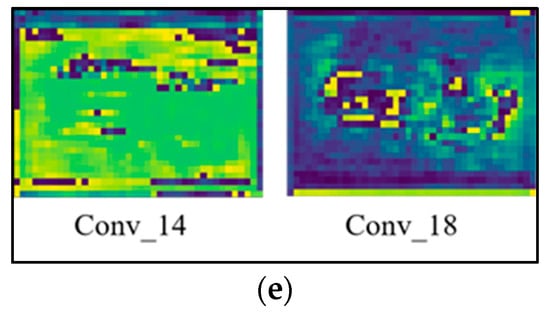
Figure 10.
Illustrations of feature visualization of granary pests recognition model. (a) Input image; (b) Improved feature extraction network feature map; (c) Feature extraction network before improvement; (d) Feature fusion network feature map after improvement; (e) Feature fusion network feature map before improvement.
In the feature fusion stage, as shown in Figure 10d, the improved Conv_15 and Conv_19 are the feature maps fused by the BiFPN mentioned in this paper, and comparing with the improved Conv_14 and Conv_18 before, it can be clearly seen that the target information fused by the BiFPN can suppress other irrelevant target information, and strengthen the fusion of target information features. It reduces the interference of target background information, which can improve the extraction ability of features by the network model and improve the recognition rate.
Figure 11 shows illustrations of the recognition results of the models built with the YOLOv5s network and the modified YOLOv5s network. From Figure 11a, it can be seen that the original network model has the problem of misdetection and the model cannot detect two grain bin pests with high similarity well.
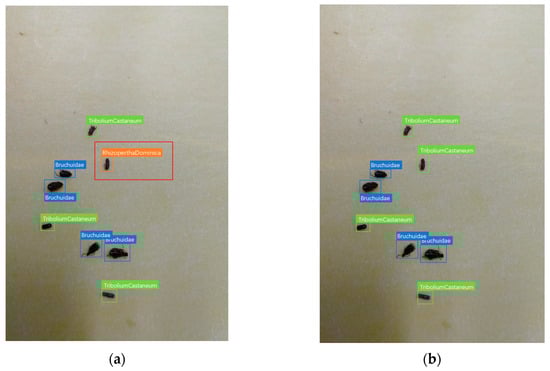
Figure 11.
Illustrations of the error detection results with models established with YOLOv5s network and improved YOLOv5s network. (a) Error detection results with model established by YOLOv5s network. (b) Right detection results with model established by improved YOLOv5s network.
Figure 12 shows illustrations of the recognition results of the model built with the YOLOv5s network and the modified YOLOv5s network. From Figure 11a, we can see that the original network model has the problem of missed detection and the model is not really able to detect grain bin pests with more serious shading. The improved model not only can detect more accurately, but also improves the problem of missed detection of small targets due to occlusion, and is more adaptable to the complex grain bin environment.
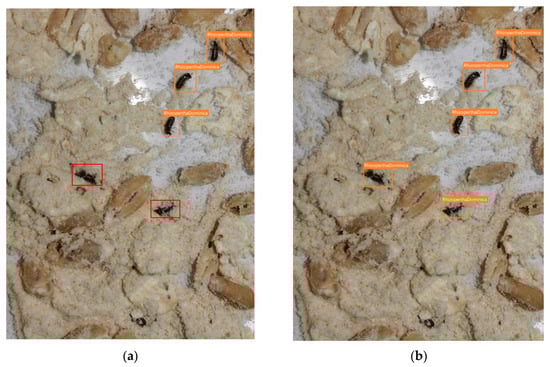
Figure 12.
Illustrations of the omission detection results with models established with YOLOv5s network and improved YOLOv5s network. (a) Omission detection results with model established by YOLOv5s network. (b) Right detection results with model established by improved YOLOv5s network.
4. Conclusions
This paper proposed an improved YOLOv5 multi-scale granary pest detection model, which addressed the problem of high-precision detection of common granary pests in complex granary environments. This improved algorithm introduced an attention mechanism ECA to improve the network’s ability of capturing detailed feature information of small targets, increasing the local sensory field, and performing multi-scale fusion. In addition, this improved algorithm introduced BiFPN which uses a cross-layer cascade to fuse low-level and high-level feature information. As a result, the mAP0.5 of model established with this proposed algorithm can reach 98.2%, which can meet the requirements of detection and recognition in a granary environment. However, due to limitations of the dataset, further study is needed that includes more pest species and more complex granary environments.
Author Contributions
Conceptualization, J.C.; Formal analysis, J.C.; Investigation, X.W.; Data curation, Y.R.; Funding acquisition, H.F.; Methodology, J.C.; Resources, H.F.; Writing—original draft, J.C. and Y.L.; Writing—Review, Y.L.; Visualization, J.C. All authors have read and agreed to the published version of the manuscript.
Funding
Key R&D Projects in Zhejiang Province (2022C02009, 2022C02044, 2022C02020); Basic Public Welfare Project of Zhejiang Province (GN21F020001); Three agricultural nine-party science and technology collaboration projects of Zhejiang Province (2022SNJF036).
Institutional Review Board Statement
Not applicable.
Data Availability Statement
The data presented in this study are available on request from the corresponding author.
Conflicts of Interest
The authors declare no conflict of interest.
References
- Parfitt, J.; Barthel, M.; Macnaughton, S. Food waste within food supply chains: Quantification and potential for change to 2050. Philos. Trans. R. Soc. B Biol. Sci. 2010, 365, 3065–3081. [Google Scholar] [CrossRef] [PubMed]
- Asrar, M.; Ashraf, N.; Gogi, M.D.; Hussain, S.M.; Zia, K.; Rasool, B. Toxicity and Repellence of Plant Oils against Tribolium Castaneum (HERBST), Rhyzopertha Dominica (F.) Andtrogoderma Granarium (E.). Pak. Entomol. 2016, 38, 55–63. [Google Scholar]
- Wilkin, D.R.; Lessard, F.F. The detection of insects in grain using conventional sampling spears. In Proceedings of the International Working Conference on Stored-Product Protection, Bordeaux, France, 9–14 September 1990. [Google Scholar]
- White, N.D.G.; Arbogast, R.T.; Fields, P.G.; Hillmann, R.C.; Loschiavo, S.R.; Subramanyam, B.; Throne, J.E.; Wright, V.F. The Development and Use of Pitfall and Probe Traps for Capturing Insects in Stored Grain. J. Kans. Entomol. Soc. 1990, 63, 506–525. [Google Scholar]
- Brabec, D.; Pearson, T.; Flinn, P.; Katzke, D. Detection of internal insects in wheat using a conductive roller mill and estimation of insect fragments in the resulting flour. J. Stored Prod. Res. 2010, 46, 180–185. [Google Scholar] [CrossRef]
- Leelaja, B.C.; Rajashekar, Y.; Rajendran, S. Detection of eggs of stored-product insects in flour with staining techniques. J. Stored Prod. Res. 2007, 43, 206–210. [Google Scholar] [CrossRef]
- Seitz, L.M.; Ram, M.S. Metabolites of lesser grain borer in grains. J. Agric. Food Chem. 2004, 52, 898–908. [Google Scholar] [CrossRef] [PubMed]
- Solà, M.; Lundgren, J.G.; Agustí, N.; Riudavets, J. Detection and quantification of the insect pest Rhyzopertha dominica (F.)(Coleoptera: Bostrichidae) in rice by qPCR. J. Stored Prod. Res. 2017, 71, 106–111. [Google Scholar] [CrossRef]
- Arnaud, L.; Lognay, G.; Verscheure, M.; Leenaers, L.; Gaspar, C.; Haubruge, E. Is dimethyldecanal a common aggregation pheromone of Tribolium flour beetles? J. Chem. Ecol. 2002, 28, 523–532. [Google Scholar] [CrossRef] [PubMed]
- Chelladurai, V.; Karuppiah, K.; Jayas, D.S.; Fields, P.G.; White, N.D.G. Detection of Callosobruchus maculatus (F.) infestation in soybean using soft X-ray and NIR hyperspectral imaging techniques. J. Stored Prod. Res. 2014, 57, 43–48. [Google Scholar] [CrossRef]
- Karunakaran, C. Soft X-ray Inspection of Wheat Kernels to Detect Infestations by Stored-Grain Insects; University of Manitoba: Winnipeg, MB, Canada, 2002. [Google Scholar]
- Dowell, F.E.; Throne, J.E.; Wang, D.; Baker, J.E. Identifying stored-grain insects using near-infrared spectroscopy. J. Econ. Entomol. 1999, 92, 165–169. [Google Scholar] [CrossRef]
- Keagy, P.M.; Schatzki, T.F. Machine recognition of weevil damage in wheat radiographs[C]//Optics in Agriculture and Forestry. SPIE 1993, 1836, 108–119. [Google Scholar]
- Chen, C.; Liang, Y.; Zhou, L.; Tang, X.; Dai, M. An automatic inspection system for pest detection in granaries using YOLOv4. Comput. Electron. Agric. 2022, 201, 107302. [Google Scholar] [CrossRef]
- Li, J.; Zhou, H.; Wang, Z.; Jia, Q. Multi-scale detection of stored-grain insects for intelligent monitoring. Comput. Electron. Agric. 2020, 168, 105114. [Google Scholar] [CrossRef]
- Shen, Y.; Zhou, H.; Li, J.; Jian, F.; Jayas, D.S. Detection of stored-grain insects using deep learning. Comput. Electron. Agric. 2018, 145, 319–325. [Google Scholar] [CrossRef]
- He, Y.; Zhou, Z.; Tian, L.; Liu, Y.; Luo, X. Brown Rice Planthopper (Nilaparvata Lugens Stal) Detection Based on Deep Learning. Precis. Agric. 2020, 21, 1385–1402. [Google Scholar] [CrossRef]
- Rahman, C.R.; Arko, P.S.; Ali, M.E.; Khan, M.A.I.; Apon, S.H.; Nowrin, F.; Wasif, A. Identification and Recognition of Rice Diseases and Pests UsingConvolutional Neural Networks. Biosyst. Eng. 2020, 194, 112–120. [Google Scholar] [CrossRef]
- Tan, M.; Pang, R.; Le, Q.V. Efficientdet: Scalable and efficient object detection. In Proceedings of the IEEE/CVF conference on computer vision and pattern recognition, Seattle, WA, USA, 13–19 June 2020; pp. 10781–10790. [Google Scholar]
- Ren, S.; He, K.; Girshick, R.; Sun, J. Faster r-cnn: Towards real-time object detection with region proposal networks. Adv. Neural Inf. Process. Syst. 2015, 28, 91–99. [Google Scholar] [CrossRef] [PubMed]
- Lin, T.Y.; Goyal, P.; Girshick, R.; He, K.; Dollár, P. Focal loss for dense object detection. In Proceedings of the IEEE International Conference on Computer Vision, Venice, Italy, 22–29 October 2017; pp. 2980–2988. [Google Scholar]
- Liu, W.; Anguelov, D.; Erhan, D.; Szegedy, C.; Reed, S.; Fu, C.Y.; Berg, A.C. Ssd: Single shot multibox detector. In European Conference on Computer Vision; Springer: Amsterdam, The Netherlands, 2016; pp. 21–37. [Google Scholar]
- Ge, Z.; Liu, S.; Wang, F.; Li, Z.; Sun, J. Yolox: Exceeding yolo series in 2021. arXiv 2021, arXiv:2107.08430. [Google Scholar]
- Redmon, J.; Farhadi, A. Yolov3: An incremental improvement. arXiv 2018, arXiv:1804.02767. [Google Scholar]
- Ghiasi, G.; Cui, Y.; Srinivas, A.; Qian, R.; Lin, T.Y.; Cubuk, E.D.; Le, Q.V.; Zoph, B. Simple copy-paste is a strong data augmentation method for instance segmentation. In Proceedings of the IEEE/CVF Conference on Computer Vision and Pattern Recognition, Nashville, TN, USA, 20–25 June 2021; pp. 2918–2928. [Google Scholar]
- Redmon, J.; Divvala, S.; Girshick, R.; Farhadi, A. You only look once: Unified, real-time object detection. In Proceedings of the 2016 IEEE Conference on Computer Vision and Pattern Recognition (CVPR), Las Vegas, NV, USA, 27–30 June 2016; pp. 779–788. [Google Scholar]
- Lin, T.Y.; Dollár, P.; Girshick, R.; He, K.; Hariharan, B.; Belongie, S. Feature pyramid networks for object detection. In Proceedings of the IEEE Conference on Computer Vision and Pattern Recognition, Honolulu, HI, USA, 21–26 July 2017; pp. 2117–2125. [Google Scholar]
- Liu, S.; Qi, L.; Qin, H.; Shi, J.; Jia, J. Path aggregation network for instance segmentation. In Proceedings of the IEEE Conference on Computer Vision and Pattern Recognition, Salt Lake City, UT, USA, 18–23 June 2018; pp. 8759–8768. [Google Scholar]
- Neubeck, A.; Van Gool, L. Efficient non-maximum suppression. In Proceedings of the 18th International Conference on Pattern Recognition (ICPR’06), Hong Kong, China, 20–24 August 2006; Volume 3, pp. 850–855. [Google Scholar]
- Wang, Q.; Wu, B.; Zhu, P.; Li, P.; Zuo, W.; Hu, Q. ECA-Net: Efficient channel attention for deep convolutional neural networks. In Proceedings of the IEEE Computer Society Conference on Computer Vision and Pattern Recognition, Seattle, WA, USA, 13–19 June 2020. [Google Scholar]


Disclaimer/Publisher’s Note: The statements, opinions and data contained in all publications are solely those of the individual author(s) and contributor(s) and not of MDPI and/or the editor(s). MDPI and/or the editor(s) disclaim responsibility for any injury to people or property resulting from any ideas, methods, instructions or products referred to in the content. |
© 2023 by the authors. Licensee MDPI, Basel, Switzerland. This article is an open access article distributed under the terms and conditions of the Creative Commons Attribution (CC BY) license (https://creativecommons.org/licenses/by/4.0/).