Abstract
The utilization of corn silage in animal diets is becoming a challenge, due to the crop’s reduced yield as a result of climate change. Alternative silage types, such as mixtures of Italian ryegrass and winter cereals, may be a good complement to corn silage in diet formulation. Therefore, it is important to investigate how these alternative sources influence milk fatty acid and odor profile, as well as how these quality parameters could be efficiently evaluated. In this study, a corn silage-based control (CTR) and four experimental (EXP) diets—which contained winter cereals (WC), as well as WC with Italian ryegrass (IRG) silages in different proportions—were fed to Holstein-Friesian cows (n = 32) in a single-blinded efficacy study during a series of 4-week periods, with 2 weeks of adaption to each feed before the main trial. Milk from each trial was subjected to fatty acid (FA) analysis and odor profiling through the utilization of gas chromatography and an electronic nose, respectively. The results show that milk FAs in the EXP-3 and EXP-4 groups (which contained mixed silages using WC) changed the most when compared with other groups. Moreover, with a 7 kg/day inclusion rate of WC + IRG and of the WC silages in the diets of the EXP-2 and EXP-3 groups, respectively, the milk from these groups had their n6:n3 ratio reduced, thus indicating possible health benefits to consumers. The odor variation between the milk of the WC + IRG and WC groups was greater than the variation between the milk of the CTR and EXP groups. The main volatile compound responsible for the odor of the CTR milk was ethyl-butyrate, whereas 2-propanol and butan-2-one dominated the WC milk; the milk samples of the WC + IRG groups were influenced largely by ethanol. The study proved that with a 7 kg/day inclusion of mixed silages including winter cereals plus Italian ryegrass, the FA and odor profile of bovine milk could be modified.
1. Introduction
Milk is a major delicacy in many homes around the world, the consumption of which may be linked to the socio-economic status of the consumer [1]. Notwithstanding the socio-economic status of the consumer, the nutritional and sensory properties of milk may influence the final decision of an individual when purchasing it [2]. The cow’s health status, milking environment, quality of feed, and feeding regime used significantly influence the overall quality of milk [3,4]. The influence of these variables may include chemical or nutritional alterations, as well as sensory properties, such as the aroma or odor profile [5,6,7,8]. Certain feeding strategies significantly affect the concentration of fat, fatty acid (FA) composition, and aromatic properties of milk. For instance, the use of dry olive pomace [9] and microalgae oil [10] as energy sources in feed was reported to have modified the FA and sensory properties of bovine milk. Moreover, the addition of extruded linseed, linseed oil, or fish oil to the cows’ diet markedly modified the FA of the milk produced by the cows in the experiment [11,12]. In addition, forage, fresh pasture, silage, and hay have also been found to influence the fatty acid composition and aromatic properties [13,14,15,16]. The ability of such feed resources to alter milk fat composition and concentration levels is mainly due to the high fiber levels [17]. Furthermore, mixed silages provide the required fiber level for this purpose. Therefore, in order to maintain the concentration level of milk fat—due to the fact that the major precursor of FA synthesis within the mammary gland is acetate—forage with high digestible fiber content (i.e., a minimum NDF of 19–21%) are particularly important [18]. Physiologically, during the biochemical process of lipolysis, free FAs or their precursors are released into the milk, which influences the aroma or odor profile of this milk, as well as other dairy products [19]. For example, hexanoic, octanoic, and decanoic acids have been found to be responsible for milk’s characteristic aroma [20].
In the midst of various climate-change-based threats, new silage mixtures have been under development in Europe in order to serve as a corn silage substitute or as a complement to it. Indeed, corn silage remains the most widely used energy-dense diet in European dairy farms [21]. Moreover, some of the forage types undergoing trials are winter cereals and Italian ryegrass mixtures [22,23,24]. Worku et al. investigated various factors affecting forage suitability: aroma profile, microbial and chemical qualities of the mixtures [22]; the in situ ruminal degradability and fermentation characteristics of novel mixtures [23]; the influence of ensiling protocols on the nutritional composition, rumen microbial counts, and ruminal degradability of the mixtures [24]. However, the effect of feeding these mixtures in a total mixed ration (TMR) in terms of milk fatty acids and odor profile has not yet been studied.
The sensory properties of milk over the years have been determined by conventional means, such as the human sensory test [25]. This test is mostly associated with challenges, such as the time and cost required to undertake sensory analysis, especially when huge samples are involved. The challenge, mainly, is found in an inability to recruit large numbers of professional sensory panelists in order to evaluate a large number of products when needed [26]. This is in addition to the fatigue that is involved in the evaluation process, due to the fact that a small number of panelists may not provide an accurate evaluation when compared with machine olfaction. Additionally, subjectivity on the part of unprofessional panelists may lead to a false evaluation, due to differences in the sensitivities of smell receptors [27]. For the past few decades, the electronic nose (e-nose) approach, as a correlative analytical technology, has been employed in order to rapidly analyze the sensory properties of milk, with little or no sample preparation [28]. The instrumental method of the e-nose mimics the human olfaction system by utilizing sensors that interact with the volatile compounds within a headspace [28,29].
As such, the aim of this study was to evaluate the effects of total mixed rations (TMRs)—which were formulated based on a differing mixture of winter cereals and Italian ryegrass from mixed silages—on the fatty acid profile of raw bovine milk. A further aim was also to understand how the application of the e-nose approach, as a correlative analytical method, is conducted in order to evaluate the odor profiles of raw bovine milk.
2. Materials and Methods
2.1. Experimental Design
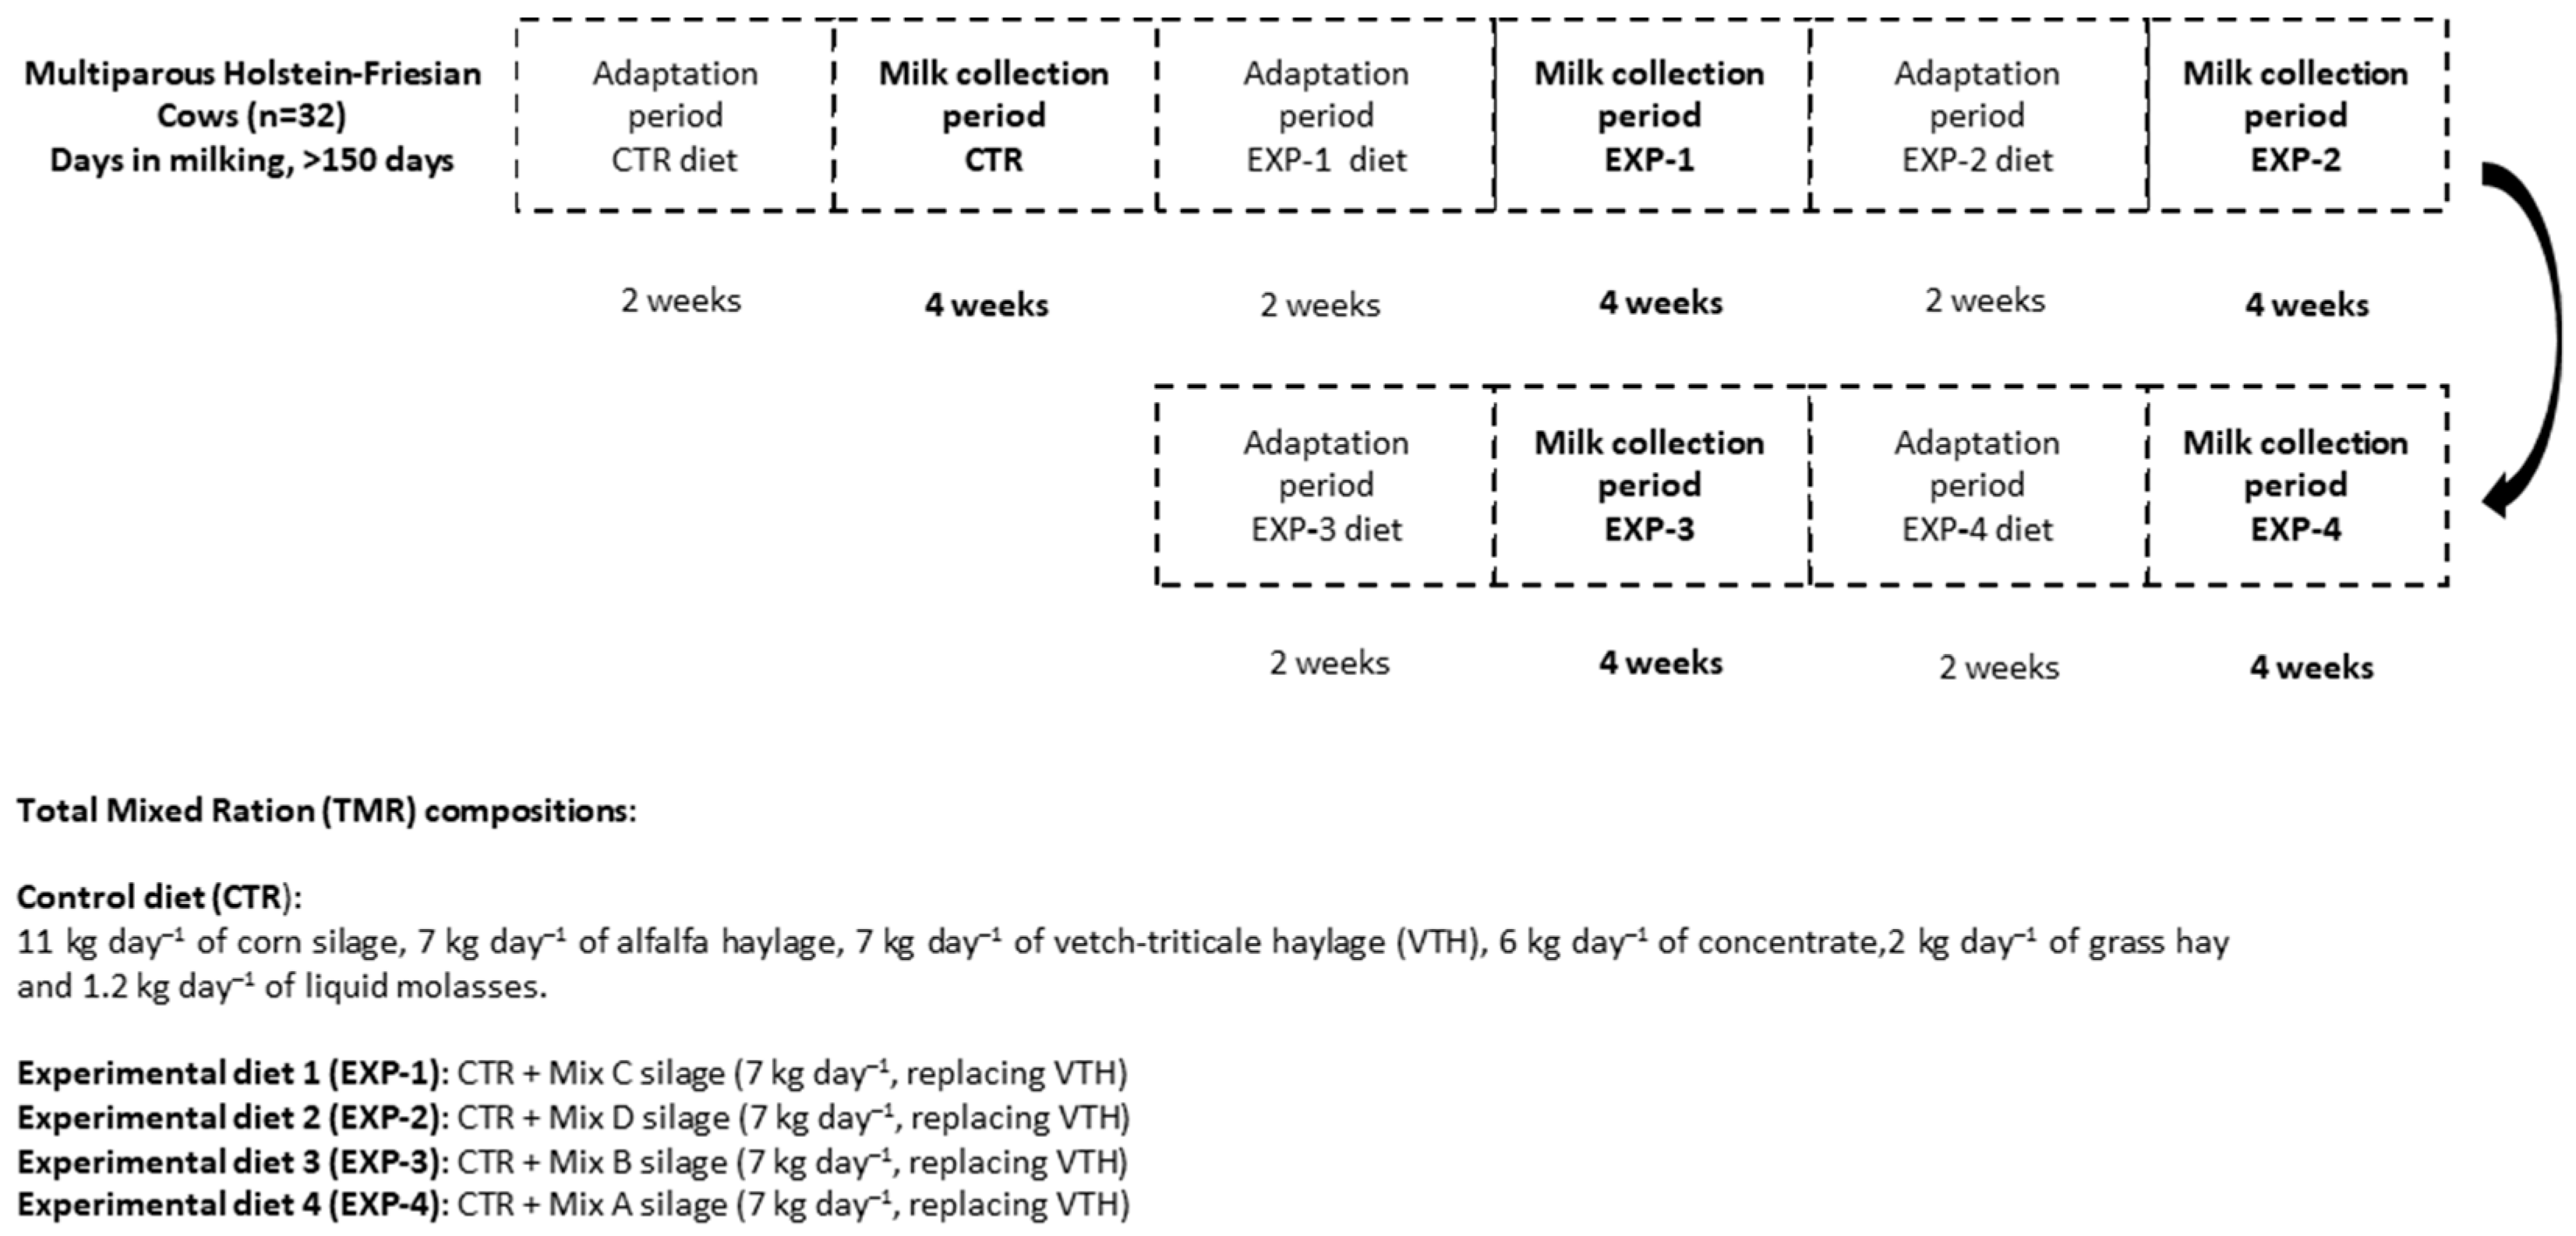
This study was carried out at the dairy farm (Fészerlak) of the Hungarian University of Agriculture and Life Sciences (MATE), Kaposvár Campus. The experimental design used was a single-blinded randomized efficacy study, divided into 5 periods (Figure 1), and conducted between August 2019 and March 2020.
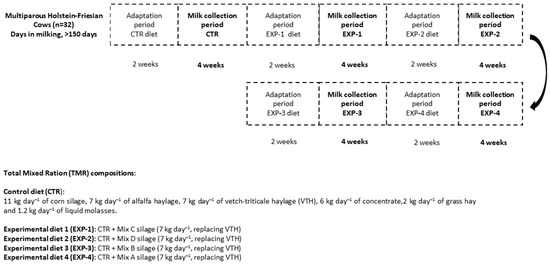
Figure 1.
Experimental design of the study and the inclusion rates of the feed ingredients.
The dairy cows used for the study were 32 multiparous Holstein-Friesian cows (>150 days in milking and an average milk production of <25 kg/day). The cows were fed with 4 experimental diets and a control feed (CTR).
The CTR diet was mainly composed of corn silage + alfalfa haylage + vetch-triticale + grass haylage. Experimental diets 1 and 2 (i.e., the EXP-1 and EXP-2 groups) were diets containing a mixture of silages with winter cereals (WC) and Italian ryegrass (IRG); these diets will henceforth be referred to as WC + IRG, whereas experimental diets 3 and 4 (EXP-3 and EXP-4) were diets containing mixed silage with winter cereals (WC) (commercial product producer: Agroteam S.p.a., Torrimpietra (RM), Via di Granaretto, 26, 00054 Rome, Italy). The selection of these experimental mixtures was based on affordability, the availability of seed materials, nutritive value, and the ease with which one can cultivate the forage.
The compositions of the silage mixtures used in the experimental diets are presented as follows:
- Mix A: 40% of two cultivars of winter triticale + 30% of two cultivars of winter oats + 20% of winter barley + 10% of winter wheat.
- Mix B: 50% of two cultivars of winter triticale + 40% of winter barley + 10% of winter wheat.
- Mix C: 55% of three types of Italian ryegrass + 45% of two cultivars of winter oat.
- Mix D: 40% of three types of Italian ryegrass + 30% of two cultivars of winter oat + 15% of two cultivars of winter triticale + 10% of winter barley + 5% of winter wheat.
Regarding the experimental design and ingredient inclusion rate of the diets, see Figure 1.
2.2. Milk Collection and Storage
Milk collection started after 2 weeks of dairy cow adaptation to each feeding trial (Figure 1). The study was performed taking into consideration the general principles of single-blinded efficacy studies. During this adaptation period, cows were fed their assigned diet and then studied for two weeks in order to facilitate the cows’ physiological adjustment to the feed [30], as well as to avoid the influence of a preceding trial on a succeeding one. The adaptation period was implemented into the study design before the main feeding trial commenced for each diet. The cows’ udder health was continually monitored with Mastatest (Mastaplex Ltd., Dunedin, New Zealand) in order to rule out mastitis. The milk of unhealthy cows was not included in the test sample. For each trial or period (5 trials in total), 8 separate collections of homogenized milk from each group were sampled into 0.5 L bottles (n = 40), which were then stored frozen (−20 °C) for subsequent e-nose measurement and lipid analysis.
2.3. Chemical Analysis of Total Mixed Ration
The crude protein (CP), ether extract (EE), crude ash, and total sugar contents were determined using the respective Association of Official Analytical Chemist AOAC protocols [31]. In addition, neutral detergent fiber (NDF), acid detergent fiber (ADF), and acid detergent lignin (ADL) were analyzed according to the procedure developed by Van Soest et al. [32].
2.4. Lipid Analysis (Milk and TMR)
Regarding milk, each sample (n = 40) was homogenized (IKA T25 Digital Ultra Turrax, Staufen, Germany) in a 20-fold volume of chloroform:methanol (2:1 v/v). Furthermore, the total lipid content was extracted [33]. The solvents were of ultrapure grade (Sigma-Aldrich, St. Louis, MO, USA); moreover, 0.01% w/v butylated hydroxytoluene was added in order to prevent FA oxidation. The samples were then evaporated to dryness under a nitrogen stream and transmethylated through a base-catalyzed NaOCH3 method [34]. The dried TMR samples were hydrolyzed at 80 °C for 60 min in a methanolic (40 mL) NaOH 50 w/v% (6 mL) solution. After cooling, the total lipid was extracted with chloroform and was then trans-methylated via an acid-catalyzed method [35], using H2SO4 (1 v/v%) in methanol as a methyl donor and toluene as a solvent at 50 °C, storing the results overnight.
Fatty acid (FA) methyl-esters were extracted into 300 μL of ultrapure n-hexane for gas chromatography (AOC 20i automatic injector (Shimadzu 2030, Kyoto, Japan), equipped with a Phenomenex Zebron ZB-WAXplus capillary GC column (30 m × 0.25 mm ID, 0.25 μm film, Phenomenex Inc., Torrance, CA, USA), and a flame ionization detector (FID). The characteristic operating conditions were as follows—injector temperature: 220 °C; detector temperature: 250 °C; helium flow: 28 cm/s.
The oven temperature was graded from 60 (2 min of holding) to 150 °C, then from 150 to 180 °C, 2 °C/min and 10 min at 180 °C, from 180 to 220 °C, 2 °C/min and 16 min at 220 °C. The makeup gas used was nitrogen. Calculations were performed with the LabSolutions 5.93 software, using the PostRun module (Shimadzu, Kyoto, Japan) with manual peak integration. The TMR and milk FA results were expressed as the weight percentage of the total FA methyl esters, as shown in Table 1 and Table 2 respectively.

Table 1.
The calculated nutrients and analyzed fatty acid profile of the control (CTR) and experimental diets (EXP-1, 2, 3, and 4).
Table 2.
Fatty acid profile (% (w/w) of total fatty acid methyl esters (mean ± standard deviation)) of raw milk in the control and experimental groups of the cows (n = 40).
2.5. E-Nose Measurement of Milk
Frozen milk samples were thawed at 4 °C overnight, as well as homogenized by shaking and perfusing through a syringe, in order to obtain a well-represented sample for the e-nose measurement. An AlphaMOS Heracles Neo electronic nose (Alpha MOS, Toulouse, France), based on flash gas chromatography with two columns (column-1: MXT-5, column-2: MXT-1701, Restek, Bellefonte, PA, USA) was equipped with an HS100 auto-sampler (PAL Systems, Switzerland) and was used for measurement. The AlphaSoft v12 (Alpha MOS, Toulouse, France) software was used to operate the electronic nose. The hydrogen that was used as a carrier gas during the measurement process was FID-grade, with an ultra-high purity of 99.999%. Furthermore, 1 mL of the individual milk samples was transferred into 20 mL headspace vials, which were then sealed with PTFE + silicon septa and kept at 10 °C until the incubation, prior to measurement. After 5 min of incubation at 50 °C (500 rpm agitation), 5 mL of the generated headspace was injected into the analyzer unit (carrier gas: hydrogen, the flow of carrier gas: 30 mL/min, trapping temperature: 30 °C, initial oven temperature: 50 °C, the endpoint of the oven temperature: 250 °C, heating rate: 2 °C/s, acquisition duration: 110 s, acquisition period: 0.01 s, injection speed: 125 μL/s, and cleaning phase: 480 s). A total of 5 measurements were conducted for each sample in a randomized order.
The general principle that underpins the Heracles analyzer as an electronic nose is found in the fact that the recorded chromatographic peaks are considered to be the response of a sensor that measures a particular volatile component of the milk sample. In addition, as a result, the position (i.e., retention time) of each peak that is recorded for the milk sample can be interpreted as a certain variable for that particular milk. Furthermore, the area under a peak can be regarded as the intensity value of that particular variable. The retention time of each peak, defined as the amount of time that the relevant compound spends in the column after it has been injected [36] was converted to a Kováts retention index (RI) [37]. As there are many peaks in the chromatogram for a batch of milk samples, a matrix of results was obtained, with m rows (m = the number of samples) and n columns (n = the number of variables/peaks measured and identified). This matrix, considered to represent the smell fingerprint of the samples, can then be evaluated via multivariate data analysis approaches.
2.6. Multivariate Data Analyses for E-Nose
The chromatogram peaks were used as sensor data, thus representing the smell fingerprints of the milk samples [22]. The AlphaSoft v12 (Alpha MOS, Toulouse, France) software was applied for the purposes of multivariate data analysis of the smell fingerprints. Moreover, principal component analysis (PCA) was used as an unsupervised classification method to describe the general multidimensional patterns of the e-nose data. In addition, discriminant factor analysis (DFA), a supervised classification method, was used in order to establish the possibility of group identification, based on the odor properties of the milk samples [38]. The most abundant compounds were selected based on the optimization of the DFA classification; furthermore, those compounds were identified based on the retention indices via the AroChemBase v7 database (Alpha MOS, Toulouse, France). The identification, which was based on both of the GC columns, confirmed the validity of the approach. In this study, the retention indices identified for column 1 were indexed with “-1-A”, while those identified for column 2 were indexed with “-2-A”—where A refers to the method of calculating the intensity value of the variables (i.e., the area under the peak).
2.7. Statistical Analysis
The SPSS version 26 software (IBM, Armonk, NY, USA) was used to evaluate the milk FA data. The effect of feeding on the FA profile of the milk groups was also evaluated with a one-way analysis of variance (ANOVA), followed by a post hoc test (Tukey’s) for a comparison of the various means (p-value < 0.05).
3. Results
3.1. Fatty Acid Profile of TMR
The major FAs present in all diets were linoleic acid (C18:2n6, LA), palmitic acid (C16:0), oleic acid (C18:1n9), and α-linolenic acid (C18:3n3, ALA). These accounted for up to 83.5, 84.3, 81.6, 82.3, and 80.9% of the total FAs in the CTR, EXP-1, 2, 3, and 4 diets, respectively. Furthermore, the EXP-3 and -4 diets were shown to contain high proportions of capric acid (C10:0), lauric acid (C12:0), and myristic acid (C14:0). Moreover, the EXP-3 group possessed the highest proportion of stearic acid, whereas it was lowest in the EXP-1 group. In comparison with the control, all experimental diets showed low levels of oleic acid. In contrast, the ALA proportion was high in all mixtures, resulting in a drop in their n6:n3 ratios. Lastly, the EXP-4 group possessed the lowest LA level (Table 1).
3.2. Fatty Acid Profile of Milk
The different feed combinations affected the milk’s fatty acid (FA) composition, as shown in Table 2. In contrast to the CTR and EXP-1 groups, the proportions of FAs changed the most in the EXP-3 and EXP-4 groups. In addition, the EXP-3 and -4 groups increased the level of total FA saturation in milk fat when compared to the CTR and EXP-2 groups. Further, the EXP-1 group increased the level of total FA monounsaturation when compared to EXP-3 and EXP-4. Indeed, higher amounts of medium- and long-chain saturated FAs (FAs with carbon chains between 6 and 21 carbons) were primarily responsible for the enhanced overall saturation levels observed, whereas no alteration was detected in the proportion of short-chain FAs (FAs with carbon chains of < 5). Feeding in the EXP-4 group increased the proportions of capric acid, lauric acid, and myristic acid in the milk when compared to the CTR, EXP-1, and EXP-2 groups. In addition, the EXP-3 milk showed higher levels of stearic acid (C18:0) than the EXP-1 milk. Notably, most monounsaturated FAs were more abundant in the EXP-1 group than those found in the EXP-3 and EXP-4 groups. Despite alterations in polyunsaturated fatty acids (PUFAs) between the EXP-4 and CTR diets, the overall levels of n3 and n6 were unaffected. However, the n6 to n3 FA ratios in the EXP-2 and EXP-3 milk samples were significantly lower than those found in the CTR milk. Compared to the CTR diet, the EXP-4 diet induced the most significant alterations in milk PUFAs. It also increased the levels of LA and ALA in milk but reduced the proportions of arachidonic (C20:4n6) and eicosapentaenoic (C20:5n3, EPA) acids, respectively.
3.3. E-Nose Results
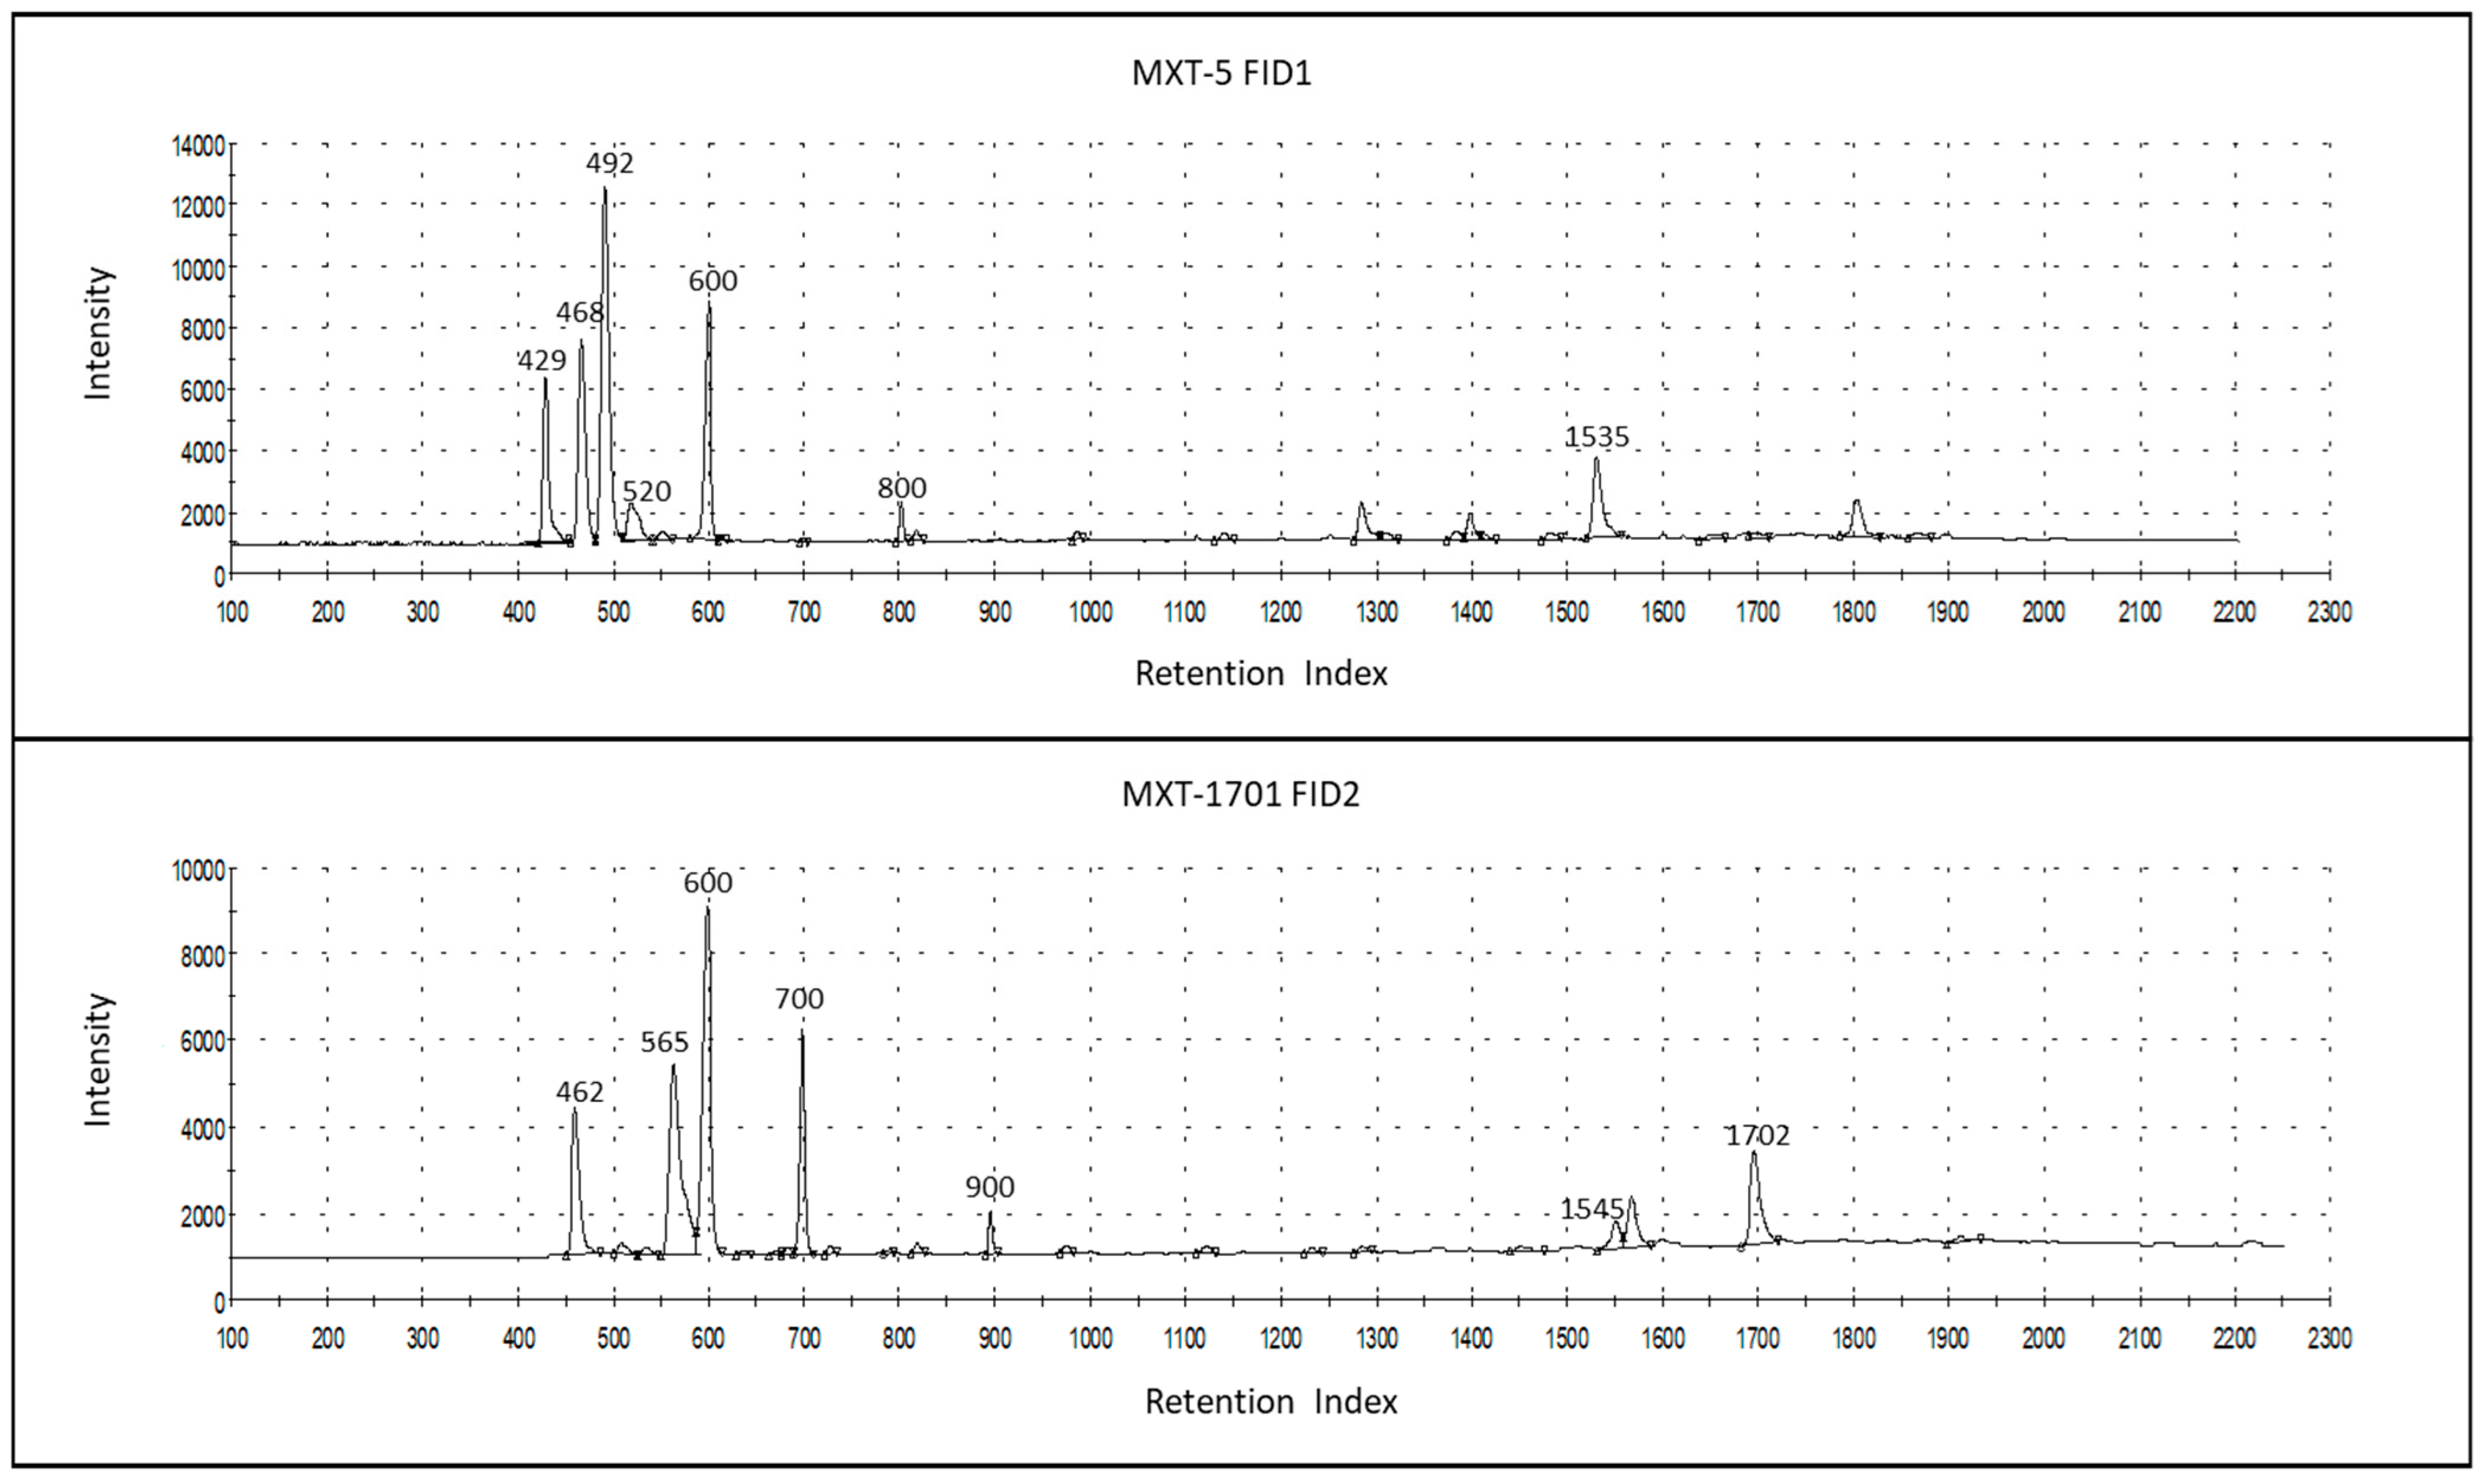
Figure 2 shows the chromatograms of a milk sample, as measured using the two GC columns of an AlphaMOS Heracles Neo (one is polar, MXT-5, and the other, MXT-1701, has medium polarity), which were used for the sensor data representing the smell fingerprint.
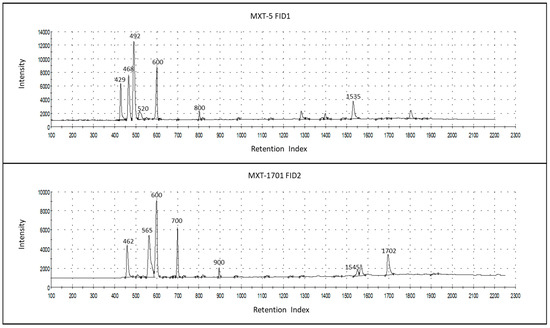
Figure 2.
Chromatograms of a milk sample, as measured in the two GC columns of AlphaMOS Heracles Neo, MXT-5 (column #1), and the MXT-1701 (column #2), thereby indicating the most prominent volatile compounds of odor importance that were identified, with retention indices (Ris), acetaldehyde (429-1, 462-2), ethanol (468-1, 565-2), 2-propanol (492-1, 600-2), 2-methyl-propanol (520-1), butan-2-one (600-1, 700-2), ethyl-butyrate (800-1, 900-2), isopentyl salicylate (1535-1, 1702-2), and indole (1545-2).
PCA was used to describe the general multidimensional patterns of the acquired e-nose sensor data. A result of 95.985% of the total variance was described for the first and second principal components (PCs). However, the scores of the samples did not form any clusters, according to the original feeding groups. The CTR milk formed one cluster, while the EXP milk samples were largely overlapping. Since the PCA failed to reveal group differences, discriminant factor analysis (DFA), a supervised classification method, was carried out. Through this analysis, we achieved group identification based on the odor properties of the milk samples obtained from dairy cows that were fed the five diets; the results are presented in Figure 3 and Figure 4.
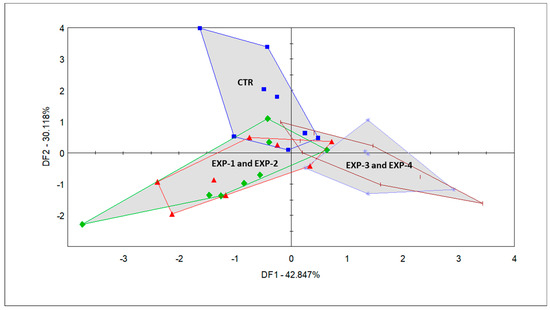
Figure 3.
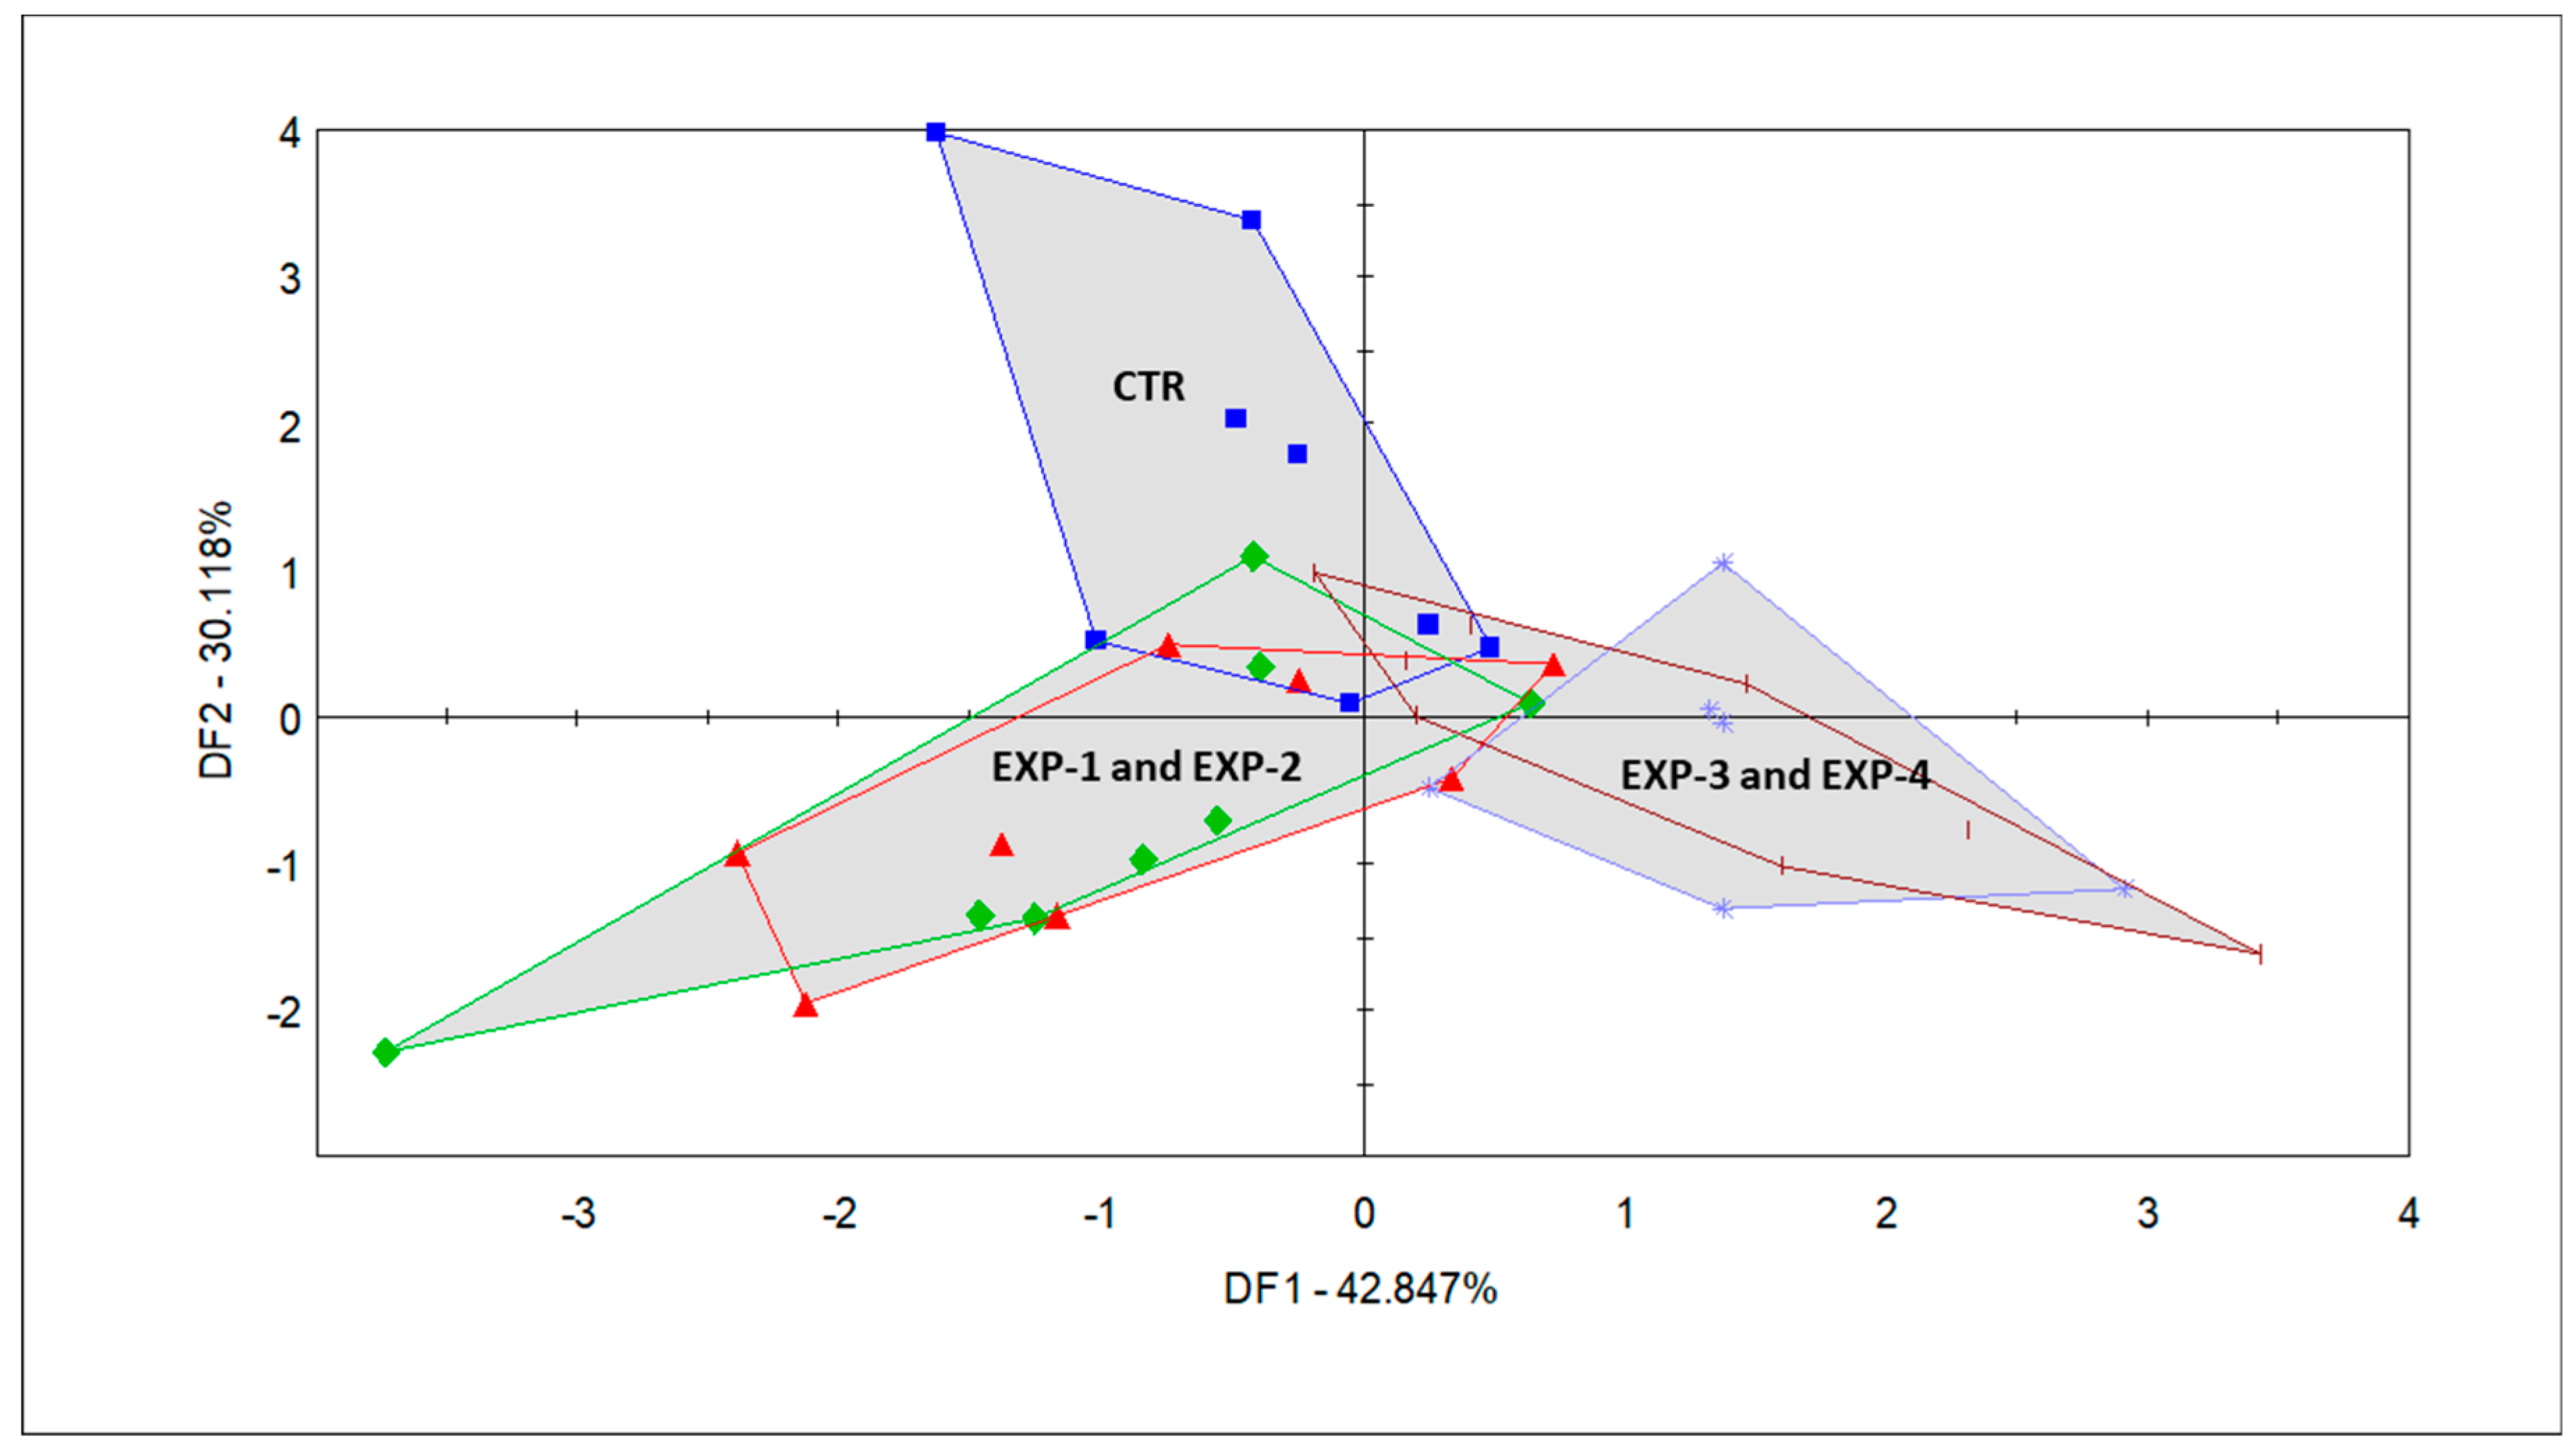
Discriminant factor analysis (DFA) score plot of the milk samples from the CTR group (blue square): corn silage + alfalfa haylage + vetch-triticale (VTH); EXP-1 (green diamond): CTR + Mix C; 55% of three types of Italian ryegrass + 45% of two cultivars of winter oat (replacing VTH); EXP-2 (red triangle): CTR + Mix D; 40% of three types of Italian ryegrass + 30% of two cultivars of winter oat + 15% of two cultivars of winter triticale + 10% of winter barley + 5% of winter wheat (replacing VTH); EXP-3 (sea blue asterisk): CTR + Mix B; 50% of two cultivars of winter triticale + 40% of winter barley + 10% of winter wheat (replacing VTH); EXP-4 (short brown vertical pipe): CTR + Mix A; 40% of two cultivars of winter triticale + 30% of two cultivars of winter oats + 20% of winter barley + 10% of winter wheat (replacing VTH).

Figure 4.
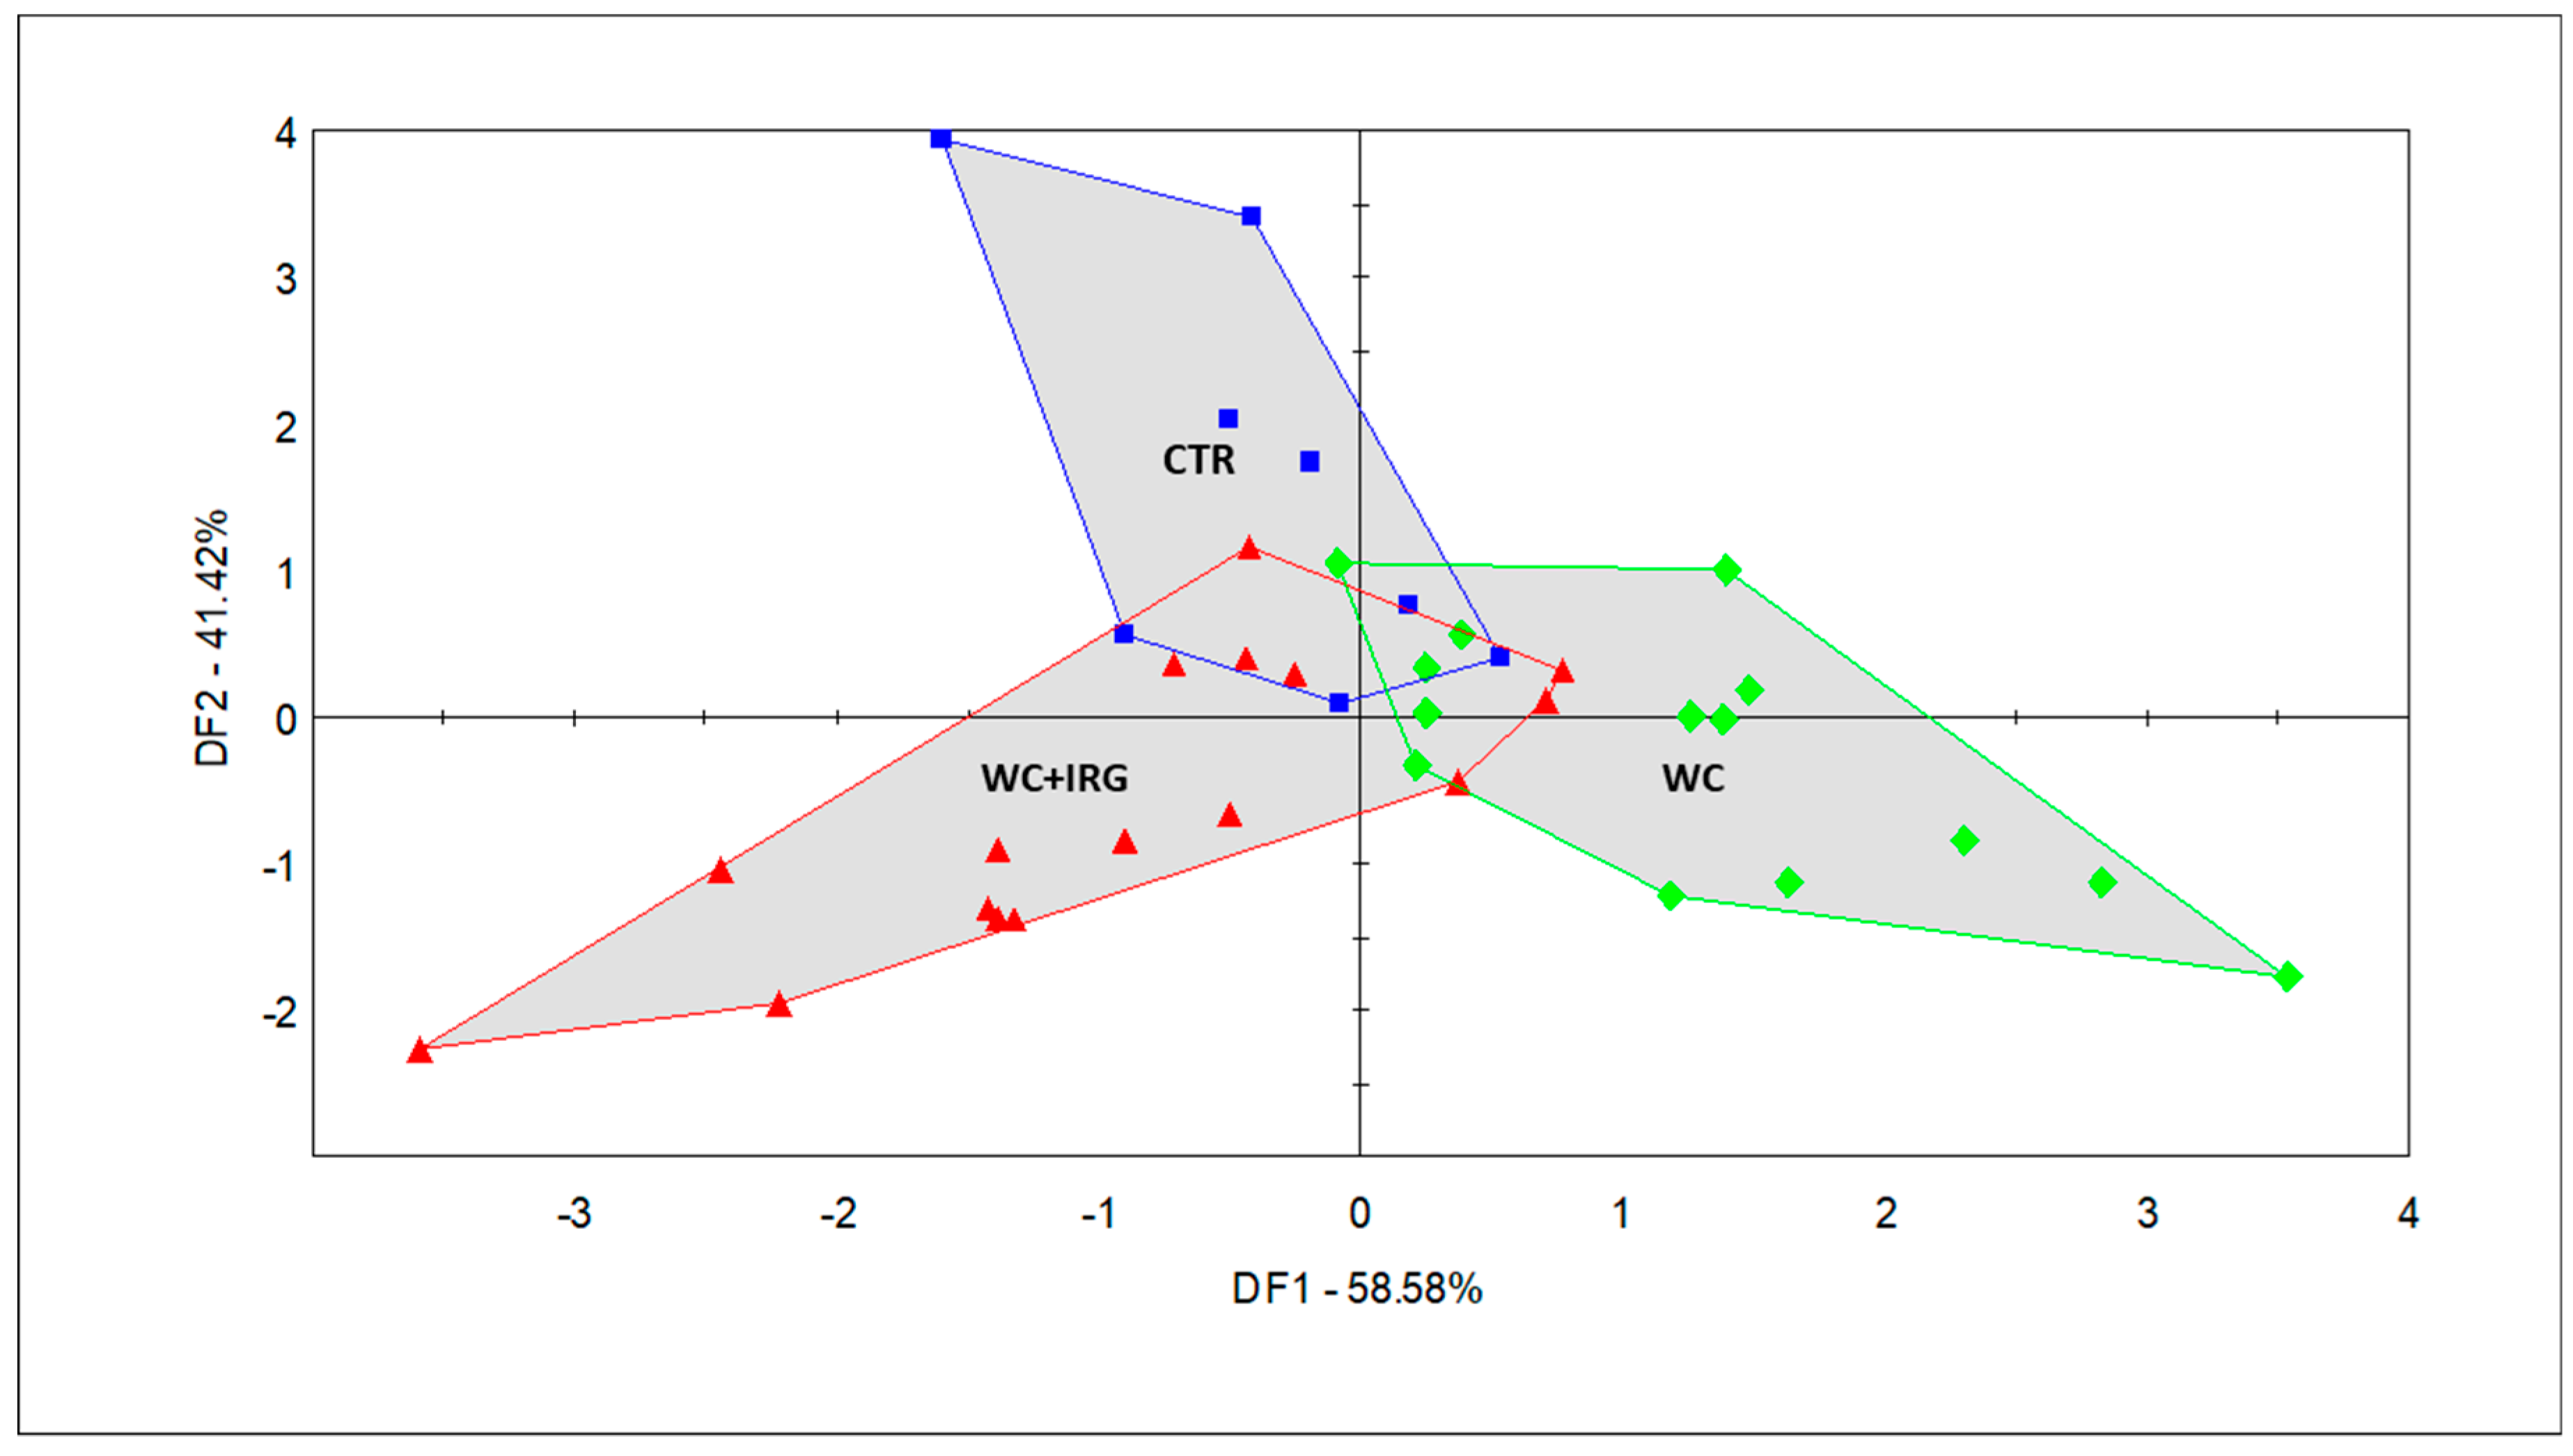
Discriminant factor analysis (DFA) score plot of the milk samples collected from cows fed with the five diets containing the different forage sources, as performed via the selected sensors (CTR (blue square): control diet; WC + IRG (red triangle): diets containing winter cereals and Italian ryegrass; WC (green diamond): diets containing winter cereals).
The DFA that was conducted with the five groups (Figure 3) shows the classification of the smell fingerprints of the milk samples, which was based on the various diet groups fed to the dairy cows. From the completion of the DFA, an overlapping of EXP-1 and EXP-2 milk samples and that of the EXP-3 and EXP-4 milk samples could be observed alongside DF 1, which explains 42.84% of the variation between the milk of these groups. The CTR group also separates from the rest (i.e., EXP-1 and EXP-2, as well as EXP-3 and EXP-4) alongside DF2, which comprises 30.118% of the variance.
The DFA (Figure 4) that was conducted with the three groups (CTR, WC, and WC + IRG) revealed the odor differences in the milk samples, which were caused by the feeds of different forage compositions. In addition, DF1 and DF2 helped to explain 58.58% and 41.42% of the total variance, respectively, with the milk of groups associated with feeding diets containing winter cereals and Italian ryegrass (WC + IRG), which make up the EXP-1 and EXP-2 groups, separating from the milk of groups associated with feeding diets containing winter cereals (WC), which make up EXP-3 and EXP-4, alongside DF1. The milk of the CTR group separates from that of the WC + IRG and WC groups, alongside DF2. This reveals that the odor variation between the milk samples of the WC + IRG and WC groups was bigger than the variation that existed between the milk samples of the CTR group and the milk samples of the experimental groups. Furthermore, the CTR and WC + IRG milk samples entirely overlap in the plane of the most dominant discriminating factor (DF1), while WC shows little overlap with the aforementioned samples. Thus, the WC milk samples were proven to possess the most different odor when compared with the other two main classes (i.e., WC + IRG and CTR).
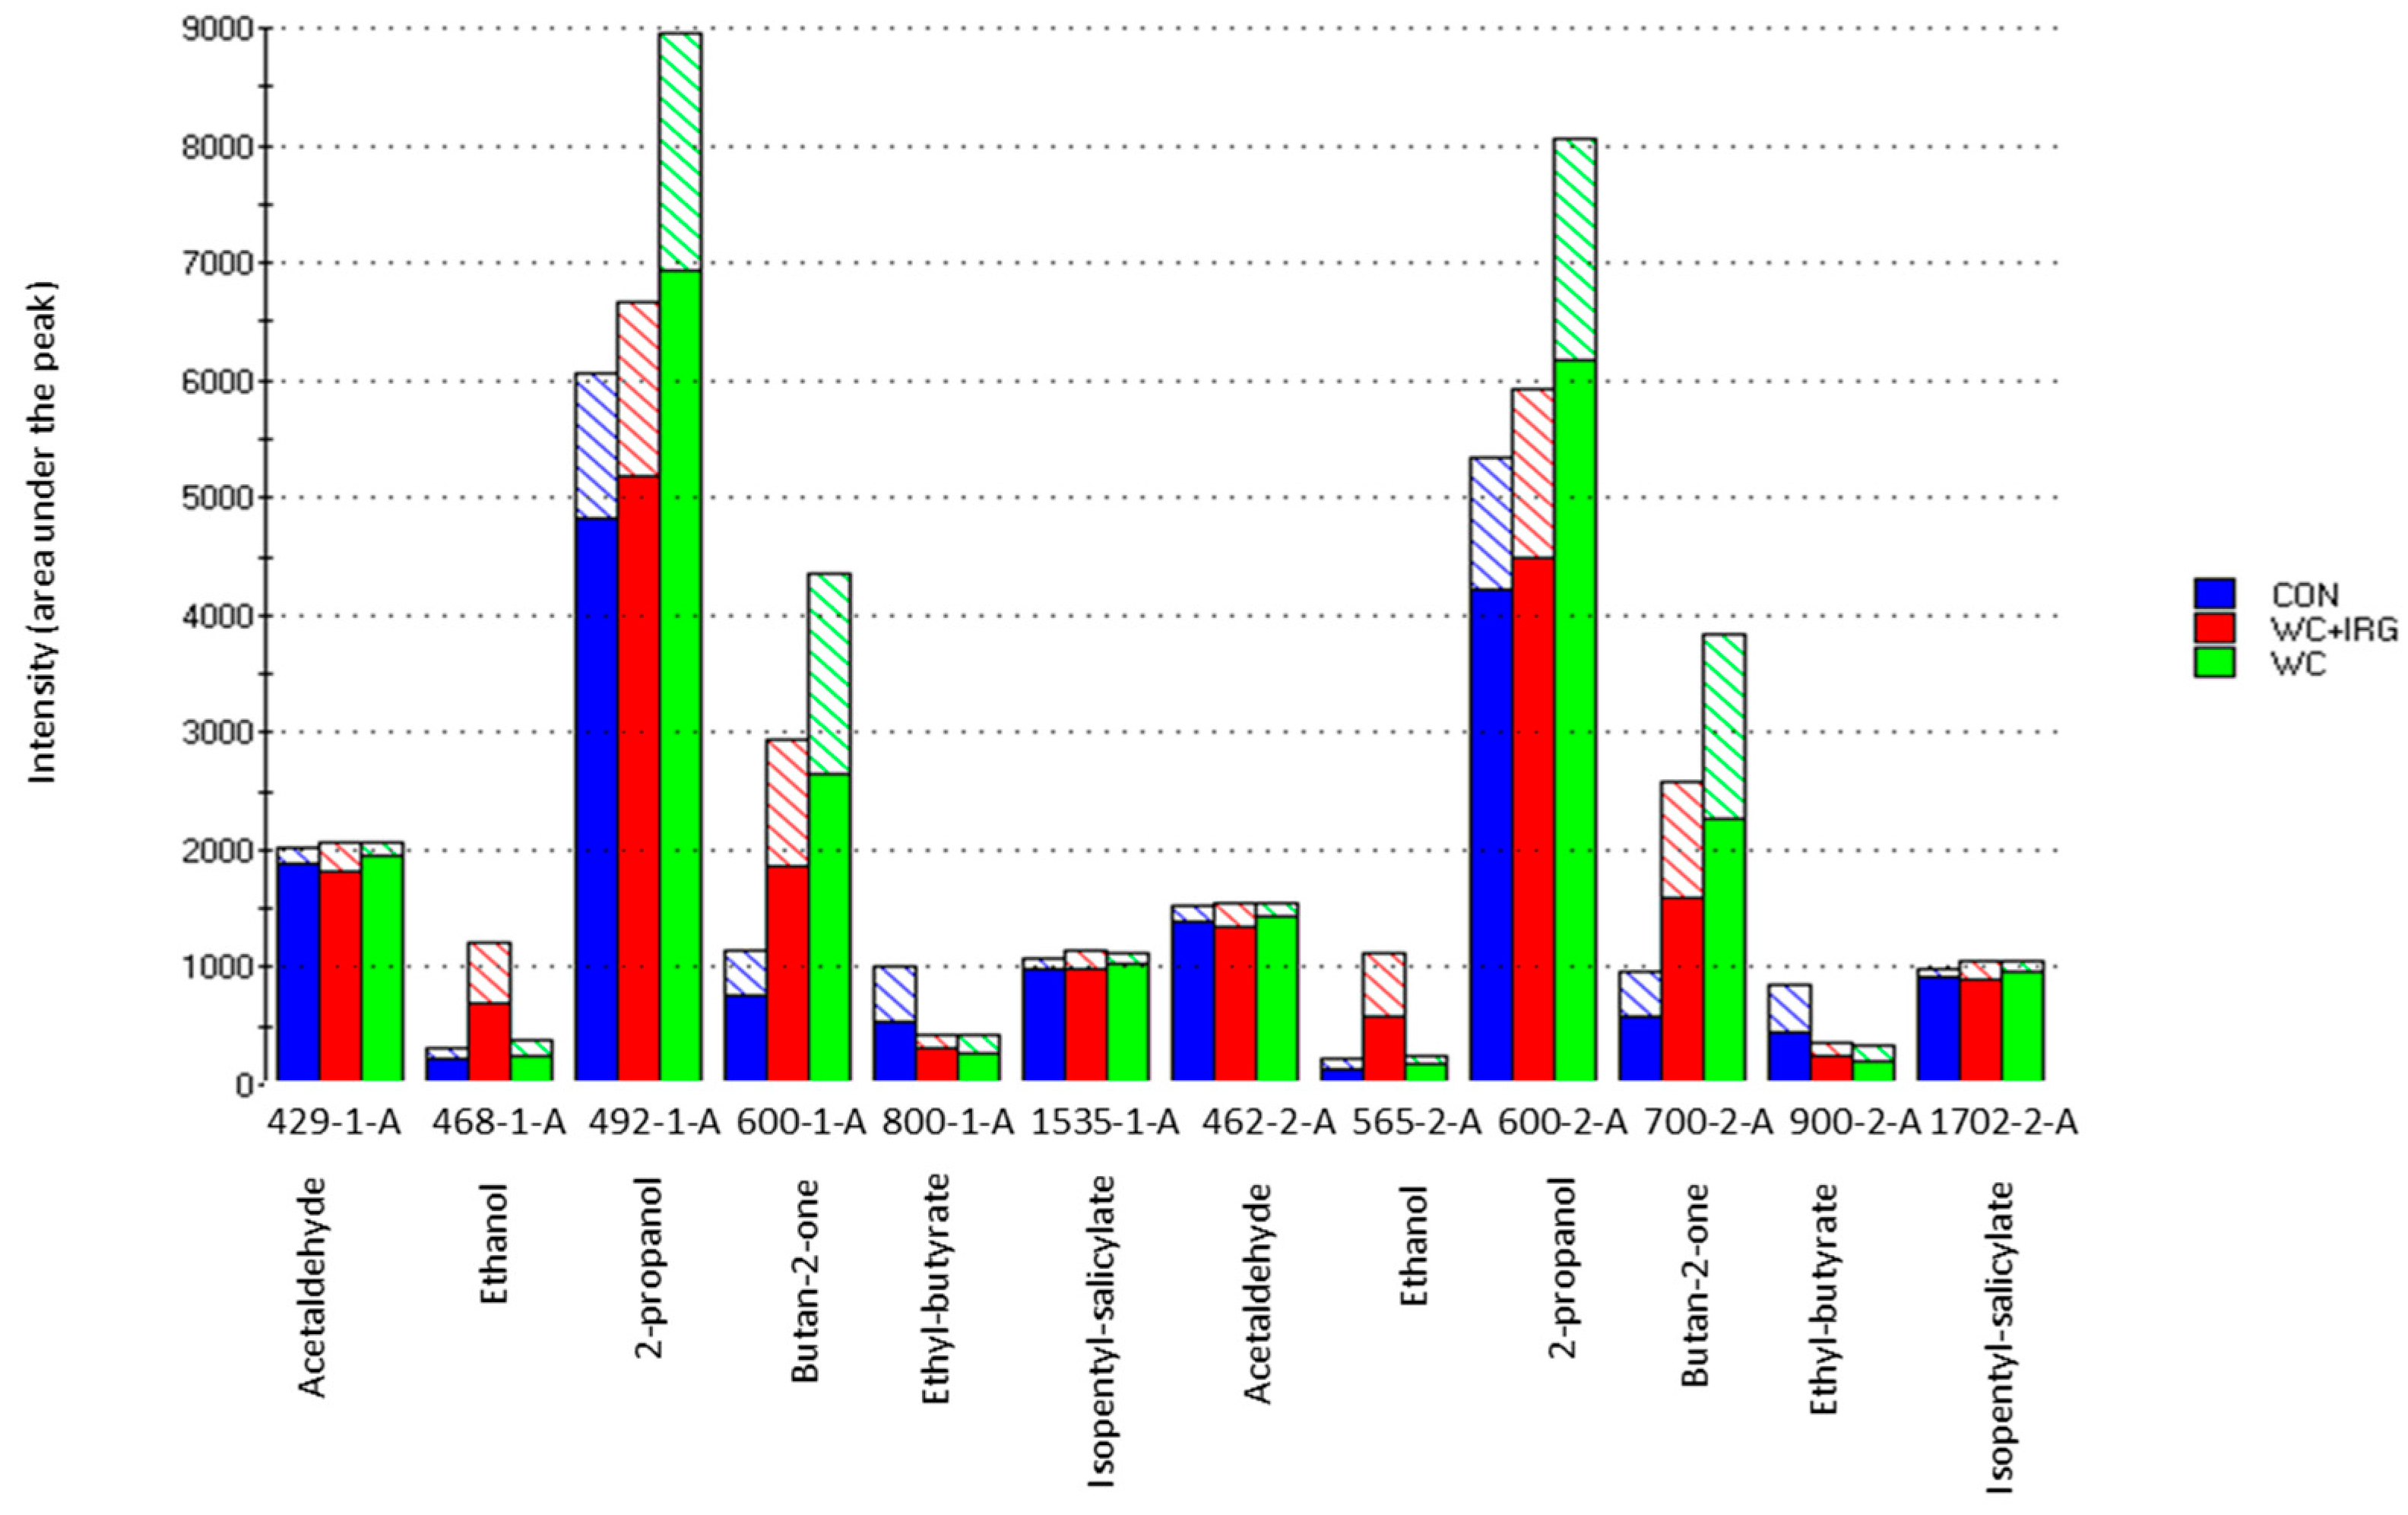
Odor-based discrimination in the context of milk from the CTR group was largely influenced by sensor 800-1-A (ethyl-butyrate), whereas the milk of the WC groups was influenced largely by sensors 492-1-A (2-propanol) and 600-2-A (butan-2-one); furthermore, the milk of the WC + IRG groups was influenced largely by sensors 468-1-A and 565-2-A (ethanol).
Figure 5, in columns 1 and 2, show the most significant odor compounds that were detected. Furthermore, as based on the RIs, acetaldehyde (429-1-A, 462-2-A), ethanol (468-1-A, 565-2-A), 2-propanol (492-1A, 600-2-A), butan-2-one (600-1-A, 700-2-A), ethyl-butyrate (800-1-A, 900-2-A), and isopentyl salicylate (1535-1-A, 1702-2-A) were identified. Figure 5 also confirms that the WC milk samples possessed the most specific odor. The reason for this is that the sensor signals (odor intensities) of 2-propanol and butan-2-one were more prominent within these samples.
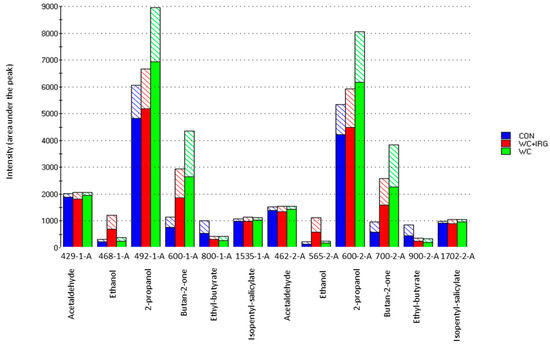
Figure 5.
Bar graph of detection intensities, as measured with the electronic nose at retention indices (RI) that corresponded to certain identified odors, which produced volatile compounds, as detailed in column 1 (“-1-A”) and 2 (“-2-A”), showing the milk samples obtained from dairy cows that were fed with the control (CTR) diet, as well as the diets containing winter cereal and Italian ryegrass (WC + IRG) or winter cereals only (WC). Solid fill areas of the graphs indicate the mean detection intensities, while the pattern fill indicate the standard deviation.
4. Discussion
4.1. Fatty Acids of Milk
Milk FAs are mainly derived from diet, adipose tissue, and de novo biosynthesis. Thus, such data must be assessed with caution due to the various factors altering the FA composition of whole milk. Lipolysis is the limiting factor behind the adipose tissue’s contribution to milk FAs, which depends on adipocyte size, lactation stage, milk production, and energy demand [39]. Once milk production and energy level were equivalent across treatments, we assumed that the lipolysis of adipose tissue contributed minimally to our substantial findings regarding milk FAs.
All the analyzed milk samples’ FA profiles were consistent with the comprehensive data obtained on bovine milk lipids [40]. Moreover, the short-chain FAs are mainly absorbed via the rumen wall with simple diffusion; thus, their concentration in the rumen greatly contributes to their levels in milk fat. In a recent study using similar silage mixtures, neither the content of short-chain FAs in the rumen nor its pH changed after 6 h of feeding mixed silage [23], thereby suggesting that there are no marked variations in short-chain FA concentrations in milk fat, which is in agreement with our findings.
When compared to the EXP-3 and EXP-4 (winter cereal mixtures) diets, the overall saturation of milk FAs increased (ca. + 2% surplus) in those cows fed on diets of Italian ryegrass mixtures (i.e., EXP-1 and EXP-2), which finding was in parallel with the high proportions of capric, lauric, myristic, and stearic acids in their respective milk samples. Moreover, the medium- and long-chain FAs are absorbed into the bloodstream through the intestinal wall. Unlike non-ruminants, ruminants possess a microbiome that bio-hydrogenates (poly) unsaturated FAs in the rumen, thus converting LA and ALA to saturated stearic acid. Furthermore, the up-regulation of de novo biosynthesis regarding saturated fatty acids (SFAs) is strongly associated with the increased consumption of starch, thus leading to an increase in the milk’s total FA saturation level [41]. We observed no substantial difference in the dry matter or starch content of various diets, whereas the LA and ALA levels were greatest in the milk from cows fed diets of winter cereal mixtures. Those findings indicate no change in the PUFA biohydrogenation process in the rumen, or in the de novo biosynthesis of SFAs. There is an association between the FA composition of feed and milk fat [42]. This is partially inconsistent with our present findings, as the total saturation level in the diets of winter cereal mixtures was not markedly different from that of the EXP-1 group. Thus, the diet’s FA content is not necessary to reflect the FA profile of the milk, which is in agreement with the finding of Colín-Navarro et al. [43]. A possible explanation regarding the high total saturation levels in the milk of the EXP-3 and EXP-4 groups may be based on their conversion rate to unsaturated carbon chains.
Italian ryegrass mixtures’ feeding led to higher FA monounsaturation levels in milk than those found when feeding the winter cereal mixtures. The lowest values in diets were found in the EXP-3 and EXP-4 groups, respectively, thereby indicating that levels of monounsaturated FAs in milk depend on their amount in the feed. Furthermore, our findings may be attributed to the de novo biosynthesis of these FAs by the liver and mammary gland, in which the alteration of stearoyl-CoA desaturase activity is hypothesized. This enzyme’s activity was not assessed; furthermore, its indicator FAs in the plasma stream or liver was not determined. However, we can indirectly rule out the high activity of desaturase enzymes, as C14:1/C14:0, C16:1/C16:0 and C18:1/C18:0 were markedly highest in the EXP-1 group when compared to the EXP-3 and EXP-4 groups.
The proportion of PUFA in milk fat is affected by feedstuff conditions (i.e., fresh, dry, haylage, and silage) and the management system (i.e., grazing or zero grazing) [44]. Under the current design, cows were fully fed on the allotted rations, with no grazing activity permitted. Notably, the EXP-4 milk comprised the highest LA and ALA proportions. The elevated ALA in milk may be attributed to its level in the feed; however, this cannot be applied to LA. PUFAs’ variation in milk may occur from the effect of forage on the rates of lipolysis and biohydrogenation in the rumen [45]. Indeed, our saturation results indirectly suggest no alteration in lipolysis or biohydrogenation activities, thus postulating an alternate route underlying these increases in LA and ALA. Furthermore, mammals lack the enzymes (delta-12 and delta-15 desaturases) that produce LA and ALA, [46]. We suspect that a probable down-regulation in the activity of delta-5 and/or delta-6 desaturases contributes to the accumulation of ALA and LA. This proposal seems feasible as C20:4(n6)/C20:3(n6) and C20:5(n3)/C18:3(n3) were low in the EXP-4 milk, for which a 30 and 72% reduction was identified, respectively, when compared to the control. We lack information on the particular nutrient that could potentially alter enzyme activities. Therefore, further investigations are essential to substantiate our hypothesis.
The most remarkable impact of the EXP-2 and EXP-3 diets was found in the substantial decline of the n6:n3 ratio, even though no grazing was permitted. Though there is no worldwide consensus on the defined-intake guidelines for the ratio between omega classes, lower values of n6:n3 (possibly, below 4) are certainly favored [47].
4.2. Odor Profiles of Milk
Generally, volatile compounds belonging to the acetaldehyde, alcohol, ketone, and ester groups form that part of the aroma or odor matrix that most influences the acceptability or rejection of dairy products by consumers [48,49]. For instance, at low levels, acetaldehyde can contribute a fruity odor to food. However, at higher levels, the odor can be very unpleasant to consumers [48]. In this current study, the intensity of acetaldehyde in all the milk samples analyzed was quite similar, but not at high enough levels that might cause an unpleasant odor [49]. In addition, ethanol was identified more often in the milk of the WC + IRG group for both columns, although only at small intensities. Herein, a study reported the possible transmission of silage flavors, including the alcohol produced during forage fermentation into bovine milk [50]. Diets that contain silage and are classified as well-fermented and having a pleasant aroma may still contain some level of ethanol, which can, in turn, impart milk odor [51]. The most abundant volatile compound measured in all the milk samples, especially in the WC group, was 2-propanol, also known as isopropyl alcohol, which is a water-soluble aliphatic alcohol with a sweet odor (this was also reported by Sympoura et al. [52]), as observed in milk obtained from dairy cows that are fed with supplemented extruded linseed and α-tocopherol [52]. Though this study did not use similar feed supplements, the utilized forage sources—especially winter cereals—contain significant levels of naturally occurring α-tocopherol [53]. Additionally, 2-butanone, butan-2-one, or methyl ethyl ketone—an organic compound with a sharp-sweet odor—were reported to be present in the milk obtained from cows fed with mycorrhizal ensiled forage [54]. In the present study, the intensity of butan-2-one was higher in the WC milk. The identified odor that was determined to be the producing compound in the CTR milk was ethyl butyrate, which is also referred to as ethyl butanoate or butyric ether and is an ester that possesses a fruity odor [55]. According to Marina et al., esters are the most important odorants in dairy food products, due to their ability to influence the general odor or aroma matrix of such products [56].
5. Conclusions
The current study revealed how the feeding of dairy cows with different experimental total mixed rations, i.e., the inclusion of Italian ryegrasses (IRG) and winter cereals (WC), affected the fatty acid and odor profiles of raw milk. The proportions of fatty acids changed, most notably in the milk samples of cows fed winter cereal diets. Replacing vetch-triticale with WC increased the total FA saturation levels in the milk, whereas WC + IRG increased the total FA monounsaturation levels. However, a decrease in the n6:n3 FA ratio was observed in the WC + IRG and WC milk samples. The use of WC and WC + IRG mixed silages in the feed ration of dairy cows enabled the production of milk with a more favorable fatty acid profile, the human-health benefits of which have been widely documented. With respect to the odor profiling of the milk groups via an e-nose, the odor variation between the milk samples from the experimental groups was larger than the variation that existed between the milk of the CTR group and that of the experimental groups. An inclusion of WC or WC + IRG silages, as was applied in this study, resulted in beneficial changes in the milk’s FA composition (the n6:n3 FA ratio was lowered). Based on the e-nose results, the inclusion of WC + IRG proved to be more beneficial than that of WC as it causes a less prominent odor alteration in milk when compared to the CTR. The e-nose is a highly useful and necessary element of supportive or complementary technology in chemical analysis to identify and quantify the organoleptic changes in dairy products that are caused by novel feed sources.
Author Contributions
H.G.Y.: conceptualization, acquisition, analysis, and interpretation of e-nose data, as well as drafting and editing the original manuscript; O.A.: curation and interpretation of GC-FID data, as well as drafting and editing the original manuscript; A.S.: curation and interpretation of GC-FID data, as well as drafting and editing the original manuscript; T.T.: conceptualization, design, acquisition, analysis, interpretation of data, drafting, editing the original manuscript, and funding acquisition; G.B.: conceptualization, design, analysis, acquisition, curation, and interpretation of data, as well as drafting and editing the original manuscript. All authors have read and agreed to the published version of the manuscript.
Funding
The work was supported by the EFOP-3.6.3-VEKOP-16-2017-00005, “support of scientific research teams’” project. The support of the Hungarian National Laboratory project, RRF-2.3.1-21-2022-00007, is also gratefully acknowledged.
Institutional Review Board Statement
The animals were treated following the European Communities Council Directives (2010/63/EU) and the Hungarian Act for the Protection of Animals in Research (Article 32 of Act XXVIII).
Data Availability Statement
The data are available from the corresponding author.
Conflicts of Interest
Authors George Bazar and Tamás Tóth were employed by the company ADEXGO Kft. The company was not involved in the study design, collection, analysis, or interpretation of data, the writing of this article, or the decision to submit it for publication. The remaining authors declare that the research was conducted in the absence of any commercial or financial relationships that could be construed as a potential conflict of interest.
References
- Sanchez-Villegas, A.; Martínez, J.A.; Prättälä, R.; Toledo, E.; Roos, G.; Martínez-González, M.A. A Systematic Review of Socioeconomic Differences in Food Habits in Europe: Consumption of Cheese and Milk. Eur. J. Clin. Nutr. 2003, 57, 917–929. [Google Scholar] [CrossRef] [PubMed]
- Zakaria, Z.; Yun, W.S.; Alias, N.; Noor, S.N.M.; Zakaria, A.J.; Mustapha, Z.; Hussin, N.; Wan Taib, W.R.; Ahmad, A.; Yusoff, N.A.M. Physicochemical Composition, Microbiological Quality and Consumers’ Acceptability of Raw and Pasteurized Locally Produced Goat Milk. Malays. J. Fundam. Appl. Sci. 2020, 16, 475–482. [Google Scholar] [CrossRef]
- Stanton, C.; Mills, S.; Ryan, A.; Di Gioia, D.; Ross, R.P. Influence of Pasture Feeding on Milk and Meat Products in Terms of Human Health and Product Quality. Ir. J. Agric. Food Res. 2021, 59, 292–302. [Google Scholar] [CrossRef]
- Olika, C.D. Review on Effect of Nutrition on Milk Composition and Yield of Dairy Cows. Eur. J. Sci. Innov. Technol. 2021, 1, 24–31. [Google Scholar]
- Martin, B.; Verdier-Metz, I.; Buchin, S.; Hurtaud, C.; Coulon, J.B. How Do the Nature of Forages and Pasture Diversity Influence the Sensory Quality of Dairy Livestock Products? Anim. Sci. 2005, 81, 205–212. [Google Scholar] [CrossRef]
- Morand-Fehr, P.; Fedele, V.; Decandia, M.; Le Frileux, Y. Influence of Farming and Feeding Systems on Composition and Quality of Goat and Sheep Milk. Small Rumin. Res. 2007, 68, 20–34. [Google Scholar] [CrossRef]
- Park, Y.; Jeanjulien, C.; Siddique, A. Factors Affecting Sensory Quality of Goat Milk Cheeses: A Review. Adv. Dairy Res. 2017, 05, 2. [Google Scholar] [CrossRef]
- Bennato, F.; Ianni, A.; Innosa, D.; Martino, C.; Grotta, L.; Pomilio, F.; Verna, M.; Martino, G. Influence of Licorice Root Feeding on Chemical-Nutritional Quality of Cow Milk and Stracciata Cheese, an Italian Traditional Fresh Dairy Product. Animals. 2019, 9, 1153. [Google Scholar] [CrossRef]
- Castellani, F.; Vitali, A.; Bernardi, N.; Marone, E.; Palazzo, F.; Grotta, L.; Martino, G. Dietary Supplementation with Dried Olive Pomace in Dairy Cows Modifies the Composition of Fatty Acids and the Aromatic Profile in Milk and Related Cheese. J. Dairy Sci. 2017, 100, 8658–8669. [Google Scholar] [CrossRef] [PubMed]
- Till, B.E.; Huntington, J.A.; Posri, W.; Early, R.; Taylor-Pickard, J.; Sinclair, L.A. Influence of Rate of Inclusion of Microalgae on the Sensory Characteristics and Fatty Acid Composition of Cheese and Performance of Dairy Cows. J. Dairy Sci. 2019, 102, 10934–10946. [Google Scholar] [CrossRef] [PubMed]
- Tóth, T.; Mwau, P.J.; Bázár, G.; Andrássy-Baka, G.; Hingyi, H.; Csavajda, É.; Varga, L. Effect of Feed Supplementation Based on Extruded Linseed Meal and Fish Oil on Composition and Sensory Properties of Raw Milk and Ultra-High Temperature Treated Milk. Int. Dairy J. 2019, 99, 104552. [Google Scholar] [CrossRef]
- Hurtaud, C.; Faucon, F.; Couvreur, S.; Peyraud, J.L. Linear Relationship between Increasing Amounts of Extruded Linseed in Dairy Cow Diet and Milk Fatty Acid Composition and Butter Properties. J. Dairy Sci. 2010, 93, 1429–1443. [Google Scholar] [CrossRef] [PubMed]
- Angeles-Hernandez, J.C.; Vieyra Alberto, R.; Kebreab, E.; Appuhamy, J.A.D.R.N.; Dougherty, H.C.; Castelan-Ortega, O.; Gonzalez-Ronquillo, M. Effect of Forage to Concentrate Ratio and Fat Supplementation on Milk Composition in Dairy Sheep: A Meta-Analysis. Livest. Sci. 2020, 238, 104069. [Google Scholar] [CrossRef]
- Renes, E.; Gómez-Cortés, P.; de la Fuente, M.A.; Fernández, D.; Tornadijo, M.E.; Fresno, J.M. Effect of Forage Type in the Ovine Diet on the Nutritional Profile of Sheep Milk Cheese Fat. J. Dairy Sci. 2020, 103, 63–71. [Google Scholar] [CrossRef] [PubMed]
- Serrapica, F.; Uzun, P.; Masucci, F.; Napolitano, F.; Braghieri, A.; Genovese, A.; Sacchi, R.; Romano, R.; Barone, C.M.A.; Di Francia, A. Hay or Silage? How the Forage Preservation Method Changes the Volatile Compounds and Sensory Properties of Caciocavallo Cheese. J. Dairy Sci. 2020, 103, 1391–1403. [Google Scholar] [CrossRef] [PubMed]
- Renes, E.; Fernández, D.; Abarquero, D.; Ladero, V.; Álvarez, M.A.; Tornadijo, M.E.; Fresno, J.M. Effect of Forage Type, Season, and Ripening Time on Selected Quality Properties of Sheep Milk Cheese. J. Dairy Sci. 2021, 104, 2539–2552. [Google Scholar] [CrossRef]
- Palmquist, D.L.; Denise Beaulieu, A.; Barbano, D.M. Feed and Animal Factors Influencing Milk Fat Composition. J. Dairy Sci. 1993, 76, 1753–1771. [Google Scholar] [CrossRef]
- Ashes, J.R.; Gulati, S.K.; Scott, T.W. Potential to Alter the Content and Composition of Milk Fat Through Nutrition. J. Dairy Sci. 1997, 80, 2204–2212. [Google Scholar] [CrossRef]
- Poveda, J.M.; Cabezas, L. Free Fatty Acid Composition of Regionally-Produced Spanish Goat Cheese and Relationship with Sensory Characteristics. Food Chem. 2006, 95, 307–311. [Google Scholar] [CrossRef]
- Le Quéré, J.-L.; Pierre, A.; Riaublanc, A.; Demaizières, D. Characterization of Aroma Compounds in the Volatile Fraction of Soft Goat Cheese during Ripening. Lait 1998, 78, 279–290. [Google Scholar] [CrossRef]
- Bernardes, T.F.; Daniel, J.L.P.; Adesogan, A.T.; McAllister, T.A.; Drouin, P.; Nussio, L.G.; Huhtanen, P.; Tremblay, G.F.; Bélanger, G.; Cai, Y. Silage Review: Unique Challenges of Silages Made in Hot and Cold Regions. J. Dairy Sci. 2018, 101, 4001–4019. [Google Scholar] [CrossRef] [PubMed]
- Worku, A.; Tóth, T.; Orosz, S.; Fébel, H.; Kacsala, L.; Húth, B.; Hoffmann, R.; Yakubu, H.G.; Bazar, G.; Tóthi, R. Aroma Profile, Microbial and Chemical Quality of Ensiled Green Forages Mixtures of Winter Cereals and Italian Ryegrass. Agriculture 2021, 11, 512. [Google Scholar] [CrossRef]
- Worku, A.; Tóthi, R.; Orosz, S.; Fébel, H.; Kacsala, L.; Húth, B.; Hoffmann, R.; Tóth, T. In Situ Ruminal Degradability and Fermentation Characteristics of Novel Mixtures of Winter Cereal and Italian Ryegrass plus Winter Cereal Silages. Czech J. Anim. Sci. 2021, 66, 302–314. [Google Scholar] [CrossRef]
- Worku, A.; Tóthi, R.; Orosz, S.; Fébel, H.; Kacsala, L.; Vermeire, D.; Tóth, T. Novel Mixtures of Italian Ryegrass and Winter Cereals: Influence of Ensiling on Nutritional Composition, Fermentation Characteristics, Microbial Counts and Ruminal Degradability. Ital. J. Anim. Sci. 2021, 20, 749–761. [Google Scholar] [CrossRef]
- Clark, S.; Costello, M.C.; Drake, M.D.; Bodyfelt, F. The Sensory Evaluation of Dairy Products, 2nd ed.; Springer Science and Business Media: New York, NY, USA, 2009. [Google Scholar] [CrossRef]
- Andrewes, P.; Bullock, S.; Turnbull, R.; Coolbear, T. Chemical Instrumental Analysis versus Human Evaluation to Measure Sensory Properties of Dairy Products: What Is Fit for Purpose? Int. Dairy J. 2021, 121, 105098. [Google Scholar] [CrossRef]
- Bliss, P.J.; Schulz, T.J.; Senger, T.; Kaye, R.B. Odour Measurement—Factors Affecting Olfactometry Panel Performance. Water Sci. Technol. 1996, 34, 549–556. [Google Scholar] [CrossRef]
- Yakubu, H.G.; Kovacs, Z.; Toth, T.; Bazar, G. Trends in Artificial Aroma Sensing by Means of Electronic Nose Technologies to Advance Dairy Production—A Review. Crit. Rev. Food Sci. Nutr. 2021, 63, 234–248. [Google Scholar] [CrossRef]
- Di Natale, C.; Macagnano, A.; D’amico, A.; Paolesse, R. Artificial Olfaction Systems: Principles and Applications to Food Analysis. Biotechnol. Agron. Soc. Environ. 2001, 5, 159–165. [Google Scholar]
- Malekkhahi, M.; Tahmasbi, A.M.; Naserian, A.A.; Danesh-Mesgaran, M.; Kleen, J.L.; AlZahal, O.; Ghaffari, M.H. Effects of Supplementation of Active Dried Yeast and Malate during Sub-Acute Ruminal Acidosis on Rumen Fermentation, Microbial Population, Selected Blood Metabolites, and Milk Production in Dairy Cows. Anim. Feed Sci. Technol. 2016, 213, 29–43. [Google Scholar] [CrossRef]
- Association of Official Analytical Chemists. Official Methods of Analysis, 18th ed.; AOAC International: Washington, DC, USA, 2006. [Google Scholar]
- Van Soest, P.J.; Robertson, J.B.; Lewis, B.A. Methods for Dietary Fiber, Neutral Detergent Fiber, and Non-Starch Polysaccharides in Relation to Animal Nutrition. J. Dairy Sci. 1991, 74, 3583–3597. [Google Scholar] [CrossRef]
- Folch, J.; Lees, M.; Sloane-Stanley, G.H. A Simple Method for the Isolation and Purification of Total Lipides from Animal Tissues. J. Biol. Chem. 1957, 226, 497–509. [Google Scholar] [CrossRef] [PubMed]
- Christie, W.W. A Simple Procedure for Rapid Transmethylation of Glycerolipids and Cholesteryl Esters. J. Lipid Res. 1982, 23, 1072–1075. [Google Scholar] [CrossRef] [PubMed]
- Christie, W.W. Lipid Analysis: Isolation, Separation, Identification and Structural Analysis of Lipids, 3rd ed.; Oily Press: Bridgwater, UK, 2003. [Google Scholar]
- Burian, C.; Brezmes, J.; Vinaixa, M.; Cañellas, N.; Llobet, E.; Vilanova, X.; Correig, X. MS-Electronic Nose Performance Improvement Using the Retention Time Dimension and Two-Way and Three-Way Data Processing Methods. Sens. Actuators B Chem. 2010, 143, 759–768. [Google Scholar] [CrossRef]
- Guardino, X.; Albaigés, J.; Firpo, G.; Rodríguez-Vinãls, R.; Gassiot, M. Accuracy in the Determination of the Kováts Retention Index. Mathematical Dead Time. J. Chromatogr. A 1976, 118, 13–22. [Google Scholar] [CrossRef]
- Næs, T.; Isaksson, T.; Fearn, T.; Davies, T. A User Friendly Guide to Multivariate Calibration and Classification; NIR Publications: Chichester, UK, 2002. [Google Scholar]
- Contreras, G.A.; Strieder-Barboza, C.; Raphael, W. Adipose Tissue Lipolysis and Remodeling during the Transition Period of Dairy Cows. J. Anim. Sci. Biotechnol. 2017, 8, 1–12. [Google Scholar] [CrossRef] [PubMed]
- Jensen, R.G. The Composition of Bovine Milk Lipids: January 1995 to December 2000. J. Dairy Sci. 2002, 85, 295–350. [Google Scholar] [CrossRef]
- Walker, G.P.; Dunshea, F.R.; Doyle, P.T. Effects of Nutrition and Management on the Production and Composition of Milk Fat and Protein: A Review. Aust. J. Agric. Res. 2004, 55, 1009–1028. [Google Scholar] [CrossRef]
- Morales-Almaráz, E.; De La Roza-Delgado, B.; González, A.; Soldado, A.; Rodríguez, M.L.; Peláez, M.; Vicente, F. Effect of Feeding System on Unsaturated Fatty Acid Level in Milk of Dairy Cows. Renew. Agric. Food Syst. 2011, 26, 224–229. [Google Scholar] [CrossRef]
- Colín-navarro, V.; López-gonzález, F.; Morales-almaráz, E.; González-alcántara, F.D.J.; Estrada-flores, J.G.; Arriaga-jordán, M.C. Fatty Acid Profile in Milk of Cows Fed Triticale Silage in Small-Scale Dairy Systems in the Highlands of Central Mexico. J. Appl. Anim. Res. 2021, 49, 75–82. [Google Scholar] [CrossRef]
- Kalač, P.; Samková, E. The Effects of Feeding Various Forages on Fatty Acid Composition of Bovine Milk Fat: A Review. Czech J. Anim. Sci. 2010, 55, 521–537. [Google Scholar] [CrossRef]
- Dewhurst, R.J.; Shingfield, K.J.; Lee, M.R.F.; Scollan, N.D. Increasing the Concentrations of Beneficial Polyunsaturated Fatty Acids in Milk Produced by Dairy Cows in High-Forage Systems. Anim. Feed Sci. Technol. 2006, 131, 168–206. [Google Scholar] [CrossRef]
- Lee, J.M.; Lee, H.; Kang, S.B.; Park, W.J. Fatty Acid Desaturases, Polyunsaturated Fatty Acid Regulation, and Biotechnological Advances. Nutrients 2016, 8, 23. [Google Scholar] [CrossRef] [PubMed]
- Simopoulos, A.P. The Importance of the Ratio of Omega-6/Omega-3 Essential Fatty Acids. Biomed. Pharmacother. 2002, 56, 365–379. [Google Scholar] [CrossRef] [PubMed]
- Giberti, A.; Carotta, M.C.; Fabbri, B.; Gherardi, S.; Guidi, V.; Malagù, C. High-Sensitivity Detection of Acetaldehyde. Sens. Actuators B Chem. 2012, 174, 402–405. [Google Scholar] [CrossRef]
- Van Aardt, M.; Duncan, S.E.; Bourne, D.; Marcy, J.E.; Long, T.E.; Hackney, C.R.; Heisey, C. Flavor Threshold for Acetaldehyde in Milk, Chocolate Milk, and Spring Water Using Solid Phase Microextraction Gas Chromatography for Quantification. J. Agric. Food Chem. 2001, 49, 1377–1381. [Google Scholar] [CrossRef] [PubMed]
- Shipe, W.F.; Ledford, R.A.; Peterson, R.D.; Scanlan, R.A.; Geerken, H.F.; Dougherty, R.W.; Morgan, M.E. Physiological Mechanisms Involved in Transmitting Flavors and Odors to Milk. II. Transmission of Some Flavor Components of Silage. J. Dairy Sci. 1962, 45, 477–480. [Google Scholar] [CrossRef]
- Randby, A.T.; Selmer-Olsen, I.; Baevre, L. Effect of Ethanol in Feed on Milk Flavor and Chemical Composition. J. Dairy Sci. 1999, 82, 420–428. [Google Scholar] [CrossRef] [PubMed]
- Sympoura, F.; Cornu, A.; Tournayre, P.; Massouras, T.; Berdagué, J.L.; Martin, B. Odor Compounds in Cheese Made from the Milk of Cows Supplemented with Extruded Linseed and α-Tocopherol. J. Dairy Sci. 2009, 92, 3040–3048. [Google Scholar] [CrossRef]
- Lachman, J.; Hejtmánková, A.; Orsák, M.; Popov, M.; Martinek, P. Tocotrienols and Tocopherols in Colored-Grain Wheat, Tritordeum and Barley. Food Chem. 2018, 240, 725–735. [Google Scholar] [CrossRef] [PubMed]
- Genovese, A.; Marrazzo, A.; De Luca, L.; Romano, R.; Manzo, N.; Masucci, F.; Di Francia, A.; Sacchi, R. Volatile Organic Compound and Fatty Acid Profile of Milk from Cows and Buffaloes Fed Mycorrhizal or Nonmycorrhizal Ensiled Forage. Molecules 2019, 24, 1616. [Google Scholar] [CrossRef]
- Nagata, Y. Measurement of Odor Threshold by Triangle Odor Bag Method. Meas. Rev. 2003, 118, 118–127. [Google Scholar]
- Marina, R.; Paola, D.; Mondello, L. Hand Book of Dairy Food Analysis, 2nd ed.; Toldrá, F., Nollet, L.M.L., Eds.; CRC Press: Boca Raton, FL, USA, 2021. [Google Scholar] [CrossRef]
Disclaimer/Publisher’s Note: The statements, opinions and data contained in all publications are solely those of the individual author(s) and contributor(s) and not of MDPI and/or the editor(s). MDPI and/or the editor(s) disclaim responsibility for any injury to people or property resulting from any ideas, methods, instructions or products referred to in the content. |
© 2023 by the authors. Licensee MDPI, Basel, Switzerland. This article is an open access article distributed under the terms and conditions of the Creative Commons Attribution (CC BY) license (https://creativecommons.org/licenses/by/4.0/).