Article

Growth of Hydroponic Sweet Basil (O. basilicum L.) Using Plasma-Activated Nutrient Solution (PANS)

1
Department of Food Science, School of Environmental and Biological Sciences, Rutgers University, New Brunswick, NJ 08901, USA
2
Department of Food, Bioprocessing and Nutrition Sciences, College of Agriculture and Life Sciences, North Carolina State University, Raleigh, NC 27606, USA
3
College of Agriculture and Food Science, Florida A&M University, Tallahassee, FL 32307, USA
4
Rutgers EcoComplex, Clean Energy Innovation Center, Rutgers University, New Brunswick, NJ 08901, USA
5
Department of Plant Biology, School of Environmental and Biological Sciences, Rutgers University, New Brunswick, NJ 08901, USA
*
Authors to whom correspondence should be addressed.
These authors contributed equally to this work.
Agriculture 2023, 13(2), 443; https://doi.org/10.3390/agriculture13020443
Submission received: 6 December 2022 / Revised: 29 January 2023 / Accepted: 8 February 2023 / Published: 14 February 2023
(This article belongs to the Topic Plasma in Agriculture)

Abstract

:
Hydroponic sweet basil (O. basilicum L.) farming uses a recirculating nutrient solution that may spread waterborne microbial contamination including algae. Plasma, the fourth state of matter, generates antimicrobial reactive oxygen and nitrogen species when exposed to water. The objective of this work was to study the effect of plasma-treated water-based nutrient solution on plant growth and in reduction of algae. Basil plants were grown in isolated ebb and flow hydroponic systems (under monitored environmental conditions) using nutrient solution (NS) and plasma-activated nutrient solution (PANS) with two separate treatments: the same irrigation solutions were used in the growth cycle (Treatment 1: NST1 and PANST1 once at the beginning growth cycle) and new irrigation solutions at every week of the growth cycle (Treatment 2: NST2 and PANST2). The plant growth parameters (height, fresh and dry weight, number of branches and nodes, root length, leaf index), quality parameters (color, texture, aroma, and tissue nutrients concentration), and algae concentrations were measured. Compared to NST1, plants grown on PANST1 were significantly taller (up to 12%), had a higher fresh mass (up to 29%) and dry mass (up to 45%), and had a higher greenness value (up to 28%). Algae growth was significantly reduced in the PANST2 reservoir (up to 24%) compared to the NST2 reservoir. It was confirmed that Treatment 1 significantly improved the yield, morphology, and quality of sweet basil plants, while Treatment 2 was best suited to decreasing algae concentration in the hydroponic environment. This preliminary study indicated that PANS could improve the quality and growth of sweet basil in hydroponic farming while controlling the algae growth in the growing environment.

1. Introduction

The global value of hydroponic crops was estimated at USD 9.5 billion in 2020 [1]. Sweet basil (O. basilicum L.) is one of the most widely cultivated hydroponic herbs in the world, and it is considered a high-value product due to its taste and aroma [2]. Soil-less basil cultivation faces challenges to control contamination from root-infecting and other microorganisms, such as algae, because these microorganisms can readily spread via the irrigation of recirculated nutrient solution throughout the humid and warm plant growth environment, then attach to a favorable environment for exponential microbial growth. In closed hydroponic systems, it is difficult to provide proper nutrition to growing plants [3] because as the plants grow, they absorb more and more nutrients, and uncontrolled algae competes for these nutrients.
Plasma is the fourth state of matter. The present study focused on exploring the application of cold atmospheric pressure plasma (CAPP) treatment in the farming of hydroponic sweet basil. CAPP is a type of plasma discharge that consists of partially ionized gas, at atmospheric pressure, and at or near room temperature. CAPP treatment of liquids leads to the diffusion of reactive oxygen and nitrogen species (RONS) into the liquid (e.g., as singlet oxygen, ozone, nitrite, and atomic nitrogen), thus changing its chemistry. RONS then further react to form antimicrobial secondary species in the bulk liquid such as peroxynitrite, nitric oxide, nitrates, and nitrite ions [4].
There is evidence in the literature that plasma treatment accelerates plant growth [4,5,6,7,8]. The researchers suggested that RONS generated by plasma seem to be a contributing factor [4,9] possibly due to additional nitrogen available for plant growth or moderate excitation of the plant stress metabolism. However, the mechanisms by which plasma treatment improves plant growth, increases nutritional performance, or reduces algae growth are still an active area of research. The majority of plasma agriculture literature has looked at direct treatment of seeds, or early growth of plant seedlings using plasma-activated water (PAW), also known as plasma-treated water (PTW). Few studies [4,9] have documented the effect of PAW treatment at later stages of vegetative growth, and even fewer [10] looked at improving hydroponic plant growth to meet the increasing global demand for fresh vegetables, or the food quality of the products obtained from plasma-treated crops. The use of plasma has also been reported to be beneficial in controlling microbial load (e.g., algae) in hydroponic systems [9,10,11], possibly due to some RONS being known antimicrobial compounds such as nitrite.
Plasma algae inactivation studies have not reported the efficacy of plasma to control algae growth throughout the plant growth cycle, or the effect of plasma on plant growth and plant quality at levels that control algae. For plant growth studies, mostly PAW has been studied despite most hydroponic crops being conventionally farmed using nutrient solution (NS), a water-based solution containing the inorganic compounds necessary for plant growth. PAW alone cannot provide sufficient nutrients for plant growth; research must also look into using plasma-activated nutrient solution (PANS). Therefore, the novelty of the present study is that it investigated plasma treatment in a more realistic and scaled-up experiment, where seedlings were farmed using standard hydroponic practices and challenges, then the final products were assessed under food science standards of quality. The aim of the present study was to compare hydroponic sweet basil plants grown using PANS treatments with NS-grown plants in terms of yield, morphology, and food quality during the growth cycle. Additional goals were to compare the physicochemical parameters of irrigation solutions, algae proliferation, and resource consumption (water and energy usage) between PANS and NS hydroponic systems.

2. Materials and Methods

2.1. Hydroponic Setup and Growing Conditions

Commercial Rutgers Devotion DMR sweet basil seeds were kindly provided by Van Drunen Farms®, Momence, IL, USA. Three seeds per Rockwool block (0.03 × 0.03 m) were grown in a controlled environment growth chamber (25 °C, 75% relative humidity, 100 µmol/m2s photosynthetic photon flux (PPF)) for 14 days, then transferred to the experimental chambers. The seeds were irrigated with half-strength NS after sprouting.
Propagated basil seedlings (14 days old) were grown inside two identical enclosed chambers (1.2 × 0.6 × 1.7 m, Secret Jardin Dark Street 120 v3.0, BE) for 21 days (Walters and Curry, 2015). Fourteen Rockwool blocks (planting density: 21 plants/m2) were placed inside a flood tray (0.6 × 1.1 m, Active Aqua, Hydrofarm LLC, Petaluma, CA, USA) inside each chamber: one control chamber irrigated by NS, and one experimental chamber irrigated by PANS (Figure 1). Irrigation was scheduled every 3 h, for 8 min at a time, from liquid reservoirs (Chem-Tainer Industries, Compton, CA, USA) to flood trays using water pumps (EcoPlus® Eco633, Hawthorne Gardening Company, Vancouver, WA, USA). Fluorescent white light panels (Sun Blaze T5, 6500 K light temperature, Sunlight Supply, Vancouver, WA, USA) provided light intensity near the optimum level of 224 µmol/m2s of PPF [12] for a 16 h photoperiod [2]. To avoid light intensity variations through the growth cycle, lights were raised as plants grew, and plants were rotated weekly within the flood tray. The chambers did not have controlled environmental conditions; however, environmental conditions were recorded throughout the growth cycle. Each chamber contained one CO2 sensor (K33 ELG, Sensirion AG, CH), one relative humidity sensor (Sensirion SHT31, Sensirion AG, CH), and two thermocouples (type-K) that measured temperature of air at the plant level and of the liquid reservoir connected to a HOBO 4-channel data logger (Onset Computer Corporation, Bourne, MA, USA). Exhaust fans (VIVOSUN, Ontario, CA, USA) allowed for air recirculation and cooling. The CO2 concentration ranged from 550 to 650 ppm, the relative humidity ranged from 20 to 40%, and the air temperature inside the chamber ranged from 23 to 26 °C. The pH was controlled at 5.8 during the growth cycle by adding a few drops of 10% liquid phosphoric acid (Fisher Scientific International Inc., Waltham, MA, USA) when the pH rose higher than 6.0.

2.2. Experimental Design and Treatments

To assess the effect of PANS on basil growth and quality, as well as on the algae proliferation in the system, two treatment variations of PANS were conducted (Figure 2). In the first variation (Treatment 1), the nutrient solution (NST1) and plasma-activated nutrient solution (PANST1) were prepared on day 1, and these same solutions were used to irrigate the plants throughout a 21 days growth period. For the second variation (Treatment 2), the irrigation solutions were discarded at the end of each week, and fresh solutions of nutrient solution (NST2) and plasma-activated nutrient solution (PANST2) were prepared (following the same recipe as Treatment 1) at the start of every week to irrigate the basil plants for that week. For both treatment variations, plant growing protocols were kept the same as described in the following sections. Unless otherwise noted, growth, quality, and algae concentration assessments were performed after harvest on day 21.
The experiment started on 8 October 2019. The period for the first batch of Treatment 1 (NST1 and PANST1) was from 8 October 2019 to 29 November 2019, and for the second batch it was from 7 November 2019 to 28 November 2019. The period for the first batch of Treatment 2 (NST2 and PANST2) was from 4 December 2019 to 25 December 2019; for the second batch it was from 8 January 2020 to 29 January 2020, and for the third batch it was from 5 February 2020 to 26 February 2020.

2.3. Preparation of Irrigation Solutions

The control solution was a standard nutrient solution (NS) for sweet basil hydroponic farming. NS was prepared by mixing filtered tap water with an aqueous calcium nitrate solution (YaraLiva® Calcinit™ 15.5-0-0, Yara North America, Tampa, FL, USA) and aqueous nutrient blend (Jack’s Nutrients 5 N-12 P2O5-26 K2O, JR Peters Inc., Allentown, PA, USA) in the proportion of 98:1:1 (water: calcium nitrate: nutrient blend) to a total volume of 50 L. Half-strength NS solution was prepared for seedling propagation by diluting NS with water (1:1 proportion). The pH of NS and half-strength NS was adjusted to 5.8 by adding a few drops of 10% phosphoric acid solution. EC was not controlled. Starting EC was 1.7 mS/cm.
PANS was prepared by treating 50 L of NS with a non-thermal atmospheric pressure gliding arc plasma discharge (Plasmatron, WTPSV1, AA Plasma, Philadelphia, PA, USA) until its pH dropped from 6.8 to 3.5 ± 0.2 (approximately 2 h). The plasma equipment has been described in a previous publication [13]. The feed gas was compressed air at a flowrate of 30 SCFH (14.2 SLPM), and the NS flowrate was 1 GPH (3.7 L/h). The pH of PANS was raised to 5.8 using a few drops of 10% potassium hydroxide solution (Fisher Scientific International Inc., Waltham, MA, USA) before irrigation. The nutrient concentration of NS and PANS is presented in Table 1.

2.4. Measurement of Physicochemical Parameters

Every day the pH of NS and PANS was measured using an Orion Star A111 pH benchtop meter equipped with a 9157BNMD Triode probe (Thermo Fisher International Inc., Waltham, MA, USA). At the start of each week of the growth cycle, the electrical conductivity (EC) was measured using a handheld meter (HEALTH METRIC, PA, USA), and the oxidation-reduction potential (ORP) was measured using an Orion Star A111 pH benchtop meter with a 9678BNWP probe (Thermo Fisher International Inc., Waltham, MA, USA).
The most common reactive species formed in a gliding arc plasma are superoxide anions, nitrates, and nitrites [14]. Hence, the concentration of nitrate–nitrogen and nitrite–nitrogen in NS (NST1 and NST2) and PANS (PANST1 and PANST2) were quantified at the beginning of the growth cycle using colorimetric assays [15,16,17]: the 1.00614 nitrate test (range 102 to 996 ppm), and 1.00609 nitrite test (range 3.3 to 295.2 ppm) (Spectroquant, EMD Millipore, Billerica, MA, USA). The absorbance was read on a spectrophotometer (Epoch, BioTek Instruments Inc., Winooski, VT, USA) and used to calculate the concentration of nitrate and nitrite from linear equations, which were obtained from Beer’s law and standard curves of sodium nitrate (Fisher Scientific International Inc., Waltham, MA, USA) or sodium nitrite (Fisher Scientific International Inc., Waltham, MA, USA). The nitrate concentration values were multiplied by a factor of 0.22 to obtain nitrogen concentration from nitrates, and the nitrite concentration was converted to nitrogen from nitrites by multiplying by a factor of 0.3.
The North Carolina Department of Agriculture (NCDA) analyzed freshly prepared NS (NST1 and NST2) and PANS (PANST1 and PANST2) following the methods of Plank [18] to determine the concentrations of inorganic nutrients necessary for plant growth: nitrogen (N), phosphorus (P), potassium (K), calcium (Ca), magnesium (Mg), sulfur (S), iron (Fe), copper (Cu), manganese (Mn), boron (B), and zinc (Zn). The nutrient concentrations were determined based on spectrophotometry methods (Berthelot reaction for ammonia–nitrogen, hydrazine reduction for total nitrogen and nitrite–nitrogen, and thiocyanate reaction for chloride) with a segmented flow analyzer, and inductively coupled plasma (ICP) emission spectroscopy. The recommended standard concentrations were provided by the NCDA. The differences in nutrient concentration of NS and PANS were analyzed and compared with the standard.

2.5. Measurement of Algae Proliferation

Algae proliferation was assessed based on the algae concentration present weekly in the reservoirs of NS (NST1 and NST2) and PANS (PANST1 and PANST2). Algae cell counts of liquid samples from all reservoirs were enumerated using a Sedgwick cell (Hausser Scientific, Horsham, PA, USA), under a standard laboratory microscope with a 10× objective. The counts were used to calculate algae concentration through Equation (1) [19]:
(total algae cells)/(mL of solution) = average number of algae cells in each square × 1000

2.6. Measurement of Basil Plant Growth Parameters

A ruler (least count 1 mm) was used to measure the height of 14 plants every 3 days from top of the rockwool block to the highest part of the plant. The fresh weight of basil plants cut above the top of three randomly selected rockwool blocks (each rockwool block contained 3 individual basil plants) was measured on day 21 [2]. The plants were then placed inside a vacuum oven (ADP-31, Yamato Scientific America, Santa Clara, CA, USA) and were dried at 40 °C overnight to obtain their dry weights and calculate moisture content. For all 14 plants, the number of branches and nodes per plant were counted manually, and the root length was measured using a ruler. Ten leaves harvested randomly from the 2nd and 3rd nodes from the top of the plants were used for measurement [20] of the maximum length L (mm) and the maximum width W (mm) for each leaf using a ruler.

2.7. Measurement of Basil Quality Parameters

For color analysis, ten randomly selected basil leaves from the 2nd and 3rd nodes from the top plant were selected from control (NST1 and NST2) and plasma treatments (PANST1 and PANST2) chambers. A colorimeter (CR-410, Konica Minolta Sensing Americas Inc., Ramsey, NJ, USA) was used to obtain L* (lightness), a* (greenness), and b* (yellowness) values for the leaves.
For the texture analysis of basil, ten leaves randomly harvested from the 2nd and 3rd plant nodes from the top plant were selected from control (NST1 and NST2) and plasma treatments (PANST1 and PANST2) chambers. The leaf thickness (t) was measured with a vernier caliper (least count 0.1 mm) on the side of the leaf (to the right of the midrib on the adaxial side), 1 cm away from the blade and the midrib of the leaf. A puncture test (force vs. distance) was performed at the same location as the thickness measurement on a single leaf using a texture analyzer (CT-3, Brookfield, MA, USA) to obtain the peak force required to puncture a leaf. The leaf was clamped in between two disks (radius = 10 mm) (Figure 3). A 2 mm diameter needle probe with a flat end was used and the test speed was 1 mm/s. The leaf toughness was calculated from the area under the force vs distance curve [21], and leaf elasticity was calculated based on Young’s modulus (E) using Equation (2) [22]:
ω = 3 × ((1 − ν))/4 × (po c2)/(E t2) × (a2 − ¾ c2 − c2 ln(a/c))
where ω is the maximum deflection at the center (mm), ν is the Poisson’s ratio for a leaf (ν = 0.25 according to Saito et al. 2006), po is the pressure (N/mm2) applied by the probe, c is the probe radius (mm), a is the leaf clamped radius (10 mm), E is the Young’s modulus (N/mm2), and t is the leaf thickness (mm).
The aroma analysis of dried basil leaves was assessed based on the differences in the relative abundance of aroma compounds, adapting the protocol of Deschamps et al. [23]. Five hundred milligrams of dried basil leaves was mixed with 5 mL tert-butyl methyl ether (Sigma-Aldrich, St. Louis, MO, USA), then kept under cool conditions for 24 h, mixed with 50 mg of sodium sulfate (Sigma-Aldrich, St. Louis, MO, USA), and centrifuged for 2 min at high speed. The supernatant was analyzed using a Gas Chromatography-2010 Plus high-end gas chromatograph (Shimadzu scientific Instruments, Columbia, MD, USA) equipped with an AOC-6000 autosampler, and a Rxi-5Sil MS column (Restek Corporation, Bellefonte, PA, USA) held at 35 °C for 4 min. Individual compounds were identified by matching Kovats index values to the literature and by comparison of mass spectra with a mass spectra library [24].
A single and randomly selected plant grown and harvested from the NS group or the PANS group was analyzed for nutrient concentrations in the basil leaves by the NCDA following the methods given by Plank [18], as seen in the previous section on nutrient concentration analysis of NS and PANS. The nutrient concentrations were determined using spectrophotometry methods with a segmented flow analyzer, and ICP emission spectroscopy. Quantification of the nutrients accumulated in the leaf after harvest of plants grown in control (NST1 and NST2) and PANS (PANST1 and PANST2) provided a diagnostic of the overall plant health and the effect of plasma treatment on nutrient absorption.

2.8. Measurement of Resources Consumption in NS and PANS Hydroponic Systems

The energy (kWh) consumed by the growth lights panel, plasma equipment, irrigation pump, and exhaust fan were measured using a wattmeter (101, FLUKE, Everett, WA, USA) for one hour to estimate the energy usage of the system. The results were used to calculate the approximate energy consumed by the system during growth of NS-irrigated and PANS-irrigated plants in 21 days, accounting for the pump usage of irrigation cycles (8 cycles/day), lights usage during the photoperiod (16 h/day), plasma running time (2.1 h/treatment), and continuous usage of the fan (24 h/day).
The water usage or the amount of water consumed by the system was calculated by subtracting the amount of solution left in the reservoirs at the end of 21 days from the initial amount. Knowing the moisture content of basil plants, the amount of water absorbed by basil plants was subtracted from the water consumed to calculate the amount of water lost due to evaporation. The water used (%) by each hydroponic chamber (all basil plants during their growth in 21 days) was calculated as:
water used (%) = (fresh mass of all plants × moisture fraction)/(mass of initial amount of solution prepared) × 100
where the initial amount of solution prepared of NS (NST1 NST2) and PANS (PANST1 and PANST2) was 50 L each (50,000 g, assuming density of water as 1 kg/L).

2.9. Statistics

Data behavior was validated using a normal distribution and goodness of fit test (p value < 0.05) to indicate the nature of the data collected (parametric or non-parametric). Statistical analyses were conducted at the 0.05 level of significance (p value < 0.05) in JMP software (SAS Inc., Cary, NC, USA) using the all-pairs Tukey’s honestly significant difference (HSD) test for parametric data, and the all-pairs Steel–Dwass test for non-parametric data.

3. Results and Discussion

3.1. Characterization of NS and PANS by pH, EC, Concentration of Reactive Species, and ORP

Although the initial adjusted pH values of fresh NS (NST1 and NST2) and PANS (PANST1 and PANST2) were 5.8, they increased to just above 6.0 every 3 to 4 days during the plant growth period (Figure 4a,d) before being brought back down using a few drops of 10% phosphoric acid solution. This behavior was expected since plants release hydroxyl ions from their roots as they absorb nutrients [3].
A significant increase in EC after plasma treatment was observed due to the generation of reactive nitrogen species such as nitrates and nitrites. As observed in Figure 4, EC increased steadily for Treatment 1, while sudden drops were reported weekly for Treatment 2. EC increased during the plant growth period due to two events: evaporation of water from the flood tray as the solutions were recirculated every 3 h, and plants absorbing moisture as part of their metabolism during growth (Figure 4b,e). The EC level of Treatment 1 (NST1 and PANST1) was higher than that of Treatment 2 (NST2 and PANST2) at the end of the growth period because in Treatment 1 the solutions were prepared on day 1 and used for the next 21 days. This is also the reason for the sudden drop in EC of NST2 and PANST2 on day 9 and on day 15, which were the days on which fresh solutions were provided to the control and plasma growth chambers. Hence, EC management by hydroponic farmers will need to account both for the changes in EC due to plant growth, and the changes in EC from plasma treatment.
As seen in Figure 3c, the oxidation-reduction potential (ORP) value of PANST1 was significantly higher than that of NST1 on day 1 and day 8 (Treatment 1). For Treatment 2, the ORP values of fresh PANST2 were significantly higher than those of NST2 at the start of weeks 1, 2, and 3 (Figure 4f). There was no significant difference between the ORP values of NS (NST1 and NST2) and PANS (PANST1 and PANST2) by the end of week 2 and week 3, even though fresh PANST2 was used at the start of each week. A higher ORP value may correlate with a higher capacity to cause oxidative stress on algae cells and slow down their growth in hydroponic solutions [5]. The results showed that the oxidizing power of PANST1 and PANST2 tended to decrease as time progressed, which might be due to the transient characteristic of the reactive nitrogen species [15].
As seen from Table 2, the concentrations of nitrate–nitrogen and nitrite–nitrogen increased when NS was treated with plasma. Originally, NS (NST1 or NST2) contained (151.9 ± 3.3) ppm of nitrate–nitrogen and (9.6 ± 1.6) ppm of nitrite–nitrogen. The nitrate–nitrogen concentrations on day 1 for PANST1 and PANST2 were (191.9 ± 3.1) ppm and (189.8 ±1.7) ppm, respectively. Additionally, the nitrite–nitrogen concentrations on day 1 for PANST1 and PANST2 were (18.8 ± 1.9) ppm and (18.5 ± 0.9) ppm, respectively. As was reported in the literature, plasma treatment of the solution leads to an increase in reactive nitrogen species (RNS) such as nitrates and nitrites [8,9] by 25–26% and 93–108%, respectively. Although different plasma generation equipment (corona [25], dielectric barrier discharge [26,27], gliding arc [9], plasma jet [8,28]) and feed gas (air [9,26,27,28,29], Helium [8]) have been used in the plasma agriculture literature and in the current study, it is generally recognized that RNS are most commonly present. The concentrations of RNS, however, vary depending on the system. In the present study, lower concentrations of RNS were generated compared to those reported in the literature [9], possibly due to the volume of liquid treated by plasma. Therefore, sufficient evidence is reported that the reactive species generated from plasma treatment are a key predictor of plant growth enhancement for hydroponic farmers. However, there is a need to identify universal dose regimes of RNS and general plasma operating conditions for application of PANS in farming.

3.2. Nutrient Concentration Analysis of NS and PANS

It was observed that up until day 21, PANST1 had a higher concentration of total inorganic nitrogen and nitrate–nitrogen than NST1, while all other nutrients were in a similar range. Another trend was observed for NST2 and PANST2, where the fresh PANST2 had higher total inorganic nitrogen (up to 20 ppm) and nitrate–nitrogen (up to 20 ppm) in comparison to fresh NST2 on days 1, 8, and 15. It was also observed that nutrient concentrations were higher on day 21 of all macro- and micronutrients (Tables S1–S4, supplementary data files) compared to day 1 for NST1 and PANST1, possibly due to evaporation of water at the flood tray level and subsequent increase in the concentration of these nutrients in the leftover NST1 and PANST1 [3]. Therefore, plasma treatment only changed the concentration of nitrogen, and it did not change the concentration of any other nutrients necessary for plant growth.

3.3. Algae Proliferation

At the end of three weeks, the algae concentration of control reservoirs (NST1 and NST2) was significantly higher than in both plasma reservoirs (PANST1 and PANST2), as shown in Figure 5. Pictures of the reservoirs at the end of the growth cycle are available in the supplementary material files (Figure S1). In the case of Treatment 1, algae increased at the end of each week, suggesting that the effectiveness of the plasma RNS decreased over time, but it still maintained lower algae levels than control. By the end of week 3, PANST1 had had significantly fewer algae (up to 22%) than NST1, and PANST2 had significantly fewer algae (up to 24%) than NST2. This result was expected since RNS are metastable and degrade over time [15].
The final concentration of algae in PANST2 was almost half that of PANST1 at harvest. This is an interesting result because repeated replacement of fresh PANS (PANST2) did not achieve the same plant growth as in a single plasma treatment (PANST1). However, PANST2 might have led to a higher exposure of short-lived and long-lived RNS at the cell wall before degradation of these reactive species, resulting in cell damage, hence slowing the growth rate of algae, and causing a smaller concentration of algae at harvest. PANST1 consistently had significantly lower algae concentration than the controls (NST1 or NST2), which suggested that even a single plasma generation was more beneficial in reducing the proliferation of algae within the system than repeatedly replacing untreated nutrient solution. Kim et al. [5] verified through electron microscopy the mechanism of algae disinfection: plasma treatment caused deformation on the cell surface, followed by breakage and shrinkage. Plasma treatment may have potential to replace traditional disinfection methods such as UV, membrane filtration, and heat treatment, which have low oxidation capabilities under organic loads or require additional cleaning maintenance [25]. We hypothesize that the dose of reactive nitrogen species used in this study (Table 2) was low enough that it still achieved algae inactivation while avoiding plant damage, but further studies in reactive nitrogen species dosage should be conducted to understand what other concentrations might be harmful for plant health.

3.4. Comparison of Basil Plant Growth Parameters

The average height of basil plants recorded over the harvest period of 21 days is shown in Figure 6, which shows the heights of plants grown using control NS (NST1 and NST2) and PANS (PANST1 and PANST2). A significant difference in plant height was observed after day 15 of growth between control (NST1 and NST2) and plasma treatments (PANST1 and PANST2). On days 15, 18, and 21, both sets of plants grown in PANST1 and PANST2 were significantly taller than the control plants.
These results agree with those in previous literature [9,11], which attributed taller plants to additional nitrates provided by the plasma treatment. In the case of Treatment 1 and Treatment 2, the nitrate–nitrogen concentration of fresh PANS (PANST1 and PANST2) was approximately 40 ppm (Table 2) higher immediately after plasma generation compared to that of control NS (NST1 and NST2). In terms of nitrite–nitrogen concentration, an increase of approximately 9 ppm (Table 2) was observed for PANS generated for Treatment 1 and Treatment 2 (PANST1 and PANST2) immediately after plasma generation compared to that of control NS (NST1 and NST2).
Beyond providing additional nitrogen, studies in plasma agriculture have theorized that reactive species may act as signaling molecules within plant cells; therefore, reactive species from plasma may intervene in existing cell metabolism pathways, leading to enhanced plant growth [9,15,26]. For instance, Brar et al. [9] observed an increase in nitrate reductase present in PAW-irrigated A. thaliana plants, and they pointed out that this enzyme was activated as an auto-defense mechanism when the plant was experiencing stress. In addition, Lee et al. [26] observed a significant increase in the expression of ascorbate, asparagine, and gamma-aminobutyric acid (GABA) in PAW-irrigated soybean sprouts. The researchers attributed this increase to the presence of NOx in the irrigation liquid, which might have been perceived as an environmental stress or oxidative stress by the plant. Hence, the antioxidant defense system of plants may be affected by the interaction with the reactive species present in plasma-treated liquids, such as PAW or PANS, and promote plant growth.
A fascinating result was observed by day 21 during Treatment 2. Although fresh PANST2 was provided on day 1, day 8, and day 15, the plants grown in PANST1 were significantly taller than those grown using PANST2. The reasons for this are not clear since the mechanism of generation of the reactive species in plasma liquids and their role in plant growth are active areas of research. The available literature describes conflicting results. Sivachandiran and Khacef [27] reported 60% increase in plant height in tomatoes (Solanum lycopersicum) and sweet pepper (Capsicum annuum) seeds if they were irrigated initially with PAW followed by irrigation with water. In contrast, Lindsay et al. [28] did not observe a significant increase in plant height when radishes (Raphanus sativus), tomatoes, and marigolds (Tagetes) were irrigated with fresh PAW each time irrigation was required. Furthermore, Takano et al. [29] observed an increase in plant height in Chinese cabbage (Brassica rapa var. perviridis) when plants were grown on by PANS (plasma-treated repeatedly) without adding new solution. The conflicting results in the literature may be due to difference in experimental methods, including chemical composition of plasma-treated liquids due to different methods of generation and processing conditions. Additionally, environmental conditions were recorded and reported in this study, but environmental conditions could not be controlled throughout the growth cycle.
As seen in Table 3, basil plants grown using PANST1 had significantly higher fresh and dry weight as compared to control NS (NST1 and NST2). PANST2-irrigated plants were significantly heavier in terms of fresh and dry weight compared to NST2-irrigated plants. The greatest significant increase in fresh and dry weight was observed in PANST1-irrigated plants compared to NST1-irrigated plants. It was also seen that plants irrigated with PANST1 were heavier than those irrigated with PANST2, which was unexpected as PANST2 provided new RNS each week while PANST1 only provided new RNS at the beginning of the growth cycle. In general, results agree with those reported by Lindsay et al. [28] and Lee et al. [26], who observed an increase in the dry weight of tomatoes, radishes, and soybean (Glycine max) sprouts when plants were irrigated with the plasma-treated solutions.
There was no significant difference in the moisture content between plants grown using NS (NST1 and NST2) or PANS (PANST1 and PANST2), which agreed with the results of Brar et al. [9], thus indicating that the weight increase was not due to water absorption. However, the improvement in fresh and dry weights for PANST1 could be due to higher concentrations of nutrients during PANST1 treatment as a result of water evaporation and nutrient accumulation over 21 days of the growth cycle, while PANST2 had relatively lower concentrations of nutrients because the fresh solution was added at the end of every week. Nevertheless, plants grown using NST1 did not result in higher dry and fresh weight than those grown using PANST2 despite experiencing evaporation and nutrient accumulation like PANST1, which suggested that another mechanism might be at play: the addition of reactive nitrogen species present in plasma (e.g., nitrite–nitrogen, peroxynitrite, etc.) might have still promoted weight increase, and the effect was not dependent only on the additional nitrogen.
An additional explanation could be that the higher concentration of RNS in PANST1 by the end of the growth period (data not included) led to more stimulation of plant cell redox, hence improved photosynthesis and production of plant biomass [9,30,31,32]. Ranieri et al. [30] hypothesized that the reactive nitrogen species nitrates and nitrites trigger changes in plant hormones such as ABA catabolism and GA biosynthesis, as well as the possible excitation of the enzymes nitrate reductase and nitrite reductase. However, the exact mechanism by which plasma enhances plant growth is still an active area of investigation.
Plant roots grown using PANST1 and PANST2 had significantly shorter roots than either of the control NS plants (Table 3), which might have resulted from the increased levels of nitrogen in the plasma-treated solutions. This result is contradictory to Brar et al. [9] and Park et al. [11], who observed an increase in root length when irrigating plants with PAW. However, the reduction in root length agrees with previous research on hydroponic sweet basil, where higher concentration of nitrogen in nutrient solution led to shorter roots while achieving bigger plant shoot and leaves [33]. Thus, it was concluded that a reduction in root length was expected and not harmful to basil health.
There was no significant difference in the number of nodes, the number of branches, the leaf maximum length, and leaf maximum width between control (NST1 and NST2) and PANS (PANST1 and PANST2) (Table 3). Therefore, the plant growth results suggested that a single plasma treatment (PANST1) might be more beneficial in terms of plant growth in comparison to repeated exposure to short-lived and long-lived reactive nitrogen species (PANST2), although the reasons for this are not clear and need further research.

3.5. Color of Basil Leaves

As seen in Figure 7, there was no significant difference of L* (lightness) value between control (NST1 or NST2) when compared to PANS (PANST1 or PANST2) leaves. The a* values (positive values indicate red and negative values indicate green) for both PANST1 and PANST2 were significantly lower than those of NST1 and NST2, 12% lower for PANST1, and 28% lower for PANST2, implying that plasma treatment led to greener leaves. The b* values (positive values indicate yellow and negative values indicate blue) of both the plasma treatments were significantly lower than those of their controls (NST1 and NST2), implying that they were less yellow. Hydroponic plants are vulnerable to environmental stress, and reflect their distress through the color of their leaves, such as yellowing (i.e., chlorosis) or blackening (i.e., necrosis) [34]. Thus, the color results did not suggest phytotoxicity due to PANS irrigation. Instead, the reactive nitrogen species from plasma treatment led to improvements in the appearance of the plants, in agreement with visual observations made by Lindsay et al. [28].
It was hypothesized that plasma treatment might have further enhanced the growth conditions of basil by improving the production of chlorophyll, the chemical responsible for the green color in leaves. An increase in chlorophyll could indicate improvements in photosynthesis and higher production of carbohydrates, thus resulting in the significant increases in dry weight already reported in the basil plants irrigated with PANST1 and PANST2 (Table 3).

3.6. Texture of Basil Leaves

There were no significant differences in the peak puncture force, leaf toughness, and leaf elasticity of the basil leaves between the control group (NST1 and NST2) and PANS group (PANST1 and PANST2) (Table 4). Puncture force and leaf elasticity were used as indirect sensory indicators for texture to investigate the possible mastication experience of the consumer. Additionally, Gutiérrez-Rodríguez et al. [21] demonstrated that leaf texture can help diagnose plant stress, since leaf texture changes as the plant is irrigated with nitrogen levels outside of its optimum concentration for plant growth. The results suggest that plasma treatments do not affect the desirable consumer texture of basil or lead to plant stress.

3.7. Aroma Analysis of Basil Leaves

The aroma analysis of NS- and PANS-treated leaves was performed to evaluate the relative abundance of basil leaf aroma compounds (Table 5). From the profile of the essential oils (Table 5), the relative peak areas for eucalyptol and eugenol in basil leaves grown using Treatment 1 (NST1 and PANST1) and Treatment 2 (NST2 and PANST2) were not significantly different. Although PANST1 resulted in significantly higher levels of methyl eugenol compared to control NST2, the levels were not significantly different to those of NST1 or PANST2. Therefore, no clear trend was established in the case of methyl eugenol. In contrast, it can be seen that basil leaves grown using PANST1 had significantly higher linalool compared to control, while there was no significant difference between NST2 and PANST2 during Treatment 2. Linalool is responsible for imparting a sweet floral and sweet fruity note to the basil aroma [35,36].
The results suggest that a single plasma treatment further stimulates the development of the essential oil profile in basil, compared to multiple plasma treatments. The significantly higher levels of methyl eugenol and linalool present in basil leaves grown using PANS could be due to a higher concentration of nitrate–nitrogen from RNS, as seen in Table 2, compared to the basil plants grown using control (NS). Alteration of essential oil yield and composition by environmental factors, including biotic or abiotic triggers, in basil is well recognized as these secondary metabolites are stress induced and influenced by growing conditions [23,37,38,39,40]. However, the mechanism by which plasma treatment affects the expression of essential oil profiles in basil is unknown at the present. The data indicate that the basil leaves grown using PANS had an altered aroma profile, which needs to be further confirmed by a sensory evaluation study. A limitation of this study is that vacuum-dried basil leaves of control NS and PANST1 were analyzed a month later than PANST2 samples due to unavailability of equipment. These samples were stored away from light, and inside a non-porous container to prevent the release of the essential oils.

3.8. Quantification of Nutrient Concentration in Basil Leaves

Basil leaf tissue nutrient analysis (Table 6) showed that the levels of macronutrients and micronutrients were adequate for plant growth in Treatment 1 (NST1 and PANST1) and Treatment 2 (NST2 and PANST2). The nutrient concentrations in basil leaves from the controls (NST1 or NST2) were not significantly different from those in the basil leaves from PANS (PANST1 or PANST2). Levels of Cu, B, and Fe [41], as well as Ca [42], and P and Mg [43] were similar to those previously reported in the literature of hydroponic basil growth. Although the levels of K were higher than those in the literature, possibly due to pH adjustment after plasma treatment by the addition of potassium hydroxide solution, and despite all basil plants being lower in Zn compared to the literature [41], the plants were diagnosed by the NCDA to be healthy based on their internal documentation (Table 6) in the range of concentrations of macronutrients and micronutrients for basil [44]. Hence, it is suggested that plasma treatment did not affect basil nutrition.
Contrary to Takano et al. [29], a significant increase in N content in leaves of plants grown with PANS was not observed. However, Takano et al. did not report significant increase in plant weight while in the present study there was a significant increase in fresh and dry weights. Thus, it is hypothesized that additional nitrogen from plasma treatment may have been used up by the plant cells during photosynthesis instead of accumulated in the leaves, leading to the difference in results compared to Takano et al.

3.9. Evaluation of Resources Consumption in NS and PANS Hydroponic Systems

The measured energy usage by each component of the system to grow basil in enclosed hydroponic chambers for a growth period of 21 days is presented in Table 7. For Treatment 1 (PANST1), the total energy used by the system in the growth period was estimated to be 74.9 kWh, while for Treatment 2 (PANST2) the total energy used by the system was estimated to be 76.9 kWh. The total energy consumed for growing basil plants in the control NS chamber was 73.9 kWh. The greatest consumption of energy (≈96%) came from the lights, which provided the 16 h photoperiod (72.2 kWh). The generation of plasma contributed less than 3% of the total energy consumed by the chambers (1 kWh for Treatment 1 and 3 kWh for Treatment 2). Therefore, plasma treatment could be a promising intervening step for sanitization of recirculated nutrient solutions in hydroponic systems without adding a significant burden of energy consumption
The volume of NS and PANS solutions in the reservoirs was 50 L each on day 1. Approximately 20 L remained in each reservoir on day 21, thus the nutrient solution consumed by each system was 30 L. The total amount of water absorbed by the plants in each chamber was approximately 2% of the consumed water (0.6 L) for control NS (NST1 and NST2), PANST1, and PANST2. Therefore, plasma treatment did not affect basil’s water uptake as observed by the water usage calculation. The amount of water that evaporated due to the lights or plant evapotranspiration metabolism was approximately 58% (29.4 L), hence the greatest factor in water usage by the hydroponic system was evaporation. In order to reduce the water lost by evaporation as well as to maintain a tighter control on the concentration of nutrients throughout the growth cycle, the flood tray could be covered by a moisture barrier such as a plastic sheet.

4. Conclusions

Sweet basil was irrigated with nutrient solution (NS) or PANS in closed chambers under two plasma treatments (PANST1, PANST2) administered throughout the hydroponic growth period. The environmental conditions were recorded and reported, but they were not controlled. The basil plants grown using PANST1 were significantly taller compared to controls NST1 and NST2: 9% and 12%, respectively. PANST1 had a significantly higher yield of 27% and 45% compared to NST1 and NST2, respectively, based on dry weight. Plants grown using PANS were significantly greener compared to the plants grown using NS based on a* values. Leaves from basil plants grown using PANST1 had significantly higher levels of linalool, suggesting a more floral aroma, and more methyl eugenol, suggesting they had spicier aroma. In this study, no impact on plant nutrition or phytotoxicity was observed due to PANS irrigation. It was confirmed that a single plasma treatment (PANST1) throughout the growth cycle of 3 weeks could significantly improve the yield, morphology, and quality of sweet basil plants. Moreover, multiple plasma treatments (PANST2) significantly aided in decreasing algae concentration in the hydroponic environment.

Supplementary Materials

The supporting information of micro and macronutrient analysis can be downloaded at: https://www.mdpi.com/article/10.3390/agriculture13020443/s1, Table S1: Macronutrient analysis of NST1 and PANST1 on day 1 and day 21; Table S2: Micronutrient analysis of NST1 and PANST1 on day 1 and day 21, Table S3: Macronutrient analysis of NST2 and PANST2 on days 1 to 21, Table S4: Micronutrient analysis of NST2 and PANST2 on days 1 to 21, Figure S1: Pictures of flooding trays for Treatment 1 (NST1-top and PANST1-bottom) and Treatment 2 (NST2-top and PANST2-bottom) after basil plants were removed on day 21.

Author Contributions

M.B.D.: investigation, visualization, data curation, writing—original draft. W.C.R.: visualization, formal analysis, software, methodology, writing—original draft. J.T.: supervision. D.S.: resources, methodology, supervision. J.E.S.: resources, methodology. D.A.S.: conceptualization, funding acquisition, supervision, writing—review and editing, project administration. M.V.K.: conceptualization, funding acquisition, supervision, writing—review and editing, project administration. All authors have read and agreed to the published version of the manuscript.

Funding

This work was supported by the United States Department of Agriculture’s (USDA) National Institute of Food and Agriculture (NIFA) (project no. 2018-67018-28146).

Institutional Review Board Statement

Not applicable.

Data Availability Statement

Data will be made available upon reasonable request.

Acknowledgments

We thank Donald W. Schaffner, Lara Brindisi, and Ariane Vasitalis from Rutgers University; Ricardo Hernandez, and Cristian Collado from North Carolina State University; and Alexander Rabinovich from Drexel University, for their suggestions on experimental design, analysis of samples, and equipment design.

Conflicts of Interest

The authors declare no conflict of interest.

References

  1. Research and Markets Hydroponics Market by Type (Aggregate Systems, Liquid Systems), Crop Type (Vegetables, Fruits, Flowers), Equipment (HVAC, LED Grow Lights, Irrigation Systems, Material Handling Equipment, Control Systems), Input Type, and Region—Global Forecast to 2027 September 22, 2021. Available online: https://www.marketsandmarkets.com/Market-Reports/hydroponic-market-94055021.html (accessed on 27 May 2021).
  2. Walters, K.J.; Currey, C.J. Hydroponic greenhouse basil (O. basilicum L.) production: Comparing systems and cultivars. Horttechnology 2015, 25, 645–650. [Google Scholar] [CrossRef]
  3. Resh, H.M. Hydroponic Food Production. A Definitive Guidebook of Soilless Food-growing Methods, 5th ed.; CRC Press: Boca Raton, FL, USA, 1995. [Google Scholar] [CrossRef]
  4. Zhou, R.; Zhou, R.; Zhang, X.; Zhuang, J.; Yang, S.; Bazaka, K.; Ostrikov, K. Effects of Atmospheric-pressure N2, He, Air, and O2 Microplasmas on Mung Bean Seed 41 Germination and Seedling Growth. Sci. Rep. 2016, 6, 32603. [Google Scholar] [CrossRef]
  5. Bafoil, M.; Jemmat, A.; Martinez, Y.; Merbahi, N.; Eichwald, O.; Dunand, C.; Yousfi, M. Effects of low temperature plasmas and plasma activated waters on Arabidopsis thaliana germination and growth. PLoS ONE 2018, 13, e0195512. [Google Scholar] [CrossRef] [PubMed]
  6. Brar, J.; Jiang, J.; Oubarri, A.; Ranieri, P.; Fridman, A.A.; Fridman, G.; Miller, V.; Peethambaran, B. Non-thermal Plasma Treatment of Flowing Water: A Solution to Reduce Water Usage and Soil Treatment Cost without Compromising Yield. Plasma Med. 2016, 6, 413–427. [Google Scholar] [CrossRef]
  7. Kawano, H.; Takamatsu, T.; Matsumura, Y.; Miyahara, H.; Iwasawa, A.; Azuma, T.; Okino, A. Measurement of reactive species in various gas plasma bubbled-up water for hydroponic culture. In Proceedings of the 1st International Workshop on Plasma Agriculture, Candem, NJ, USA, 15–20 May 2016; Available online: https://docplayer.net/61424133-Plasma-induced-multigeneration-effects-on-plant-growth-and-crop-yield.html (accessed on 27 May 2021).
  8. Park, D.P.; Davis, K.; Gilani, S.; Alonzo, C.-A.; Dobrynin, D.; Friedman, G.; Fridman, A.; Rabinovich, A.; Fridman, G. Reactive nitrogen species produced in water by non-equilibrium plasma increase plant growth rate and nutritional yield. Curr. Appl. Phys. 2013, 13, S19–S29. [Google Scholar] [CrossRef]
  9. Kim, H.-J.; Nam, G.-S.; Jang, J.-S.; Won, C.-H.; Kim, H.-W. Cold Plasma Treatment for Efficient Control over Algal Bloom Products in Surface Water. Water 2019, 11, 1513. [Google Scholar] [CrossRef]
  10. Gnapowski, S.; Akiyama, H.; Sakugawa, T.; Akiyama, T.M. Algae treatment effects by pulse power discharge in the water. In Proceedings of the 2012 Abstracts IEEE International Conference on Plasma Science, Edinburgh, UK, 8–13 July 2012; p. 1P-111. [Google Scholar] [CrossRef]
  11. Mizukoshi, Y.; Matsuda, Y.; Yamanaka, S.; Ikeno, T.; Haraguchi, K.; Goda, N.; Nishimura, Y.; Yamamoto, K. Deactivation of Algae by Plasma Generated in Seawater Flow. Chem. Lett. 2018, 47, 116–118. [Google Scholar] [CrossRef]
  12. Dou, H.; Niu, G.; Gu, M.; Masabni, J.G. Responses of sweet basil (O. basilicum L.) to different light integrals in photosynthesis, morphology, yield, and nutritional quality. Hortscience 2018, 53, 496–503. [Google Scholar] [CrossRef]
  13. Lewis, A.J.; Joyce, T.; Hadaya, M.; Ebrahimi, F.; Dragiev, I.; Giardetti, N.; Yang, J.; Fridman, G.; Rabinovich, A.; Fridman, A.A.; et al. Rapid degradation of PFAS in aqueous solutions by reverse vortex flow gliding arc plasma. Environ. Sci. Water Res. Technol. 2020, 6, 1044–1057. [Google Scholar] [CrossRef]
  14. Thirumdas, R.; Kothakota, A.; Annapure, U.; Siliveru, K.; Blundell, R.; Gatt, R.; Valdramidis, V.P. Plasma activated water (PAW): Chemistry, physico-chemical properties, applications in food and agriculture. Trends Food Sci. Technol. 2018, 77, 21–31. [Google Scholar] [CrossRef]
  15. Judée, F.; Simon, S.; Bailly, C.; Dufour, T. Plasma-activation of tap water using DBD for agronomy applications: Identification and quantification of long lifetime chemical species and production/consumption mechanisms. Water Res. 2018, 133, 47–59. [Google Scholar] [CrossRef] [PubMed]
  16. Naïtali, M.; Kamgang-Youbi, G.; Herry, J.-M.; Bellon-Fontaine, M.-N.; Brisset, J.-L. Combined Effects of Long-Living Chemical Species during Microbial Inactivation Using Atmospheric Plasma-Treated Water. Appl. Environ. Microbiol. 2010, 76, 7662–7664. [Google Scholar] [CrossRef] [PubMed]
  17. Oehmigen, K.; Hähnel, M.; Brandenburg, R.; Wilke, C.; Weltmann, K.-D.; von Woedtke, T. The Role of Acidification for Antimicrobial Activity of Atmospheric Pressure Plasma in Liquids. Plasma Process. Polym. 2010, 7, 250–257. [Google Scholar] [CrossRef]
  18. Plank, O. Plant Analysis Reference Procedures for the Southern Region of the United States; Southern Cooperative Series Bulletin 368; University of Georgia: Athens, GA, USA, 1992. [Google Scholar]
  19. Anderson, D.M.; Karlson, B. Appendix 4. Preservatives and methods for algal cell enumeration. In Harmful Algal Blooms (habs) and Desalination: A Guide to Impacts, Monitoring and Management; IOC Manuals and Guides No. 78; Anderson, D.M., Boerlage, S.F.E., Dixon, M.B., Eds.; Intergovernmental Oceanographic Commission of UNESCO: Paris, France, 2017; pp. 509–517. [Google Scholar] [CrossRef]
  20. Cochran, D.R.; Fulcher, A. Type and Rate of Plant Growth Regulator Influence Vegetative, Floral Growth, and Quality of Little Lime™ Hydrangea. Horttechnology 2013, 23, 306–311. [Google Scholar] [CrossRef]
  21. Gutiérrez-Rodríguez, E.; Lieth, H.J.; Jernstedt, J.A.; Labavitch, J.M.; Suslow, T.V.; Cantwell, M.I. Texture, composition and anatomy of spinach leaves in relation to nitrogen fertilization. J. Sci. Food Agric. 2012, 93, 227–237. [Google Scholar] [CrossRef]
  22. Ugural, C. Plates and Shells: Theory and Analysis; CRC Press: Boca Raton, FL, USA, 2017. [Google Scholar]
  23. Deschamps, C.; Simon, J.E. Terpenoid Essential Oil Metabolism in Basil (Ocimum basilicum L.) Following Elicitation. J. Essent. Oil Res. 2006, 18, 618–621. [Google Scholar] [CrossRef]
  24. Jennings, W.; Shibamoto, T. Qualitative Analysis of Flavor and Fragrance Volatiles by Glass Capillary Gas Chromatography; Food/Nahrung; Academic Press: New York, NY, USA, 1980. [Google Scholar] [CrossRef]
  25. Takahashi, K.; Saito, Y.; Oikawa, R.; Okumura, T.; Takaki, K.; Fujio, T. Development of automatically controlled corona plasma system for inactivation of pathogen in hydroponic cultivation medium of tomato. J. Electrost. 2018, 91, 61–69. [Google Scholar] [CrossRef]
  26. Lee, E.-J.; Khan, M.S.I.; Shim, J.; Kim, Y.-J. Roles of oxides of nitrogen on quality enhancement of soybean sprout during hydroponic production using plasma discharged water recycling technology. Sci. Rep. 2018, 8, 16872. [Google Scholar] [CrossRef]
  27. Sivachandiran, L.; Khacef, A. Enhanced seed germination and plant growth by atmospheric pressure cold air plasma: Combined effect of seed and water treatment. RSC Adv. 2017, 7, 1822–1832. [Google Scholar] [CrossRef]
  28. Lindsay, A.; Byrns, B.; King, W.; Andhvarapou, A.; Fields, J.; Knappe, D.; Fonteno, W.; Shannon, S. Fertilization of Radishes, Tomatoes, and Marigolds Using a Large-Volume Atmospheric Glow Discharge. Plasma Chem. Plasma Process. 2014, 34, 1271–1290. [Google Scholar] [CrossRef]
  29. Takano, K.; Takahata, J.; Takaki, K.; Satta, N.; Takahashi, K.; Fujio, T. Improvement of Growth Rate of Brassica para var. perviridis by Discharge inside Bubble under Water in Hydroponic Cultivation. Electron. Commun. Jpn. 2016, 99, 467–472. [Google Scholar] [CrossRef]
  30. Ranieri, P.; Sponsel, N.; Kizer, J.; Rojas-Pierce, M.; Hernández, R.; Gatiboni, L.; Grunden, A.; Stapelmann, K. Plasma agriculture: Review from the perspective of the plant and its ecosystem. Plasma Process. Polym. 2020, 18, e2000162. [Google Scholar] [CrossRef]
  31. Kocsy, G.; Tari, I.; Vanková, R.; Zechmann, B.; Gulyás, Z.; Poór, P.; Galiba, G. Redox control of plant growth and development. Plant Sci. 2013, 211, 77–91. [Google Scholar] [CrossRef]
  32. Zhou, Y.-H.; Zhang, Y.-L.; Wang, X.-M.; Cui, J.-X.; Xia, X.-J.; Shi, K.; Yu, J.-Q. Effects of nitrogen form on growth, CO2 assimilation, chlorophyll fluorescence, and photosynthetic electron allocation in cucumber and rice plants. J. Zhejiang Univ. B 2011, 12, 126–134. [Google Scholar] [CrossRef]
  33. Kiferle, C.; Maggini, R.; Pardossi, A. Influence of nitrogen nutrition on growth and accumulation of rosmarinic acid in sweet basil (Ocimum basilicum L.) grown in hydroponic culture. Aus. J. Crop Sci. 2013, 7, 321–327. [Google Scholar]
  34. Cantwell, M.; Reid, M. Herbs (Fresh Culinary); Recommendations for Maintaining Postharvest Quality. Perishables Handling #15; University of California, Division of Agriculture and Natural Resources, UC Postharvest Technology Center: Berkeley, CA, USA, 2001; Available online: https://postharvest.ucdavis.edu/Commodity_Resources/Fact_Sheets/Datastores/Vegetables_English/?uid=17&ds=799 (accessed on 27 May 2021).
  35. Patel, M.; Lee, R.; Merchant, E.V.; Juliani, H.R.; Simon, J.E.; Tepper, B.J. Descriptive aroma profiles of fresh sweet basil cultivars (Ocimum spp.): Relationship to volatile chemical composition. J. Food Sci. 2021, 86, 3228–3239. [Google Scholar] [CrossRef]
  36. Tangpao, T.; Chung, H.-H.; Sommano, S.R. Aromatic Profiles of Essential Oils from Five Commonly Used Thai Basils (O. basilicum). Foods 2018, 7, 175. [Google Scholar] [CrossRef] [PubMed] [Green Version]
  37. Adler, P.R.; Simon, J.E.; Wilcox, G.E. Nitrogen form alters sweet basil (O. basilicum L.) growth, and essential oil content and composition. HortScience 1989, 24, 789–790. [Google Scholar] [CrossRef]
  38. Deschamps, C.; Gang, D.; Dudareva, N.; Simon, J.E. Developmental regulation of phenylpropanoid biosynthesis in leaves and glandular trichomes of basil (Ocimum basilicum L.). Int. J. Plant Sci. 2006, 167, 447–454. [Google Scholar] [CrossRef]
  39. Morales, M.R.; Simon, J.E.; Charles, D.J. Comparison of Essential Oil Content and Composition Between Field and Greenhouse Grown Genotypes of Methyl Cinnanmate Basil (Ocimum basilicum L.). J. Herbs Spices Med. Plants 1992, 1, 25–30. [Google Scholar] [CrossRef]
  40. Simon, J.E.; Reiss-Bubenheim, D.; Joly, R.J.; Charles, D.J. Water stress-induced alterations in essential oil content and composition of sweet basil (O. basilicum L.). J. Essential Oil Res. 1992, 4, 71–75. [Google Scholar] [CrossRef]
  41. Saha, S.; Monroe, A.; Day, M.R. Growth, yield, plant quality and nutrition of basil (Ocimum basilicum L.) under soilless agricultural systems. Ann. Agric. Sci. 2016, 61, 181–186. [Google Scholar] [CrossRef]
  42. Ličina, V.; Jelačić, S.; Beatović, D.V.; Antić-Mladenović, S.B. Mineral composition of different basil (Ocimum spp.) genotypes. Chem. Ind. 2014, 68, 501–510. [Google Scholar] [CrossRef]
  43. Nurzyńska-Wierdak, R.; Jarosz, Z.; Dzida, K.; Rożek, E.; Borowski, B. Changes in the content of some macronutrients in basil herbage induced by different nitrogen and potassium fertilization rates. J. Elem. 2012, 17, 465–477. [Google Scholar] [CrossRef]
  44. Bryson, G.M.; Mills, H.A.; Sasseville, D.N.; Jones, J.B., Jr.; Barker, A.V. Plant Analysis Handbook III: A Guide to Sampling, Preparation, Analysis, and Interpretation for Agronomic and Horticultural Crops; Micro-Macro Publishing Inc.: Athens, GA, USA, 2014. [Google Scholar] [CrossRef]
Figure 1. 
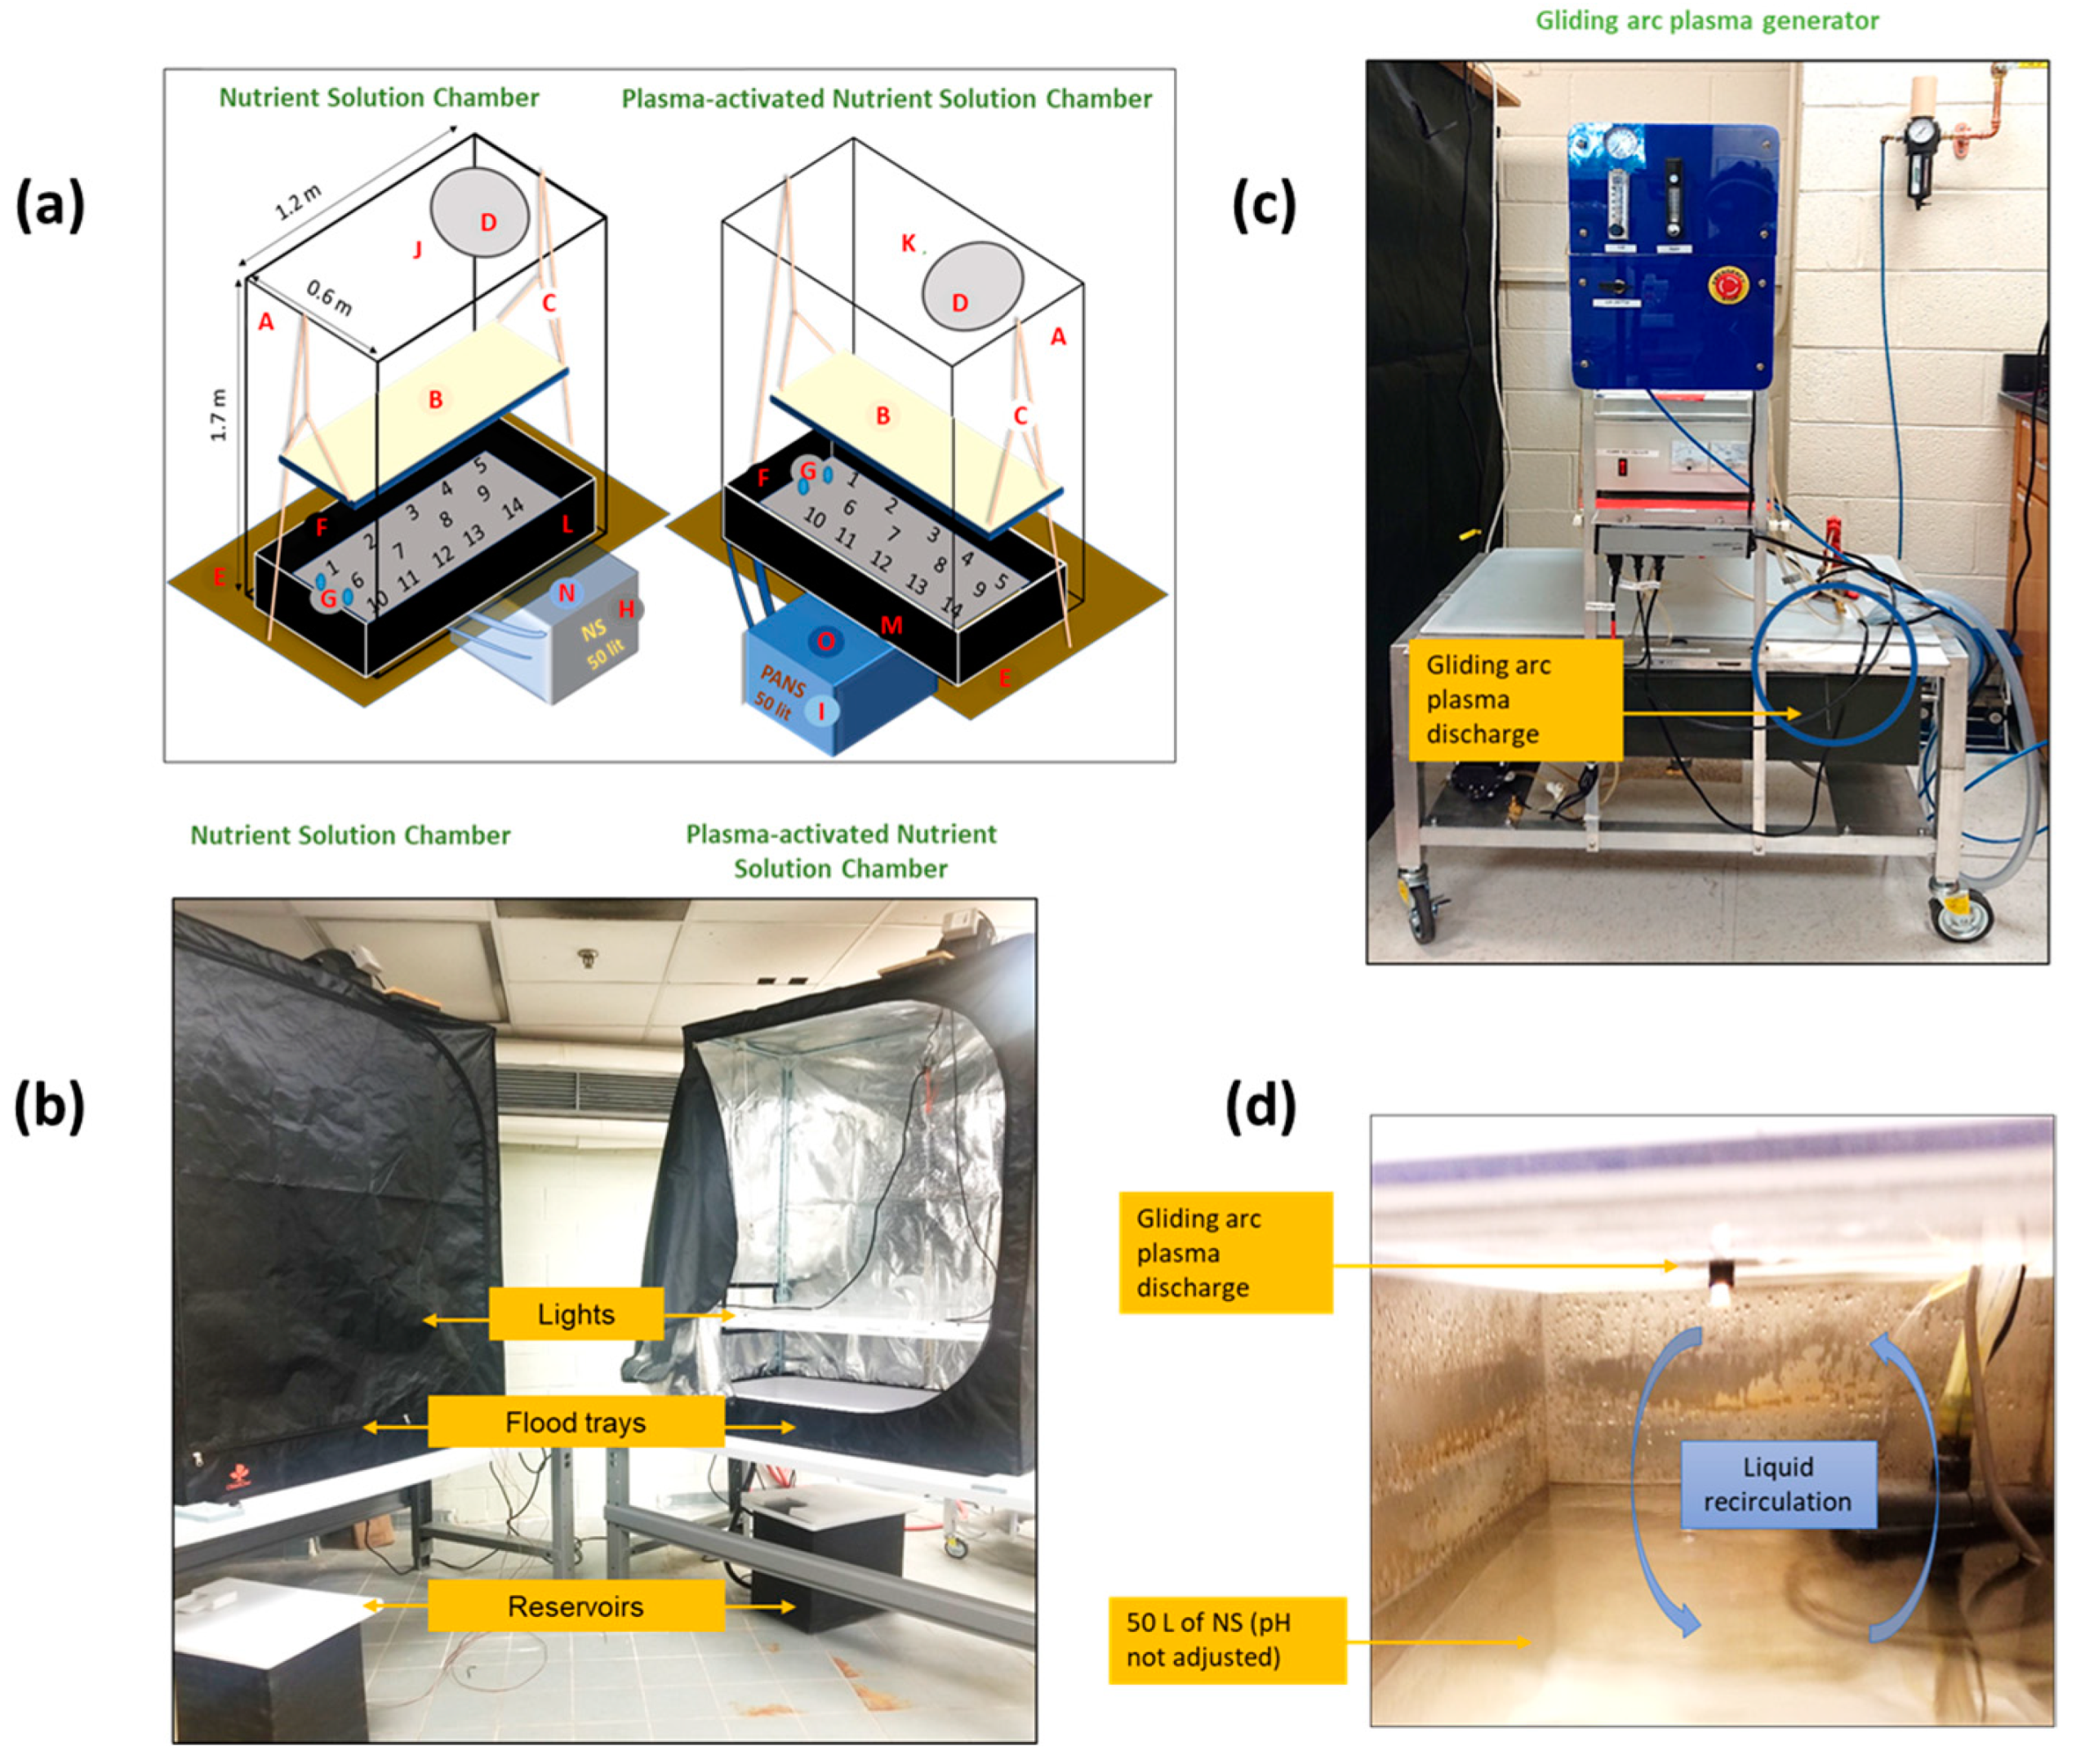
Experimental setup: (a) Diagram of growth chambers where A—enclosed chambers; B—white fluorescent lights; C—adjustable ropes for lights; D—fans; E—tables for chambers; F—flood tray showing placements of 14 basil plants; G—inlet and outlet pipes from the reservoir to the flood tray; H—NS reservoir; I—PANS reservoir; J, K—CO2 sensors; L, M—temperature and relative humidity sensors; N, O—temperature sensors. (b) Picture of enclosed chambers. (c) Picture of the gliding arc plasma generator. (d) Schematic of plasma treatment of NS by gliding arc plasma discharge inside the equipment.
Agriculture 13 00443 g001
Figure 2. Schematic representation of experimental treatments based on the irrigation of PANS, where PANST1 indicates irrigation of basil seedlings with the same PANS throughout the complete growth cycle (Treatment 1), and PANST2 indicates irrigation of basil seedlings with newly prepared PANS at the beginning of each week (Treatment 2).
Agriculture 13 00443 g002
Figure 3. Schematic of the apparatus for puncture test and calculation of elasticity of basil leaves, where ω is the maximum deflection at the center, ν is the Poisson’s ratio for a plant leaf, po is pressure the applied by the probe, c is the radius of the probe, E is the Young’s modulus, t is the thickness of the leaf, a is the radius of the leaf area exposed.
Agriculture 13 00443 g003
Figure 4. pH, EC, and ORP monitoring over 21 days of Treatment 1 (NST1 and PANST1) and Treatment 2 (NST2 and PANST2) testing basil plant growth, showing (a) pH of NST1 and PANST1 for Treatment 1 (pH adjustment to approximately 5.8 on days 4, 7, 11, 15, and 19), (b) EC of NST1 and PANST1 for Treatment 1, (c) oxidation-reduction potential (ORP) over the harvest period of 21 days of NST1 and PANST1, (d) pH of NST2 and PANST2 for Treatment 2 over (pH adjustment to approximately 5.8 on days 4, 7, 11, 15, 18, and 20), (e) EC of NST2 and PANST2 for Treatment 2, and (f) ORP over the harvest period of 21 days of NST2 and PANST2. Note: Data points are presented as averages (n = 9) with error bars indicating standard deviation. Data not sharing the same letters in (c,f) are significantly different from each other at the p < 0.05 level.
Agriculture 13 00443 g004
Figure 5. Algae analysis of Treatment 1 (NST1 and PANST1) and Treatment 2 (NST2 and PANST2) at the end of every week. Note: Error bars indicate standard deviation. Data not sharing the same letters on the specific week sampled are significantly different from each other (Steel–Dwass test, p < 0.05). The algae counts were compared on the same week, such that the subscript of each letter indicates the week for which the comparison was made (i.e., on week one NST1, PANST1, NST2, and PANST2 were compared as all-pairs by Steel–Dwass method only for week 1), and they were not compared across multiple weeks.
Agriculture 13 00443 g005
Figure 6. 
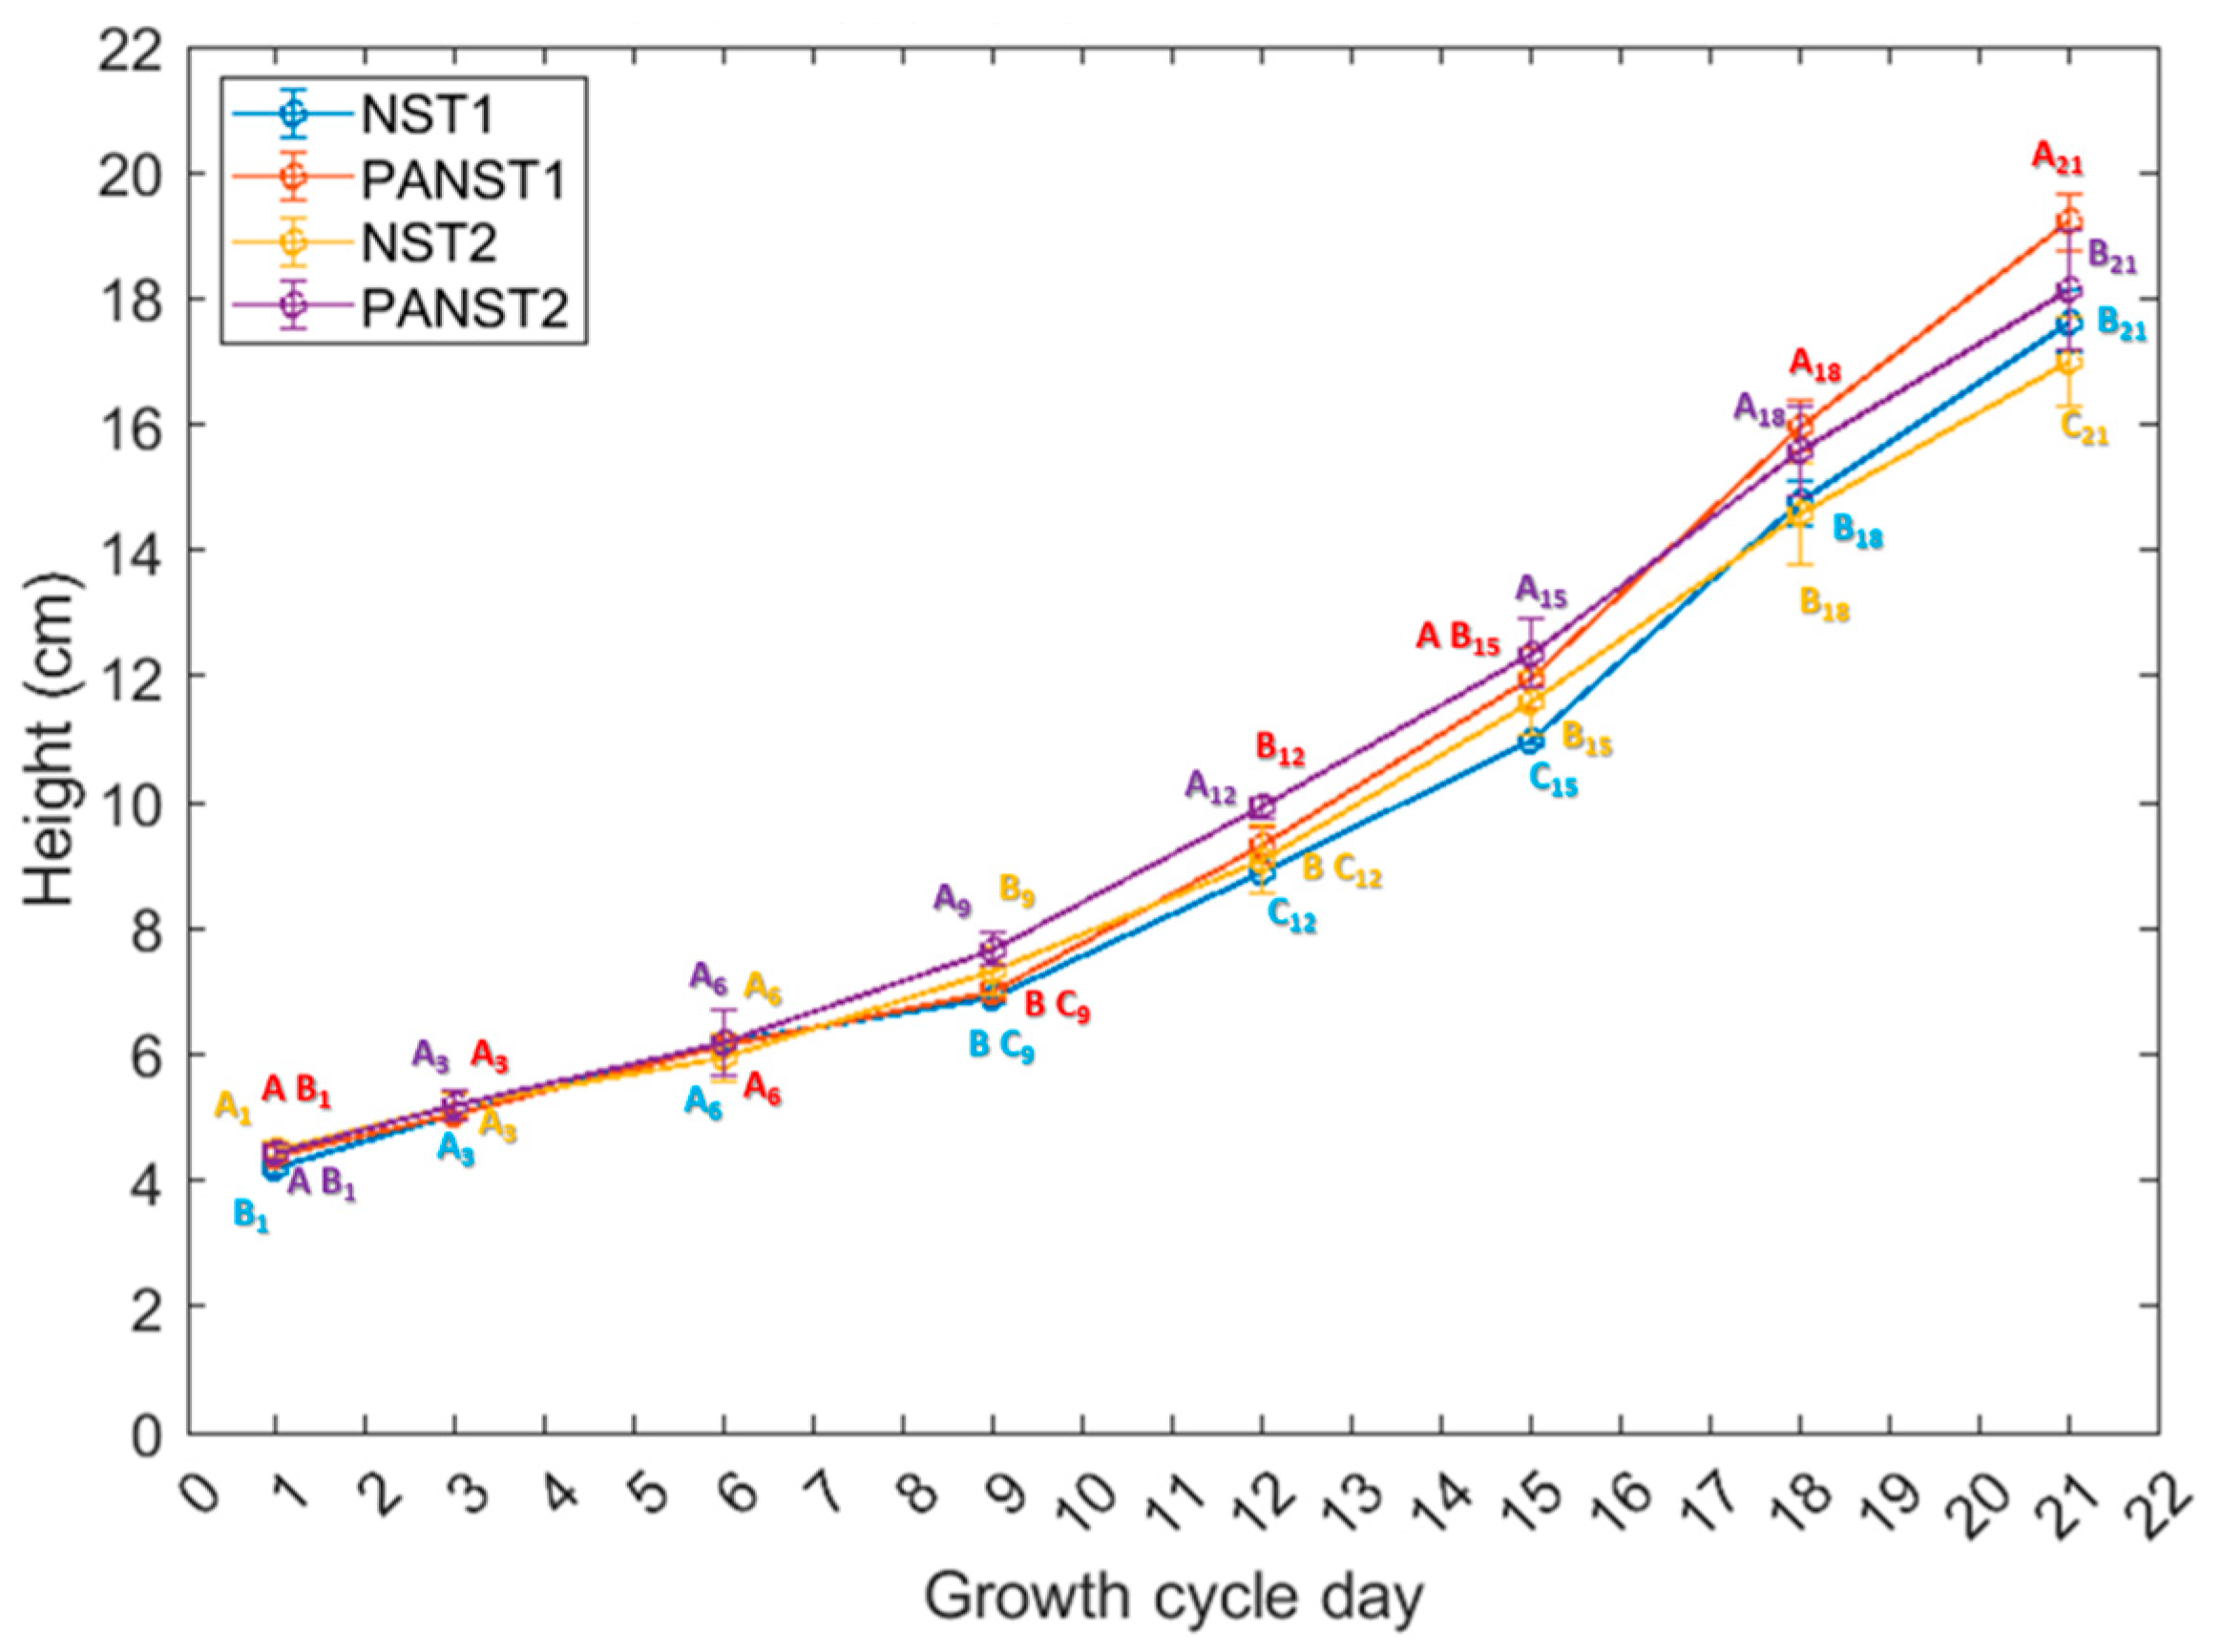
Plant height analysis of control (NST1 and NST2) and two plasma treatments (PANST1 and PANST2) over 21 days. Note: Error bars indicate standard deviation. Data not sharing the same letters on the specific growth cycle day are significantly different from each other (Steel–Dwass test, p < 0.05). The height of sweet basil plants was compared on the same growth cycle day, such that the subscript of each letter indicates the growth cycle day for which the comparison was made (i.e., on day one NST1, PANST1, NST2, and PANST2 were compared as all-pairs by Steel–Dwass method only for day 1), and they were not compared across multiple growth cycle days.
Agriculture 13 00443 g006
Figure 7. Colorimetric analysis of sweet basil leaves grown in Treatment 1 (NST1 and PANST1) and Treatment 2 (NST2 and PANST2). Note: Error bars indicate standard deviation. Data not sharing the same upper case letters for the specific color value (L*, a* or b*) are significantly different from each other (Steel–Dwass test, p < 0.05).
Agriculture 13 00443 g007
Table 1. Macronutrient concentrations of NS and PANS on day 1.
Macro-NutrientTotal N (ppm)NH4-N (ppm)NO3-N (ppm)P (ppm)K (ppm)Ca (ppm)Mg (ppm)S (ppm)
Optimum value150–200--502001508060
NS159 ± 29.4 ± 0.01149.5 ± 1.549.1 ± 12.5176 ± 38142 ± 1749.6 ± 4.977.4 ± 7.8
PANS170.5 ± 2.59.9 ± 0.07160.5 ± 2.544.7 ± 6.8191 ± 43147.5 ± 21.551 ± 3.678.8 ± 7
MicronutrientMn (ppm)Zn (ppm)Cu (ppm)B (ppm)Na (ppm)Cl (ppm)Fe (ppm)
Optimum value0.80.30.20.7--2.8
NST0.38 ± 0.030.15 ± 0.010.17 ± 0.010.46 ± 0.0426.3 ± 2.828.2 ± 14.82.4 ± 0.2
PANST0.4 ± 0.030.2 ± 0.030.2 ± 0.040.4 ± 0.0426.4 ± 2.628.6 ± 2.62.5 ± 0.2
Table 2. Nitrate–nitrogen (NO3-N) and nitrite–nitrogen (NO2-N) concentration on day 1 for Treatment 1 for nutrient solution (NST1) and plasma-activated nutrient solution (PANST1), and for Treatment 2 for nutrient solution (NST2) and plasma-activated nutrient solution (PANST2) measured weekly (days 1, 8, and 15 of growth cycle). Note: Data points are presented as averages (n = 9) with error bars indicating standard deviation.
TreatmentReservoirDayReactive Nitrogen Species
NO3-N (ppm)NO2-N (ppm)
1NST11151.9 ± 3.39.6 ± 1.6
1PANST11191.9 ± 3.118.8 ± 1.9
2NST21151 ± 1.29.04 ± 1.2
2PANST21189.8 ± 1.718.6 ± 0.9
2NST28153.1 ± 2.49.1 ± 0.8
2PANST28191.6 ± 1.618.7 ± 1.1
2NST215152.2 ± 1.38.7 ± 1.2
2PANST215192.2 ± 1.518.4 ± 0.8
Table 3. Basil plants’ growth parameters in terms of fresh and dry weight, moisture, number of branches and nodes, root length, leaf length, leaf width, and leaf index (LI) by Treatment 1 or Treatment 2. Note: Any two means within a row not sharing the same letter are significantly different from each other (Steel–Dwass test for fresh weight, number of branches, root length, and number of nodes; all other parameters were analyzed with Tukey’s HSD test, p < 0.05).
ParametersTreatment 1Treatment 2
NST1PANST1NST2PANST2
Fresh weight (g)35.0 ± 1.1 c40.4 ± 1.4 a31.2 ± 3.5 b37.7 ± 2.4 a,c
Dry weight (g)3.0 ± 0.3 b,c3.8 ± 0.3 a2.6 ± 0.4 c3.4 ± 0.4 a,b
Moisture (%)91.5 ± 0.7 a90.5 ± 0.8 a91.5 ± 0.8 a90.8 ± 0.8 a
Number of branches9.4 ± 1.1 a9.2 ± 1.2 a8.1 ± 0.7 b8.7 ± 0.4 a,b
Number of nodes3.5 ± 0.4 a3.6 ± 0.4 a3.1 ± 0.2 a3.2 ± 0.2 a
Root length (mm)15.2 ± 0.8 a13.6 ± 0.7 b15.4 ± 0.9 a13.9 ± 0.9 b
Length (mm)9.5 ± 0.8 a10.0 ± 0.7 a9.3 ± 0.9 a10.0 ± 0.7 a
Width (mm)7.3 ± 0.9 b7.6 ± 0.8 b7.9 ± 0.6 a,b8.3 ± 0.5 a
Table 4. Peak rupture force, leaf toughness, and Young’s modulus of basil leaves on day 21 grown in Treatment 1 (NST1 and PANST1) and Treatment 2 (NST2 and PANST2). Note: Any two means within a row not sharing the same letter are significantly different from each other (Steel–Dwass test, p < 0.05).
ParameterTreatment 1Treatment 2
NST1PANST1NST2PANST2
Peak rupture force (N)0.8 ± 0.1 a0.8 ± 0.2 a0.8 ± 0.3 a0.8 ± 0.2 a
Toughness (N.mm)0.6 ± 0.2 a0.6 ± 0.3 a0.6 ± 0.3 a0.6 ± 0.2 a
Young’s modulus (N/mm2)(3.9 ± 8.7) × 109 a(4 ± 0.8) × 109 a(5.7 ± 1.0) × 109 a(3.9 ± 0.8) × 109 a
Table 5. Relative peak area of selected essential oils commonly present in basil leaves’ aroma profile, measured on basil leaves on day 21 for Treatment 1 (NST1 and PANST1) and Treatment 2 (NST2 and PANST2). Note: Any two means within a row not sharing the same letter are significantly different from each other (Steel–Dwass test, p < 0.05).
Aroma CompoundTreatment 1Treatment 2
NST1PANST1NST2PANST2
Eucalyptol (%)10.7 ± 4.00 a10.7 ± 2.01 a9.4 ± 2.3 a8.8 ± 0.9 a
Eugenol (%)0.4 ± 0.3 a0.6 ± 0.3 a0.1 ± 0.1 a0.1 ± 0.03 a
Linalool (%)55.5 ± 6.9 c67.7 ± 3.5 b78.5 ± 4.03 a80.01 ± 2.5 a
Methyl eugenol (%)0.8 ± 0.5 a,b1.2 ± 0.6 a0.5 ± 0.1 b0.8 ± 0.3 a,b
Table 6. Concentration of nutrients necessary for plant growth, measured on basil leaves on day 21 for Treatment 1 (NST1 and PANST1) and Treatment 2 (NST2 and PANST2).
NutrientSufficiency RangeTreatment 1Treatment 2
NST1PANST1NST2PANST2
N (%)4–66.2 ± 0.26.4 ± 0.15.9 ± 0.56 ± 0.2
P (%)0.62–10.8 ± 0.10.80.6 ± 0.040.6 ± 0.02
K (%)1.55–2.056.8 ± 0.046.6 ± 0.25.8 ± 0.35.7 ± 0.3
Ca (%)1.25–22.5 ± 0.072.5 ± 0.12.5 ± 0.042.4 ± 0.1
Mg (%)0.6–10.5 ± 0.020.5 ± 0.020.5 ± 0.020.5 ± 0.03
S (%)0.2–0.60.4 ± 0.040.5 ± 0.020.4 ± 0.020.4 ± 0.04
Mn (ppm)30–15038 ± 7.636.9 ± 5.843.4 ± 0.839.4 ± 3.1
Zn (ppm)30–7039 ± 5.038.8 ± 0.337.4 ± 1036.3 ± 14.2
Cu (ppm)5–1011.6 ± 1.512.8 ± 0.810.9 ± 211.6 ± 3.2
B (ppm)25–6048.1 ± 1.354.3 ± 5.540.8 ± 641.5 ± 3.2
Fe (ppm)75–200109.5 ± 8.557.7 ± 56.2101.9 ± 6.695.4 ± 6.7
Table 7. Total energy consumption during the 21 day growth period.
Treatment 1Treatment 2
EquipmentTime (h)Energy (kWh)Time (h)Energy (kWh)
Lights33672.233672.2
Plasma generator2.116.33
Pump22.41.222.41.2
Fan5040.55040.5
Total energy consumption74.976.9
Disclaimer/Publisher’s Note: The statements, opinions and data contained in all publications are solely those of the individual author(s) and contributor(s) and not of MDPI and/or the editor(s). MDPI and/or the editor(s) disclaim responsibility for any injury to people or property resulting from any ideas, methods, instructions or products referred to in the content.

